south africa’s component manufacturing landscape: challenging the past to improve the future
DESCRIPTION
South Africa’s Component Manufacturing Landscape: Challenging the Past to improve the future. Dr Johan van Zyl President : NAAMSA CEO Africa Region: Toyota SA Motors 2014-10-14. What we Know ……. World Leader in fiscal policies and fiscal compliance. - PowerPoint PPT PresentationTRANSCRIPT

South Africa’s Component Manufacturing Landscape:
Challenging the Past to improve the future.
Dr Johan van ZylPresident : NAAMSA
CEO Africa Region: Toyota SA Motors2014-10-14

World Leader in fiscal policies and fiscal compliance
What we Know …….
Fundamental requirements for economic growth
Source: www.tradingeconomics.com
Labour Cost is Worst of BRICS

Find our Competitive Advantage

Weakness
Build to print industry Assembler culture Limited skills and resources Low local content (value added) International not competitive
Strength
Wide supplier base to the 7 OEM‘s Availablity of basic raw materials International certification of
management systems Strong automotive assembly
experience
Threat
Political situation High crime level Free capacities in Asia and
Europe Monopoly situation of suppliers Price increases
Opportunities
Export of single components Local OEM‘s to use common
suppliers Localisation of current CKD parts Currency development APDP / BBBEE IPAP Initiative to support supplier
Strength lies within…. SWOT Analysis
Availability of basic
Raw Materials
Mineral Resources is Key

ExportDestinations:
China, Europe
12th of 38 countries
Lead
1 2 3 4 5 6 7 8 9 1011121314151617181920212223242526272829303132333435363738
Why……..Our Resources
LCR = 98%Example – LA
Batteries CIM<1
ExportDestinations:
China, Europe, Japan, Asia-Pacific, Middle East, South
Korea
Iron
6th Largest of 50
LCR = 35%
ExportDestinations:
China1 2 3 4 57 8 9
13 1416 15
1921 22 23
27 28
33 34
41 42 43
9th of 43 countries
Aluminium
ExportDestinations:
China, Europe
20th of 45 countries
Copper
1 24 5
79 8
1214 15
1820
22 2325
27
34 35 36
4345
LCR = 58% LCR = 41%
Resin Compounding
Coal Synthetic Fuel
6th of 33 countriesLCR = 4%
Beneficiation = Biggest Opportunity
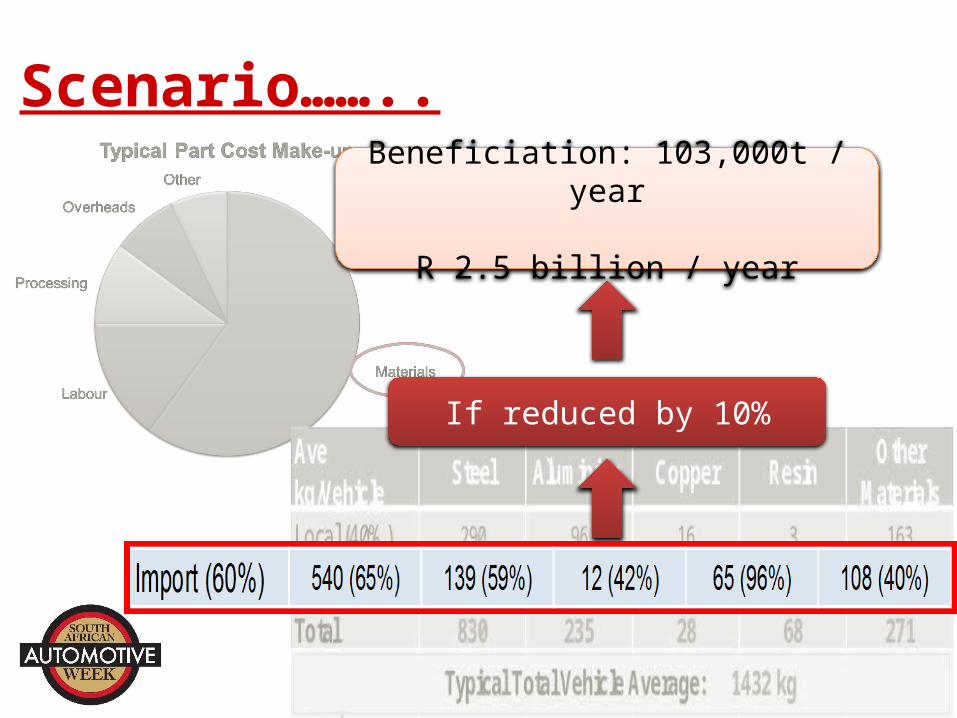
Scenario……..
Ave kg/Vehicle
Steel Aluminium Copper ResinOther
MaterialsLocal (40%) 290 96 16 3 163
Import (60%) 540 (65%) 139 (59%) 12 (42%) 65 (96%) 108 (40%)
Total 830 235 28 68 271Typical Vehicle Average
Main Commodities
Typical Total Vehicle Average: 1432 kg
If reduced by 10%
Beneficiation: 103,000t / year R 2.5 billion / year

7
Commodity Pricing• Why Import Parity?• Pay US$ for ZAR Cost base?• Beneficiation
Technology Support• Collaboration• Investment• Skills
Automotive Growth
Competitive Localisation
Items to Fix……..
Improved
Future

Thank You