south africa’s investment case what are the … · south africa’s investment case – what are...
TRANSCRIPT
South Africa’s Investment Case –
What are the country’s
“best buys” for HIV and TB?
Gesine Meyer-Rath1,2, Calvin Chiu1, Leigh Johnson3, Kathryn Schnippel4, Teresa
Guthrie5, Sarah Magni6, Yogan Pillay7, Fareed Abdullah8, Eva Kiwango9
on behalf of the Investment Case Task Team and Steering Committee
1 Health Economics and Epidemiology Research Office (HE2RO), University of the Witwatersrand/ Boston University2 Center for Global Health and Development, Department of International Health, Boston University3 Centre for Infectious Disease Epidemiology and Research (CIDER), University of Cape Town4 Right to Care5 Guthrie Consult6 Anansi Health Consulting7 National Department of Health8 South African National AIDS Council9 UNAIDS South Africa
Health Economics and Epidemiology Research Office
Wits Health Consortium University of the Witwatersrand
HE RO2
Contents
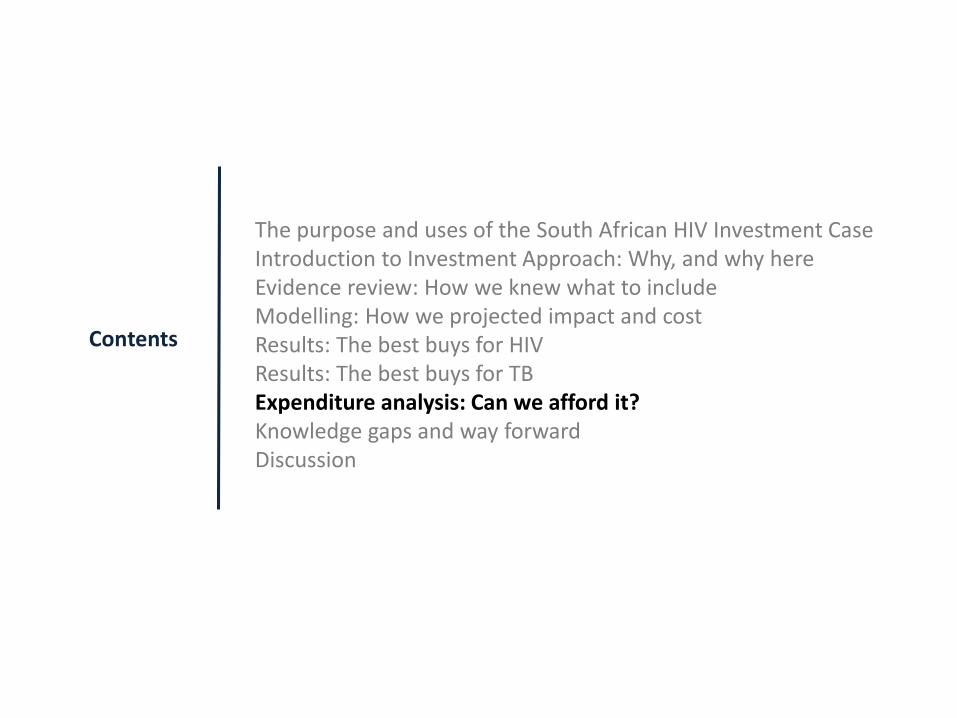
The purpose and uses of the South African HIV Investment CaseIntroduction to Investment Approach: Why, and why hereEvidence review: How we knew what to includeModelling: How we projected impact and cost Results: The best buys for HIVResults: The best buys for TBExpenditure analysis: Can we afford it?Knowledge gaps and way forwardDiscussion
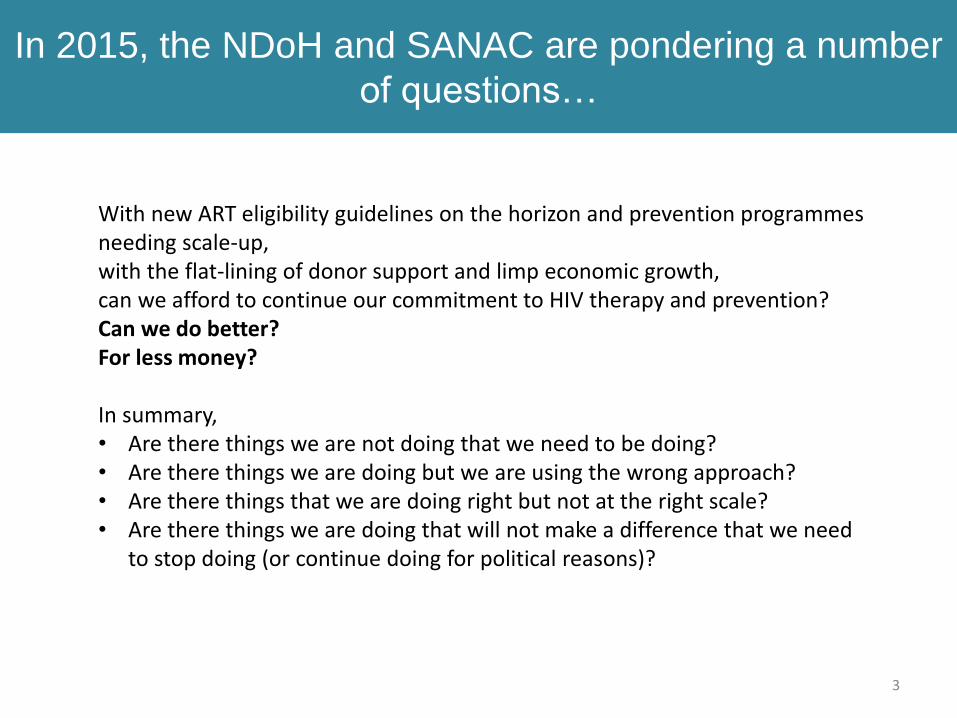
In 2015, the NDoH and SANAC are pondering a number
of questions…
3
With new ART eligibility guidelines on the horizon and prevention programmes needing scale-up,with the flat-lining of donor support and limp economic growth,can we afford to continue our commitment to HIV therapy and prevention?Can we do better?For less money?
In summary,• Are there things we are not doing that we need to be doing?• Are there things we are doing but we are using the wrong approach?• Are there things that we are doing right but not at the right scale?• Are there things we are doing that will not make a difference that we need
to stop doing (or continue doing for political reasons)?
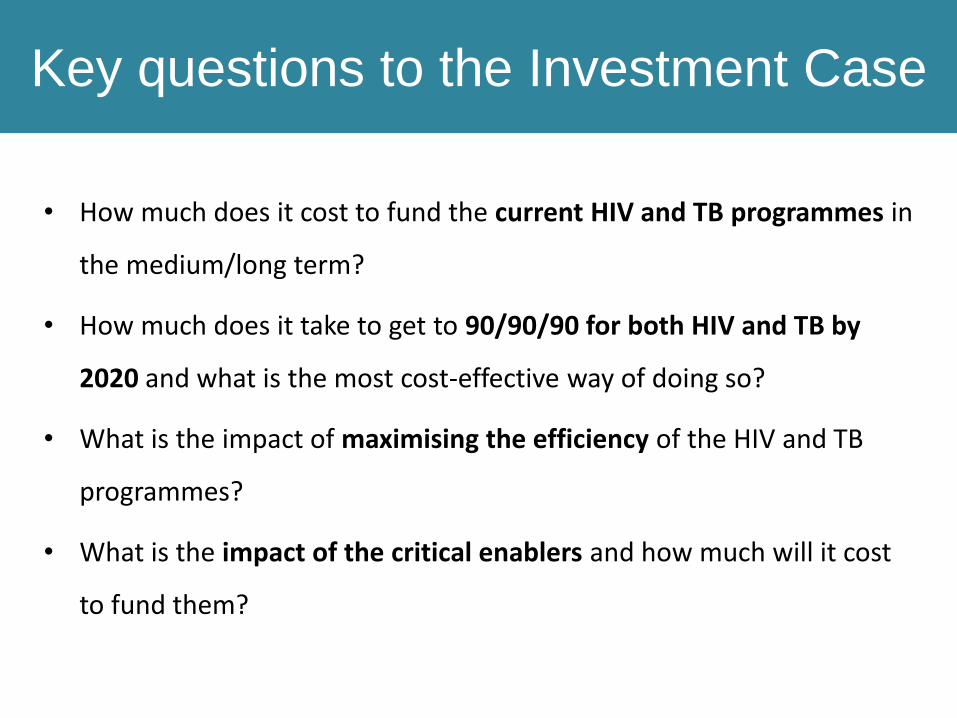
Key questions to the Investment Case
• How much does it cost to fund the current HIV and TB programmes in
the medium/long term?
• How much does it take to get to 90/90/90 for both HIV and TB by
2020 and what is the most cost-effective way of doing so?
• What is the impact of maximising the efficiency of the HIV and TB
programmes?
• What is the impact of the critical enablers and how much will it cost
to fund them?

The IC’s objective is to calculate the cost, impact and
cost-effectiveness of HIV and TB interventions
5
1
2
3
Baseline scenarioKeeps coverage of all interventions constant at 2014 levels
Government targets scenarioProjects the epidemic under the current government targets
OptimisationOptimisation routine scales up interventions in order of their cost effectiveness (cost per life year saved)
A) until current budget envelope is reachedB) until HIV 90/90/90 targets are reached
Impact and cost is being considered over 20 years (2015 to 2034), under 8 scenarios:
1 Baseline scenarioKeeps coverage of all interventions constant at 2014 levels
2 TB 90/90/90Announced by Minister Motsoaledi at the World Lung Conference in Barcelona, November 2014
• Screen 90% of vulnerable populations• Diagnose and treat 90% of TB cases• Treat 90% of cases successfully
HIV TB
4 Budget scenarioMaximises efficiency and feasibility
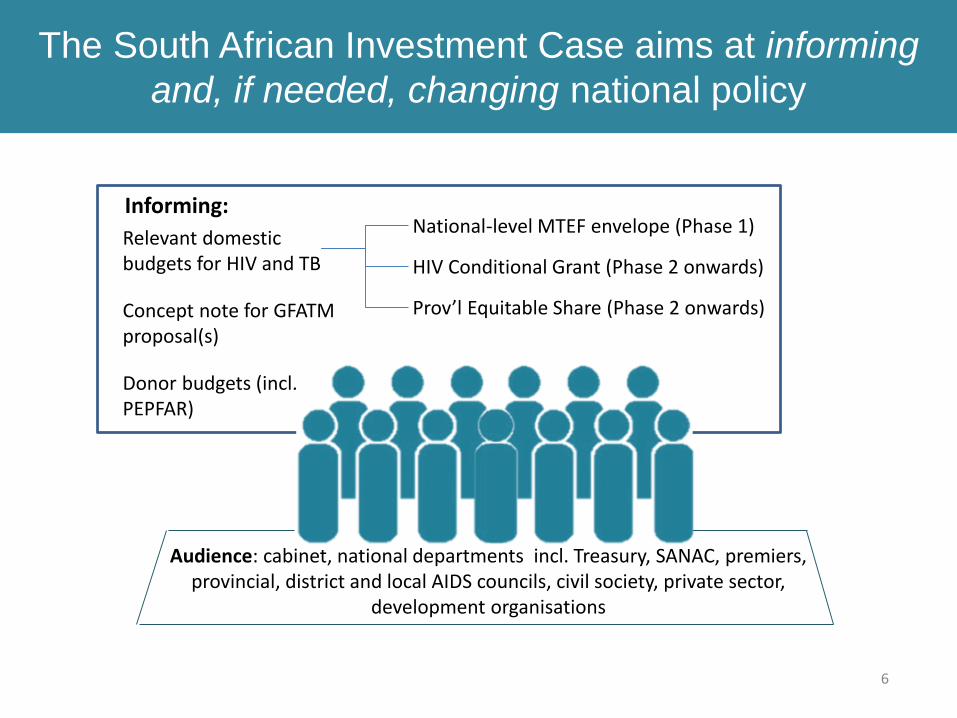
The South African Investment Case aims at informing
and, if needed, changing national policy
6
Relevant domestic budgets for HIV and TB
Informing:
Concept note for GFATM proposal(s)
Donor budgets (incl. PEPFAR)
Audience: cabinet, national departments incl. Treasury, SANAC, premiers, provincial, district and local AIDS councils, civil society, private sector,
development organisations
National-level MTEF envelope (Phase 1)
HIV Conditional Grant (Phase 2 onwards)
Prov’l Equitable Share (Phase 2 onwards)
Contents
The purpose and uses of the South African HIV Investment CaseIntroduction to Investment Approach: Why, and why hereEvidence review: How we knew what to includeModelling: How we projected impact and cost Results: The best buys for HIVResults: The best buys for TBExpenditure analysis: Can we afford it?Knowledge gaps and way forwardDiscussion
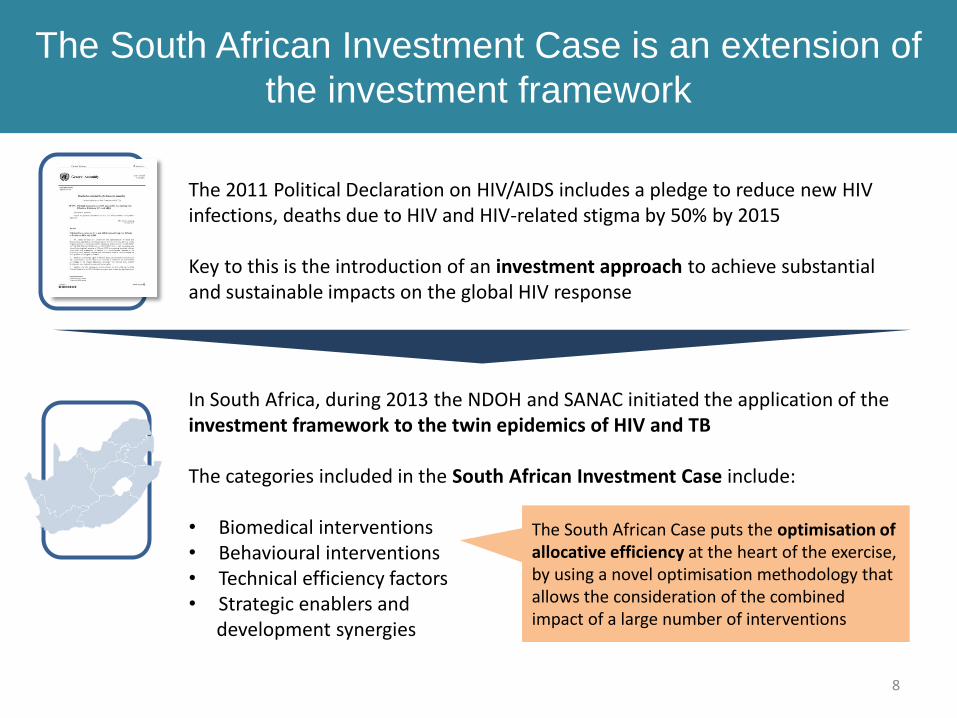
The South African Investment Case is an extension of
the investment framework
8
The 2011 Political Declaration on HIV/AIDS includes a pledge to reduce new HIV infections, deaths due to HIV and HIV-related stigma by 50% by 2015
Key to this is the introduction of an investment approach to achieve substantial and sustainable impacts on the global HIV response
In South Africa, during 2013 the NDOH and SANAC initiated the application of the investment framework to the twin epidemics of HIV and TB
The categories included in the South African Investment Case include:
• Biomedical interventions• Behavioural interventions• Technical efficiency factors• Strategic enablers and
development synergies
The South African Case puts the optimisation of allocative efficiency at the heart of the exercise, by using a novel optimisation methodology that allows the consideration of the combined impact of a large number of interventions
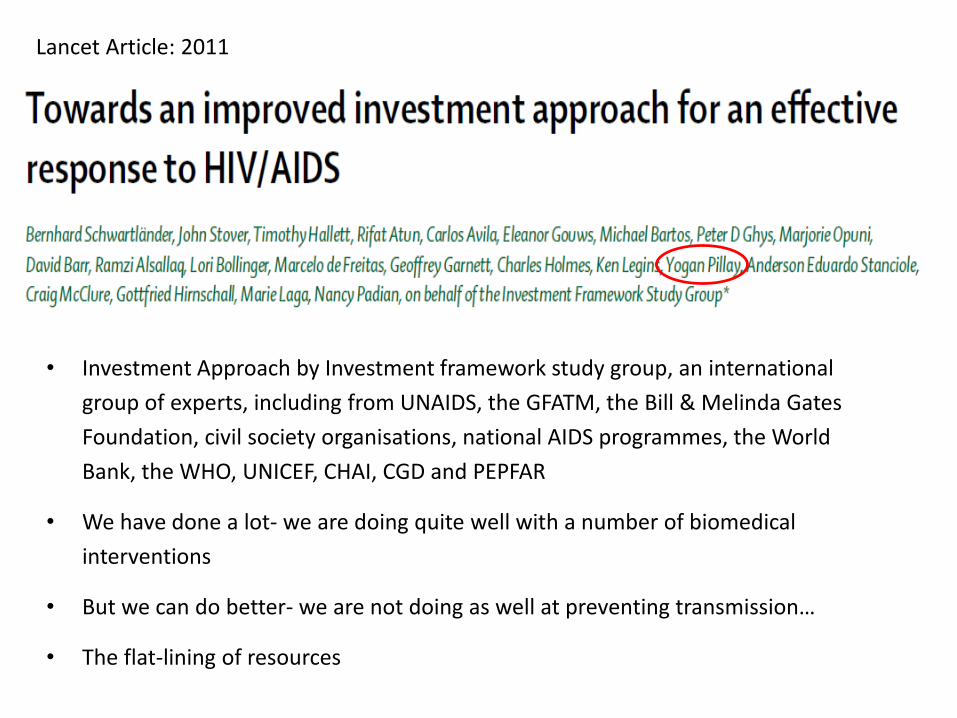
• Investment Approach by Investment framework study group, an international
group of experts, including from UNAIDS, the GFATM, the Bill & Melinda Gates
Foundation, civil society organisations, national AIDS programmes, the World
Bank, the WHO, UNICEF, CHAI, CGD and PEPFAR
• We have done a lot- we are doing quite well with a number of biomedical
interventions
• But we can do better- we are not doing as well at preventing transmission…
• The flat-lining of resources
Lancet Article: 2011
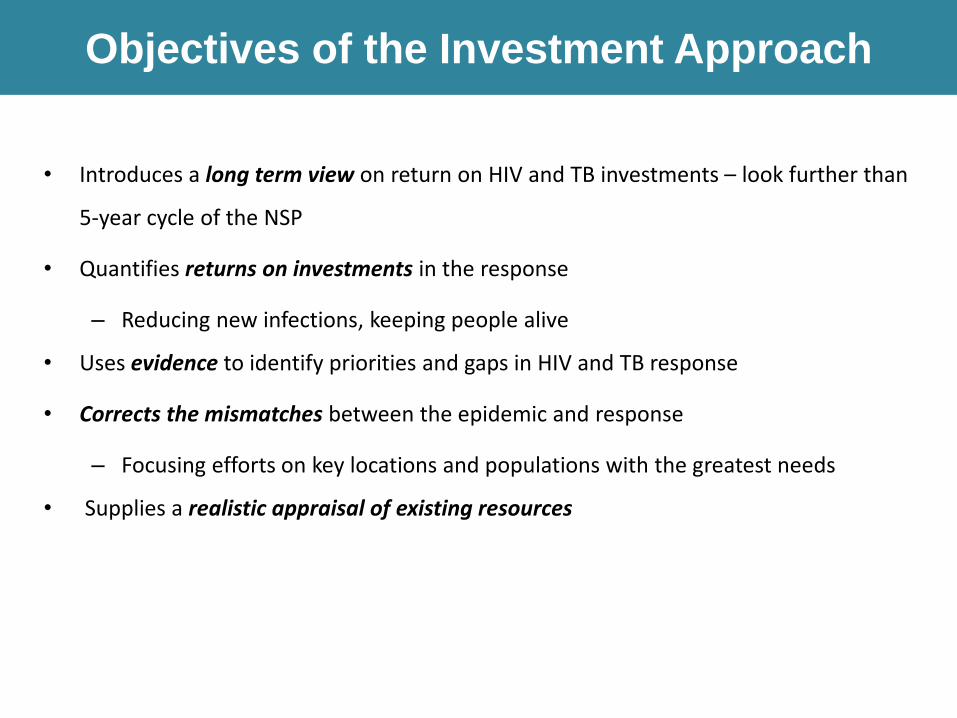
Objectives of the Investment Approach
• Introduces a long term view on return on HIV and TB investments – look further than
5-year cycle of the NSP
• Quantifies returns on investments in the response
– Reducing new infections, keeping people alive
• Uses evidence to identify priorities and gaps in HIV and TB response
• Corrects the mismatches between the epidemic and response
– Focusing efforts on key locations and populations with the greatest needs
• Supplies a realistic appraisal of existing resources
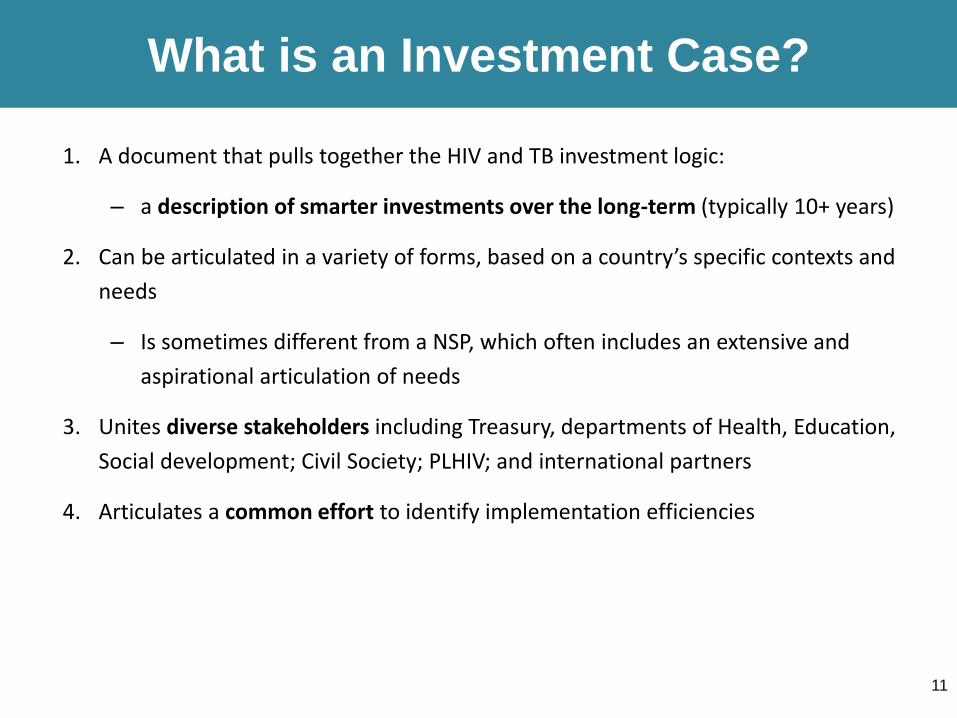
What is an Investment Case?
1. A document that pulls together the HIV and TB investment logic:
– a description of smarter investments over the long-term (typically 10+ years)
2. Can be articulated in a variety of forms, based on a country’s specific contexts and
needs
– Is sometimes different from a NSP, which often includes an extensive and
aspirational articulation of needs
3. Unites diverse stakeholders including Treasury, departments of Health, Education,
Social development; Civil Society; PLHIV; and international partners
4. Articulates a common effort to identify implementation efficiencies
11

UNAIDS Investment Framework
TE fa
3. SYNERGIES WITH DEVELOPMENT SECTORS
Social protection; Education; Legal Reform; Gender equality; Poverty reduction;
Gender-based violence; Health systems (incl. treatment of STIs, blood safety); Community systems; Employer practices.
2. CRITICAL
ENABLERS
Social enablers
• Political commitment &
advocacy
• Laws, policies &
practices
• Community mobilization
• Stigma reduction
• Mass media
• Local responses, to
change risk
environment
Programme enablers
• Community-centered
design & delivery
• Programme
communication
• Management & incentives
• Production & distribution
• Research & innovation
Care &
treatment
Male
circumcisionKeeping
people alive
1. BASIC PROGRAMME ACTIVITIES
Key
populations
PMTCT
Condoms
OBJECTIVES
Stopping new
infectionsBehaviour
change
communication
HCTTB
Other
prevention
4. EFFICIENCY FACTORS
Efficiency
factorEfficiency
factor
Efficiency
factor
Efficiency
factorEfficiency
factor
Efficiency
factor
Efficiency
factorEfficiency
factor
Efficiency
factor

NSP
(2012 -2016)PSPs
(2012 -2016)
Surveys
HSRC, NCS, YRBS
National TB Cost Model (HE2RO)
(since 2011)
National ART Cost Model (HE2RO)
(since 2009)
APT (CHAI) (2013)
Aids2031
(2009)
NASA (CEGAA) (2007/8 –2009/10)
Spectrum estimates (2014)
HIV KYE/KYR (2011)
NSP and PSP Mid Term Reviews
(2015)
Thembisa(since 2013) Programme
evaluations
NDOH Joint HIV, TB & PMTCT review,
MNCH
INVESTMENT CASE
TB KYE/KYR (2014)
NDP
New technologies
Guidelines, Policies, Campaigns
MDG Countdown, HLM Targets
Global Fund Investment
PEPFAR transition
Treasury & fiscal trends
Conditional grant
MTEF
NHI, PHC re-engineering
Special studies
Confidential enquiries, HST
HIMS
DHIS, EMIS
STATS SA
GHS
HSS(HRH plan)
Relationship between Investment Case and other analyses
NSP
(2017 -2021)
NDoH APP
FIN-CAP (HE2RO)
(since 2013)

Contents
The purpose and uses of the South African HIV Investment CaseIntroduction to Investment Approach: Why, and why hereEvidence review: How we knew what to includeModelling: How we projected impact and cost Results: The best buys for HIVResults: The best buys for TBExpenditure analysis: Can we afford it?Knowledge gaps and way forwardDiscussion
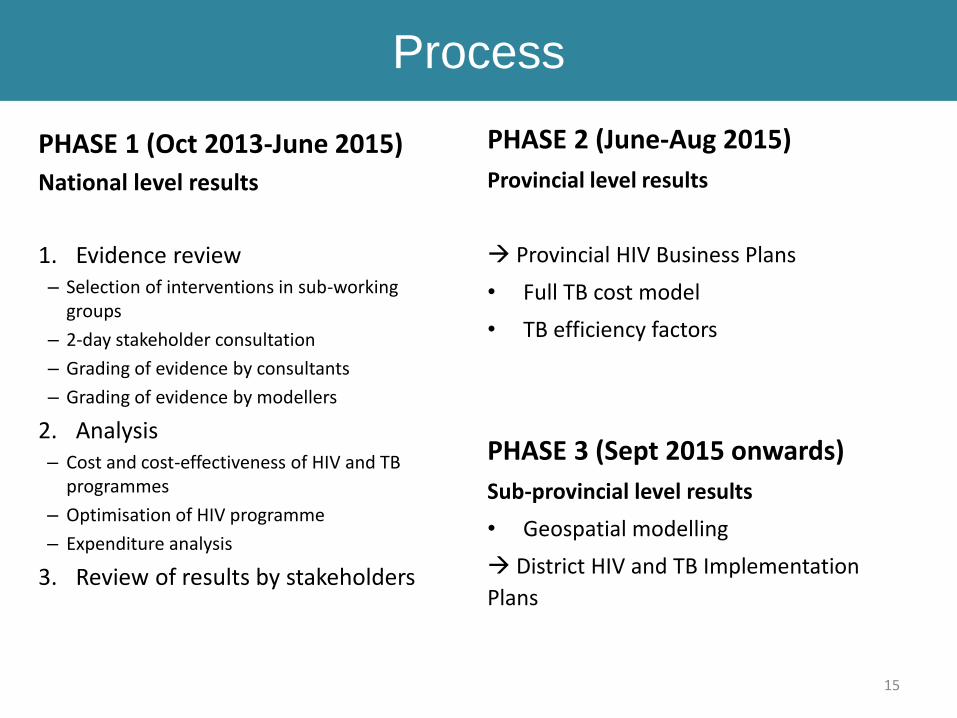
Process
15
PHASE 1 (Oct 2013-June 2015)
National level results
1. Evidence review– Selection of interventions in sub-working
groups
– 2-day stakeholder consultation
– Grading of evidence by consultants
– Grading of evidence by modellers
2. Analysis– Cost and cost-effectiveness of HIV and TB
programmes
– Optimisation of HIV programme
– Expenditure analysis
3. Review of results by stakeholders
PHASE 2 (June-Aug 2015)
Provincial level results
Provincial HIV Business Plans
• Full TB cost model
• TB efficiency factors
PHASE 3 (Sept 2015 onwards)
Sub-provincial level results
• Geospatial modelling
District HIV and TB Implementation
Plans
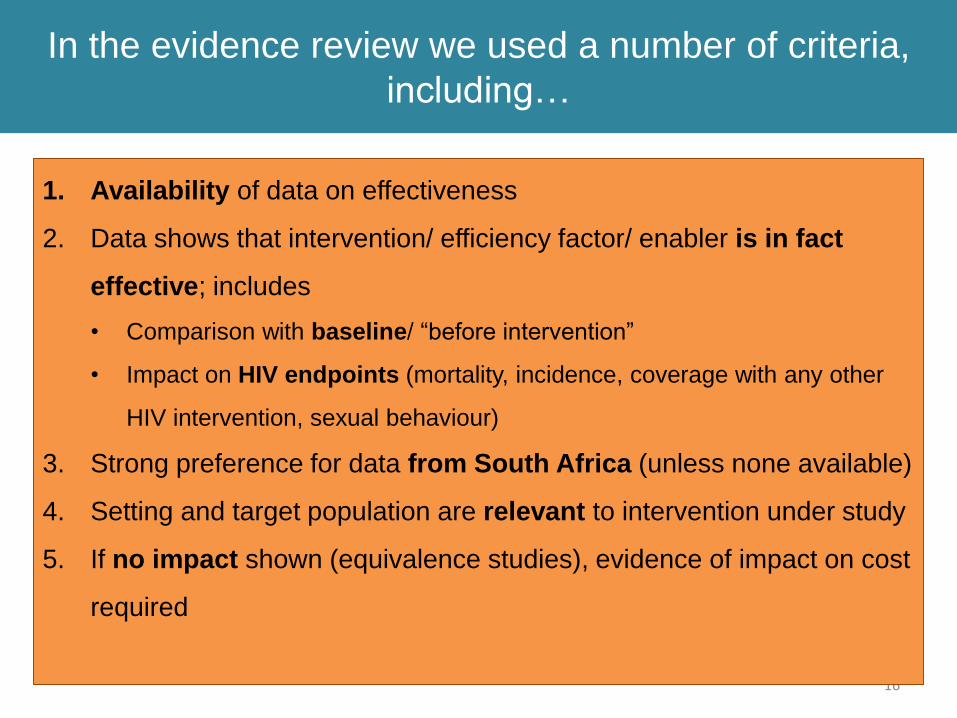
In the evidence review we used a number of criteria,
including…
16
1. Availability of data on effectiveness
2. Data shows that intervention/ efficiency factor/ enabler is in fact
effective; includes
• Comparison with baseline/ “before intervention”
• Impact on HIV endpoints (mortality, incidence, coverage with any other
HIV intervention, sexual behaviour)
3. Strong preference for data from South Africa (unless none available)
4. Setting and target population are relevant to intervention under study
5. If no impact shown (equivalence studies), evidence of impact on cost
required
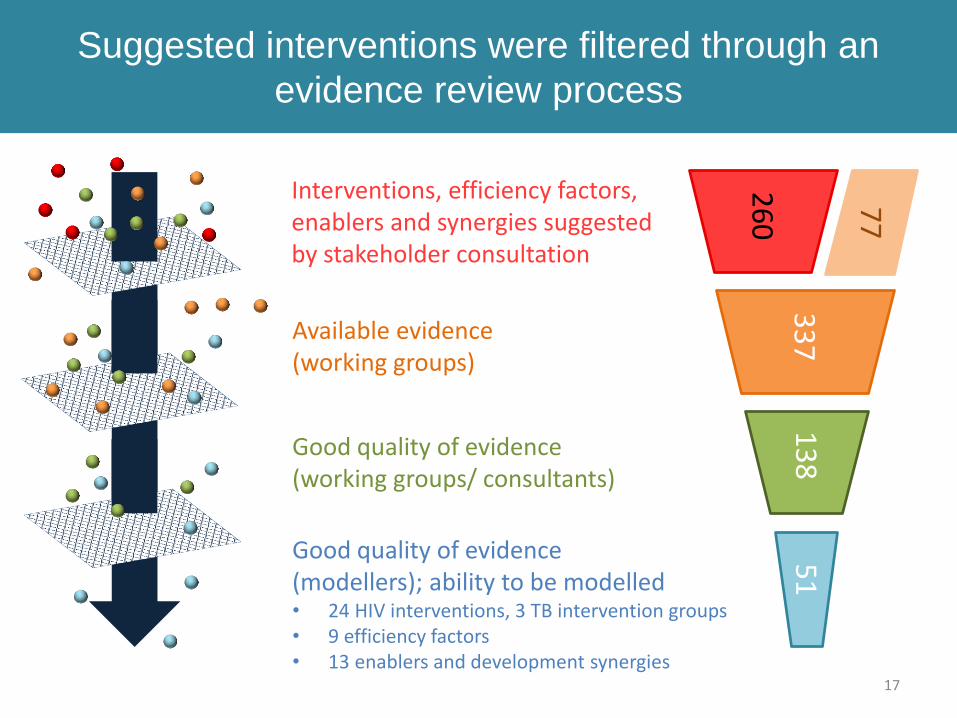
Suggested interventions were filtered through an
evidence review process
17
Good quality of evidence (working groups/ consultants)
Good quality of evidence (modellers); ability to be modelled• 24 HIV interventions, 3 TB intervention groups• 9 efficiency factors• 13 enablers and development synergies
Available evidence(working groups)
Interventions, efficiency factors, enablers and synergies suggested by stakeholder consultation
26
0
33
71
38
51
77
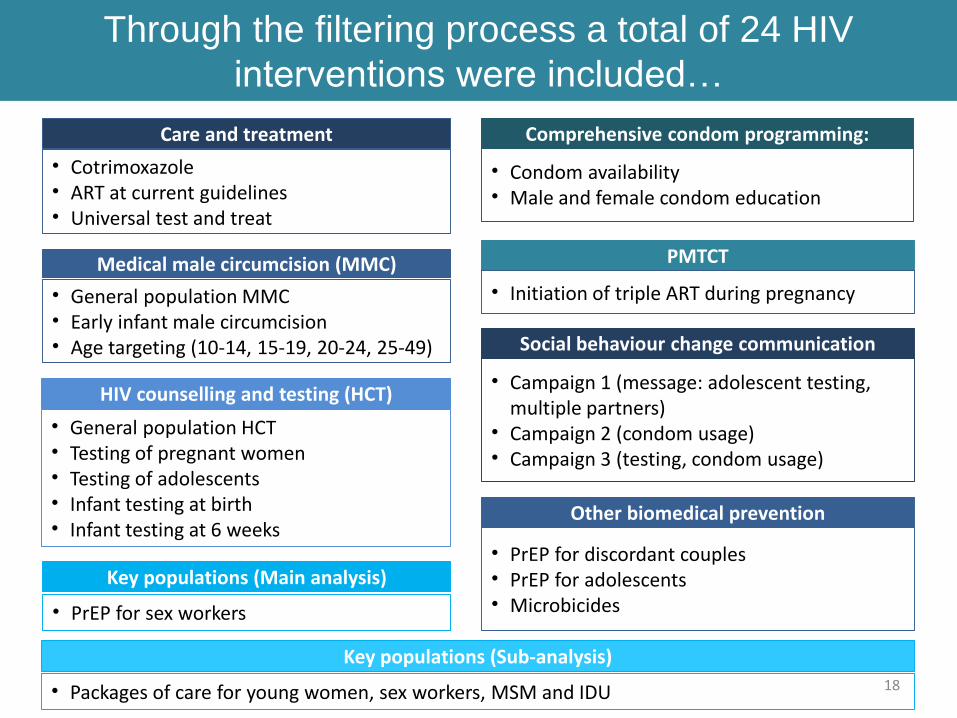
Through the filtering process a total of 24 HIV
interventions were included…
18
Care and treatment
• Cotrimoxazole• ART at current guidelines• Universal test and treat
Medical male circumcision (MMC)
• General population MMC• Early infant male circumcision• Age targeting (10-14, 15-19, 20-24, 25-49)
HIV counselling and testing (HCT)
• General population HCT• Testing of pregnant women• Testing of adolescents• Infant testing at birth• Infant testing at 6 weeks
Comprehensive condom programming:
• Condom availability• Male and female condom education
PMTCT
• Initiation of triple ART during pregnancy
Social behaviour change communication
• Campaign 1 (message: adolescent testing, multiple partners)
• Campaign 2 (condom usage)• Campaign 3 (testing, condom usage)
Other biomedical prevention
• PrEP for discordant couples• PrEP for adolescents• Microbicides
Key populations (Main analysis)
• PrEP for sex workers
Key populations (Sub-analysis)
• Packages of care for young women, sex workers, MSM and IDU
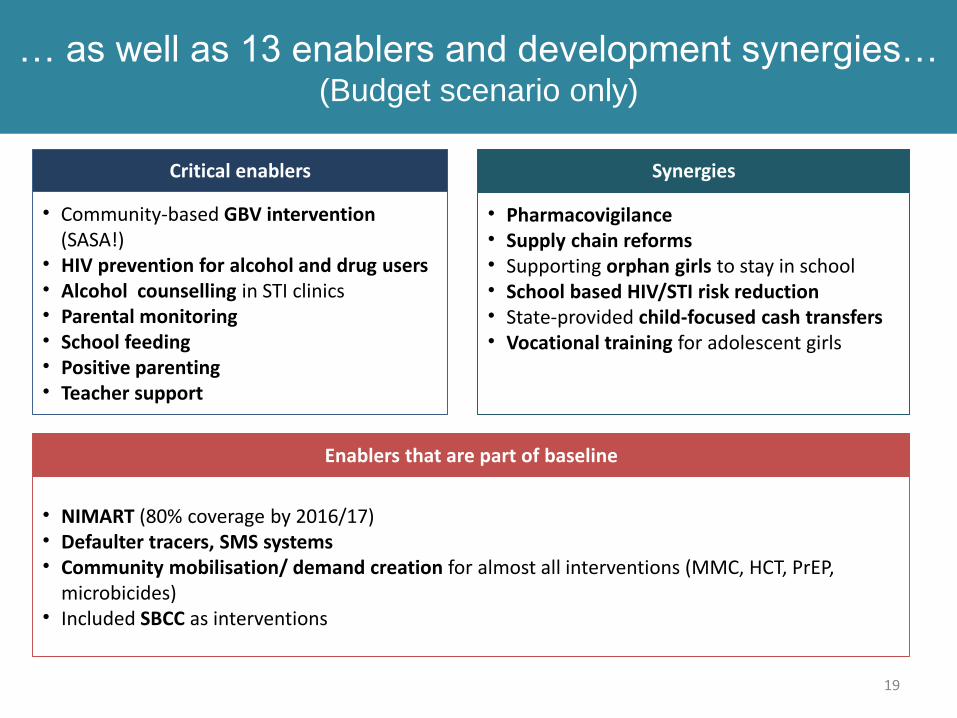
… as well as 13 enablers and development synergies… (Budget scenario only)
19
Critical enablers
• Community-based GBV intervention (SASA!)
• HIV prevention for alcohol and drug users• Alcohol counselling in STI clinics• Parental monitoring• School feeding• Positive parenting• Teacher support
Synergies
• Pharmacovigilance• Supply chain reforms• Supporting orphan girls to stay in school• School based HIV/STI risk reduction• State-provided child-focused cash transfers• Vocational training for adolescent girls
Enablers that are part of baseline
• NIMART (80% coverage by 2016/17)• Defaulter tracers, SMS systems• Community mobilisation/ demand creation for almost all interventions (MMC, HCT, PrEP,
microbicides)• Included SBCC as interventions
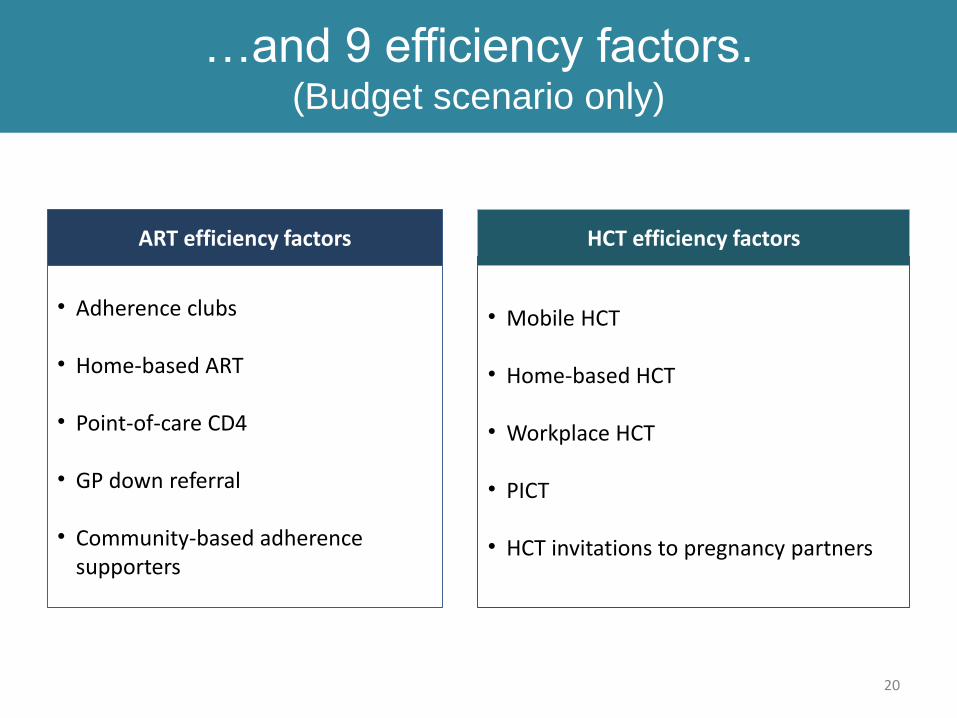
…and 9 efficiency factors. (Budget scenario only)
20
ART efficiency factors
• Adherence clubs
• Home-based ART
• Point-of-care CD4
• GP down referral
• Community-based adherence supporters
HCT efficiency factors
• Mobile HCT
• Home-based HCT
• Workplace HCT
• PICT
• HCT invitations to pregnancy partners
QUESTIONS?
21
Contents
The purpose and uses of the South African HIV Investment CaseIntroduction to Investment Approach: Why, and why hereEvidence review: How we knew what to includeModelling: How we projected impact and cost Results: The best buys for HIVResults: The best buys for TBExpenditure analysis: Can we afford it?Knowledge gaps and way forwardDiscussion
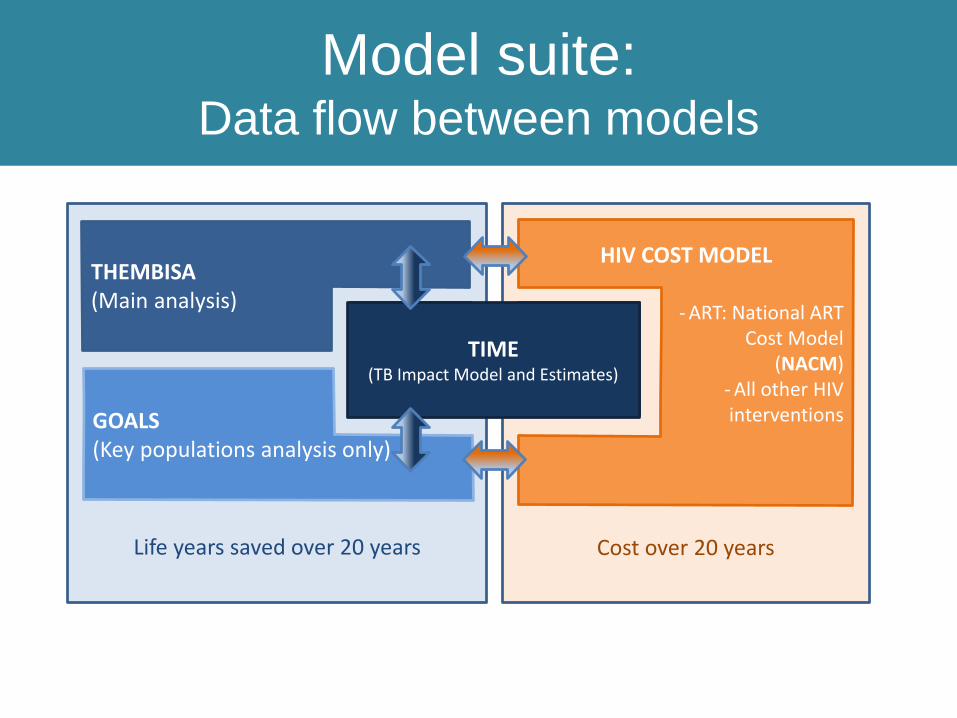
Cost over 20 yearsLife years saved over 20 years
TB COST MODEL
HIV COST MODEL
- ART: National ART Cost Model
(NACM)- All other HIVinterventions
Model suite:Data flow between models
THEMBISA(Main analysis)
GOALS(Key populations analysis only)
TIME(TB Impact Model and Estimates)
TIME(TB Impact Model and Estimates)
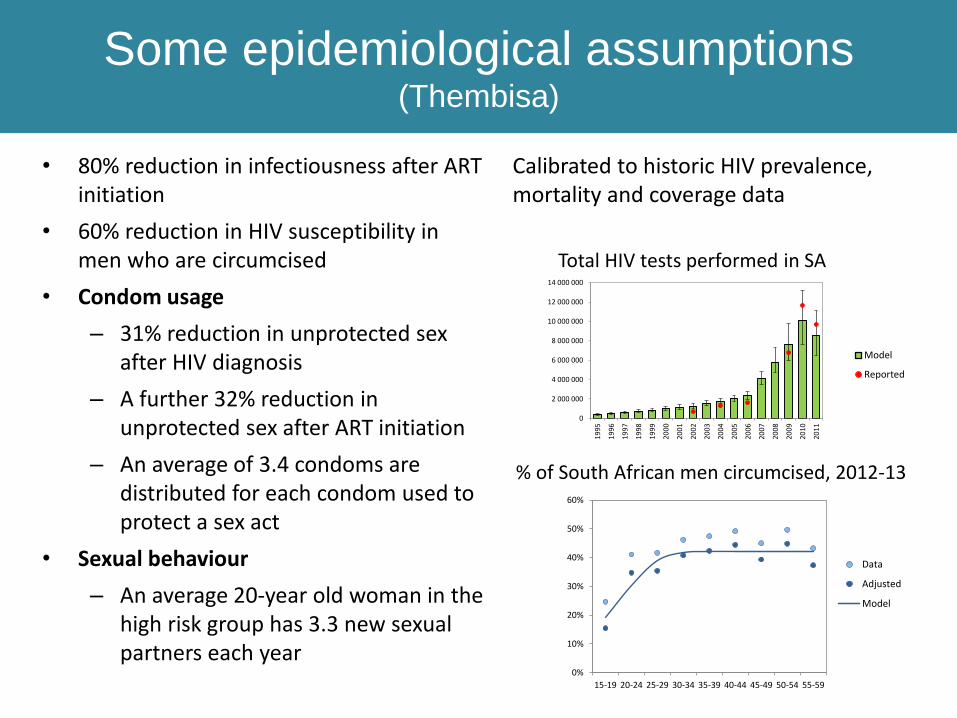
Some epidemiological assumptions (Thembisa)
• 80% reduction in infectiousness after ART initiation
• 60% reduction in HIV susceptibility in men who are circumcised
• Condom usage
– 31% reduction in unprotected sex after HIV diagnosis
– A further 32% reduction in unprotected sex after ART initiation
– An average of 3.4 condoms are distributed for each condom used to protect a sex act
• Sexual behaviour
– An average 20-year old woman in the high risk group has 3.3 new sexual partners each year
Calibrated to historic HIV prevalence, mortality and coverage data
0%
10%
20%
30%
40%
50%
60%
15-19 20-24 25-29 30-34 35-39 40-44 45-49 50-54 55-59
Data
Adjusted
Model
% of South African men circumcised, 2012-13
0
2 000 000
4 000 000
6 000 000
8 000 000
10 000 000
12 000 000
14 000 000
19
95
19
96
19
97
19
98
19
99
20
00
20
01
20
02
20
03
20
04
20
05
20
06
20
07
20
08
20
09
20
10
20
11
Model
Reported
Total HIV tests performed in SA
0
2 000 000
4 000 000
6 000 000
8 000 000
10 000 000
12 000 000
14 000 000
19
95
19
96
19
97
19
98
19
99
20
00
20
01
20
02
20
03
20
04
20
05
20
06
20
07
20
08
20
09
20
10
20
11
Model
Reported
0%
10%
20%
30%
40%
50%
60%
15-19 20-24 25-29 30-34 35-39 40-44 45-49 50-54 55-59
Data
Adjusted
Model
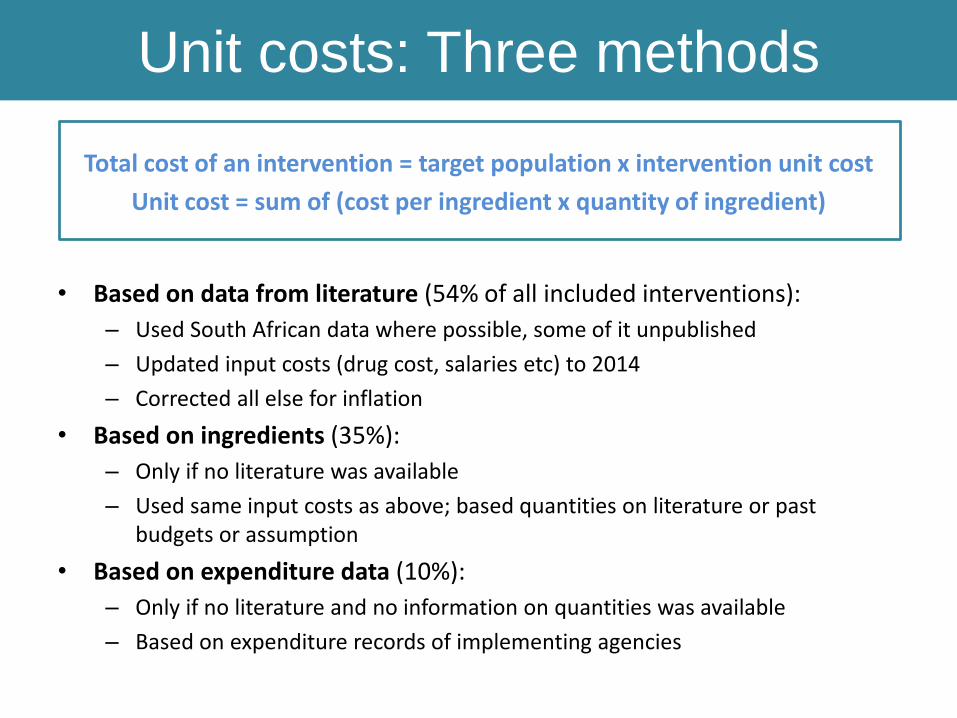
Unit costs: Three methods
Total cost of an intervention = target population x intervention unit cost
Unit cost = sum of (cost per ingredient x quantity of ingredient)
• Based on data from literature (54% of all included interventions):
– Used South African data where possible, some of it unpublished
– Updated input costs (drug cost, salaries etc) to 2014
– Corrected all else for inflation
• Based on ingredients (35%):
– Only if no literature was available
– Used same input costs as above; based quantities on literature or past budgets or assumption
• Based on expenditure data (10%):
– Only if no literature and no information on quantities was available
– Based on expenditure records of implementing agencies
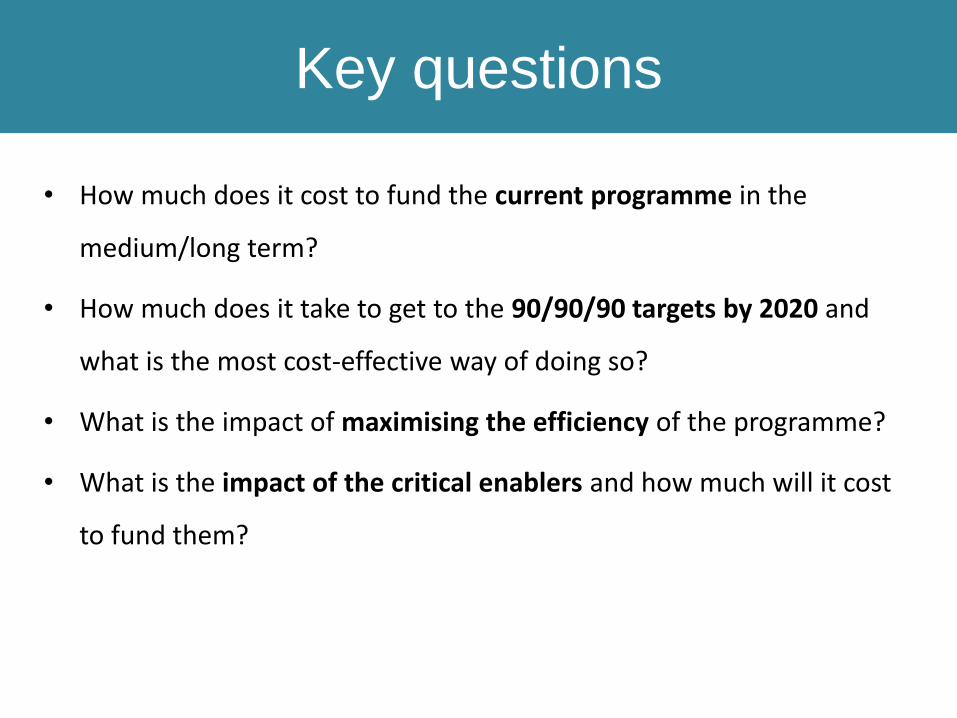
Key questions
• How much does it cost to fund the current programme in the
medium/long term?
• How much does it take to get to the 90/90/90 targets by 2020 and
what is the most cost-effective way of doing so?
• What is the impact of maximising the efficiency of the programme?
• What is the impact of the critical enablers and how much will it cost
to fund them?
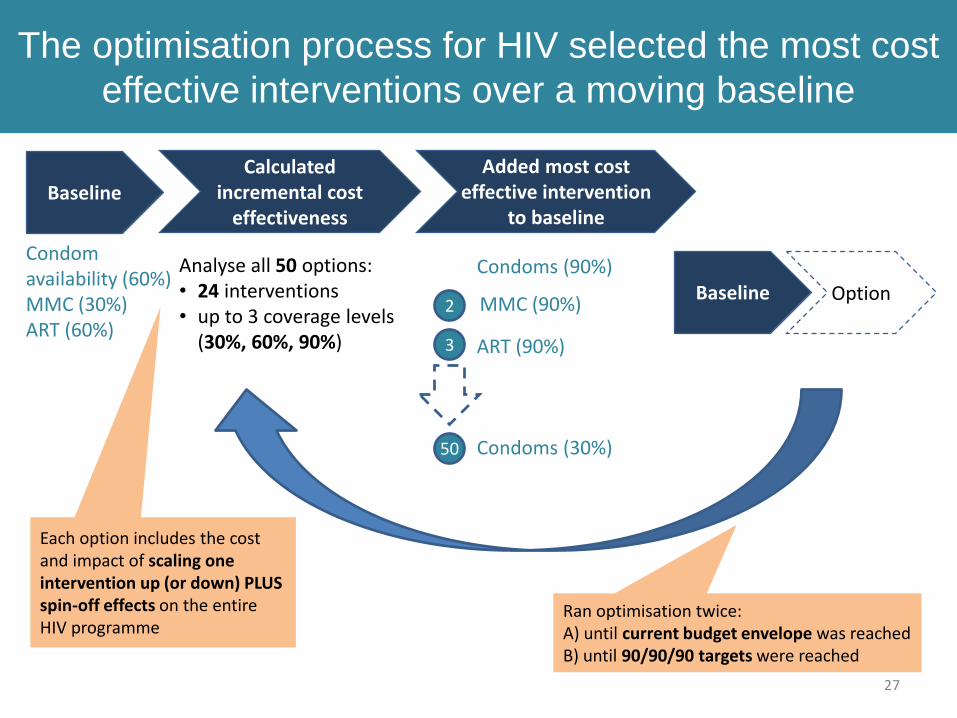
MMC (90%)
Condoms (90%)
The optimisation process for HIV selected the most cost
effective interventions over a moving baseline
27
Added most cost effective intervention
to baseline
2
3
50
Analyse all 50 options:• 24 interventions • up to 3 coverage levels
(30%, 60%, 90%)
BaselineCalculated
incremental cost effectiveness
Baseline Option
Each option includes the cost and impact of scaling one intervention up (or down) PLUS spin-off effects on the entire HIV programme
1
ART (90%)
Condoms (30%)
Condom availability (60%)MMC (30%)ART (60%)
Ran optimisation twice:A) until current budget envelope was reachedB) until 90/90/90 targets were reached
Contents
The purpose and uses of the South African HIV Investment CaseIntroduction to Investment Approach: Why, and why hereEvidence review: How we knew what to includeModelling: How we projected impact and cost Results: The best buys for HIVResults: The best buys for TBExpenditure analysis: Can we afford it?Knowledge gaps and way forwardDiscussion
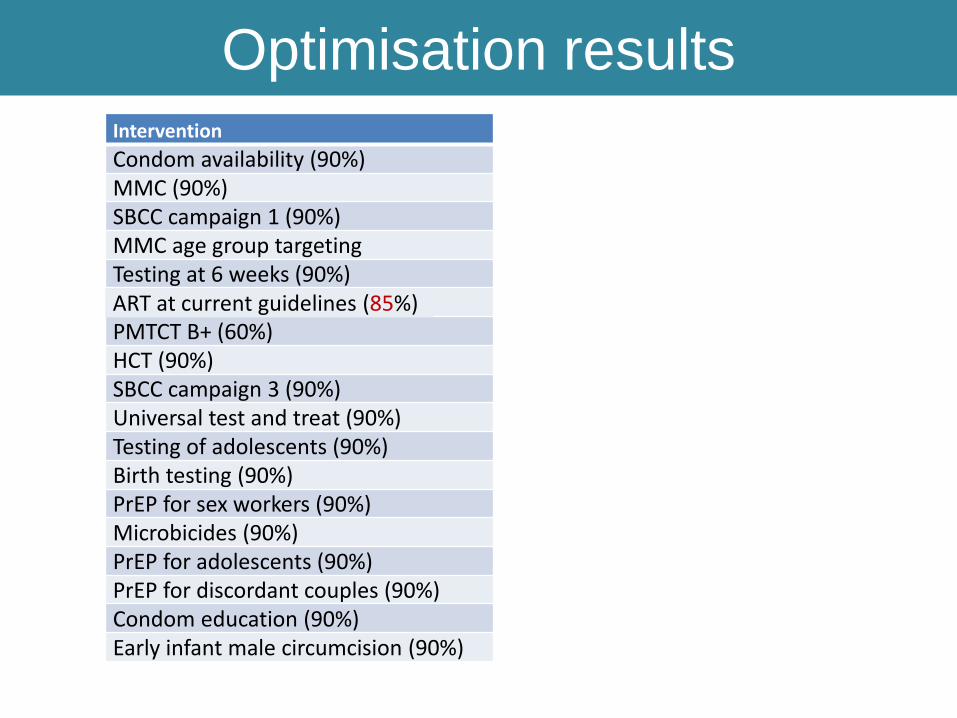
Optimisation resultsIntervention
Condom availability (90%)MMC (90%)SBCC campaign 1 (90%)MMC age group targeting Testing at 6 weeks (90%)ART at current guidelines (90%)PMTCT B+ (60%)HCT (90%)SBCC campaign 3 (90%)Universal test and treat (90%)Testing of adolescents (90%)Birth testing (90%)PrEP for sex workers (90%)Microbicides (90%)PrEP for adolescents (90%)PrEP for discordant couples (90%)Condom education (90%)Early infant male circumcision (90%)
ART at current guidelines (85%)
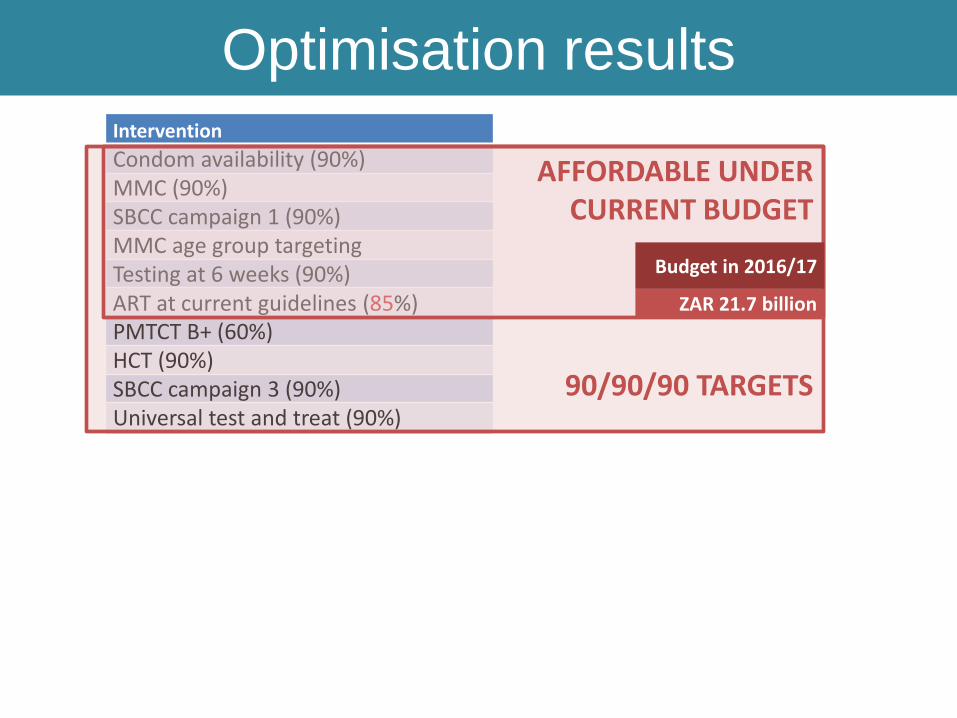
90/90/90 TARGETS
AFFORDABLE UNDER CURRENT BUDGET
Budget in 2016/17
ZAR 21.7 billion
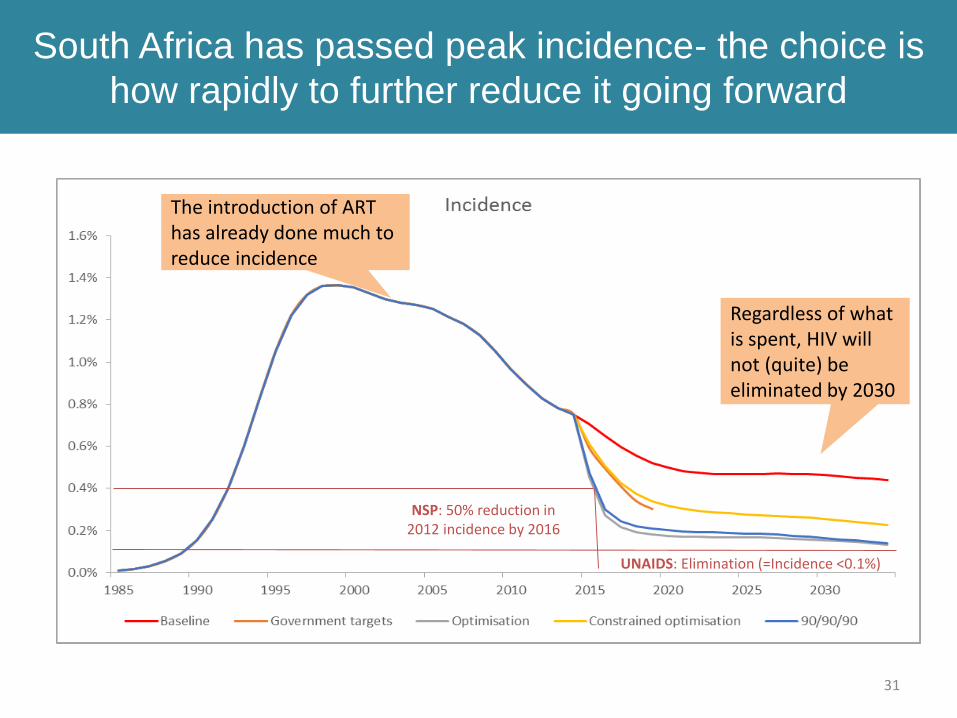
South Africa has passed peak incidence- the choice is
how rapidly to further reduce it going forward
NSP: 50% reduction in 2012 incidence by 2016
UNAIDS: Elimination (=Incidence <0.1%)
31
Regardless of what is spent, HIV will not (quite) be eliminated by 2030
The introduction of ART has already done much to reduce incidence
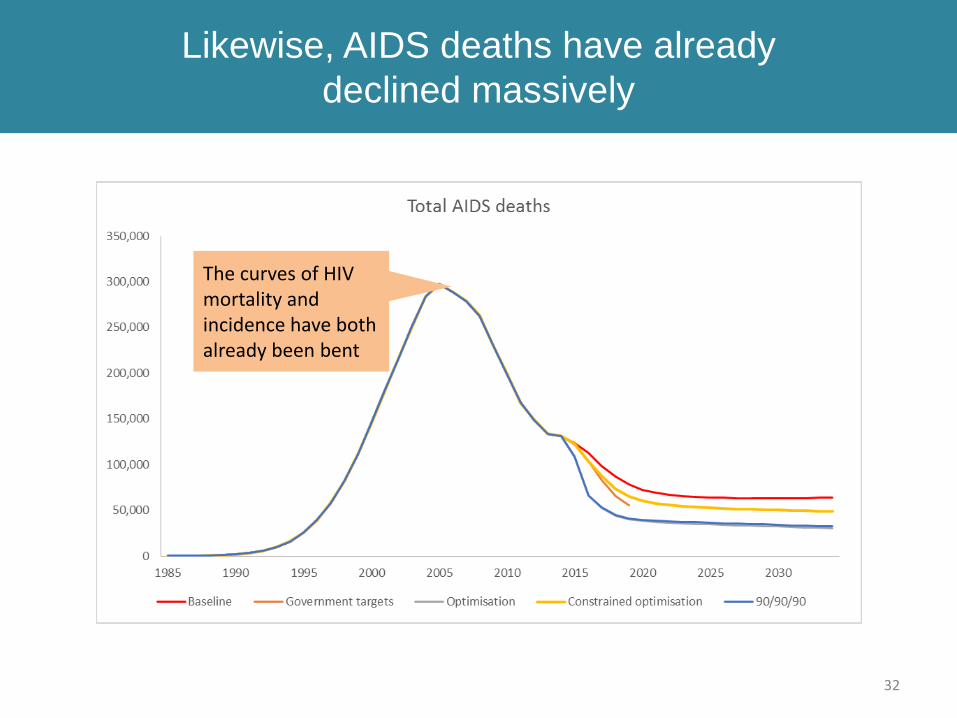
Likewise, AIDS deaths have already
declined massively
32
The curves of HIV mortality and incidence have both already been bent
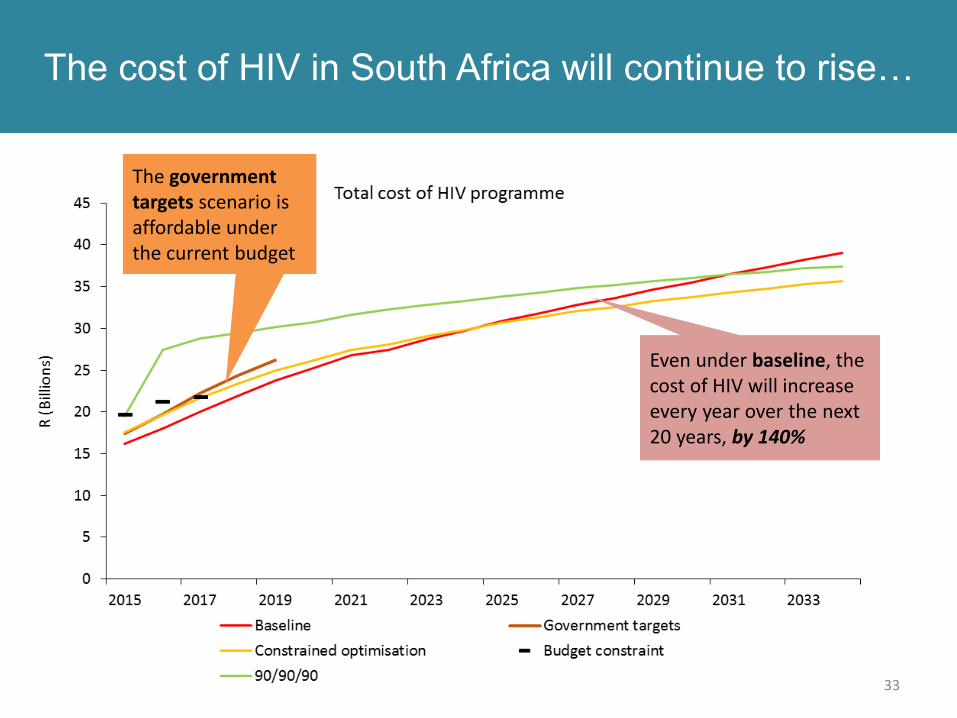
The cost of HIV in South Africa will continue to rise…
33
The government targets scenario is affordable under the current budget
Even under baseline, the cost of HIV will increase every year over the next 20 years, by 140%
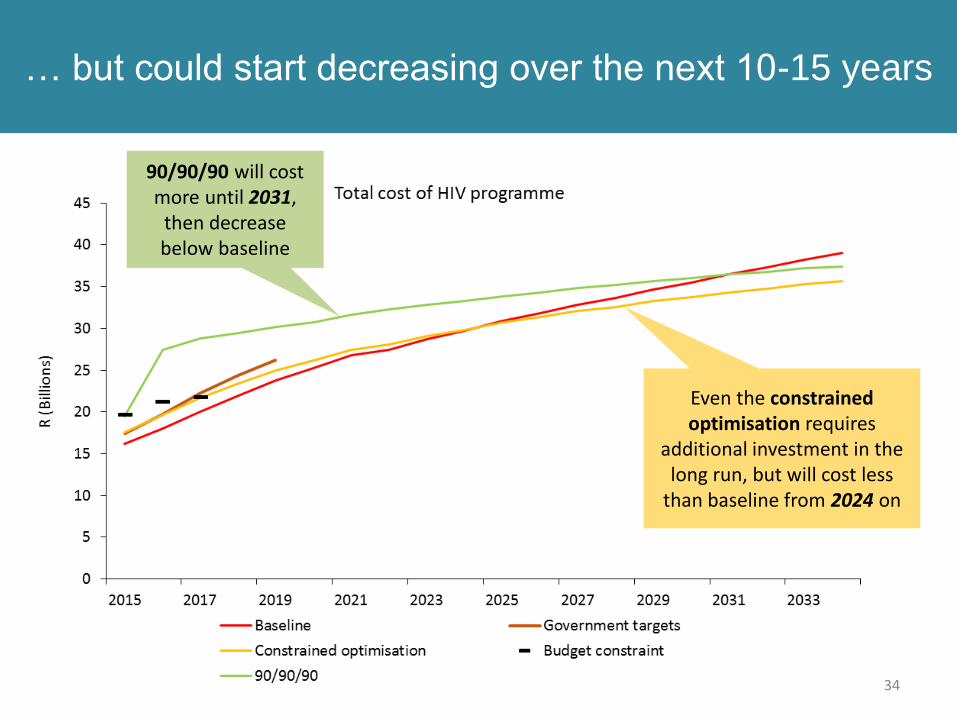
… but could start decreasing over the next 10-15 years
34
90/90/90 will cost more until 2031,
then decrease below baseline
Even the constrained optimisation requires
additional investment in the long run, but will cost less
than baseline from 2024 on

Summary of cost and cost effectiveness by scenario
35
Baseline Government
targets
Optimisation
with
constraint
90/90/90
Life years saved [millions] (% change on baseline)
- 2015-2019 - 3.48 (16%) 2.14 (10%) 8.07 (37%)
- 2015-2034 - - 10.8 (18%) 26.8 (45%)
Total cost [billion 2014 ZAR]
- 2015-2019 122 131 129 157
- 2015-2034 688 - 675 743
Incremental cost [billion 2014 ZAR] (% change on baseline)
- 2015-2019 10 (8%) 7 (6%) 35 (29%)
- 2015-2034 - -14 (-2%) 55 (8%)
Incremental cost per life year saved
- 2015-2019 R 2,742 R 3,250 R 4,181
- 2015-2034 - Cost saving R 2,055
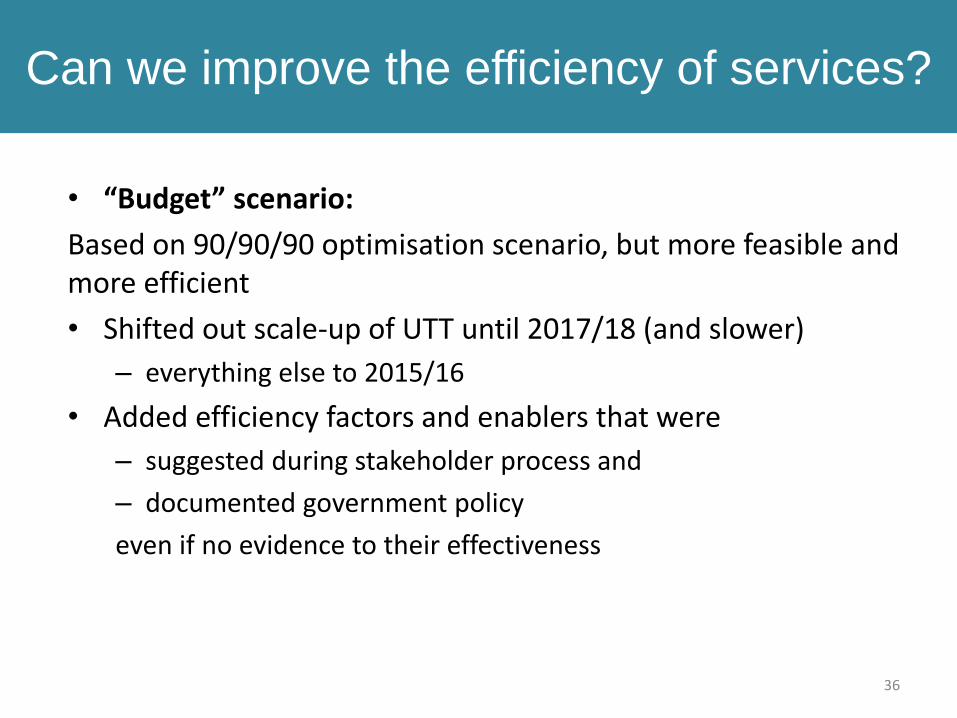
Can we improve the efficiency of services?
• “Budget” scenario:
Based on 90/90/90 optimisation scenario, but more feasible and more efficient
• Shifted out scale-up of UTT until 2017/18 (and slower)
– everything else to 2015/16
• Added efficiency factors and enablers that were
– suggested during stakeholder process and
– documented government policy
even if no evidence to their effectiveness
36
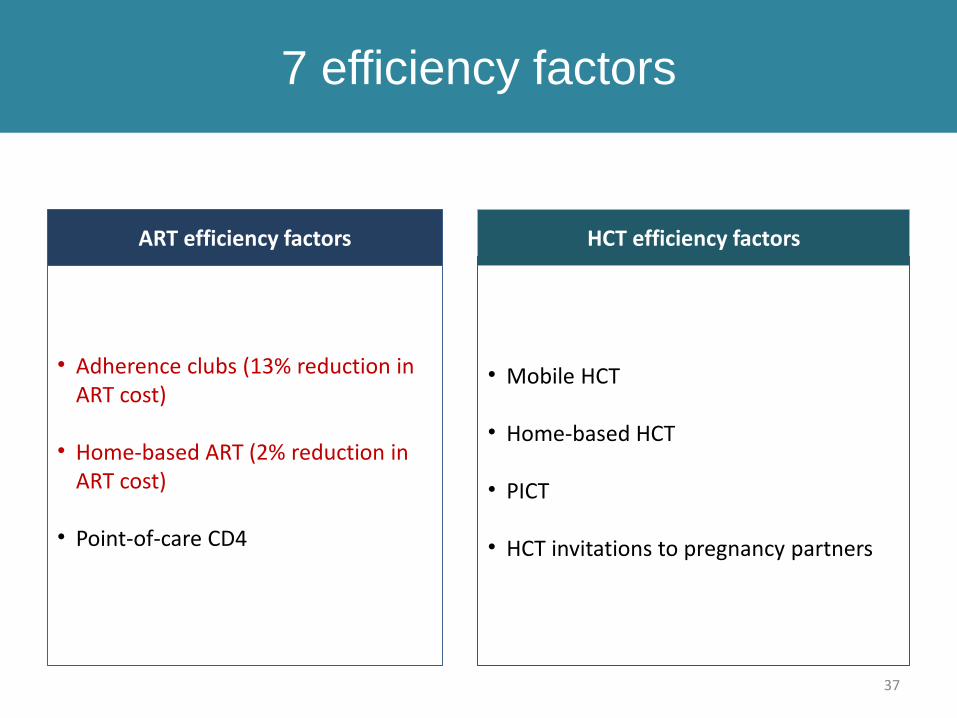
7 efficiency factors
37
ART efficiency factors
• Adherence clubs (13% reduction in ART cost)
• Home-based ART (2% reduction in ART cost)
• Point-of-care CD4
HCT efficiency factors
• Mobile HCT
• Home-based HCT
• PICT
• HCT invitations to pregnancy partners
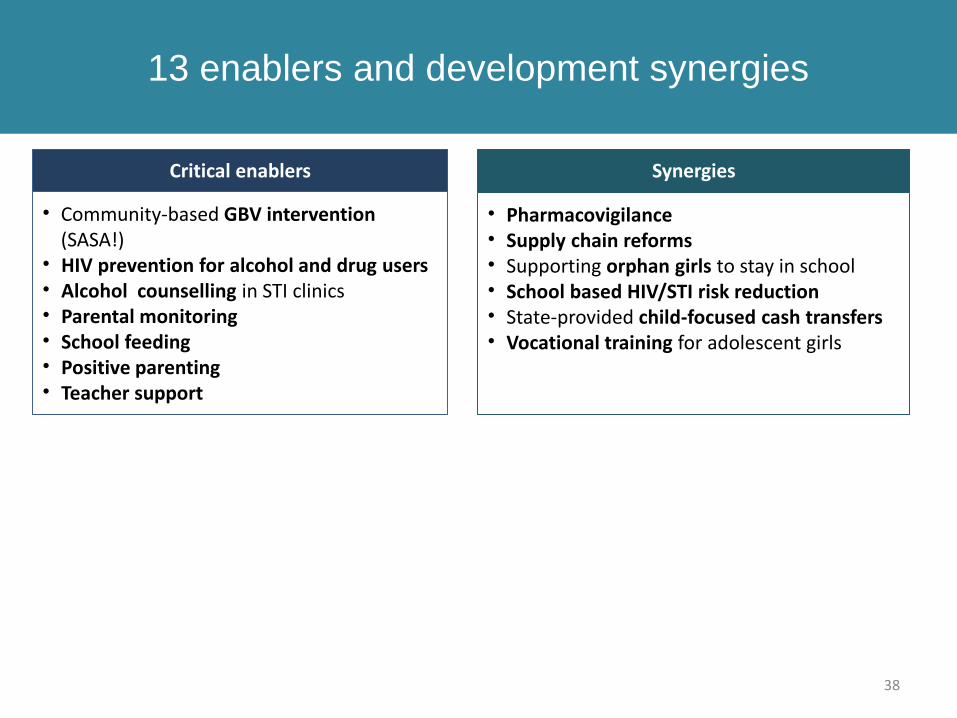
13 enablers and development synergies
38
Critical enablers
• Community-based GBV intervention (SASA!)
• HIV prevention for alcohol and drug users• Alcohol counselling in STI clinics• Parental monitoring• School feeding• Positive parenting• Teacher support
Synergies
• Pharmacovigilance• Supply chain reforms• Supporting orphan girls to stay in school• School based HIV/STI risk reduction• State-provided child-focused cash transfers• Vocational training for adolescent girls
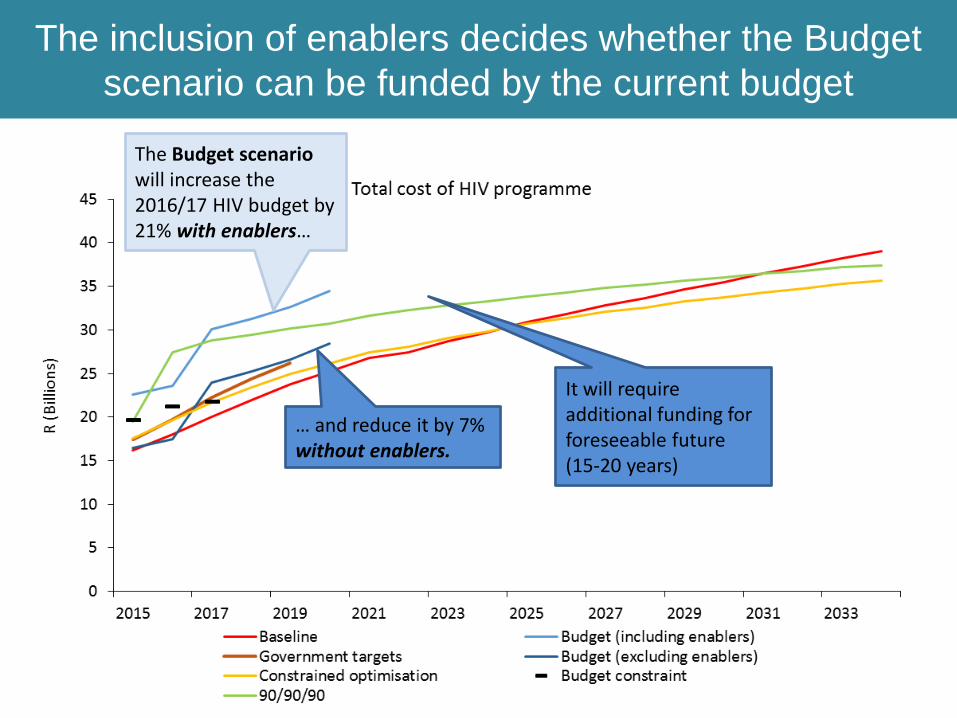
The inclusion of enablers decides whether the Budget
scenario can be funded by the current budget
The Budget scenario will increase the 2016/17 HIV budget by 21% with enablers…
It will require additional funding for foreseeable future (15-20 years)
… and reduce it by 7% without enablers.
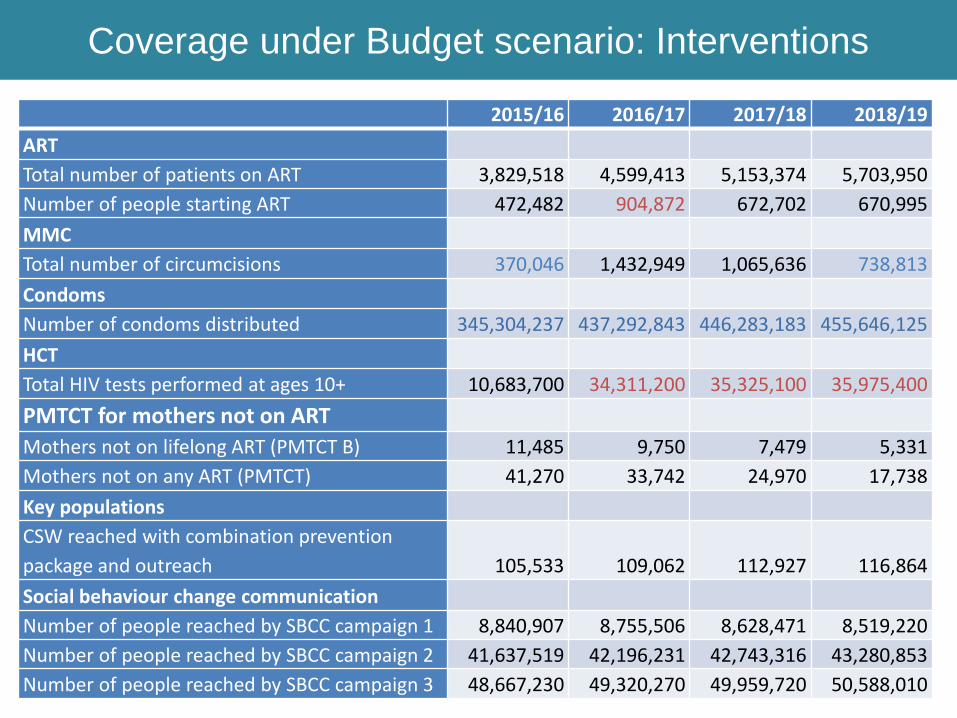
Coverage under Budget scenario: Interventions
40
2015/16 2016/17 2017/18 2018/19
ART
Total number of patients on ART 3,829,518 4,599,413 5,153,374 5,703,950
Number of people starting ART 472,482 904,872 672,702 670,995
MMC
Total number of circumcisions 370,046 1,432,949 1,065,636 738,813
Condoms
Number of condoms distributed 345,304,237 437,292,843 446,283,183 455,646,125
HCT
Total HIV tests performed at ages 10+ 10,683,700 34,311,200 35,325,100 35,975,400
PMTCT for mothers not on ART
Mothers not on lifelong ART (PMTCT B) 11,485 9,750 7,479 5,331
Mothers not on any ART (PMTCT) 41,270 33,742 24,970 17,738
Key populations
CSW reached with combination prevention
package and outreach 105,533 109,062 112,927 116,864
Social behaviour change communication
Number of people reached by SBCC campaign 1 8,840,907 8,755,506 8,628,471 8,519,220
Number of people reached by SBCC campaign 2 41,637,519 42,196,231 42,743,316 43,280,853
Number of people reached by SBCC campaign 3 48,667,230 49,320,270 49,959,720 50,588,010
41
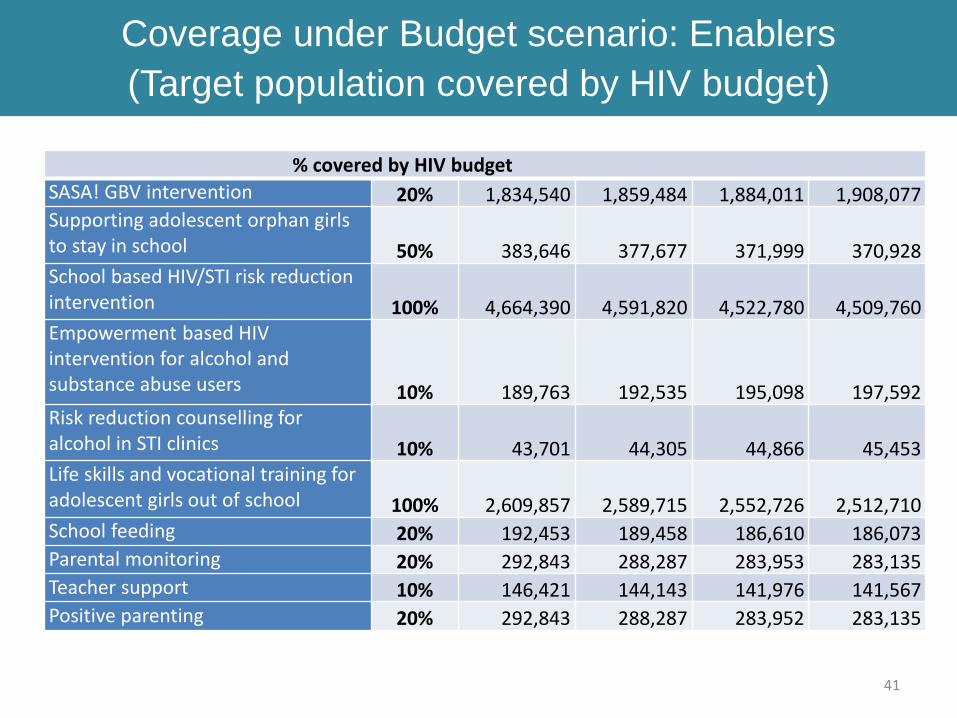
% covered by HIV budget
SASA! GBV intervention 20% 1,834,540 1,859,484 1,884,011 1,908,077Supporting adolescent orphan girls to stay in school 50% 383,646 377,677 371,999 370,928School based HIV/STI risk reduction intervention 100% 4,664,390 4,591,820 4,522,780 4,509,760Empowerment based HIV intervention for alcohol and substance abuse users 10% 189,763 192,535 195,098 197,592Risk reduction counselling for alcohol in STI clinics 10% 43,701 44,305 44,866 45,453Life skills and vocational training for adolescent girls out of school 100% 2,609,857 2,589,715 2,552,726 2,512,710School feeding 20% 192,453 189,458 186,610 186,073Parental monitoring 20% 292,843 288,287 283,953 283,135Teacher support 10% 146,421 144,143 141,976 141,567Positive parenting 20% 292,843 288,287 283,952 283,135
Coverage under Budget scenario: Enablers
(Target population covered by HIV budget)
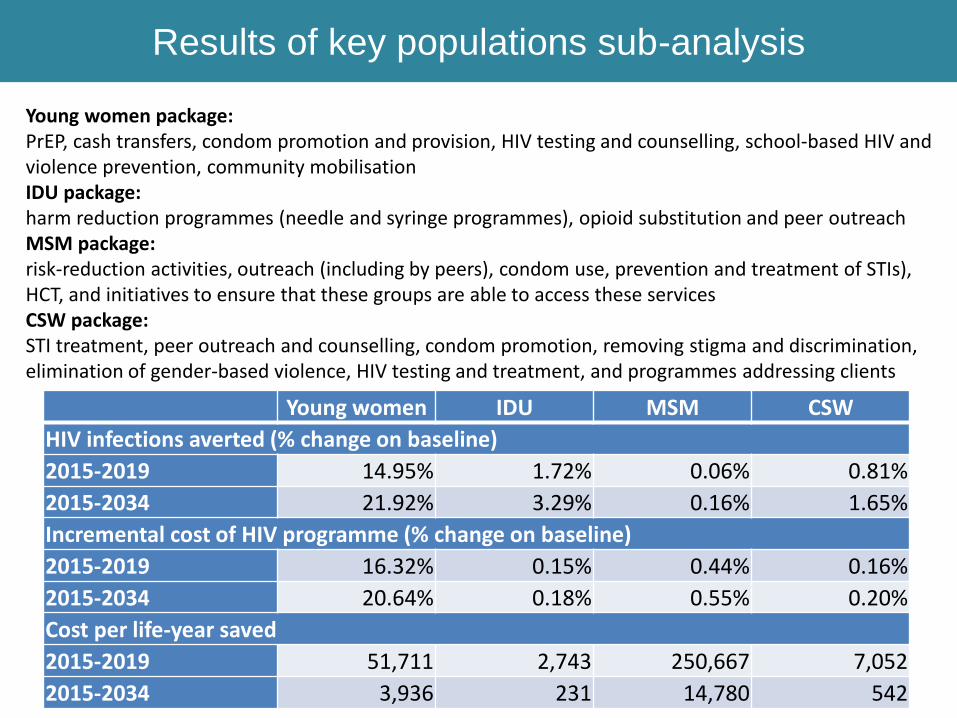
Results of key populations sub-analysis
42
Young women package: PrEP, cash transfers, condom promotion and provision, HIV testing and counselling, school-based HIV and violence prevention, community mobilisationIDU package: harm reduction programmes (needle and syringe programmes), opioid substitution and peer outreachMSM package: risk-reduction activities, outreach (including by peers), condom use, prevention and treatment of STIs), HCT, and initiatives to ensure that these groups are able to access these servicesCSW package: STI treatment, peer outreach and counselling, condom promotion, removing stigma and discrimination, elimination of gender-based violence, HIV testing and treatment, and programmes addressing clients
Young women IDU MSM CSW
HIV infections averted (% change on baseline)
2015-2019 14.95% 1.72% 0.06% 0.81%
2015-2034 21.92% 3.29% 0.16% 1.65%
Incremental cost of HIV programme (% change on baseline)
2015-2019 16.32% 0.15% 0.44% 0.16%
2015-2034 20.64% 0.18% 0.55% 0.20%
Cost per life-year saved
2015-2019 51,711 2,743 250,667 7,052
2015-2034 3,936 231 14,780 542
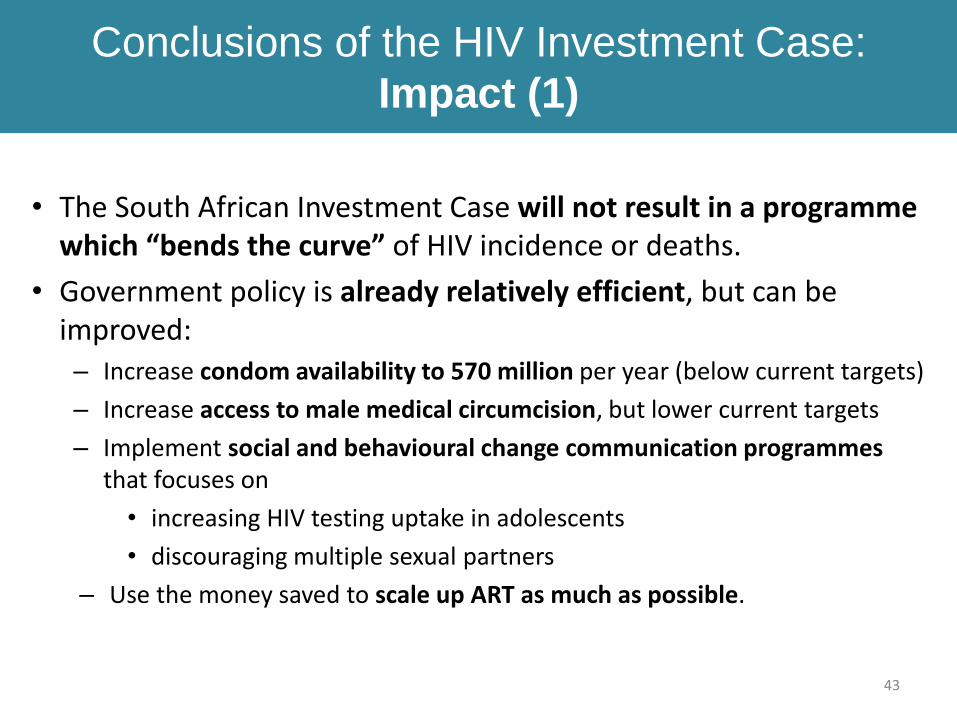
Conclusions of the HIV Investment Case:
Impact (1)
43
• The South African Investment Case will not result in a programme which “bends the curve” of HIV incidence or deaths.
• Government policy is already relatively efficient, but can be improved:– Increase condom availability to 570 million per year (below current targets)
– Increase access to male medical circumcision, but lower current targets
– Implement social and behavioural change communication programmes that focuses on
• increasing HIV testing uptake in adolescents
• discouraging multiple sexual partners
– Use the money saved to scale up ART as much as possible.
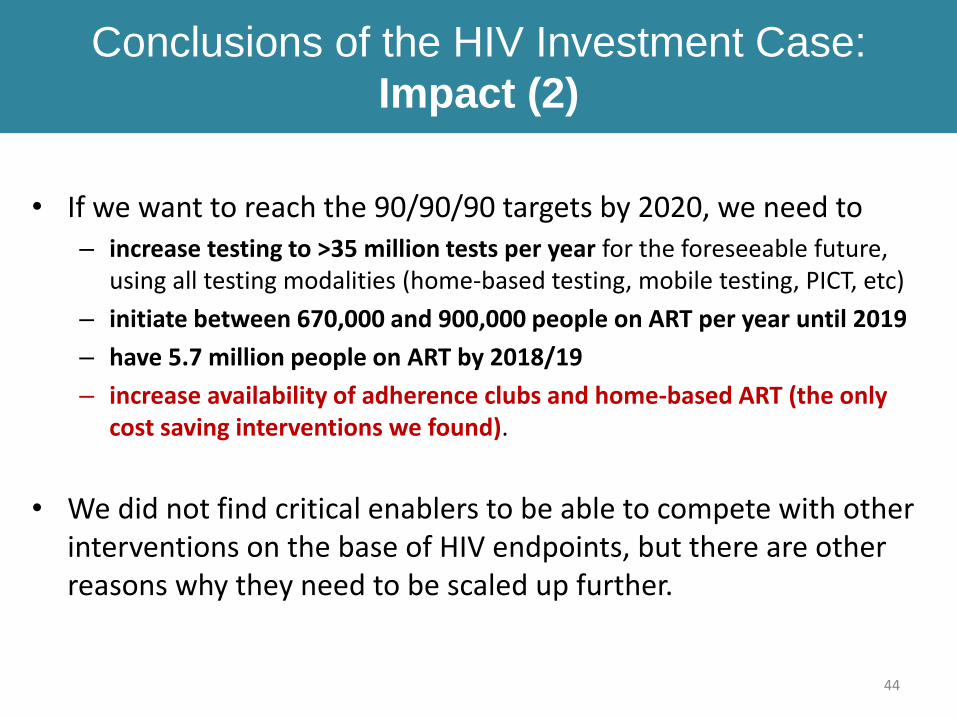
Conclusions of the HIV Investment Case:
Impact (2)
44
• If we want to reach the 90/90/90 targets by 2020, we need to – increase testing to >35 million tests per year for the foreseeable future,
using all testing modalities (home-based testing, mobile testing, PICT, etc)
– initiate between 670,000 and 900,000 people on ART per year until 2019
– have 5.7 million people on ART by 2018/19
– increase availability of adherence clubs and home-based ART (the only cost saving interventions we found).
• We did not find critical enablers to be able to compete with other interventions on the base of HIV endpoints, but there are other reasons why they need to be scaled up further.
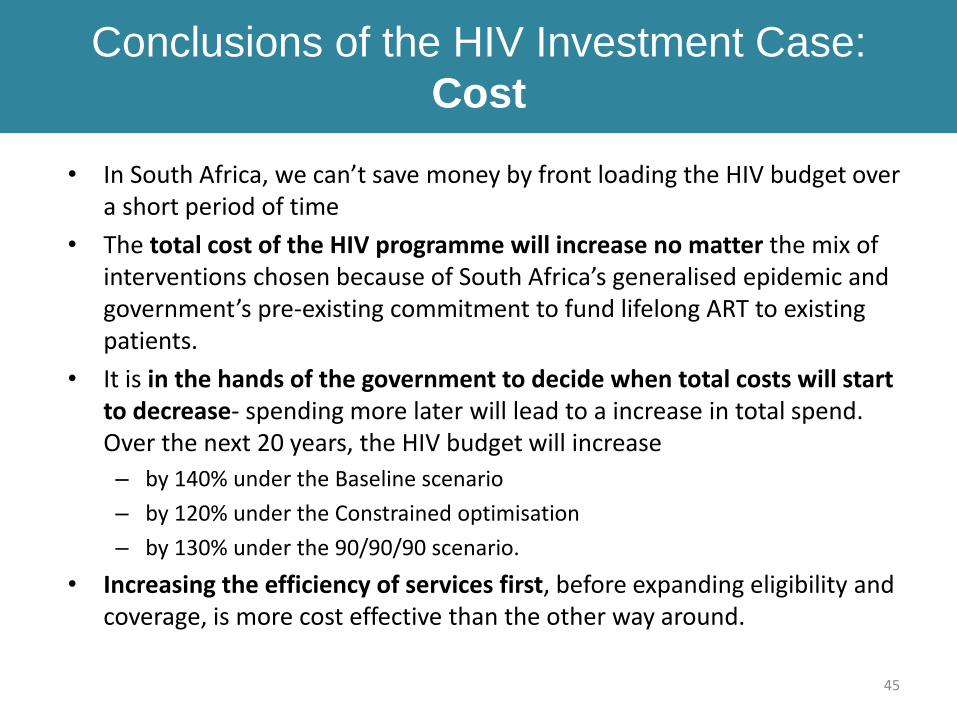
Conclusions of the HIV Investment Case:
Cost
45
• In South Africa, we can’t save money by front loading the HIV budget over a short period of time
• The total cost of the HIV programme will increase no matter the mix of interventions chosen because of South Africa’s generalised epidemic and government’s pre-existing commitment to fund lifelong ART to existing patients.
• It is in the hands of the government to decide when total costs will start to decrease- spending more later will lead to a increase in total spend. Over the next 20 years, the HIV budget will increase
– by 140% under the Baseline scenario
– by 120% under the Constrained optimisation
– by 130% under the 90/90/90 scenario.
• Increasing the efficiency of services first, before expanding eligibility and coverage, is more cost effective than the other way around.
Contents
The purpose and uses of the South African HIV Investment CaseIntroduction to Investment Approach: Why, and why hereEvidence review: How we knew what to includeModelling: How we projected impact and cost Results: The best buys for HIVResults: The best buys for TBExpenditure analysis: Can we afford it?Knowledge gaps and way forwardDiscussion
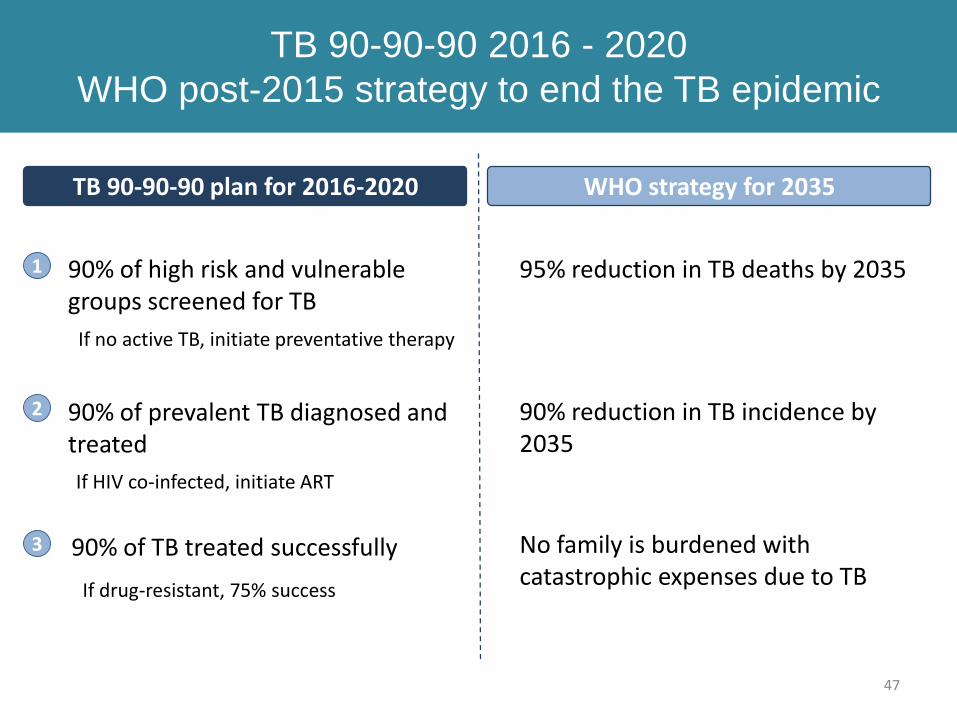
TB 90-90-90 2016 - 2020
WHO post-2015 strategy to end the TB epidemic
47
1 90% of high risk and vulnerable groups screened for TB
2 90% of prevalent TB diagnosed and treated
3 No family is burdened with catastrophic expenses due to TB
TB 90-90-90 plan for 2016-2020 WHO strategy for 2035
95% reduction in TB deaths by 2035
90% reduction in TB incidence by 2035
90% of TB treated successfully
If no active TB, initiate preventative therapy
If HIV co-infected, initiate ART
If drug-resistant, 75% success
48
0
50,000
100,000
150,000
200,000
250,000
300,000
350,000
400,000
450,000
500,000
2013 2014 2015 2016 2017 2018 2019 2020 2021 2022 2023 2024 2025 2026 2027 2028 2029 2030 2031 2032 2033 2034 2035
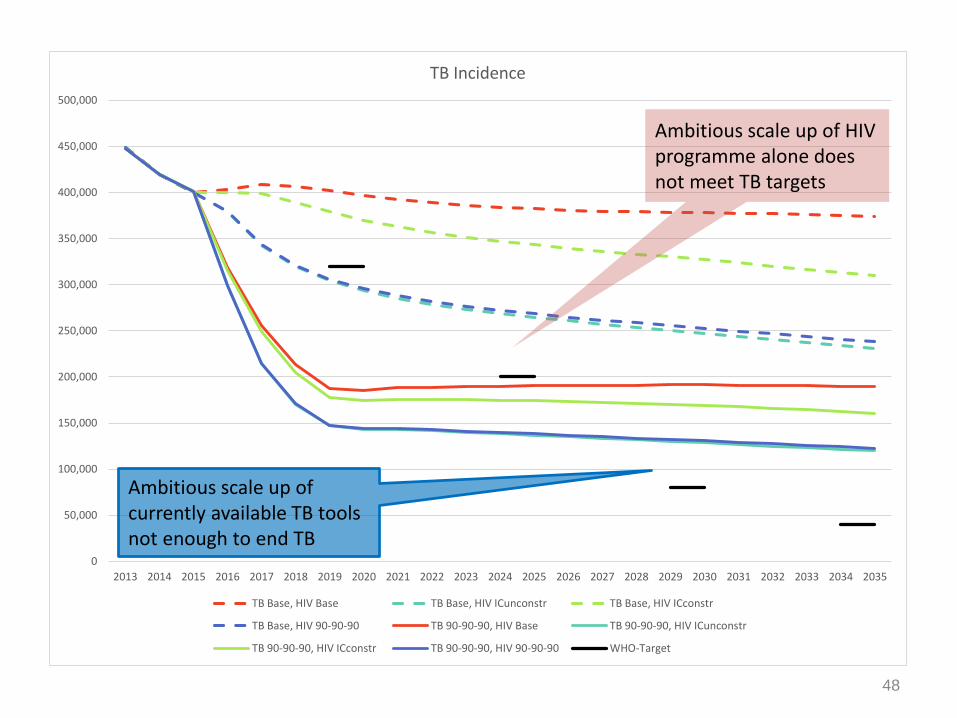
TB Incidence
TB Base, HIV Base TB Base, HIV ICunconstr TB Base, HIV ICconstr
TB Base, HIV 90-90-90 TB 90-90-90, HIV Base TB 90-90-90, HIV ICunconstr
TB 90-90-90, HIV ICconstr TB 90-90-90, HIV 90-90-90 WHO-Target
Ambitious scale up of currently available TB tools not enough to end TB
Ambitious scale up of HIV programme alone does not meet TB targets

49
0
20,000
40,000
60,000
80,000
100,000
120,000
140,000
2013 2014 2015 2016 2017 2018 2019 2020 2021 2022 2023 2024 2025 2026 2027 2028 2029 2030 2031 2032 2033 2034 2035
TB Deaths
TB Base, HIV Base TB Base, HIV ICunconstr TB Base, HIV ICconstr
TB Base, HIV 90-90-90 TB 90-90-90, HIV Base TB 90-90-90, HIV ICunconstr
TB 90-90-90, HIV ICconstr TB 90-90-90, HIV 90-90-90 WHO targets
690,000 TB deaths could be averted over the next 20 years
Even ambitious HIV scale up does not achieve significant reductions in TB deaths
50
0
50,000
100,000
150,000
200,000
250,000
300,000
350,000
400,000
2013 2014 2015 2016 2017 2018 2019 2020 2021 2022 2023 2024 2025 2026 2027 2028 2029 2030 2031 2032 2033 2034 2035
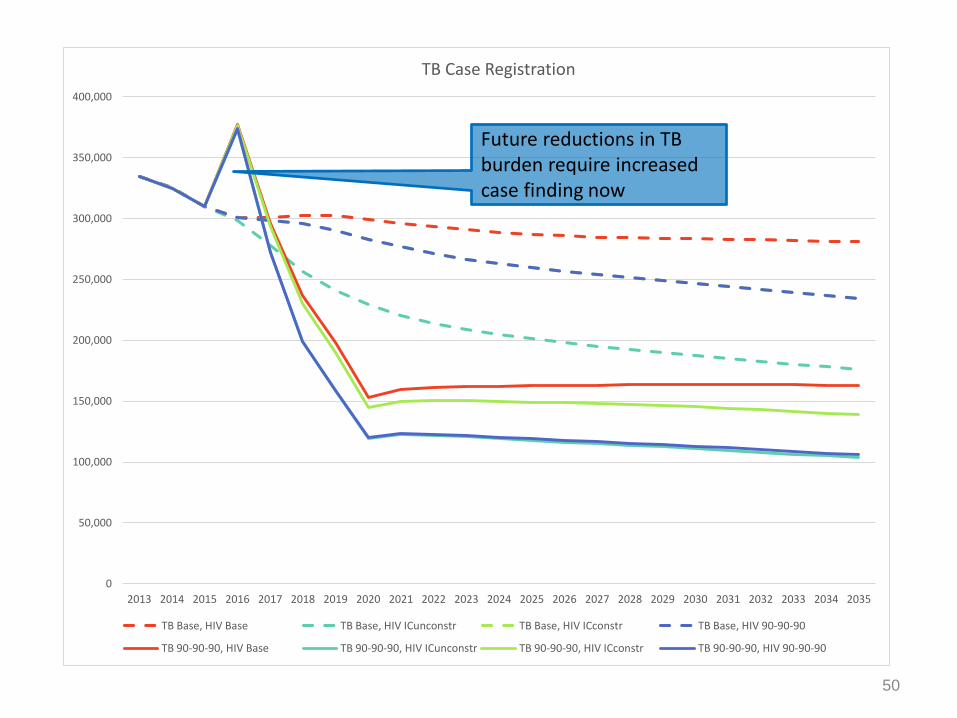
TB Case Registration
TB Base, HIV Base TB Base, HIV ICunconstr TB Base, HIV ICconstr TB Base, HIV 90-90-90
TB 90-90-90, HIV Base TB 90-90-90, HIV ICunconstr TB 90-90-90, HIV ICconstr TB 90-90-90, HIV 90-90-90
Future reductions in TB burden require increased case finding now
51
0
1,000
2,000
3,000
4,000
5,000
6,000
7,000
8,000
9,000
10,000
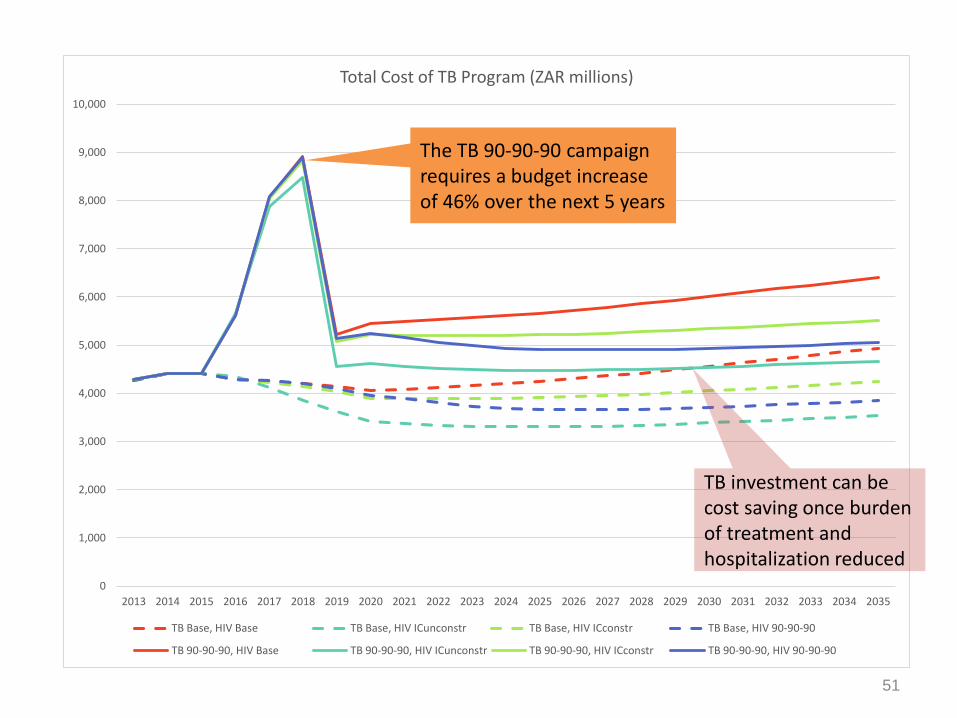
2013 2014 2015 2016 2017 2018 2019 2020 2021 2022 2023 2024 2025 2026 2027 2028 2029 2030 2031 2032 2033 2034 2035
Total Cost of TB Program (ZAR millions)
TB Base, HIV Base TB Base, HIV ICunconstr TB Base, HIV ICconstr TB Base, HIV 90-90-90
TB 90-90-90, HIV Base TB 90-90-90, HIV ICunconstr TB 90-90-90, HIV ICconstr TB 90-90-90, HIV 90-90-90
The TB 90-90-90 campaign requires a budget increase of 46% over the next 5 years
TB investment can be cost saving once burden of treatment and hospitalization reduced
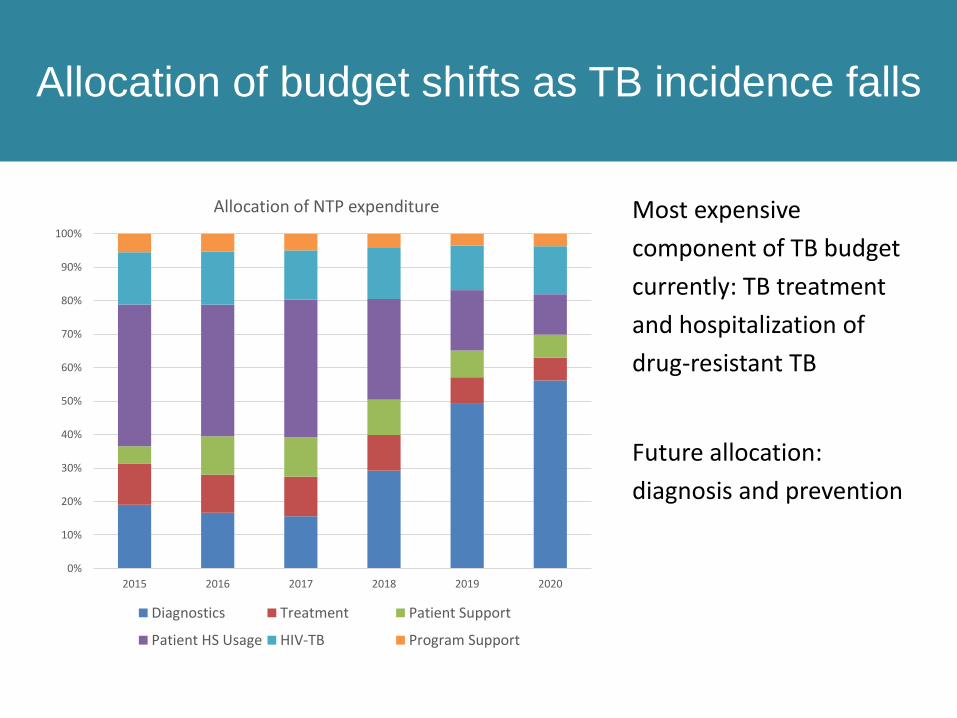
Allocation of budget shifts as TB incidence falls
Most expensive
component of TB budget
currently: TB treatment
and hospitalization of
drug-resistant TB
Future allocation:
diagnosis and prevention
0%
10%
20%
30%
40%
50%
60%
70%
80%
90%
100%
2015 2016 2017 2018 2019 2020
Allocation of NTP expenditure
Diagnostics Treatment Patient Support
Patient HS Usage HIV-TB Program Support
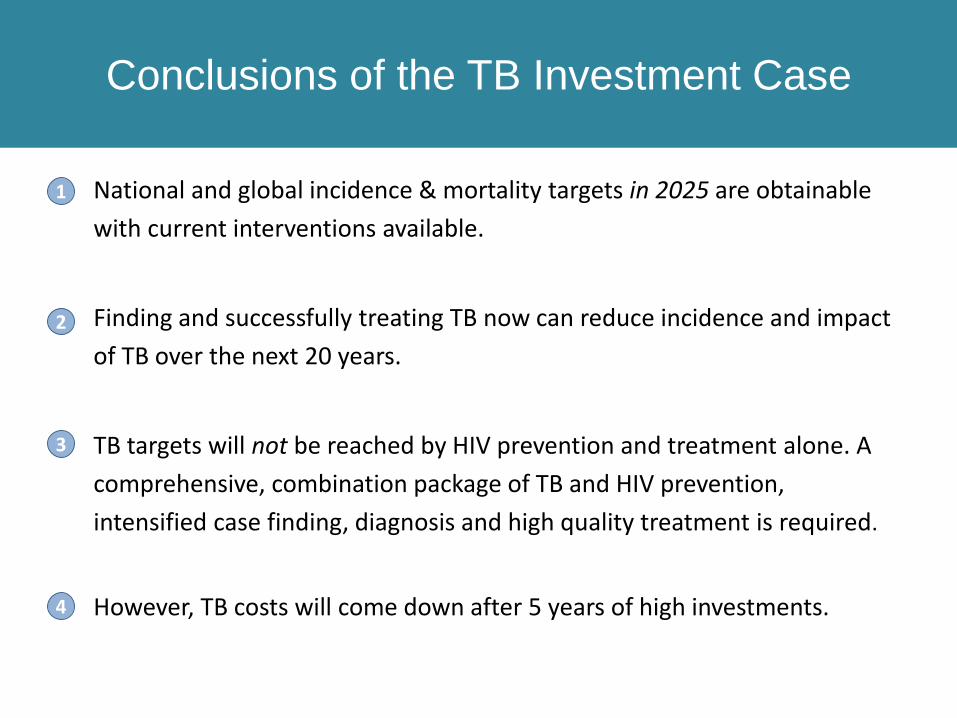
Conclusions
• National and global incidence & mortality targets in 2025 are obtainable
with current interventions available.
• Finding and successfully treating TB now can reduce incidence and impact
of TB over the next 20 years.
• TB targets will not be reached by HIV prevention and treatment alone. A
comprehensive, combination package of TB and HIV prevention,
intensified case finding, diagnosis and high quality treatment is required.
• However, TB costs will come down after 5 years of high investments.
Conclusions of the TB Investment Case
1
2
3
4

QUESTIONS?
54
Contents
The purpose and uses of the South African HIV Investment CaseIntroduction to Investment Approach: Why, and why hereEvidence review: How we knew what to includeModelling: How we projected impact and cost Results: The best buys for HIVResults: The best buys for TBExpenditure analysis: Can we afford it?Knowledge gaps and way forwardDiscussion
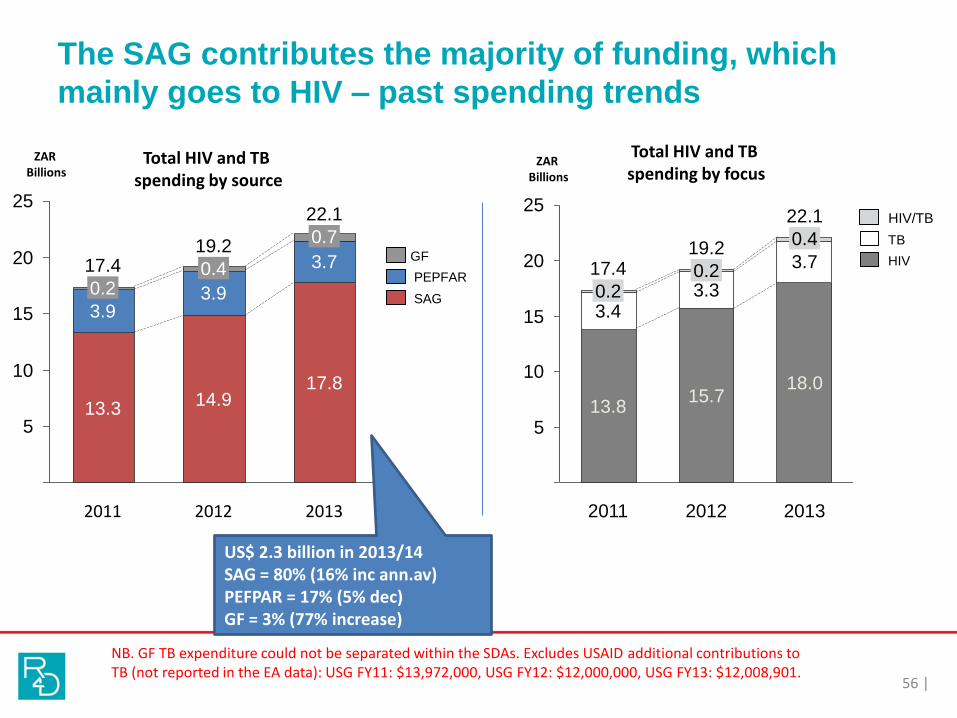
The SAG contributes the majority of funding, which
mainly goes to HIV – past spending trends
56 |
5
20
10
15
0
25
2013
17.8
22.1
3.7
3.9
0.2
0.719.2
17.4
13.3
0.4
2011
14.9
3.9
2012
GF
PEPFAR
SAG
Total HIV and TB spending by source
ZAR Billions
25
20
15
10
5
0
15.7
2011
17.43.30.2
13.8
0.23.4
3.7
2013
22.1
0.4
18.0
2012
19.2
Total HIV and TB spending by focus
ZAR Billions
TB
HIV/TB
HIV
US$ 2.3 billion in 2013/14SAG = 80% (16% inc ann.av)PEFPAR = 17% (5% dec)GF = 3% (77% increase)
NB. GF TB expenditure could not be separated within the SDAs. Excludes USAID additional contributions to TB (not reported in the EA data): USG FY11: $13,972,000, USG FY12: $12,000,000, USG FY13: $12,008,901.
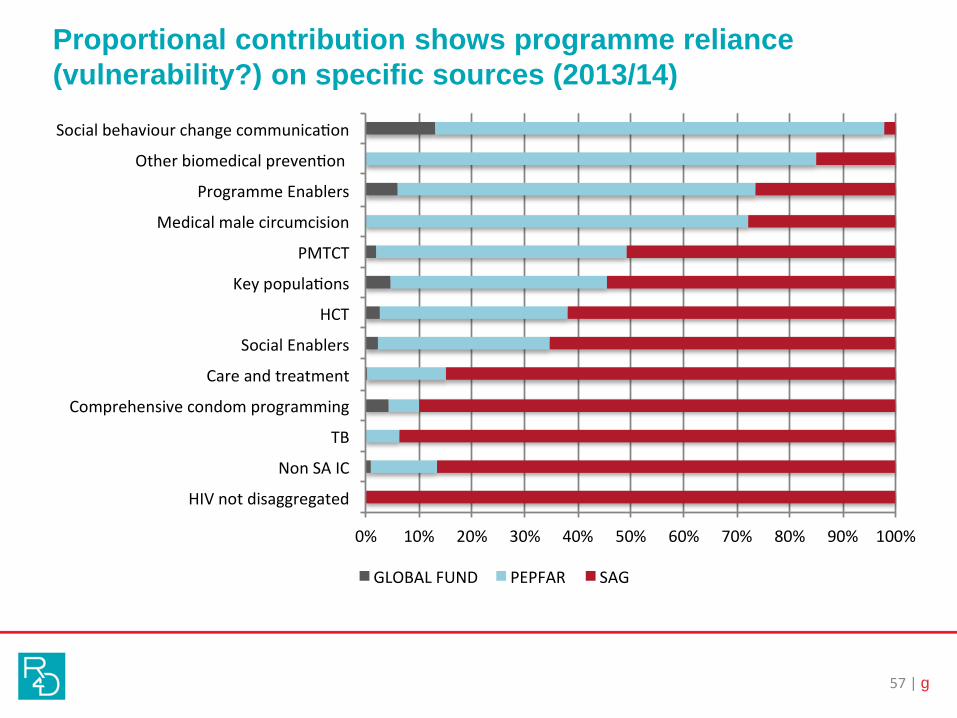
Proportional contribution shows programme reliance
(vulnerability?) on specific sources (2013/14)
57 | g
0% 10% 20% 30% 40% 50% 60% 70% 80% 90% 100%
HIVnotdisaggregated
NonSAIC
TB
Comprehensivecondomprogramming
Careandtreatment
SocialEnablers
HCT
Keypopula ons
PMTCT
Medicalmalecircumcision
ProgrammeEnablers
Otherbiomedicalpreven on
Socialbehaviourchangecommunica on
GLOBALFUND PEPFAR SAG
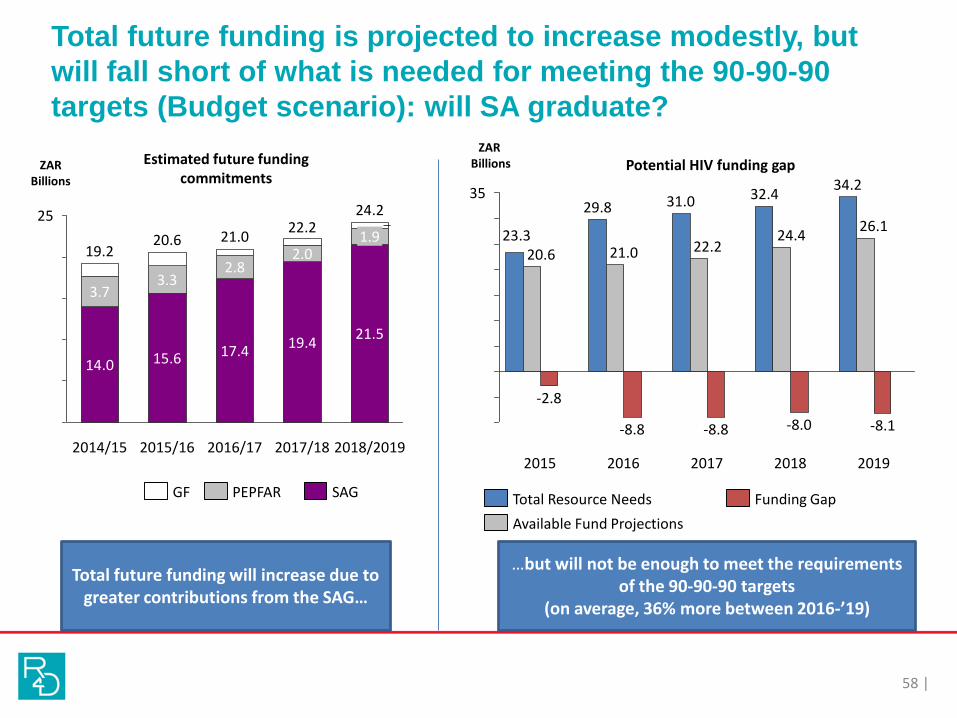
Total future funding is projected to increase modestly, but
will fall short of what is needed for meeting the 90-90-90
targets (Budget scenario): will SA graduate?
58 |
25
20
15
10
5
0
19.2
3.7
15.6
3.32.8
2014/15
14.0
2015/16
20.6 21.0
2018/2019
19.4
0.8
21.5
2017/18
2.0
24.222.2
1.9
2016/17
17.4
Total future funding will increase due to greater contributions from the SAG…
…but will not be enough to meet the requirements of the 90-90-90 targets
(on average, 36% more between 2016-’19)
35
-5
30
5
15
25
10
20
0
-10
23.3
2019
0.00.0
-2.8
31.0
2016
34.2
0.0
-8.8
0.0
2017
-8.0
21.020.6 22.2
2018
32.4
-8.1-8.8
29.826.1
2015
0.0
24.4
Total Resource Needs Funding Gap
Available Fund Projections
PEPFARGF SAG
ZARBillions
ZAR BillionsEstimated future funding
commitmentsPotential HIV funding gap

TB: Resource Needs (90-90-90) and the Potential
Funding Gap (ZAR billions, 2015-2019)
59 |
(6)
(4)
(2)
-
2
4
6
8
10
2015 2016 2017 2018 2019
ZARBillions
TotalresourcesneededforTB TBFundingprojec ons FundinggapforTBonly
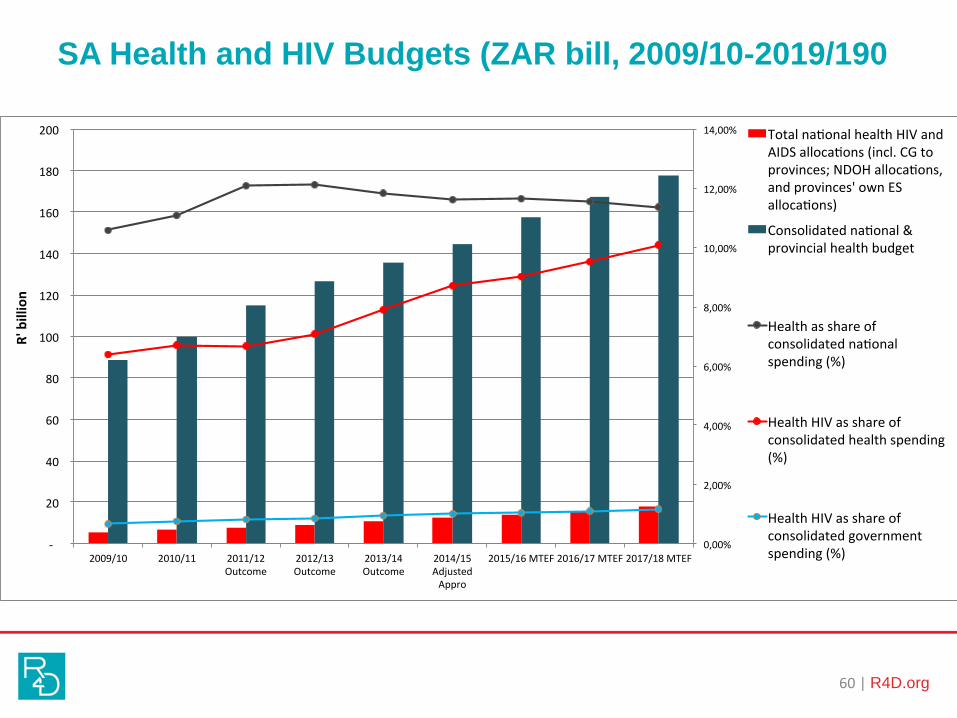
SA Health and HIV Budgets (ZAR bill, 2009/10-2019/190
60 | R4D.org
0,00%
2,00%
4,00%
6,00%
8,00%
10,00%
12,00%
14,00%
-
20
40
60
80
100
120
140
160
180
200
2009/10 2010/11 2011/12Outcome
2012/13Outcome
2013/14Outcome
2014/15AdjustedAppro
2015/16MTEF2016/17MTEF2017/18MTEF
R'billion
Totalna onalhealthHIVandAIDSalloca ons(incl.CGtoprovinces;NDOHalloca ons,andprovinces'ownESalloca ons)
Consolidatedna onal&provincialhealthbudget
Healthasshareofconsolidatedna onalspending(%)
HealthHIVasshareofconsolidatedhealthspending(%)
HealthHIVasshareofconsolidatedgovernmentspending(%)
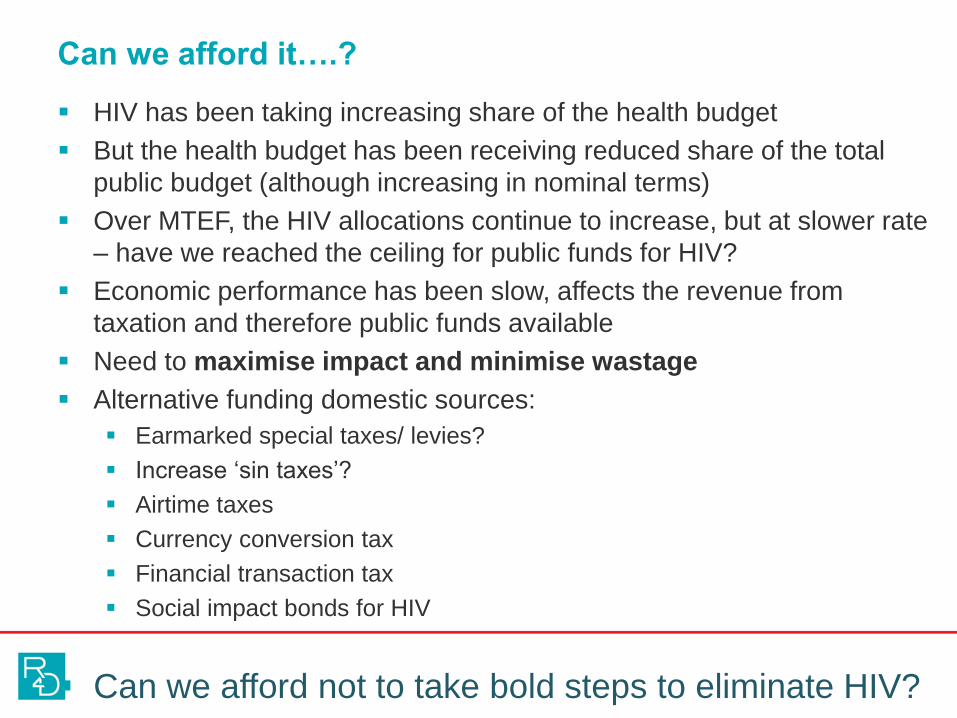
Can we afford it….?
HIV has been taking increasing share of the health budget
But the health budget has been receiving reduced share of the total
public budget (although increasing in nominal terms)
Over MTEF, the HIV allocations continue to increase, but at slower rate
– have we reached the ceiling for public funds for HIV?
Economic performance has been slow, affects the revenue from
taxation and therefore public funds available
Need to maximise impact and minimise wastage
Alternative funding domestic sources:
Earmarked special taxes/ levies?
Increase ‘sin taxes’?
Airtime taxes
Currency conversion tax
Financial transaction tax
Social impact bonds for HIV
Can we afford not to take bold steps to eliminate HIV?
Contents
The purpose and uses of the South African HIV Investment CaseIntroduction to Investment Approach: Why, and why hereEvidence review: How we knew what to includeModelling: How we projected impact and cost Results: The best buys for HIVResults: The best buys for TBExpenditure analysis: Can we afford it?Knowledge gaps and way forwardDiscussion
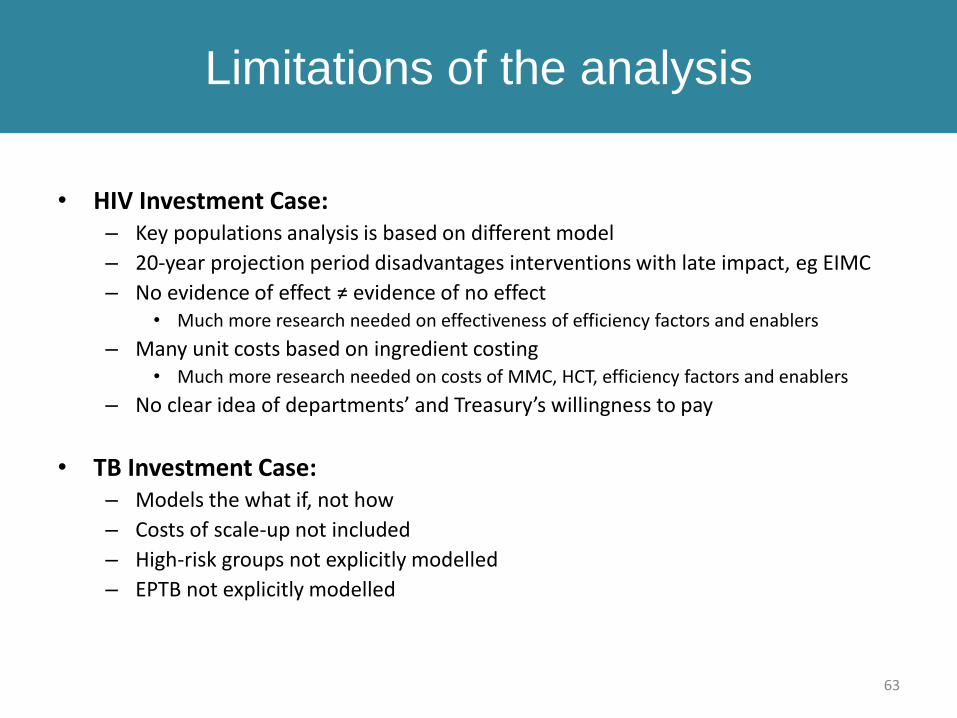
Limitations of the analysis
63
• HIV Investment Case:– Key populations analysis is based on different model
– 20-year projection period disadvantages interventions with late impact, eg EIMC
– No evidence of effect ≠ evidence of no effect • Much more research needed on effectiveness of efficiency factors and enablers
– Many unit costs based on ingredient costing• Much more research needed on costs of MMC, HCT, efficiency factors and enablers
– No clear idea of departments’ and Treasury’s willingness to pay
• TB Investment Case:– Models the what if, not how
– Costs of scale-up not included
– High-risk groups not explicitly modelled
– EPTB not explicitly modelled
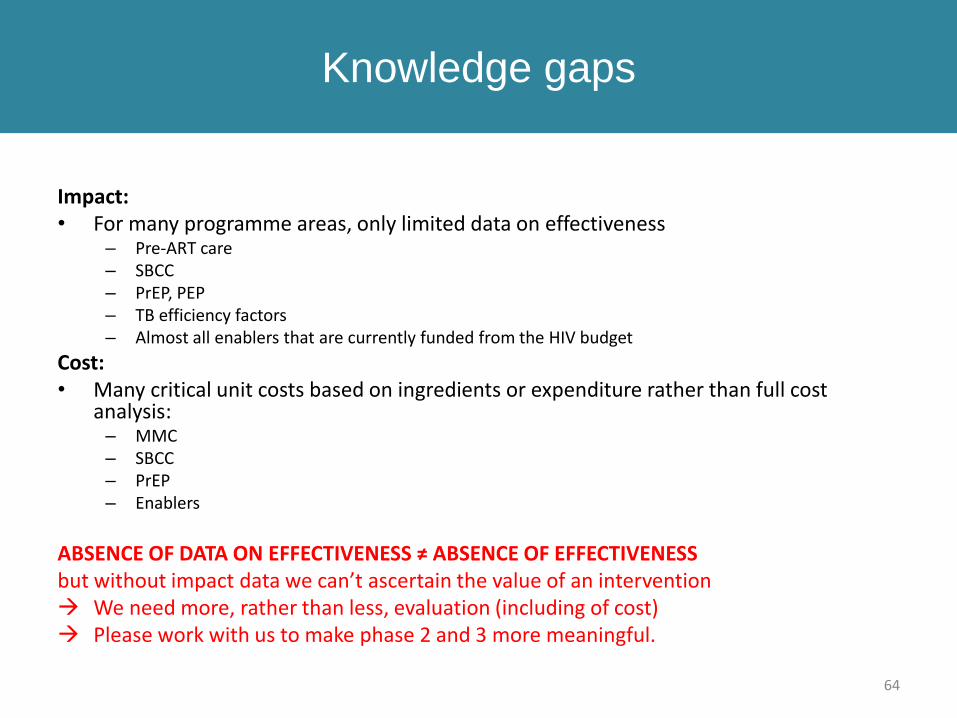
Knowledge gaps
64
Impact:• For many programme areas, only limited data on effectiveness
– Pre-ART care– SBCC– PrEP, PEP– TB efficiency factors– Almost all enablers that are currently funded from the HIV budget
Cost:• Many critical unit costs based on ingredients or expenditure rather than full cost
analysis:– MMC– SBCC– PrEP– Enablers
ABSENCE OF DATA ON EFFECTIVENESS ≠ ABSENCE OF EFFECTIVENESS but without impact data we can’t ascertain the value of an intervention We need more, rather than less, evaluation (including of cost) Please work with us to make phase 2 and 3 more meaningful.
Implementation: District Implementation Plans
and GFATM concept note
Results of the IC are used in
1. 90/90/90 HIV and TB District Implementation Plans– District-level HIV Business Plans from 2016/17 on
– Used unit cost and interventions from IC
– Phase 3 will generate district-level target populations and potentially new optimisation
2. 2015 GFATM Concept Note– Mostly for key populations services
– Used IC results for gap analysis
THE VALUE OF THE INVESTMENT CASE LIES IN WHETHER OR NOT THE RECOMMENDATIONS CAN BE IMPLEMENTED.
WE NEED ALL OF YOU FOR THIS.
65
Thanks to…
• 18 members of the Investment Case Steering
Committee
• 23 members of the Investment Case Task Team
• ~100 members of 11 sub-working groups
• ~250 participants of stakeholder workshop
• ~15 consultants and resource persons
• HE2RO, Results for Development, Right to Care, Avenir
Health and Aurum Institute for providing staff time
• USAID, SANAC, UNAIDS, GFATM, and Unicef for funding
Health Economics and Epidemiology Research Office
Wits Health Consortium University of the Witwatersrand
HE RO2
Contents
The purpose and uses of the South African HIV Investment CaseIntroduction to Investment Approach: Why, and why hereEvidence review: How we knew what to includeModelling: How we projected impact and cost Results: The best buys for HIVResults: The best buys for TBExpenditure analysis: Can we afford it?Knowledge gaps and way forwardDiscussion