south america - regional economic drivers and their global impact on the global therm process market
TRANSCRIPT

South AmericaRegional Economic Drivers and their Global Impact in the Thermal Processing Market – South America
Thomas D. Kreuzaler SECO/WARWICK do Brasil Ltda.
Jundiaí, São Paulo, Brasil

The SECO/WARWICK Group

History of SECO/WARWICK Brazil 1986 - Founded as ENGEFOR, São Paulo/SP, Brasil 1989 – furnaces for PTFE curing 1990 – License agreement with ABBOTT furnaces, USA 1991 – First continuous atmosphere sintering furnace 2000 – Steam blackening service for selected customers 2008 – construction of new plant with 5.000 m2 in Jundiaí/SP 2008 – moving 70 km from Sao Paulo City to Jundiaí/SP 2013 – SECO/WARWICK acquired 100 % of the shares of
ENGEFOR, renamed to SECO/WARWICK do Brasil Ltda.
Since 2013 – transfer of technology and productknow-how from the Group entities to Brazil

Factory in Brasil SECO/WARWICK do Brasil Ltda. in Jundiai/SP, Brazil

South America Regional Economic Drivers and their Global Impact in the Thermal Processing Market– South America
Size of South American Market – General Comments
Main Driving Industries Thermal Processing in the region
Business Conditions
Threads and Opportunities South America
Summary

South America in comparison I Large Industrial Market Sizes (USA, EU, China, India, South America w/o Japan)
Contrary to the others South America is not aharmonized and homogenous market!
Selected Markets’ GDP in106 US$
IMFFC2016 / Apr. 15
World Bank2015
United Nations2014
USA 18.558.130 18.460.646 17.348.072
European Union 16.477.211 18.460.646 18.518.430
China 11.383.030 10.866.444 10.430.590
India 2.288.720 2.073.543 2.054.941
South America 3.064.982 3.677.952 4.496.299

South America in comparison II Large Industrial Market Sizes (USA, EU, China, India, South America – without Japan)
Selected Markets’ share in % oftotal selection
IMFFC2016 / Apr. 16
World Bank2015
United Nations2014
USA 36% 34% 33%
European Union 32% 34% 35%
China 22% 20% 20%
India 4% 4% 4%
South America 6% 7% 9%

South America map

South America in detail IMarket sizes South America (GDP in 106 US$)
Country IMF FC2016 World B. 2015 UN 2014
Brazil 1.534.780 1.774.725 2.346.523
Argentina 437.856 548.055 543.490
Chile 235.419 240.216 258.062
Peru 178.643 192.084 201.809
Paraguay 26.804 30.881 30.958
Uruguay 53.145 57.471 57.471
Bolivia 33.983 32.996 32.996
Ecuador 94.014 100.917 100.917
Colombia 253.240 292.080 377.740
Venezuela 185.611 371.337 509.968
Trinidad e Tobago 23.816 28.883 28.069
Guyana 3.335 3.097 3.086
Suriname 4.336 5.210 5.210

South America in detail II Market sizes South America (% GDP of total GDP South America)
Country IMF FC2016 World B. 2015 UN 2014
Brazil 50,1% 48,3% 52,2%Argentina 14,3% 14,9% 12,1%Chile 7,7% 6,5% 5,7%Peru 5,8% 5,2% 4,5%Paraguay 0,9% 0,8% 0,7%Uruguay 1,7% 1,6% 1,3%Bolivia 1,1% 0,9% 0,7%Ecuador 3,1% 2,7% 2,2%Colombia 8,3% 7,9% 8,4%Venezuela 6,1% 10,1% 11,3%Trinidad e Tobago 0,8% 0,8% 0,6%Guyana 0,1% 0,1% 0,1%Suriname 0,1% 0,1% 0,1%
> 70%> 90% incl.

Analysis of the drivers in TP Mining and Metallurgy
Oil & Gas
Energy
Cars, Trucks and Automotive
Agricultural and Construction machinery
Aerospace & Defense
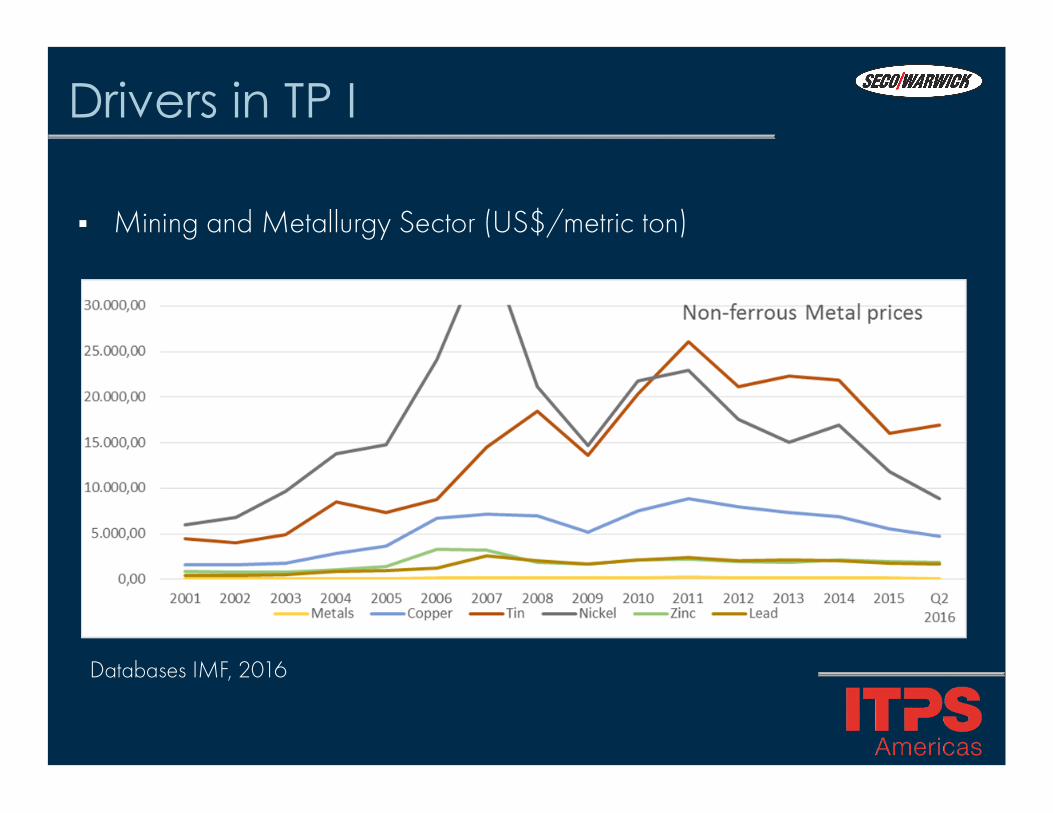
Drivers in TP I Mining and Metallurgy Sector (US$/metric ton)
Databases IMF, 2016

Drivers in TP II Mining and Metallurgy (US$/metric ton)
Databases IMF, 2016

Drivers in TP IIIMining & Metallurgy
Sector is suffering from lower worldwide demand
South America’s countries are suffering especially from the deteriorated ore prices in their balance of trade and budget incomes
Low competitiveness, unfortunate business environment (infrastructure, political conditions e.g.) and high energy prices are a hurdle for increased activities in smelting and refining of metals
Government programs for increased industrial activity have issues with funds

Drivers in TP IV Oil and Gas
Databases IMF, 2016

Drivers in TP VOil & Gas
Sector is suffering from lower worldwide demand
Oil prices are partially lower than oil production cost (Brazil pre-saldeep sea production at max. 70 US$/barrel e.g.)
High oil price of the past caused creation of various inefficiencies in South American Companies, which need to be repaired (undergoing)
Price increase in the future will accelerate the industrial activities quickly
Government funds are suffering from low budget income

Drivers in TP VIEnergy
Due to reduced industrial activities the total demand has been decreased and the supply situation has been improved
High energy cost like in Brazil and Argentina are a hurdle for energy intense industries
Most energy programs are government driven (nuclear, solar and wind energy programs) and suffer from funding
Private investors will be attracted by changes in business conditions
Demand of population will increase certainly

Drivers in TP VII Cars Production
ACEA Worldwide Production 2014/2015
Passenger cars 2014 % of total 2015 % of total
China 17.820.434 24,73% 19.172.731 26,03%North America 17.723.441 24,60% 18.241.366 24,76%Europe 13.795.840 19,15% 14.036.608 19,06%South Asia 12.341.029 17,13% 11.942.164 16,21%Japan/Korea 5.872.427 8,15% 6.096.689 8,28%South America 3.041.644 4,22% 2.642.480 3,59%Middle East/Africa 1.454.528 2,02% 1.526.183 2,07%WORLD 72.049.343 100,00% 73.658.221 100,00%

Drivers in TP VIII
ACEA Worldwide Production 2014/2015
Commercialvehicles 2014 % of total 2015 % of total
China 6.335.620 34,26% 5.653.601 31,31%North America 3.726.981 20,16% 4.016.421 22,25%Europe 2.919.493 15,79% 3.186.779 17,65%South Asia 2.309.728 12,49% 2.367.733 13,11%Japan/Korea 1.732.786 9,37% 1.701.478 9,42%South America 968.787 5,24% 683.214 3,78%Middle East/Africa 497.423 2,69% 445.787 2,47%WORLD 18.490.818 100,00% 18.055.013 100,00%
Comercial Vehicles Production

Drivers in TP IX Car & Trucks Production
OICA Worldwide Production 2014/2015, *FC2016 various sources
2014 2015 FC 2016*World 89.776.465 90.780.583 91.500.000
ARGENTINA 617.329 533.683 500.000BRAZIL 3.146.386 2.429.463 2.200.000
COLOMBIA 71.137 78.070 100.000ECUADOR 5.986 4.800 5.000VENEZUELA 19.759 18.300 15.000
TOTAL SOUTH AMERICA 3.860.597 3.064.316 2.820.000% of WORLD 4,30% 3,38% 3,08%
Drivers in TP XCars & Trucks
Declining production in Brazil as major producer/market and adaptation of production capacities radiates to all countries in South America
Reduced demand due to economic crisis in Brazil, Argentina and Venezuela
Expectation, that 2016 bottom line of demand has been hit
Production nationalizing programs (Autoinovar e.g.) require companies to invest in local production lines for imported parts
Slight improvement expected in 2017, middle term the market will return strongly due to its infrastructure demands

Drivers in TP XIAgricultural & Construction machines
Agricultural business is growing continuously and will reach new record in export in 2016
Demand in agriculture is constantly growing, but smaller companies are depending on government funding
Construction business in infrastructure has been reduced due to funding issues of government
Construction demand in private sector has lower demand due to crisis situation
BRAZIL Export 2014 Export 2015 DifferenceAgricultural 06.768 mioUS$ 06.863 MioUS$ +1,4%Other 10.726 mioUS$ 09.920 mioUS -7,5%
Brazilian Agricultural Ministry, 2016

Drivers in TP XIIAerospace & Defense EMBRAER introduced new models, FC 2016 positive, but most of the
parts are imported and the company is undergoing now a corruption investigation (“Board members approved bribes”)
SAAB Viken fighter program Brazil from 2017 with local content Investment and modernization of Defense forces suffer from government
funding A lot of smaller companies and suppliers on the path of
internationalization and standardizing. Initiatives launched.
Commercial plane deilveries 2015 2016 FCBoeing 762 planes Airbus 635 planes EMBRAER 101 planes

Drivers in TP XIIIDrivers summary
Commercial plane deilveries 2016 2017 2018+Mining and Metallurgy () Oil & Gas Energy () Cars, Trucks and Automotive () Agricultural and ConstructionMachinery
Aerospace & Defense

Business Conditions IIMD World Competitiveness Report 2016
The IMD World Competitiveness Scoreboard presents the 2016 overall rankings for 61 economies and is issued by the IMD institute in Lausanne/CH (www.imd.org). Criterias: Economic performance (83 criteria), What are the
macro-economics of the economy? Government efficiency (73 criteria) – Do government
policies are conducive to competitiveness? Business efficiency (71 criteria) - Does national
environment encourage companies to perform innovative, profitable and responsible?
Infrastructure (115 criteria) - Do basic, technological, scientific and human resources meet the need of the business?

Business Conditions IIIMD competitiveness report on selected countries
0 20000 40000 60000 80000 10000061 - Venezuela
57 - Brazil55 - Argentina
54 - Peru51 - Colombia
45 - Mexico41 - India36 - Chile
26 - Japan25 China Mainland
12 - Germany10 - Canada
3 - USA

Summary and OutlookSummary
South America’s global impact on the thermal processing market is marginal, this could change if positive signs for 2017/2018 lead to considerable growths numbers
Brazil and Argentina will remain for some time the most important economies and regional motors for the further development
Political scenarios and the corresponding business ambience are very important and are improving in the recent past
In 2016 the share of the big drivers (automotive, mining and metallurgy) is declining in South America, other (aerospace, agriculture) are not yet capable of compensating this

OutlookThreads
Overcapacities, low competitiveness and “bad economic culture” will continuously be a hurdle for substantial growth
Politic instability take the industry and foreign investments at risk
Only slowly and on a long term (2020+) the industry will return to growth
Opportunities
Political culture changes and higher commodities prices will improve the conditions rapidly
Growing internal demand in the countries will require fast growing industrial production
Investors confidence will increase investments in infrastructure and industry
Export will develop significantly Changes are quickly