south american register of aggregate defense...
TRANSCRIPT

South American Register of Aggregate Defense Expenditures
SOU
TH
AM
ERIC
AN
REG
ISTER
OF AG
GR
EGAT
E DEFEN
SE EXPEN
DIT
UR
ES
South American Register of Aggregate Defense Expenditures


SOUTH AMERICAN REGISTER OF AGGREGATE DEFENSE EXPENDITURES
2006-2010
Volume 1 • Nº 1 • Year 2014

Carlos Pellegrini 1285 (1009), Buenos Aires, Argentina.
Phone: +54-11-43117124
www.ceedcds.org.ar
Published by: Center for Strategic Defense Studies of the South American Defense Council.
South American Nations.
Bardelás, Fontana & Oteiza Design

SOUTH AMERICAN REGISTER OF AGGREGATE DEFENSE EXPENDITURES
2006-2010Center for Strategic Defense Studies
South American Defense CouncilUnion of South American Nations


7
H. E. Agustín RossiMinister of DefenseRepublic of Argentina
H. E. Rubén Aldo Saavedra SotoMinister of DefensePlurinational State of Bolivia
H. E. Celso AmorimMinister of DefenseFederative Republic of Brazil
H. E. Jorge Burgos VarelaMinister of National DefenseRepublic of Chile
H. E. Juan Carlos Pinzón BuenoMinister of National DefenseRepublic of Colombia
H. E. María Fernanda Espinosa GarcésMinister of National DefenseRepublic of Ecuador
H. E. Clement James RoheeMinister of Home A rsCooperative Republic of Guyana
H. E. Army Gen. (R) Bernardino Soto EstigarribiaMinister of National DefenseRepublic of Paraguay
H. E. Pedro Álvaro Cateriano BellidoMinister of DefenseRepublic of Peru
H. E. Lamuré Carlo Adolf LatourMinister of DefenseRepublic of Surinam
H. E. Eleuterio Fernández HuidobroMinister of National Defense Defensa NacionalOriental Republic of Uruguay
H. E. Adm. in Chief Carmen Teresa Melendez RivasMinistry of Popular Power for the DefenseBolivarian Republic of Venezuela
South American Defense Council
South American Register of Aggregate Defense Expenditures

8
Dr. Jorge Raúl Fernando FernándezSecretary of Strategy and Military A s Republic of Argentina
Army Gen. Gustavo Adolfo Sandoval EspinozaDeputy Minister of Defense and Integral Development Cooperation Plurinational State of Bolivia
Army Gen. José Carlos de NardiChief of the Joint Sta of the Armed Forces Federative Republic of Brazil
Dr. Marcos Robledo HoeckerDeputy Secretary of Defense Republic of Chile
Dr. Jorge Enrique Bedoya VizcayaViceministro de Defensa para las Políticas y Asuntos InternacionalesRepublic of Colombia
Dr. Carlos Larrea DávilaDeputy Minister of National Defense Republic of Ecuador
Dr. Roger LuncheonHead of the Presidential Secretariat and Head of the Defense BoardCooperative Republic of Guyana
Brig. Gen. (R) Victor Picagua AraujoDeputy Minister of National Defense Republic of Paraguay
Dr. Iván César Vega LoncharichDeputy Minister for Defense PoliciesRepublic of Peru
Dr. John Guno Arthur AchongDirector of DefenseRepublic of Surinam
Dr. Jorge Edgardo Menéndez CorteDeputy Secretary of National Defense Oriental Republic of Uruguay
Major Gen. Luis Eduardo Quintero MachadoDeputy Minister of Education for the DefenseBolivarian Republic of Venezuela
CEED Council of Directors
South American Register of Aggregate Defense Expenditures
9
Alfredo W. Forti, MPADirector
Gen. (R) Gerardo Miguel Ángel Maldonado Gómez.Administrative Secretary
CEED Executive O ce
Mr. Daniel RodríguezLic. Pablo GalliRepublic of Argentina
Nav. Cap. Vladimir Cesar Terrazas Montesinos (May 2013 - December 2013)Plurinational State of Bolivia Nav. Cap. Ricardo Pinheiro PadilhaCol. Miguel Luiz Kothe JannuzziFederative Republic of Brazil Mr. Jaime Concha PuigrredónMr. Fernando VelascoRepublic of Chile
Col. Carlos Hernando Gordillo Jiménez (April 2013 - February 2014)Republic of Colombia
Pablo Celi de la Torre, PhD.Republic of Ecuador
Col. Julio Macedo CrialesNav. Cap. Mario Julio Hoyos PachecoRepublic of Peru
Lt. Col. Mitchell Juliën LabadieRepublic of Surinam
Col. Daniel Legnani
Oriental Republic of Uruguay
Div. Gen. Luz Maldonado López (May 2012 - April 2014)Bolivarian Republic of Venezuela
Group of Experts - National Delegates*
Sr. Claudio Alonso
Col. Eduardo Riveros GavilánRepublic of Paraguay
* This list reflects the current National Delegates and, where applicable, the last national representative appointed.
South American Register of Aggregate Defense Expenditures


5. Conclusions
Table of Contents
BACKGROUND 19
METHODOLOGY 21
PREPARING THE REGISTER 23
2. South American Register of Defense Expenditures
2 . 1
2.2
2.3
REGIONAL DEFENSE EXPENDITURES 27
29DEFENSE EXPENDITURES WITH RELATION TO MACROECONOMIC VARIABLES
29
3. Defense Expenditures in the Region
3 . 1
3.2
3.3.1
3.3.2
DEFENSE EXPENDITURES AS A PERCENTAGE OF GROSS DOMESTIC PRODUCT (GDP)
30DEFENSE EXPENDITURES AS A PERCENTAGE OF GOVERNMENT SPENDING
1. Executive Summary
REGIONAL DEFENSE EXPENDITURES PER OBJECT 35
4. Qualitative Descriptors of Defense Expenditures
4. 1
4.2
REGIONAL EXPENDITURES ON PERSONNEL 38
REGIONAL EXPENDITURES ON OPERATIONS AND MAINTENANCE 40
REGIONAL EXPENDITURES ON INVESTMENTS 43
REGIONAL EXPENDITURES ON RESEARCH AND DEVELOPMENT 46
4. 1 . 1
4.1.2
4.1.3
4.1.4
REGIONAL DEFENSE EXPENDITURES PER INSTITUTION 48
13
17
25
33
63


Executive Summary
1


15
The South American Register of Defense Expenditures
is an instrument generated by the South American
Defense Council (CDS) as part of the Confidence Building
Measures agreed by the member countries of the Union
of South American Nations (UNASUR).
This Register is an official report on the defense
expenditures of the member countries of UNASUR,
based on a common definition of defense expenditures,
a standardized methodology for their measurement,
and a mechanism for the annual submission of their
respective information.
This Register was elaborated with the official information
submitted by the member countries.
Executive Summary
EXECUTIVE SUMMARY
�is Register is an o�cial report on the defense expenditures of the member countries of UNASUR.
South American Register of Aggregate Defense Expenditures


South American Registerof Defense Expenditures
2


19
BACKGROUND
The Register is the result of a process that started with
the Joint Declaration of the Council of Heads of State
of UNASUR (Bariloche, August 28, 2009) whereby the
Council decided “To strengthen South America as a Zone
of Peace, committing to establishing confi ce-building
mechanisms in defense and security, sustaining decisions
to abstain from reverting to threats or the use of force
against the territorial integrity of another UNASUR state”.1
Subsequently, at the Extraordinary Meeting of Foreign
and Defense Ministers of UNASUR (Quito, September
15 and November 27, 2009), the decision was made to
establish a Confidence Building Mechanism, including
specific provisions for its implementation and guarantees.
With reference to defense expenditures, an agreement
was reached to make progress in the following areas:
2.1
Register is an expression of the political will and the consensus of the twelve member countries of UNASUR.
1 Joint Declaration of the Council of Heads of State of UNASUR, Bariloche, Argentina, August 28, 2009.
SOUTH AMERICAN REGISTER OF DEFENSE EXPENDITURES
The South American Register of Defense Expenditures
is an expression of the political will and the consensus
of the twelve member countries of UNASUR in the area
of cooperation in defense. This Register also represents
a clear transparency and confidence uilding measure
that strengthens the regional integration process and
the common objective of conceiving South America as
a Zone of Peace.
With this fi issue, which regional aggregate
data, the Register not only becomes an institutional
product to be regularly updated in the area of
information on defense expenditures in the region, but
also an important input for decision-making in each
Member State and the South American Defense
Council itself.
South American Register of Aggregate Defense Expenditures
20 South American Register of Aggregate Defense Expenditures
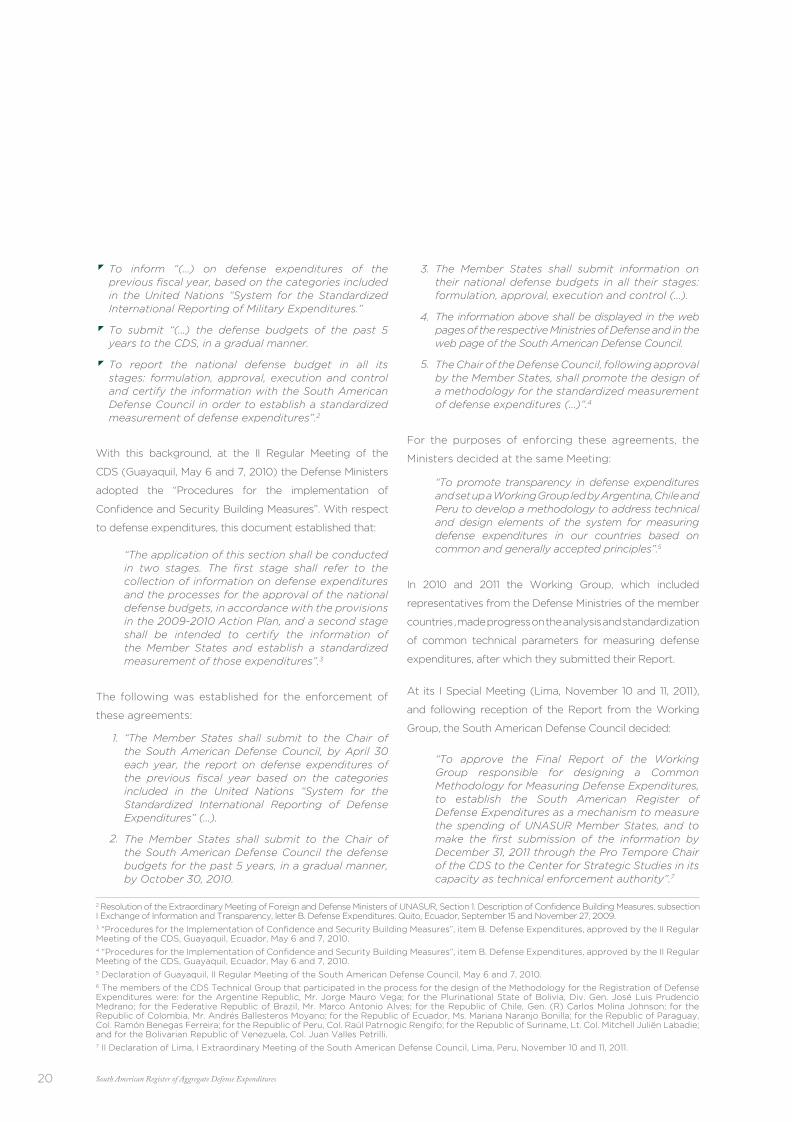
“The application of this section shall be conducted in two stages. The first stage shall refer to the collection of information on defense expenditures and the processes for the approval of the national defense budgets, in accordance with the provisions in the 2009-2010 Action Plan, and a second stage shall be intended to certify the information of the Member States and establish a standardized measurement of those expenditures”.3
The following was established for the enforcement of
these agreements:
2 Resolution of the Extraordinary Meeting of Foreign and Defense Ministers of UNASUR, Section 1. Description of Confidence Building Measures, subsection I Exchange of Information and Transparency, letter B. Defense Expenditures. Quito, Ecuador, September 15 and November 27, 2009.3 “Procedures for the Implementation of o fi and Security Building Measures”, item B. Defense Expenditures, approved by the II Regular Meeting of the CDS, Guayaquil, Ecuador, May 6 and 7, 2010.4 “Procedures for the Implementation of o fi and Security Building Measures”, item B. Defense Expenditures, approved by the II Regular Meeting of the CDS, Guayaquil, Ecuador, May 6 and 7, 2010.5 Declaration of Guayaquil, II Regular Meeting of the South American Defense Council, May 6 and 7, 2010.6 The members of the CDS Technical Group that participated in the process for the design of the Methodology for the Registration of Defense Expenditures were: for the Argentine Republic, Mr. Jorge Mauro Vega; for the Plurinational State of Bolivia, Div. Gen. José Luis Prudencio Medrano; for the Federative Republic of Brazil, Mr. Marco Antonio Alves; for the Republic of Chile, Gen. (R) Carlos Molina Johnson; for the Republic of Colombia, Mr. Andrés Ballesteros Moyano; for the Republic of Ecuador, Ms. Mariana Naranjo Bonilla; for the Republic of Paraguay, Col. Ramón Benegas Ferreira; for the Republic of Peru, Col. Raúl Patrnogic Rengifo; for the Republic of Suriname, Lt. Col. Mitchell Juliën Labadie; and for the Bolivarian Republic of Venezuela, Col. Juan Valles Petrilli.7 II Declaration of Lima, I Extraordinary Meeting of the South American Defense Council, Lima, Peru, November 10 and 11, 2011.
In 2010 and 2011 the Working Group, which included
representatives from the Defense Ministries of the member
countries , made progress on the analysis and standardization
of common technical parameters for measuring defense
expenditures, after which they submitted their Report.
At its I Special Meeting (Lima, November 10 and 11, 2011),
and following reception of the Report from the Working
Group, the South American Defense Council decided: “The Member States shall submit to the Chair of the South American Defense Council, by April 30 each year, the report on defense expenditures of the previous fiscal year based on the categories included in the United Nations “System for the Standardized International Reporting of Defense Expenditures” (…).
The Member States shall submit to the Chair of the South American Defense Council the defense budgets for the past 5 years, in a gradual manner, by October 30, 2010.
2.
1.
For the purposes of enforcing these agreements, the
Ministers decided at the same Meeting:
“To promote transparency in defense expenditures and set up a Working Group led by Argentina, Chile and Peru to develop a methodology to address technical and design elements of the system for measuring defense expenditures in our countries based on common and generally accepted principles”.5
“To approve the Final Report of the Working Group responsible for designing a Common Methodology for Measuring Defense Expenditures, to establish the South American Register of Defense Expenditures as a mechanism to measure the spending of UNASUR Member States, and to make the first submission of the information by December 31, 2011 through the Pro Tempore Chair of the CDS to the Center for Strategic Studies in its capacity as technical enforcement authority”.7
With this background, at the II Regular Meeting of the
CDS (Guayaquil, May 6 and 7, 2010) the Defense Ministers
adopted the “Procedures for the implementation of
o fi ce and Security Building Measures”. With respect
to defense expenditures, this document established that:
To inform “(…) on defense expenditures of the previous fiscal year, based on the categories included in the United Nations “System for the Standardized International Reporting of Military Expenditures.”
To submit “(…) the defense budgets of the past 5 years to the CDS, in a gradual manner.
To report the national defense budget in all its stages: formulation, approval, execution and control and certify the information with the South American Defense Council in order to establish a standardized measurement of defense expenditures”.2
The Member States shall submit information on their national defense budgets in all their stages: formulation, approval, execution and control (…).
The information above shall be displayed in the web pages of the respective Ministries of Defense and in the web page of the South American Defense Council.
The Chair of the Defense Council, following approval by the Member States, shall promote the design of a methodology for the standardized measurement of defense expenditures (…)”.4
3.
4.
5.

21
METHODOLOGY
The South American Register of Defense Expenditures is
based on a common definition of Defense Expenditures, a
standardized methodology for their measurement and an
annual mechanism for the submission of the information
from the member countries to the CEED, the technical
body responsible for its processing and publication.
In accordance with the definition adopted in the Common
Methodology for Measuring Defense Expenditures
approved by the CDS, Defense Expenditures shall mean:
“all the resources allocated by the Government for funding
the activities involved in the Nation’s external security.
It also includes the foreing assistance received for that
purpose (both monetary and non-monetary)”.8
These expenditures correspond to the Ministries of
Defense and their related bodies, the Armed Forces
and any other government agency whose function is
to defend the country against foreign threats (central
government and decentralized organizations).
2.2
Defense Expenditures shall mean: “all the resources allocated by the Government for funding the activities involved in the Nation’s external security.
8 Final Report of the Working Group for the Design of a Common Methodology for Measuring Defense Expenditures, section IV. Definition of defense expenditure, page 9.
Subsequently, the CEED, in its capacity as technical body,
submitted at the VI Meeting of the Executive Board of
the CDS (Asunción, June 4, 2012) a preliminary version
of the South American Register of Defense Expenditures
for the period 2006-2010, drafted in accordance with
the Common Methodology for Measuring Defense
Expenditures approved by the CDS and based on the
official information sent by the countries in due time.
Following, at the VIII Regular Meeting of the Executive Board
of the CDS (Lima, May 16 and 17, 2013), the CEED submitted
the fi l version of the Register containing the successive
observations, suggestions and data adjustments requested
by the member countries for its offi ial publication.
SOUTH AMERICAN REGISTER OF DEFENSE EXPENDITURES
Finally, as a result of ministerial debate on its publication
in the V Ordinary Meeting of CDS (Paramaribo, February
20, 2014), the Ministers decided "the publication of the
South American Register of Defense Expenditure
2006-2010 only with regard to regional aggregate data
in order to have a regional vision”. Consequently, in this
fi edition, the national information submitted by the
Ministries of Defense and processed as set out in the
Methodology of the South American Register of
Defense Expenditures is not published.
South American Register of Aggregate Defense Expenditures

22 South American Register of Aggregate Defense Expenditures
The South American Register of Defense Expenditures
is based on the incurred expenditures of the fi al year,
including extra-budgetary funding sources.
This common defi tion of defense expenditures excludes
those related to the internal security of the Member
States. Therefore, the expenditures of entities such
as law enforcement agencies, internal security forces
(border patrol, coast guard, etc.), civil aviation control
and maritime security agencies are not included.
The standardized methodology establishes an information
submission mechanism and a unified format by type of
expense and by defense institutions incurring the expense.
�e South American Register of Defense Expenditures is based on incurred expenditures.
The classification by object of expenditure includes:
The classification by agency executing the expenditure is:
Ministry of Defense;
Joint Staff;
Army;
Navy;
Air Force;
Others.
a.
b.
c.
d.
e.
f.
Personnel;
Operations and maintenance: consumer goods and services;
Investments: weapon systems, physical infrastructure, other equipment;
Research and Development.
1.
2.
3.
4.
�e methodology establishes an information submission mechanism and a uni�ed format by type of expense and by defense institutions incurring the expense.

23
Total Defense Expenditure: annual consolidated and accumulated amount for the year and annual variation rate during the five year period between 2006 and 2010.
Relative Defense Expenditure: measurement of the defense expenditure with reference to GDP and government spending.
Expenditure per Object: measurement of expenditure in the components a) Personnel; b) Operations and Maintenance; c) Investment; d) Research and Development.
Expenditure per Institution: considering the Ministries of Defense, Joint Staffs (or equivalent), Armed Forces (Army, Navy and Air Force) and Others if any.
1.
2.
3.
4.
With reference to the submission mechanism approved
by the CDS, by July 31 of each year, the countries shall
send to the CEED the expenditure information for the
previous fi year expressed in local currency and US
dollars (USD) at the annual average exchange rate.
For the qualitative analysis of the expenditure, the
indicators of reference shall be the defense expenditure as
a percentage of Gross Domestic Product (GDP) –nominal,
informed by the Central Banks or similar entities– and
the defense expenditure as a percentage of government
spending (both budgetary and extra-budgetary).
In the analysis, processing and submission of the
relevant information, the following criteria were taken
into account:
2.3 PREPARING THE REGISTER
The CEED, as the relevant technical body, is responsible for
the reception, consolidation, analysis, publication and storage
of the information submitted by the member countries of
the CDS. Furthermore, the CEED is in charge of proposing
the revision and/or updating of the methodology.
For this fi issue of the South American Register
of Defense Expenditures, the CEED conducted the
following actions and procedures:9
Reception of the information from the twelve member countries based on the Common Methodology;
Processing, analysis and validation of the information with each of the countries;
Meetings with the Working Group for the Design of a Common Methodology for Measuring Defense Expenditures, in order to review the information submitted by the countries in accordance with the methodology; make recommendations for the improvement of the Register; and design the criteria for the regional consolidation of the information;
Systematization of the information for submission to the CDS;
2.
3.
1.
4.
5.
SOUTH AMERICAN REGISTER OF DEFENSE EXPENDITURES
Preparation of the final version of the South American Register of Defense Expenditure that, by disposition of the V Ordinary Meeting of the CDS, will be published this time only with regard to regional aggregate data.10
9 The National Representatives to the CEED that participated in the process for the preparation of the Register were: for the Argentine Republic, Col. Gustavo Dedieu (2011-2014) and Mr. Daniel Rodríguez; for the Plurinational State of Bolivia, Nav. Cap. Oscar o o Peñaranda (2011-2012) and Nav. Cap. Vladimir Cesar Terrazas Montesinos (2013-2013); for the Federative Republic of Brazil, Col. Américo Kunio Taguchi (2011-2013), Air Col. Alípio Ávalos Lopes (2012-2014) and Nav. Cap. Ricardo Pinheiro Padilha; for the Republic of Chile, Col. Esteban Guarda Barros (2011-2012), Ms. Verónica Barrios Achavar (2012-2013), Dr. Jaime Concha Puigrredón and Mr. Fernando Velasco; for the Republic of Colombia, Col. Oscar Cardona Prada (2012-2013) and Col. Carlos Gordillo Jiménez (2013-2014); for the Republic of Ecuador, Col. Franco Ordoñez (2011-2012) and Col. Fernando Carpio (2012-2014); for the Republic of Peru, Gen. Marco Miranda Valdez (2012-2014) and Nav. Cap. Pedro Ramírez Nuques (2012-2014); for the Republic of Suriname, Lt. Col. Mitchell Juliën Labadie; for the Republic of Uruguay, Lt. Gen. Ángel Bertolotti (2011-2012) and Gen. José María Burone (2013-2013); and for the Bolivarian Republic of Venezuela, Div. Gen. Luz Maldonado López (2012-2014). 10 In the literal 3 of the Ist Paramaribo Declaration, of the V Ordinary Meeting of the South American Defense Council, Ministers decided the "publication of the South American Register of Defense Expenditures 200 2010 only with regards to aggregated regional data in order to have a regional vision".
South American Register of Aggregate Defense Expenditures


Defense Expenditures in the Region
3


27
REGIONAL DEFENSE EXPENDITURES
The Register the evolution of the ted
annual expenditures for the period 2006-2010, in
rrent and onstant dollars when indi ed, taking
2006 as the base year.
The regional defense expenditures in the period under
consideration amount to 126,032,188,000 US dollars, with an
average annual expenditure of 25,206,438,000 dollars.
3.1
�e Register re�ects the evolution of the accumulated annual expenditures for the period 2006-2010.
IN MILLION USD
IN MILLION USD
REGIONAL DEFENSE EXPENDITURES DURING THE PERIOD 2006-2010
CURRENT USD
CONSTANT USD
2010
33,176
2009
27,375
2008
27,010
2007
20,826
2006
17,645 25,206AVERAGE
GRAPH 1 //
2010
30,858
2009
25,754
2008
25,679
2007
20,239
2006
17,645 24,035AVERAGE
USD 126,032
USD 120,174
When onsidering the o t in onstant dollars, the
ted total is 120,174,393,000 dollars, with an
average annual expenditure of 24,034,879,000 dollars.
DEFENSE EXPENDITURES IN THE REGION
South American Register of Aggregate Defense Expenditures

28 South American Register of Aggregate Defense Expenditures
RELATIVE ANNUAL VARIATION RATE FOR THE REGIONAL DEFENSE EXPENDITURE IN THOUSAND DOLLARS
TABLE 1 //
TOTAL EXPENDITURES ANNUAL VARIATION
CURRENT USD CONSTANT USD
YEAR
17,644,593
20,826,253
27,010,337
27,374,774
33,176,231
126,032,188
17,644,593
20,238,920
25,678,887
25,753,828
30,858,166
120,174,399
2006
2007
2008
2009
2010
14.70%18.03%
26.88%29.69%
0.29%1.35%
19.82%21.19%
RELATIVE ANNUAL VARIATION RATE FOR THE REGIONAL DEFENSE EXPENDITURE AND GDP
GDPDEFENSE
EXPENDITURE
2006 - 2007
18.03%
23.52%
2007 - 2008
29.69%
21.20%
2008 - 2009
1.35%-2.47%
2009 - 2010
21.19% 21.00%
GDPDEFENSE
EXPENDITURE
2006 - 2007
14.70%
20.03%
2007 - 2008
26.88%
18.57%
2008 - 2009
0.29% -3.49%
2009 - 2010
19.82% 19.63%
CURRENT USD
CONSTANT USD
GRAPH 2 //
The following are the annual variations registered during the period:

DEFENSE EXPENDITURES WITH RELATION
TO MACROECONOMIC VARIABLES
The following tables and graph defense
expenditures as a of o o o
o o
The information was o o o both
the annual and the for the period
3.2
DEFENSE EXPENDITURES AS A PERCENTAGE
OF GROSS DOMESTIC PRODUCT
3.
2010
0.95%
2009
0.95%
2008
0.92%
2007
0.86%
2006
0.90% 0.92%
GRAPH 3 //
REGIONAL DEFENSE EXPENDITURE AS A PERCENTAGE OF REGIONAL GDP DURINGTHE PERIOD 2006-2010
The total South defense expenditure as a
of regional is stable throughout the
fi period, with an of This
shows that in global terms South is below other
regions in the regional defense expenditure / regional
o
total South American defense expenditure as a percentage of regional GDP is stable throughout the ve-year period, with an average of 0.92%.
EFENSE EX EN ITURES IN THE RE ION
South American Register of Aggregate Defense Expenditures

30
DEFENSE EXPENDITURES AS A PERCENTAGE
OF GOVERNMENT SPENDING
3.2.2
2010
4.15%
2009
3.96%
2008
4.18%
2007
3.91%
2006
4.20%
4.08%
AVERAGE
REGIONAL DEFENSE EXPENDITURE AS A PERCENTAGE OF REGIONAL GOVERNMENTSPENDING DURING THE PERIOD 2006-2010
GRAPH 4 //
The information contained in the following graph demostrates
that relation between regional defense expenditures and
regional government spending remains stable, with an
average factor of 4.08%, throughout the period.
South American Register of Aggregate Defense Expenditures

Qualitative Descriptors ofDefense Expenditures
4


33
REGIONAL DEFENSE
EXPENDITURES PER OBJECT
Below is the regional expenditure for the period 2006-2010
and the average annual variation rate for each of the following
components: a) Personnel; b) Operations and Maintenance;
c) Investments; and d) Research and Development.
4.1
REGIONAL ANNUAL DEFENSE EXPENDITURES IN PERCENTAGES PER OBJECT OF EXPENDITUREDURING THE PERIOD 2006-2010
AVERAGE
PERSONNEL
62.76%
57.91%
55.89%
58.46%
57.31%
58.12%
OPERATIONS ANDMAINTENANCE
22.80%
23.83%
23.15%
24.17%
23.38%
23.49%
INVESTMENTS
13.58%
17.61%
20.18%
16.48%
18.40%
17.56%
RESEARCH ANDDEVELOPMENT
0.35%
0.33%
0.61%
0.72%
0.75%
0.59%
YEAR
2006
2007
2008
2009
2010
TABLE 2 //
QUALITATIVE DESCRIPTORS OF DEFENSE EXPENDITURES
South American Register of Aggregate Defense Expenditures

34
REGIONAL DEFENSE EXPENDITURES PER OBJECT OF EXPENDITURE DURING THE PERIOD 2006-2010
GRAPH 5 //
17,648
7,213
5,677
231
2010
15,057
6,224
4,243
185
14,351
5,945
5,181
157
2008
11,720
4,823
3,563
66
2007
11,073
4,023
2,397
62
2006
19,012
7,755
6,104
248
16,004
6,616
4,510
196
2009
15,095
6,253
5,449
165
12,060
4,963
3,667
68
11,073
4,023
2,397
62
South American Register of Aggregate Defense Expenditures

35
The highest expenditures are observed in the area of
Personnel, with an average of 58.12% for the five-year
period, followed by Operations and Maintenance
(23.49%), Investments (17.56%) and Research and
Development (0.59%).
This breakdown per object reveals the fi
GRAPH 6 //
AVERAGE REGIONAL DEFENSE EXPENDITURE PER OBJECT OF EXPENDITURE FOR THE PERIOD 2006-2010
58.12% 23.49% 17.56% 0.59%
incidence of personnel expenditures throughout
the region as a percentage of the total regional
defense expenditure and the fact that “Personnel”
and “Operations and Maintenance” amount to a little
over 80% of the spending, whereas “Investments” and
“Research and Development” combined barely reach
19% of the total regional expenditure for the period.
2006
20.82% 17.22% 19.18%
2007 2008 20102009
ANALYSIS OF REGIONAL DEFENSE EXPENDITURE EXECUTED PER OBJECT DURINGTHE PERIOD 2006-2010
85.99%82.01%
79.18% 82.78%
IN MILLIONS USD
PERCENTAGE OF EXPENDITURE ON INVESTMENTSAND RESEARCH AND DEVELOPMENT
PERCENTAGE OF EXPENDITURE ON PERSONNELAND OPERATIONS AND MAINTENANCE
EXPENDITURE ON INVESTMENTSAND RESEARCH AND DEVELOPMENT
EXPENDITURE ON PERSONNELAND OPERATIONS AND MAINTENANCE
GRAPH 7 //
15,09617,002
21,34822,620
26,768
2,4593,735
5,615 4,7076,352
80.82%
14.01% 17.99%
QUALITATIVE DESCRIPTORS OF DEFENSE EXPENDITURES
South American Register of Aggregate Defense Expenditures
36
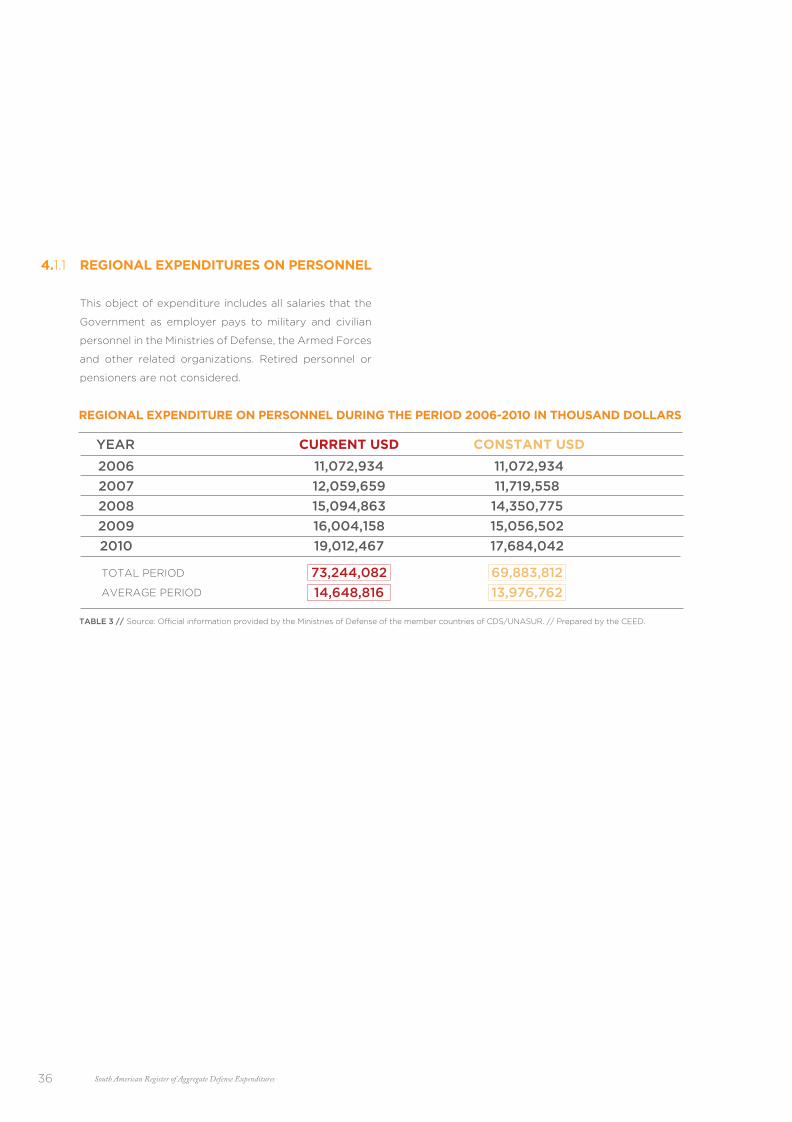
REGIONAL EXPENDITURES ON PERSONNEL
This object of expenditure includes all salaries that the
Government as employer pays to military and civilian
personnel in the Ministries of Defense, the Armed Forces
and other related organizations. Retired personnel or
pensioners are not considered.
4.1.1
REGIONAL EXPENDITURE ON PERSONNEL DURING THE PERIOD 2006-2010 IN THOUSAND DOLLARS
TABLE 3 //
CURRENT USD CONSTANT USDYEAR
11,072,934
12,059,659
15,094,863
16,004,158
19,012,467
73,244,082
14,648,816
11,072,934
11,719,558
14,350,775
15,056,502
17,684,042
69,883,812
13,976,762
2006
2007
2008
2009
2010
South American Register of Aggregate Defense Expenditures
37
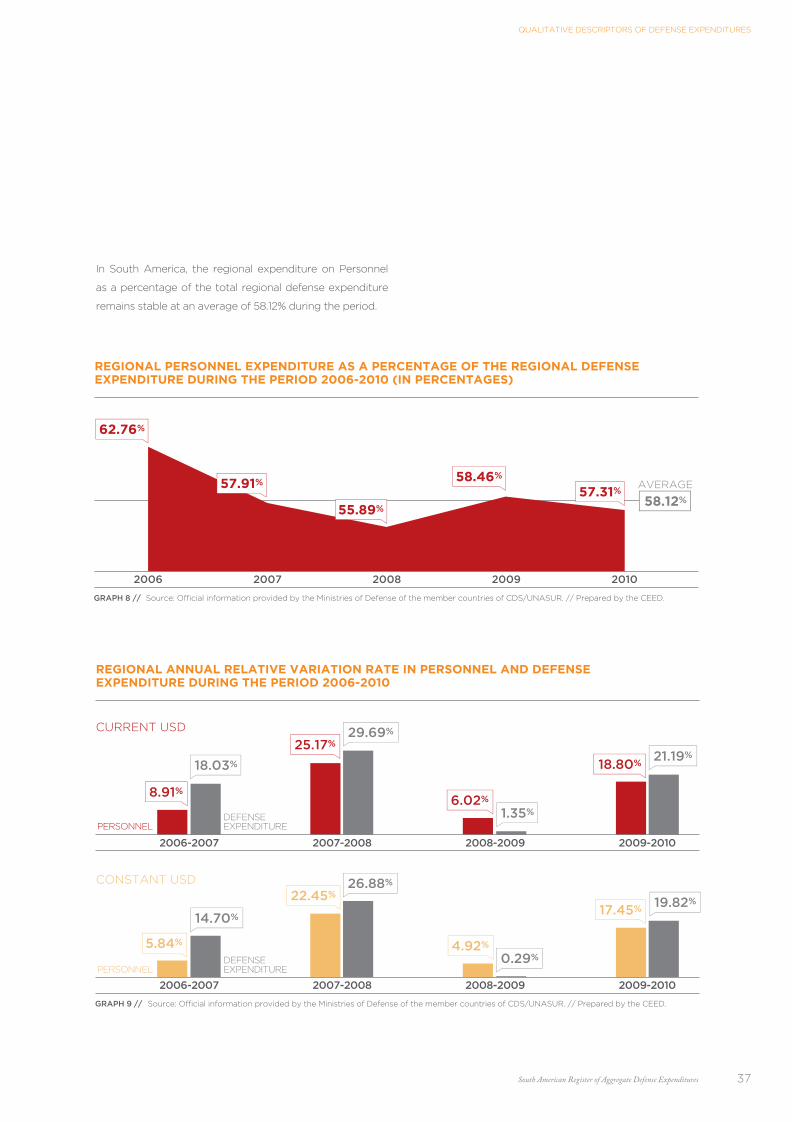
In South America, the regional expenditure on Personnel
as a percentage of the total regional defense expenditure
remains stable at an average of 58.12% during the period.
REGIONAL PERSONNEL EXPENDITURE AS A PERCENTAGE OF THE REGIONAL DEFENSEEXPENDITURE DURING THE PERIOD 2006-2010 (IN PERCENTAGES)
20102009200820072006
GRAPH 8 //
58.12%
62.76%
57.91%
55.89%
58.46%
57.31%
DEFENSEEXPENDITUREPERSONNEL
2006-2007
5.84%
18.03%
2007-2008
22.45%
29.69%
2008-2009
4.92%
1.35%
2009-2010
17.45%
21.19%
REGIONAL ANNUAL RELATIVE VARIATION RATE IN PERSONNEL AND DEFENSEEXPENDITURE DURING THE PERIOD 2006-2010
CURRENT USD
CONSTANT USD
8.91%
14.70%
25.17%
26.88%
6.02%
0.29%
18.80%
19.82%
DEFENSEEXPENDITUREPERSONNEL
GRAPH 9 //
2006-2007 2007-2008 2008-2009 2009-2010
QUALITATIVE DESCRIPTORS OF DEFENSE EXPENDITURES
South American Register of Aggregate Defense Expenditures

38
REGIONAL EXPENDITURES ON OPERATIONS AND MAINTENANCE
This object of expenditure includes all the expenditures under
the “consumer goods” and “services” sub-components. The
regional expenditure on Operations and Maintenance as a
percentage of the regional defense expenditure remains
stable at an average of 23.49% during the period.
4.1.2
REGIONAL EXPENDITURE ON OPERATIONS AND MAINTENANCE DURING THE PERIOD2006-2010 IN THOUSAND DOLLARS
TABLE 4 //
CURRENT USD CONSTANT USDYEAR
4,022,673
4,962,666
6,252,759
6,615,988
7,755,147
29,609,234
5,921,847
4,022,673
4,822,711
5,944,535
6,224,235
7,213,285
28,227,440
5,645,488
2006
2007
2008
2009
2010
23.49%
AVERAGE
REGIONAL EXPENDITURE ON OPERATIONS AND MAINTENANCE AS A PERCENTAGEOF THE REGIONAL DEFENSE EXPENDITURE DURING THE PERIOD 2006-2010 (IN PERCENTAGES)
20102009200820072006
23.38%
24.17%
23.15%
23.83%
22.80%
GRAPH 10 //
South American Register of Aggregate Defense Expenditures

39
DEFENSEEXPENDITURE
DEFENSEEXPENDITURE
OPERATIONS ANDMAINTENANCE
2006 - 2007
23.37%
18.03%
2007 - 2008
26.00%29.69%
2008 - 2009
5.81%
1.35%
2009 - 2010
17.22%21.19%
OPERATIONS ANDMAINTENANCE
2006 - 2007
19.89%
14.70%
2007 - 2008
23.26%26.88%
2008 - 2009
4.71%
0.29%
2009 - 2010
15.89%19.82%
CURRENT USD
CONSTANT USD
GRAPH 11 //
REGIONAL ANNUAL RELATIVE VARIATION RATE IN OPERATIONS AND MAINTENANCEAND DEFENSE EXPENDITURE DURING THE PERIOD 2006-2010
QUALITATIVE DESCRIPTORS OF DEFENSE EXPENDITURES
South American Register of Aggregate Defense Expenditures

40
The methodology used by the Register divides the
category of “Operation and Maintenance” into the
subcategories: “Consumer goods” and “Service”.
Consumer goods are those perishable supplies and
materials used for the current operation, including those
.sdoog latipac fo riaper dna noitavreserp eht ni deilppa
By their nature, they are intended for final consumption.
Services are those expenditures incurred for the regular
administration and operation of the Defense institutions,
including: basic consumption, leases, cleaning, technicians
and professionals, advertising, printing, commercial
and financial items, general rates, other taxes and
contributions. Taking into account the sub-components
that make up this expenditure, it is possible to say that
there is a similar distribution between consumer goods
(47.35%) and services (52.65%).
GRAPH 12 //
REGIONAL EXPENDITURE ON OPERATIONS AND MAINTENANCE BROKEN DOWNINTO SUB-COMPONENTS FOR THE PERIOD 2006-2010 (IN PERCENTAGES)
47.35% 52.65%
methodology used by the Register divides the category of “Operation and Maintenance” into the sub-categories: “Consumer goods” and “Service”.
QUALITATIVE DESCRIPTORS OF DEFENSE EXPENDITURES
South American Register of Aggregate Defense Expenditures

REGIONAL EXPENDITURES
ON INVESTMENTS
This object of expenditure includes all expenditures
corresponding to the following sub-components:
4.1.3
Weapon systems: includes the procurement and modernization of military equipment for Defense, such as combat vehicles, armored combat vehicles, large artillery systems, fighter planes and helicopters, warships, missiles and missile launchers.
Physical infrastructure: includes the expenses for facility construction (barracks, landing strips, piers and others) and the acquisition of real property.
Other equipment: includes the procurement and modernization of vehicles, aircraft, logistic support vessels, machinery and transportation equipment, health, communications, education, information technology, office supplies, furniture and large spare parts, among others. This sub-component also includes intangible assets, such as special permits and licenses.
1.
2.
3.
REGIONAL EXPENDITURE ON INVESTMENTS DURING THE PERIOD 2006-2010 IN THOUSAND DOLLARS
TABLE 5 //
CURRENT USD CONSTANT USDYEAR
2,396,798
3,666,579
5,449,401
4,510,208
6,103,913
22,126,899
4,425,380
2,396,798
3,563,175
5,180,778
4,243,144
5,677,425
21,061,321
4,212,264
2006
2007
2008
2009
2010
The regional expenditure on Investments accounts for
an average 17.56% of the regional defense expenditure
during the period 2006-2010.
object of expenditure involves all the expenditure corresponding to the following sub-components “Weapon System”, “Physical Infrastructure” and “Other equipment”.
41
QUALITATIVE DESCRIPTORS OF DEFENSE EXPENDITURES
South American Register of Aggregate Defense Expenditures

42
DEFENSEEXPENDITURES
DEFENSEEXPENDITURES
INVESTMENTS
2006 - 2007
52.98%
18.03%
2007 - 2008
48.62%
29.69%
2008 - 2009
-17.23% 1.35%
2009 - 2010
35.34%
21.19%
2006 - 2007 2007 - 2008 2008 - 2009 2009 - 2010
INVESTMENTS
48.66%
14.70%
45.40%
26.88%
-18.10% 0.29%
33.80%
19.82%
CURRENT USD
CONSTANT USD
GRAPH 14 //
REGIONAL ANNUAL RELATIVE VARIATION RATE IN INVESTMENTS AND DEFENSEEXPENDITURE DURING THE PERIOD 2006-2010
17.56%
AVERAGE
REGIONAL EXPENDITURE ON INVESTMENTS AS A PERCENTAGE OF THE REGIONAL DEFENSEEXPENDITURE DURING THE PERIOD 2006-2010 (IN PERCENTAGES)
20102009200820072006
18.40%
16.48%
20.18%
17.61%
13.58%
GRAPH 13 //
QUALITATIVE DESCRIPTORS OF DEFENSE EXPENDITURES
South American Register of Aggregate Defense Expenditures

43
According to the total expenditures for the Investments
category it shows that: 44.34% correspond to weapons
systems, 42.72% to other equipment, and 12.94% to
physical infrastructure.
WEAPON SYSTEMS
OTHER EQUIPMENT
PHYSICAL INFRASTRUCTURE
GRAPH 15 //
REGIONAL EXPENDITURE ON INVESTMENTS BROKEN DOWN INTO SUB-COMPONENTSFOR THE PERIOD 2006-2010 (IN PERCENTAGES)
42.72%
44.34%
12.94%
E
QUALITATIVE DESCRIPTORS OF DEFENSE EXPENDITURES
51.82%40.58% 37.11%
51.65%44.57%
11.14% 9.79% 7.24% 10.92%22.08%
36.96% 49.58% 55.61%37.39% 33.32%
20102009200820072006
GRAPH 16 //
ANNUAL REGIONAL EXPENDITURE ON INVESTMENTS BROKEN DOWN INTO SUB-COMPONENTSDURING THE PERIOD 2006-2010 (IN PERCENTAGES)
WEAPONSYSTEMS
PHYSICALINFRASTRUCTURE
OTHEREQUIPMENT
South American Register of Aggregate Defense Expenditures

REGIONAL EXPENDITURES ON RESEARCH AND DEVELOPMENT
Under the Reserch and Development objet of expenditures,
the methodology includes the technological development
initiatives, innovation in production for defense and the
generation of new knowledge in the area; that is, all those
actions inherent to the acquisition of new knowledge and/or
the research on its applications.
4.1.4
REGIONAL EXPENDITURE ON RESEARCH AND DEVELOPMENT DURINGTHE PERIOD 2006-2010 IN THOUSAND DOLLARS
TABLE 6 //
CURRENT USD CONSTANT USDYEAR
61,795
68,187
165,444
196,359
248,451
740,237
148,047
61,795
66,264
157,289
184,732
231,091
701,172
140,234
2006
2007
2008
2009
2010
The expenditure on Research and Development
represents an average of 0.59% of the regional defense
expenditure for the period.
0.59%
AVERAGE
REGIONAL EXPENDITURE ON RESEARCH AND DEVELOPMENT AS A PERCENTAGEOF THE REGIONAL DEFENSE EXPENDITURE DURING THE PERIOD 2006-2010 (IN PERCENTAGES)
20102009200820072006
0.75%0.72%
0.61%
0.33%0.35%
GRAPH 17 //
44 South American Register of Aggregate Defense Expenditures

DEFENSEEXPENDITURE
DEFENSEEXPENDITURE
RESEARCH ANDDEVELOPMENT
2006 - 2007
10.34% 18.03%
2007 - 2008
142.63%
29.69%
2008 - 2009
18.69%
1.35%
2009 - 2010
26.53%21.19%
2006 - 2007 2007 - 2008 2008 - 2009 2009 - 2010
RESEARCH ANDDEVELOPMENT
7.23% 14.70%
137.37%
26.88%17.45%
0.29%
25.10%19.82%
CURRENT USD
CONSTANT USD
GRAPH 18 //
REGIONAL ANNUAL RELATIVE VARIATION RATE IN RESEARCH AND DEVELOPMENT ANDDEFENSE EXPENDITURE DURING THE PERIOD 2006-2010
45
QUALITATIVE DESCRIPTORS OF DEFENSE EXPENDITURES
South American Register of Aggregate Defense Expenditures

46
REGIONAL DEFENSE EXPENDITURESPER INSTITUTION
The executing unit or the institution incurring the expense
is another aspect for the classification of the defense
expenditure under the CDS Methodology. The execution
units are: the Ministry of Defense, the Joint Staff (or
equivalents), the Army, the Navy, the Air Force and other
government agencies whose priority function is defense.
4.2
BILLION USD
20102009200820072006 TOTAL
7,916,877 8,753,973 11,484,911 12,128,417 14,080,976
3,862,366 4,780,432 5,927,860 6,856,154 9,099,789
3,970,641 5,068,730 6,617,744 6,339,296 7,242,541
1,267,607 1,417,128 2,043,467 993,655 1,152,843
54,365,153
30,526,600
29,238,953
6,874,700
2,965,873
1,749,172
GRAPH 19 //
REGIONAL ANNUAL DEFENSE EXPENDITURE PER EXECUTING UNIT DURING THE PERIOD2006-2010 IN CURRENT DOLLARS
372,560 437,215 550,145 733,900
164,151 299,613 338,340 275,293 671,777
872,054
South American Register of Aggregate Defense Expenditures

47
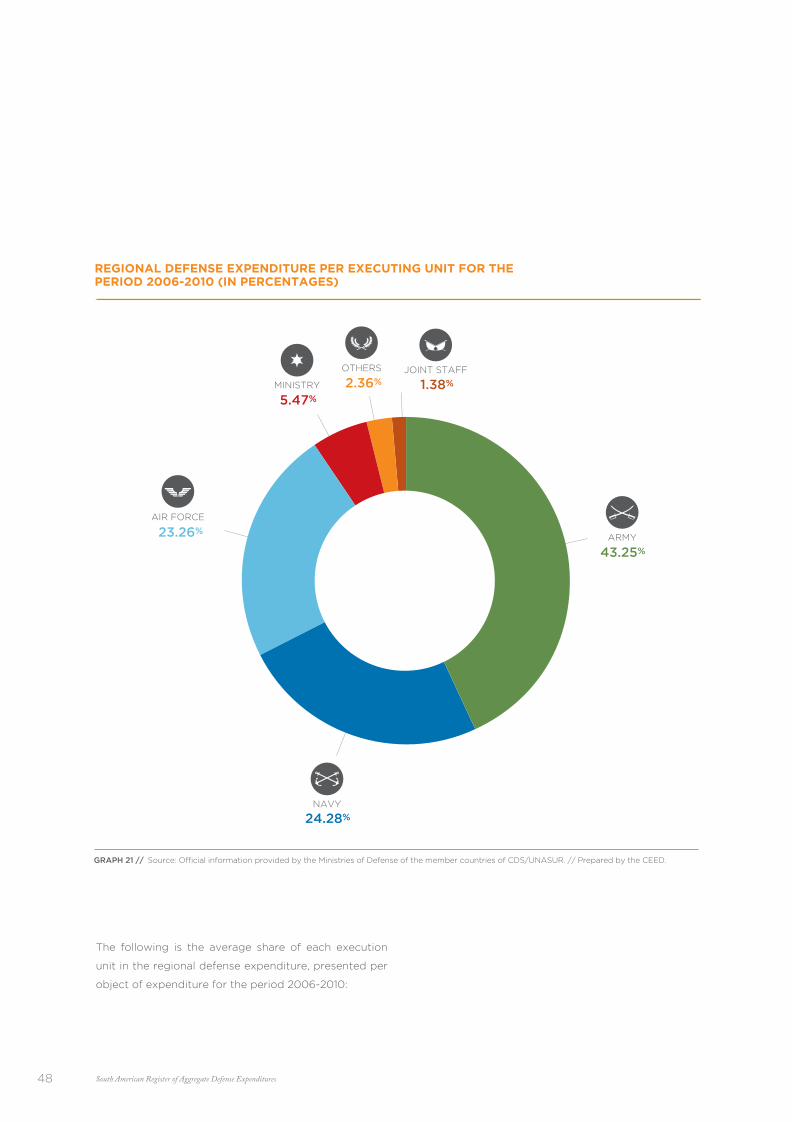
The following are the average percentages per executing
unit for the period 2006-2010: Army: 43.25%; Navy:
24.38%; Air Force: 23.26%; Ministry of Defense: 5.47%; other
agencies: 2.36%; and Joint Staff (or equivalent): 1.38%.
CONSTANT USD
CURRENT USD
GRAPH 20 //
REGIONAL DEFENSE EXPENDITURE PER EXECUTING UNIT FOR THE PERIOD 2006-2010
BILLION USD
1.75
1.65JOINT STAFF
30.53
29.06NAVY
54.37
51.85
2.97
2.82OTHERS
6.87
6.59
29.24
27.89AIR FORCE
QUALITATIVE DESCRIPTORS OF DEFENSE EXPENDITURES
South American Register of Aggregate Defense Expenditures
48
The following is the average share of each execution
unit in the regional defense expenditure, presented per
object of expenditure for the period 2006-2010:
GRAPH 21 //
REGIONAL DEFENSE EXPENDITURE PER EXECUTING UNIT FOR THE PERIOD 2006-2010 (IN PERCENTAGES)
43.25%
23.26%
5.47%
1.38%
24.28%
2.36%
South American Register of Aggregate Defense Expenditures

49
PERSONNEL OPERATION ANDMANTEINANCE
RESERCH ANDDEVELOPMENTINVESTMENTS
51.7%
23.5%
19.8%
3.5%
35.6%
20.9%
25.9%
8.7%
26.3%
30.5%
31.2%
8.0%
21.968%
49.680%
25.856%
0.019%
0.1% 3.2% 3.1% 0.004%
1.5% 5.7% 0.9% 2.508%
AVERAGE PER OBJECT EXPENDITURE PER EXECUTING UNIT FOR THE PERIOD 2006-2010
GRAPH 22 //
JOINT STAFF
NAVY
ARMY
AIR FORCE
MINISTRY
OTHERS
QUALITATIVE DESCRIPTORS OF DEFENSE EXPENDITURES
South American Register of Aggregate Defense Expenditures


Conclusions
5


53
CONCLUSIONES
The technical characteristics of the Register as measurement instrument are the following i. a common definition of “Defense Expenditures”; ii. a standardized methodology for the presentation of the information that contemplates national particularities; iii. an annual standardized mechanism for the submission of the information by the member countries; iv. an intergovernmental technical body –the CEED– that, being responsible for its elaboration, ensures representativeness, objectivity, transparency and professional rigor;
The nature of the information contained in the Register: all the data is official information from each Member State of the CDS;
a)
b)
2.
3.
The South American Register of Defense Expenditures is
the result of the decision and political will of the Member
States of the CDS-UNASUR, and it is an unprecedented
implementation of transparency and o fi
measures among the nations of South America.
Given its sensitive subject matter, the South American
Register of Defense Expenditures has a political and
institutional fi that goes beyond the scope of
the South American Defense Council and undoubtedly
becomes an achievement and reference in the regional
integration process of UNASUR.
Being a technical instrument formulated internally from
within the region, the South American Register has
distinctive characteristics and particularities that make
it more suitable than other instruments or mechanisms
existing in the world for similar purposes.
From the technical and methodological point of view,
the added value of the South American Register of
Defense Expenditures compared to any other existing
mechanism for measuring expenditures is that:
1.
4.
CONCLUSIONS5.1 The character of that information: it refers to “incurred expenses” rather than budgetary items that may not have been realized;
The matrix for the analysis and submission of the information: it incorporates various quantitative variables and qualitative descriptors of the various categories and indicators of the reference for the classification and breakdown of the expenditure;
c)
d)
Through the methodology formulated by the South
American Register of Defense Expenditures it is
possible, for the fi t time in the region, to standardize
criteria for reporting budgetary and extra-budgetary
resources allocated by each State to the defense
sector, as well as standardize the reporting of the
resources from “external extra-budgetary assistance”
(if any).
The Register, as a regular and systematic update
of the defense expenditures, implies a paramount
transparency and o fi measure
within the region, as well as a relevant institutional
product for decision making in each Member State
and the South American Defense Council itself.
With respect to the international community, the
Register of Expenditures enables UNASUR to act
in multilateral forums, through an unprecedented
fact: to submit an annual regional report of
defense expenditures to those organizations,
like the Organization of American States and the
United Nations Organization, that deal with these
issues and with which each State has assumed
commitments in the area.
5.
6.
7.
South American Register of Aggregate Defense Expenditures

54
8.
First, that the total South American defense expenditure as a percentage of regional GDP remains stable throughout the five-year period reported in the Register, at an average of 0.92%. This percentage shows that South America is ranked below other regions in the world in the regional defense expenditure / regional GDP ratio.
Second, that the components “Personnel” and “Operations and Maintenance” account for more than 80% of the regional defense expenditure, whereas the combination of the objects “Investments” and “Research and Development” does not even reach 19% of the total regional expenditure.
9.
The South American Register of Defense Expenditures
allows observing the following:
In summary, it can be said that the South American
Register of Aggregate Defense Expenditures is an
achievement on confidence-building measures and
transparency at regional level as well as a valuable
contribution of the Defense Council to consolidate South
America as a "Zone of Peace", the core objective of
UNASUR.
Defense Expenditures is a regionalpolitical and institutional achievement
of the Defense Council to consolidate South America as a “Zone of Peace”.
South American Register of Aggregate Defense Expenditures


57
GlossaryBASE YEAR
year taken as the starting point in a reference or historical series.
CONSUMER GOODSSub-component of the object of expenditure “Operations and Maintenance” that includes the expenditure incurred for materials and perishable supplies for the current operations, including those for the preservation and repair of capital goods.
CURRENT DOLLAR value of the dollar estimated, each year, in the cal goals established based on
the macroeconomic scenario, in accordance with the economic prospects, the increase in the role of taxpayers, increases in tax rates, rates, among others.
CONSTANT DOLLAR value of the current dollar excluding the variation in the currency’s purchasing
power. excludes or de rates applied in the calculation of the current dollar value.
GOVERNMENT SPENDINGMacroeconomic indicator that re the spending in the acquisition of a good or service by the institutions/entities of the central government, regional or local, funded with the National general budget.
DEFENSE EXPENDITUREAll the resources allocated by the State for funding the activities related to the Nation’s external security, including the foreign assistance received to this end.
PHYSICAL INFRASTRUCTURESub-component of the object of expenditure “Investments” that includes the spending on the construction of military facilities, as well as the acquisition of real property for the defense sector.
INVESTMENTS Object of expenditure that includes the expenses incurred on the sub-components “weapon system”, “physical infrastructure” and “other equipment”.
RESEARCH AND DEVELOPMENTObject of expenditure that includes the expenses incurred by the governments on technological development, innovation in production for defense and the generation of new knowledge.
OPERATIONS AND MAINTENANCE Object of expenditure that includes the expenses incurred in the sub-components “consumer goods” and “services”.
South American Register of Aggregate Defense Expenditures

58
OTHER EQUIPMENT Sub-component of the object of expenditure “Investments” that includes the acquisition and modernization of vehicles, aircraft, logistic support vessels, machinery and equipment, as well as intangible assets (special licenses and permits), among others.
PERSONNELObject of expenditure that includes all the salaries paid by the State as employer to the active military and civil personnel in the Ministries of Defense, Armed Forces and other agencies in the defense sector.
GROSS DOMESTIC PRODUCTMacroeconomic indicator that expresses the total value of the goods and services produced by a country in a given period (usually a year).
SERVICES Sub-component of the object of expenditure “Operations and Maintenance” that includes the expenses incurred for the regular administration and operation of the defense institutions.
WEAPON SYSTEM Sub-component of the object of expenditure “Investments” that includes the acquisition and modernization of military equipment applied to defense.
RELATIVE VARIATION RATE relative variations of a time series; they are the quotient between an absolute
variation and a measure of the size of the series.
EXECUTION UNIT Institutions in the defense sector that are involved in budget execution. execution units for this report are the following: the Ministry of Defense, the Joint Sta (or equivalent), the Army, the Navy, the Air Force and other agencies.
South American Register of Aggregate Defense Expenditures

59
List of AcronymsCDSSouth American Defense Council
CEEDCenter for Strategic Defense Studies
MODMinistry of Defense
UNUnited Nations
GDPGross Domestic Product
UNASURUnion of South American Nations
South American Register of Aggregate Defense Expenditures

60
Graph 1 - Regional defense expenditures during the period 2006-2010 . . . . . . . . . . . . . . . . . . . . . . . . . . . . . . . . . . . . . . . . . . . . . .
Graph 2 - Relative annual variation rate for the regional defense expenditure and GDP . . . . . . . . . . . . . . . . . . . . . . . . . . . . . .
Graph 3
Graph 4
Graph 5
- Regional defense expenditure as a percentage of regional GDP during the period 2006-2010 . . . . . . . . . . . . . . .
Graph 6
Graph 7
- Regional defense expenditure as a percentage of regional government spending during the period 2006-2010 . . . . .
Graph 8
Graph 9
- Regional defense expenditures per object of expenditure during the period 2006-2010 . . . . . . . . . . . . . . . . . . . .
Graph 10
- Average regional defense expenditure per object of expenditure for the period 2006-2010 . . . . . . . . . . . . . .
Graph 11
- Analysis of regional defense expenditure executed per object during the period 2006-2010. . . . . . . . . . . . . . . .
Graph 12
Graph 13
- Regional personnel expenditure as a percentage of the regional defense expenditure during the period 2006-2010 (in percentages) . .
Graph 14
- Regional annual relative variation rate in personnel and defense expenditure during the period 2006-2010. .
Graph 15
Graph 16
Graph 17
- Regional expenditure on operations and maintenance as a percentage of the regional defense expenditure during the period 2006-2010 (in percentages) . . . . . . . . . . . . . . . . . . . . . . . . . . . . . . . . . . . . . . . .
Graph 18
- Regional annual relative variation rate in operations and maintenance and defense expenditure during the period 2006-2010
Graph 19
Graph 20
- Regional expenditure on operations and maintenance broken down into sub-components for the period 2006-2010 (in percentages)
Graph 21
- Regional expenditure on investments as a percentage of the regional defense expenditure during the period 2006-2010 (in percentages)
Graph 22
- Regional annual relative variation rate in investments and defense expenditure during the period 2006-2010
- Regional expenditure on investments broken down into sub-components for the period 2006-2010 (in percentages)
- Annual regional expenditure on investments broken down into sub-components during the period 2006-2010 (in percentages)
List of Graphs27
28
29
30
34
35
35
37
37
38
39
40
42
42
43
43
44
45
46
47
48
49
- Regional expenditure on research and development as a percentage of the regional defense expenditure during the period 2006-2010 (in percentages) . . . . . . . . . . . . . . . . . . . . . . . . . . . . . . . . . . . . . . . . . . . . . . . . . .
- Regional annual relative variation rate in research and development and defense expenditure during the period 2006-2010
- Regional annual defense expenditure per executing unit during the period 2006-2010 in current dollars . . . .
- Regional defense expenditure per executing unit for the period 2006-2010 . . . . . . . . . . . . . . . . . . . . . . . . . . .
- Regional defense expenditure per executing unit for the period 2006-2010 (in percentages) . . . . . . . . . . . . . .
- Average per object expenditure per executing unit during the period 2006-2010 . . . . . . . . . . . . . . . . . . . . . . . . . .
South American Register of Aggregate Defense Expenditures

61
Table 1 - Relative annual variation rate for the regional defense expenditure in thousand dollars . . . . . . . . . . . . . . . . . . . . . . .
Table 2
Table 3
- Regional annual defense expenditures in percentages per object of expenditure during the period 2006-2010 . . . . . . . .
Table 4
- Regional expenditure on personnel during the period 2006-2010 in thousand dollars . . . . . . . . . . . . . . . . . . . . . . .
Table 5
Table 6
- Regional expenditure on operations and maintenance during the period 2006-2010 in thousand dollars . . . . . . . . .
- Regional expenditure on investments during the period 2006-2010 in thousand dollars . . . . . . . . . . . . . . . . . . . . . . . . . .
- Regional expenditure on research and development during the period 2006-2010 in thousand dollars . . . . . . .
List of Tables28
33
36
38
41
44
South American Register of Aggregate Defense Expenditures


