south asia – asean connectivity - un escap · south asia – asean connectivity ... asean-india...
TRANSCRIPT

South Asia – ASEAN Connectivity
Prabir De
ASEAN – India Centre
New Delhi
ESCAP-AITD Regional Policy Dialogue on Strengthening Connectivity in Southern Asia
19-20 November 2014, New Delhi

Growing economic ties between South Asia and Southeast and East Asia
• South Asia’s trade with Southeast and East Asia witnessed massive rise: – Increased from US$ 25 billion in 2000 to US$ 235 billion in 2013, 18% CAGR since
2000
• South Asia oldest trade partner of Southeast / East Asia – APTA (Bangkok Agreement of 1975), managed by ESCAP
– Bangladesh, India and Sri Lanka + Lao PDR, Korea and China
• India’s several bilateral FTAs and EPAs
• ASEAN-India FTA, 2010
• RCEP being negotiated
• LDC preferences
• WTO trade facilitation agreement, 2013
• Emerging production networks between South Asia and Southeast and East Asia (e.g. automobiles)
• Rising FDI between South and Southeast and East Asia
• Deeper integration - customs cooperation, ports and shipping links, sharing natural resources, maritime security, a.o

South Asia’s trade with ASEAN and ASEAN+3
Trade with ASEAN (US$ billion)
Trade with ASEAN+3 (US$ billion)
Trade share with ASEAN (%)
Trade share with ASEAN+3 (%)
2000 2010 2013 2000 2010 2013 2000 2010 2013 2000 2010 2013
India 7.13 52.70 77.49 14.57 138.23 177.17 7.67 9.19 9.94 15.67 24.09 22.72
Pakistan 1.49 6.41 6.68 3.72 18.60 25.08 7.59 9.83 8.30 18.98 28.52 31.16
Sri Lanka 1.24 3.28 4.10 2.80 5.68 9.36 10.18 14.72 12.82 23.02 25.50 29.27
SAARC 11.65 68.37 96.28 25.24 177.12 234.85 8.16 9.49 9.86 17.67 24.59 24.06
Source: DOTS, IMF

India major contributors to SAARC’s trade with ASEAN
Source: Calculated based on IMF DOTS
India’s Share in SAARC Trade

ASEAN-India trade growing, exponentially
India’s trade with ASEAN growing exponentially, 20% CAGR
US$ 7.13 billion in 2000
US$ 77.49 billion in 2013
ASEAN as India’s partner in 2013
11% export share; 9% import share
ASEAN-India FTA in goods from 2010, services + investment to be added soon.
RCEP a new hope to Asian integration; account for 21% of India’s goods export (2013)
Rise in trade in parts and components
Partner
2000 2009 2013 CAGR
(US$ billion) (%)
ASEAN 7.13 41.32 77.49 20.14
ASEAN+3 14.57 101.47 177.17 21.19
World 92.96 422.85 779.91 17.78
ASEAN
share* (%) 7.67 9.77 9.94
ASEAN+3
share* (%) 15.67 24.00 22.72 *Share in country’s total trade Source: Calculated based on DOTS, IMF

Source: De (2013)
Estimated trends in India’s trade in P&C with Southeast Asia

Emerging production networks between India and ASEAN
India’s Import of ACE from Thailand India’s Export of Yarn to Bangladesh
Case: Southeast Asia Case: South Asia
Source: De and Saha (2013) based on Kimura (2012)

Connectivity-induced production networks between India and Southeast Asia
Potentials in building production networks between India’s Northeast and Myanmar in (i) bamboo and wood products, (ii) pharmaceuticals and preparations, (iii) rubber products, (iv) food products, (v) refined petroleum products, (vi) other non-metallic mineral products, (vii) cement, and (vii) garments.
Networks in services industry between India’s Northeast and Myanmar may also take a formal shape (presently conducted informally at a lower scale) in (i) health, (ii) tourism, (iii) education, and (iv) transport and communication.
Consumer
Consumer
Consumer
EU
Myanmar
Agglomeration*
India
Headquarters or affiliates Unrelated firms with same firm nationality Unrelated firms with different firm nationality
Japan
Consumer
Consumer
USA
ASEAN
Consumer
Illustration of Future Production Networks Scenario between India and Myanmar in RMGs
Source: Drawn based on Kimura (2012)

Major milestones crossed
Sectoral Dialogue Partner,
1992
Full Dialogue Partner,
1995
Summit Level
Partner, 2002
Framework Agreement,
2003
FTA in Goods,
2009
Comme-morative Summit,
2012
Services + Investment*,
2014
*Yet to be implemented
India – ASEAN Strategic Partnership

• ASEAN – India Eminent Persons Group Report 2012 • ASEAN – India Vision Statement 2012 • ASEAN-India Summit 2013 • Two major windows:
– FTA (software) – e.g. RCEP, Single Window in Customs, a.o » Paperless trade
– Connectivity / services links (hardware) – e.g. Trilateral Highway, MIEC, a.o
» Seamless trade • Connectivity in India on two structures:
– National connectivity [DMIC, DFC, etc.] – Regional connectivity [TH, KMTTP, MIEC, etc.]
• India’s regional connectivity with ASEAN follows two axis: – North East India [multimodal + intermodal type] – Southern India [multimodal]
Connectivity is central to ASEAN-India strategic partnership

AIFTA tariff elimination schedule
ASEAN6 CLMV India
NT-1 NT-2/SL NT-1 NT-2/SL NT-1 NT-2
Jan. 2010-
Dec. 2013
(2018**)
Jan. 2010-
Dec. 2016
(2019**)
Jan. 2010-
Dec. 2018
Jan. 2010-
Dec. 2021
Jan. 2010-Dec.
2013(2018**)
Jan. 2010-Dec.
2016 (2019**)
Notes: NT: Normal Track; SL: Sensitive List **To the Philippines Source: Ministry of Commerce & Industry, Government of India

ASEAN-India FTA •Working •Services and investment to be added soon
•Bilateral trade: US$ 80 billion in 2013 (India’s export to ASEAN US$ 35 billion, India’s import from ASEAN US$ 45 billion) •Emerging value chains, slowly •Rising deficit is a matter of concern.
RCEP •Being negotiated •Target deadline: 2015(?)
Trade facilitation (e.g. Customs cooperation)
•Unilateral initiatives •WTO TFA, signed in Bali, 2013
•ASEAN single window under implementation and India’s EDI system working already •Inter-linkages must
ASEAN-India transit transport agreement
•Proposed • Target – 2016(?) •India-Myanmar-Thailand taken-up first
ASEAN-India air transport agreement
•Proposed •High imbalance between carriers; major airlines (e.g. SQ or TG) utilise 100% slots
Overland connectivity
•Trilateral highway & extension to CLV •Railway link •MIEC
•Ongoing but slow pace •Myanmar to rebuilt Yargi to Monywa •Strong backend linkages must
ASEAN-India engagement, present scenario

India’s mixed performance in logistics, but impressive improvement in time to trade
Country India
2007 2012
LPI 3.07 3.12
Customs 2.69 2.70
Infrastructure 2.90 2.91
International shipments 3.08 3.13
Logistics competence 3.27 3.16
Tracking & tracing
3.03 3.14
Timeliness 3.47 3.61
Source: World Bank
India
2006 2013
Documents to export (number) 9 9
Time to export (days) 27 16
Cost to export (US$ per container) 864 1,120
Documents to import (number) 11 11
Time to import (days) 41 20
Cost to import (US$ per container) 1,324 1,200
Source: World Bank
Logistics Performance Index Trading across Borders

Recent Development

PM’s Speech at 12th ASEAN-India Summit, 12 November 2014, NPT, Myanmar
• Improvements in trade policy and environment, and connectivity projects
– Review of FTA on goods to improve it further and implementation of FTA in services and investment
• RCEP to be inclusive and balanced
• MRAs in education (e.g. Mutual recognition of degrees)
• SPV (e.g. PDF) to facilitate project financing and implementation
• Information highways (i-ways)
• ASEAN-India solar project, space science, etc.
• Cooperation for disaster risk reduction, response and management
• Cooperation in health, traditional medicine, food security, climate change, environment and forest, skill development, tourism, etc.
Future Scenario of Trade and Barriers

India’s trade potential with ASEAN+3 likely to cross US$ 500 billion by 2020
• India and ASEAN to strengthen regional connectivity and integration, particularly through cross-border infrastructure.
*Based on an augmented gravity model

Country-wise India’s trade potential Partner 2000 2009 2012 2012 2015 2018
Actual Actual Actual Potential Potential Potential
(US$ billion)
Brunei 0.003 0.511 1.002 2.143 2.897 4.022
Cambodia 0.009 0.045 0.121 1.028 1.983 3.875
Indonesia 1.308 10.736 20.261 33.443 43.439 50.328
Lao PDR 0.005 0.021 0.168 0.845 1.439 3.023
Malaysia 1.957 8.387 14.171 27.663 34.435 38.825
Myanmar 0.227 1.405 1.875 6.308 8.983 11.559
Philippines 0.249 1.017 1.610 8.852 11.032 13.011
Singapore 2.308 12.769 22.487 26.909 31.122 35.276
Thailand 0.845 4.276 8.966 18.338 21.002 25.635
Vietnam 0.220 2.149 5.599 9.918 12.983 16.230
ASEAN 7.131 41.316 76.261 135.447 169.315 201.784
China 2.207 38.995 68.878 103.328 125.902 148.232
Japan 3.783 9.572 19.202 35.654 40.542 45.111
Korea 1.446 11.589 17.894 38.181 43.992 49.652
ASEAN+3 14.567 101.471 182.234 312.610 379.751 444.779
Source: RIS

ASEAN-India FTA: Comprehensive arrangement offers higher welfare.......
Country Only Trade
liberalization
involving all
countries
Reduction in total trade cost
before entering Indian market*
Trade liberalization plus reduction in trade
cost before entering Indian market*
10% 20% 25% 10% reduction
in trade cost
20% reduction
in trade cost
25%
reduction in
trade cost
India 1463.5 224 461 565.9 1686.6 1930.3 2040.2
Malaysia -67.7 51 96.7 121.3 -18.6 25.4 49.2
Singapore -59.8 64.8 131.9 167.8 1.6 67.3 102.6
Thailand -116.6 21.8 42.2 52.5 -99.7 -81.2 -71.7
Cambodia -1.6 -0.4 -0.7 -0.9 -2.03 -2.4 -2.70
Indonesia 809.7 24 48.3 58.8 881 918.2 934.3
Lao PDR 0.49 -0.04 -0.08 -0.10 0.5 0.5 0.46
Philippines 13.8 0.8 1.6 1.9 11.7 12.7 13.1
Vietnam 147 0.99 1.9 2.4 152 155.4 156.9
Rest of
ASEAN
142.2 4.9 9.97 12.4 151 159.6 163.7
*Reduction of export cost from individual ASEAN countries and import cost at the entry point of India Source: ASEAN-India Development and Cooperation Report 2015, based on Sikdar and Nag (2014)
(US$ million)
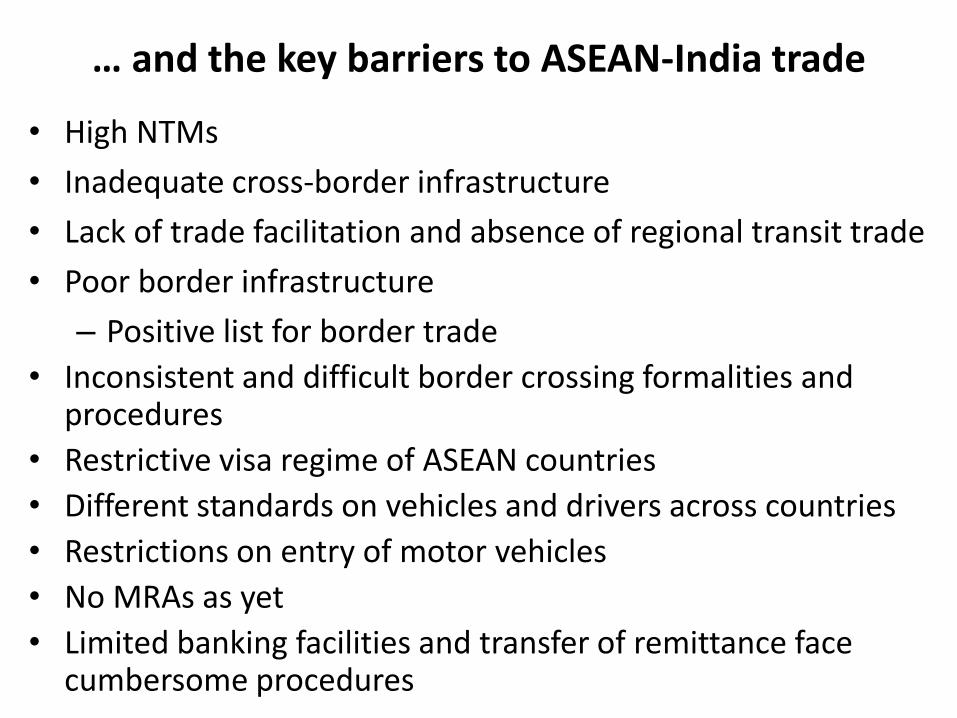
… and the key barriers to ASEAN-India trade
• High NTMs
• Inadequate cross-border infrastructure
• Lack of trade facilitation and absence of regional transit trade
• Poor border infrastructure
– Positive list for border trade
• Inconsistent and difficult border crossing formalities and procedures
• Restrictive visa regime of ASEAN countries
• Different standards on vehicles and drivers across countries
• Restrictions on entry of motor vehicles
• No MRAs as yet
• Limited banking facilities and transfer of remittance face cumbersome procedures
Connectivity Projects

National corridor projects in India National Highway Development Project (NHDP) since middle of 1990s.
– Golden Quadrilateral (GQ) project (5,846 km of highway; Delhi, Mumbai, Chennai, Kolkata, and Delhi)
– NS corridor (North-South corridor), which connects Srinagar to Kanniakumari,
– EW corridor (East-West corridor), which connects Porbandar to Silchar.
NHDP III, IV, V under implementations (about 11,000 km)
Delhi-Mumbai Industrial Corridor (DMIC)
Chennai-Ennore Port Road Connectivity Project
Chennai-Bangalore-Mumbai Industrial Corridor (CBMIC)
PRIDe (Peninsular Region Industrial Development) Corridor
Amritsar - Delhi - Kolkata Industrial Corridor (ADKIC)
Dedicated Freight Corridors (DFC)
High Speed Rail Corridor
ECEC of Asian Development Bank (ADB)*
*Proposed

National corridors, having regional implications
Source: SARD/ADB
Source: Indian Railways MIEC

Update of Major Railway Projects in India’s Northeast
State Route (length) Estd .cost (Rs. crore)
Date of completion
Arunachal Pradesh
Harmuti (Assam) to Nahariagun (33 km)
161 Completed
Meghalaya Tetelia to Shillong (138 km)
4473 Not fixed. First 30 km by March 2014
Manipur Jiribam to Imphal (125 km)
3123 March 2018
Mizoram Bhairabi to Sairang (58 km)
619 March 2015
Nagaland Dimapur to Kohima (123 km)
850 March 2015
Tripura Agartala to sabroom (110 km)
813 March 2015

1. Integrated check posts (ICP): Moreh / Tamu
2. Kaladan Multimodal Transit Transport Project – Sitwee SEZ and Port and IWT
3. India – Myanmar – Thailand Trilateral Highway and further extension to Cambodia, Lao PDR and Vietnam
– The new corridor: India-Myanmar-Lao PDR-Viet Nam-Cambodia
4. Rih – Tidim Road in Myanmar
5. Delhi – Hanoi Railway Link
6. Imphal – Mandalay bus and air services
7. Mekong – India Economic Corridor
8. India – ASEAN open sky for cargo*
9. India – ASEAN ocean shipping network*
10. India – ASEAN gas and oil pipeline*
11. India – ASEAN ICT link = i-ways?
12. Financing SPV
Some important connectivity projects
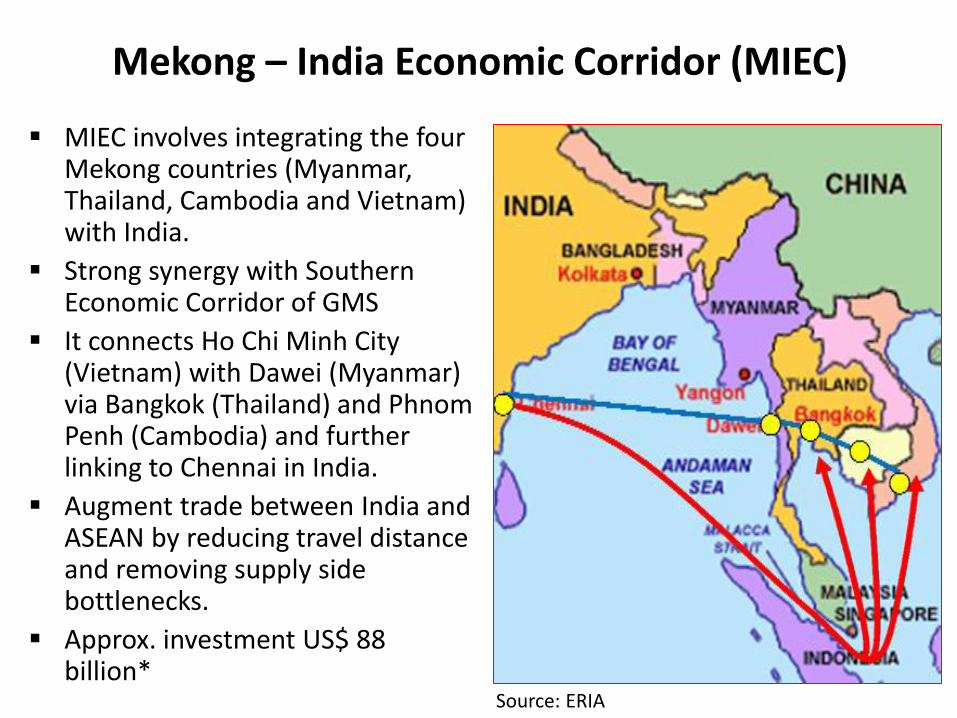
Mekong – India Economic Corridor (MIEC)
MIEC involves integrating the four Mekong countries (Myanmar, Thailand, Cambodia and Vietnam) with India.
Strong synergy with Southern Economic Corridor of GMS
It connects Ho Chi Minh City (Vietnam) with Dawei (Myanmar) via Bangkok (Thailand) and Phnom Penh (Cambodia) and further linking to Chennai in India.
Augment trade between India and ASEAN by reducing travel distance and removing supply side bottlenecks.
Approx. investment US$ 88 billion*
Source: ERIA

MIEC alignment and linking industries
Source: ERIA

MIEC – Connecting industrial space
MIEC
Phnom Penh SEZ
Sricity
Dawei SEZ
Tidel Park coimbatore
ASCENDAS IT Park
Nanguneri SEZ
Ennore SEZ
Perambalur - SEZ
Auto City SEZ
Bio - Pharmaceuticals SEZ
Bio Tech SEZ
IT & ITES SEZ
TEXTILES SEZ
Food Processing SEZ
Tamil Nadu
Karnataka
Biotech SEZ
IT/ITES SEZ
Pharmaceutical SEZ
Apparel Park
Textile and Apparel
Semiconduct SEZ
Andhra Pradesh
Bangkok Agglomerated Area
HCM Agglomerated Area
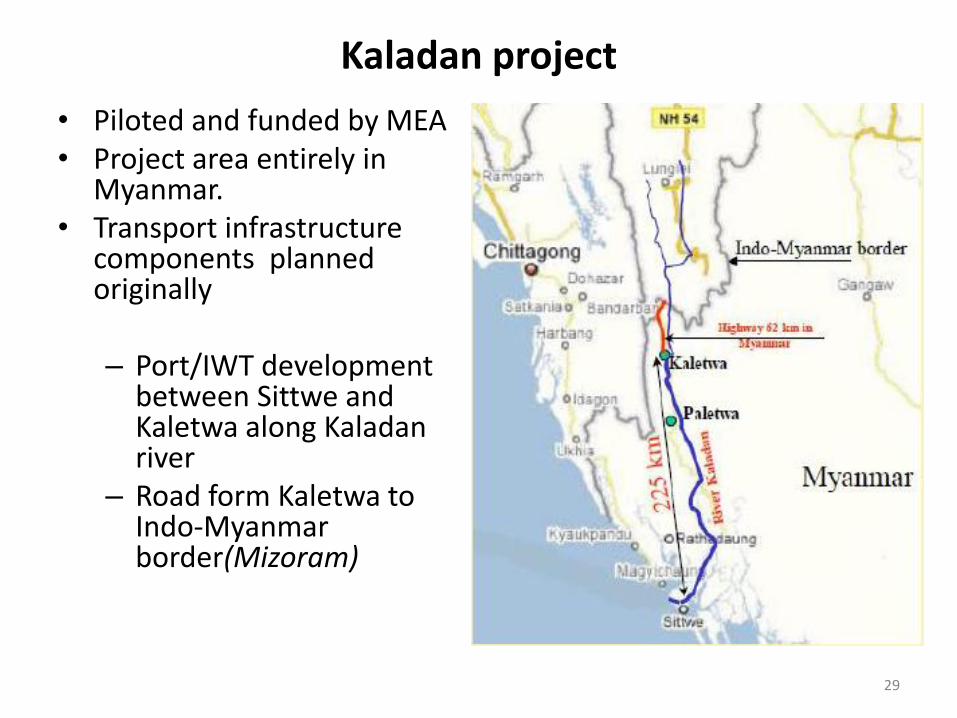
Kaladan project
• Piloted and funded by MEA • Project area entirely in
Myanmar. • Transport infrastructure
components planned originally – Port/IWT development
between Sittwe and Kaletwa along Kaladan river
– Road form Kaletwa to Indo-Myanmar border(Mizoram)
29
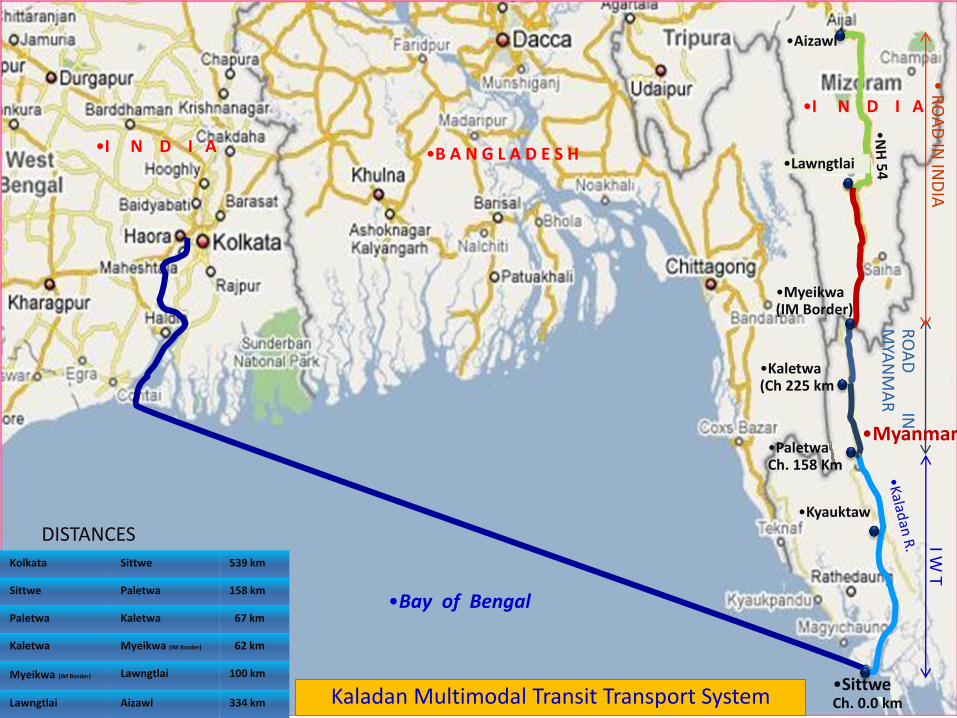
•Sittwe Ch. 0.0 km
•Paletwa Ch. 158 Km
•Kaletwa (Ch 225 km
•Myeikwa (IM Border)
•Kyauktaw
•Bay of Bengal
Kolkata Sittwe 539 km
Sittwe Paletwa 158 km
Paletwa Kaletwa 67 km
Kaletwa Myeikwa (IM Border) 62 km
Myeikwa (IM Border) Lawngtlai 100 km
Lawngtlai Aizawl 334 km
•Aizawl
•Lawngtlai •B A N G L A D E S H •I N D I A
•Myanmar
•I N D I A
Kaladan Multimodal Transit Transport System
I W T
• RO
AD
IN IN
DIA
RO
AD
IN
M
YAN
MA
R
DISTANCES
• Highway links Moreh (in India) with Mae Sot (in Thailand) through Mandalay (in Myanmar)
• The alignment of this trilateral highway falls within the AH 1 and 2, being pursued by UNESCAP.
• Border Roads Organisation (BRO) upgraded the Tamu-Kalewa-Kalemyo (TKK) road (160 km) in Myanmar at a cost of about US$ 27.28 million.
• Government of India is also responsible for upkeep of the TKK road.
• Development of new roads between Kalewa to Yargi ongoing
• Rehabilitation/ reconstruction of weak or distressed bridges
• The target deadline of opening the highway is 2016
India – Myanmar-Thailand Trilateral Highway

Trilateral Highway Alignment
Ongoing, India Govt
Myanmar Govt. under PPP
Thailand Govt.

• Two objectives – (a) to link India’s Manipur with India’s main railway corridor, and (b) to re-establish and renovate railway networks in Myanmar.
• Indian consulting engineering company, RITES, has already completed a preliminary study to establish Delhi – Hanoi railway link in 2006.
• Indian government has come forward and extended US$ 56 million credit line to the Myanmar government for upgradation of 640 km railway system between Mandalay and Yangon section.
• Indian Railways is engaged in harmonization of railway tracks in the northeastern India and also construction of new lines.
• Project under construction in Indian side: Diphu – Karong – Imphal - Moreh rail link which will link India with ASEAN. – Construction of a 98 km railway line connecting Jiribam to Imphal has already been
taken up at the cost of Rs 31 billion. The project was initiated in April 2003 and supposed to be completed by March 2014 for Jiribam-Tupul section and March 2016 for Tupul-Imphal section.
• On completion of these projects there could be possibilities for (i) India – Myanmar – Thailand – Malaysia - Singapore rail link, and (ii) India – Myanmar – Thailand – Hanoi rail link.
Delhi – Hanoi Railway Link

Delhi – Hanoi Railway Link Alignment

MANIPUR WATER RESOURCES:
BARAK RIVER , MANIPUR RIVER
LOKTAK LAKE
MOREH WATER RESOURCES:
PERENNIAL LOKCHAK RIVER FLOWING W-E
POTENTIAL FOR HYDRO POWER
GENERATION
MINERALS:
CHROMITE, LIMESTONE, IDOCRASE, ROCK
SALT
CATEGORY 1 ARAKAN OIL BASIN IN
WESTERN MARGIN OF MANIPUR
VEGETATION:
TEAK, BAMBOO, PINE, OAK
ORCHIDS, HERBS, INDEGENOUS SPECIES
MUNICIPAL AREA: 9 ELECTORAL
WARDS
PREDOMINANTLY RESIDENTIAL
AND COMMERCIAL
SETTLEMENT PATTERN IS LINEAR
ALONG THE MOREH – IMPHAL
ROAD OR NH 39.
STRUCTURES ARE SINGLE/
DOUBLE STORIED.
PREVALENT BUILDING MATERIALS:
TIMBER AND BAMBOO, ONLY FEW
RCC
MANIPUR AREA: 22327 SQ. KMS,
POPULATION: 27.22 LAKH (2011)
HILLS: KUKIS(SOUTH),NAGAS(NORTH)
VALLEY: MEITIS, MAYANG
MAYANG: TAMIL, PUNJABI, MARWARI
NEPALI, BIHARI
SEZ and Border Township at Moreh, India and Sitwee, Myanmar
• Manipur government is planning a township at Moreh (India – Myanmar border)
• Similar projects at Sitwee (Myanmar), Champai (India) also proposed

New Ports and SEZs
• India has approved building two deep sea ports, Sagar (West Bengal) and one at Andhra Pradesh (US$ 5 billion)
• Bangladesh is planning to set-up a deep sea port
• Four ports + SEZs in Myanmar – Sitwee, Kyaukphyu, Dawei, Thilawa, etc.
• Thailand is planning to set-up a port in Southern seaboard
Sagar

Emerging connectivity architecture
Source: ERIA

Key Challenges

High time to trade
020
40
60
020
40
60
020
40
60
020
40
60
2005 2010 2015 2005 2010 2015 2005 2010 2015 2005 2010 2015
Australia Brunei Darussalam Cambodia China
India Indonesia Japan Korea, Rep.
Lao PDR Malaysia Myanmar New Zealand
Philippines Singapore Thailand Vietnam
Time to export (days) Time to import (days)
No. o
f da
ys
Time to export and import (Doing Business_World Bank)
Note: Missing values were treated as zero, to have Balanced Data.

High cost of trade 0
2140
0
2140
0
2140
0
2140
2005 2010 2015 2005 2010 2015 2005 2010 2015 2005 2010 2015
Australia Brunei Darussalam Cambodia China
India Indonesia Japan Korea, Rep.
Lao PDR Malaysia Myanmar New Zealand
Philippines Singapore Thailand Vietnam
Cost to export (US$ per container) Cost to import (US$ per container)
US
$ p
er
con
tain
er
Cost to import and export (Doing Business_World Bank)
Note: Missing values were treated as zero, to have Balanced Data.

High NTMs
Overall Core Non-core
Brunei 46 29 32
Cambodia 6 4 4
Indonesia 100 45 100
Lao PDR 20 20
Malaysia 43 36 21
Myanmar 100 100 8
Philippines 100 5 100
Singapore 27 21 14
Thailand 11 4 9
Vietnam 34 22 14
ASEAN 49 27 32
Overall Core Non-core
Food 63 29 51
Cheminals 59 39 36
Light manufacturing 39 18 23
Metals 37 15 25
Machineries 48 30 33
Others 48 24 28
Thai NTM on Pharma Products (HS 3003.90)
8130: labelling; 8150: inspection
Imports of medicaments are subject to product registration, labeling, advertisement control, inspection, and quarantine requirement by the Thai FDA on the basis of public health and life protection.
Food and Drug Administration, Ministry of Public Health
(%)
Singapore NTM on Pharma Products
Technical Measures-Labeling
Labeling is required for medicines (incl. chinese proprietary medicines), poisons and cosmetic products for reasons of public health and safety.
Medicines Act (Chapter 176) - Health Products Regulation Group

TBT measures under the AIFTA: 2000 to 2013 (HS 4 digit Products)
13
166
312
225
394
224
161
462
366
11
101
72
48
28
51
42
10
41
184
62
32
76
69
0 100 200 300 400 500 600
Brunei
Cambodia
India
Indonesia
Lao
Malaysia
Myanmar
Philippines
Singapore
Thailand
Vietnam
TBT Barriers and Tariff Categorisation
Complete Preferential Access No Prerential Access Partial Preferential Access
Source: ASEAN-India Development and Cooperation Report 2015, based on Kallummal (2014)

SPS measures under the AIFTA: 2000 to 2013 (HS 4 digit Products)
203
130
191
17
95
110
344
185
315
5
89
44
7
72
1
44
12
1
9
55
17
18
39
24
0 50 100 150 200 250 300 350
Brunei
Cambodia
India
Indonesia
Lao
Malaysia
Myanmar
Philippines
Singapore
Thailand
Vietnam
TBT Barriers and Tariff Categorisation: AIFTA
Complete Preferential Access No Prerential Access Partial Preferential Access
Source: ASEAN-India Development and Cooperation Report 2015, based on Kallummal (2014)

Cumbersome trade procedures
• Manual customs operation at border crossings – Building a common
template for running and maintenance of transport corridor(s) and MRA on value added services.
– MRAs have to be signed on motor vehicles, driving license, vehicle certificates, insurance, etc.
Source: ADB

Three major challenges faced by India (and also other South Asian
countries) with ASEAN in trade exchange

1. Lack of connectivity holding back South and Southeast Asian integration
• Geographically adjacent
– Landlocked – 3 (SA), 1 (SEA)
• National connectivity ends just before land border
• Rising trade not supported by physical connectivity stock
• High trade potential, but largely unrealized
• Improved connectivity and trade facilitation can unlock the trade potential
Source: De (2012)

2. Growing ICT gap between South Asia and Southeast Asia in dealing trade
3.50 days 1.50 days
Export of Orange by Bhutan to Bangladesh Labour Permit Work Permit
Source: ADB/ESCAP (2013)

• Countries in South Asia don’t have regional transit.
• Transit would lead to generate cross-border production networks in South Asia (e.g. food processing, T&C, etc.)
• Is GMS a template to follow?
3. Seamless movement of goods is yet to happen in South Asia, whereas Southeast Asia has gone
ahead

Recommendations

Key actions on soft infrastructure
ASEAN-India Transit Transport Agreement (AITTA)
– Transit and Paperless Trade
– Transit agreement between Thailand-Myanmar-India to start with
– India – Myanmar bilateral agreement for customs and standard operating procedures
Border customs harmonization
Simplification of customs documentations
ESCAP –ADB trade facilitation project (e.g. SCBTM)
ESCAP Trade facilitation monitoring (BPA+, TTFPM, etc.)

More shipping routes between ASEAN and India
Source: ASEAN-India Connectivity Report, ASEAN-India

• Consolidation of FTAs needed – RCEP is correct step forward, but it has to be inclusive and
balanced.
• Trade liberalization must be supplemented by trade facilitation including transit – Streamlining NTMs – Paperless trade
• Value added services of connectivity crucial for economic integration and RVC – Economic corridor – Transit agreement – Air and maritime transport liberalization
• An integrated action plan for achieving a larger common market by 2020 is required.
Concluding Remarks

Thanaleng (Lao PDR) and Nonkhai (Thailand)
