south australian national pollutant inventory · south australian national pollutant inventory...
TRANSCRIPT
South AustralianNational Pollutant Inventory
SUMMARY REPORT
ADELAIDE AND REGIONAL AIRSHEDS
AIR EMISSIONS STUDY 1998�99
Prepared by Dr Jolanta Ciuk
Environment Protection AuthoritySouth Australia
South Australian NPI Summary ReportAdelaide and regional airsheds air emissions study 1998�99
This document is a summary of the NPI aggregated air emissions estimated in the South Australianairsheds for 1998�99. Aggregate and industry reported emissions data are accurate at the time ofprinting.
Author: Dr Jolanta Ciuk
For further information please contact:
Information OfficerEnvironment Protection AuthorityGPO Box 2607Adelaide SA 5001
Telephone: (08) 8204 2004Facsimile: (08) 8204 9393Freecall (country): 1800 623 445
E-mail: [email protected] site: www.epa.sa.gov.au
ISBN 1 876562 37 4JUNE 2002
© Environment Protection Authority
This document may be reproduced in whole or part for the purposes of study or training, subject to theinclusion of an acknowledgement of the source and its not being used for commercial purposes or sale.Reproduction for purposes other than those given above requires the prior written permission of theSouth Australian Environment Protection Authority.
Printed on recycled paper

iii
Contents
Executive summary ix
Introduction ix
Background ix
Airsheds ix
Air emission sources x
Results x
Key conclusions and recommendations xi
Section 1: Introduction 1
1.1 Study areas�airsheds 2
1.2 Air emission sources 10
1.3 Domestic survey 11
Section 2: Mobile sources 12
2.1 Aeroplanes 12
2.2 Motor vehicles 18
2.3 Railways 22
2.4 Recreational boating 26
2.5 Shipping and commercial boating 31
Section 3: Area-based sources 36
3.1 Architectural surface coatings 36
3.2 Cutback bitumen 39
3.3 Domestic and commercial solvent and aerosol use 42
3.4 Domestic gas fuel 45
3.5 Dry cleaning 48
3.6 Lawn mowing 50
3.7 Motor vehicle refinishing 53
3.8 Paved roads 56
3.9 Printing and graphic arts 59
3.10 Service stations 61
3.11 Solid fuel burning (domestic) 64
Section 4: Sub-reporting threshold facilities 67
4.1 Fuel combustion 67
4.2 Industrial solvents 71
Section 5: Results summary 74
5.1 Results 74
Reference 108
iv
Figures
Figure 1 South Australian airsheds map 2
Figure 2 Adelaide airshed map 4
Figure 3 Barossa airshed map 5
Figure 4 Port Lincoln airshed map 6
Figure 5 Riverland airshed map 7
Figure 6 South East airshed map 8
Figure 7 Spencer Gulf airshed map 9
Figure 8 Airport locations within the Adelaide airshed 13
Figure 9 Airport location within the Port Lincoln airshed 14
Figure 10 Airport location within the South East airshed 15
Figure 11 Airport locations within the Spencer Gulf airshed 16
Figure 12 Adelaide airshed�motor vehicle VOC emissions 95
Figure 13 Adelaide airshed�other mobile VOC emissions 95
Figure 14 Adelaide airshed�area-based VOC emissions 96
Figure 15 Adelaide airshed�sub-threshold facilities VOC emissions 96
Figure 16 Comparisons of emission sources based on the relative percentage of occurrence in eachairshed 100
Figure 17 Comparison of individual source emissions within the area-based source category 101
Figure 18 Comparison of substances emitted by the three main source category types: mobile, area-based and industry 102
Figure 19 Comparison of NPI substance emissions by source in the Adelaide airshed 103
Figure 20 Comparison of NPI substance emissions by source in all regional airsheds combined 103
Figure 21 Comparison of NPI substance emissions by source in the Barossa airshed 104
Figure 22 Comparison of NPI substance emissions by source in the Port Lincoln airshed 104
Figure 23 Comparison of NPI substance emissions by source in the Riverland airshed 105
Figure 24 Comparison of NPI substance emissions by source in the South East airshed 105
Figure 25 Comparison of NPI substance emissions by source in the Spencer airshed 106
Figure 26 Annual airshed emissions of selected NPI substances, in kilograms per capita 107
v
Tables
Executive Tables
Table E1 Emissions from sources (%) within the Adelaide airshed (in descending order of totalemissions) xiv
Table E2 Emissions from sources (%) within the regional airsheds combined (in descending orderof total emissions) xvi
Table E3 Percentage contribution by source to the total emission of NPI substances in the Adelaideairshed xviii
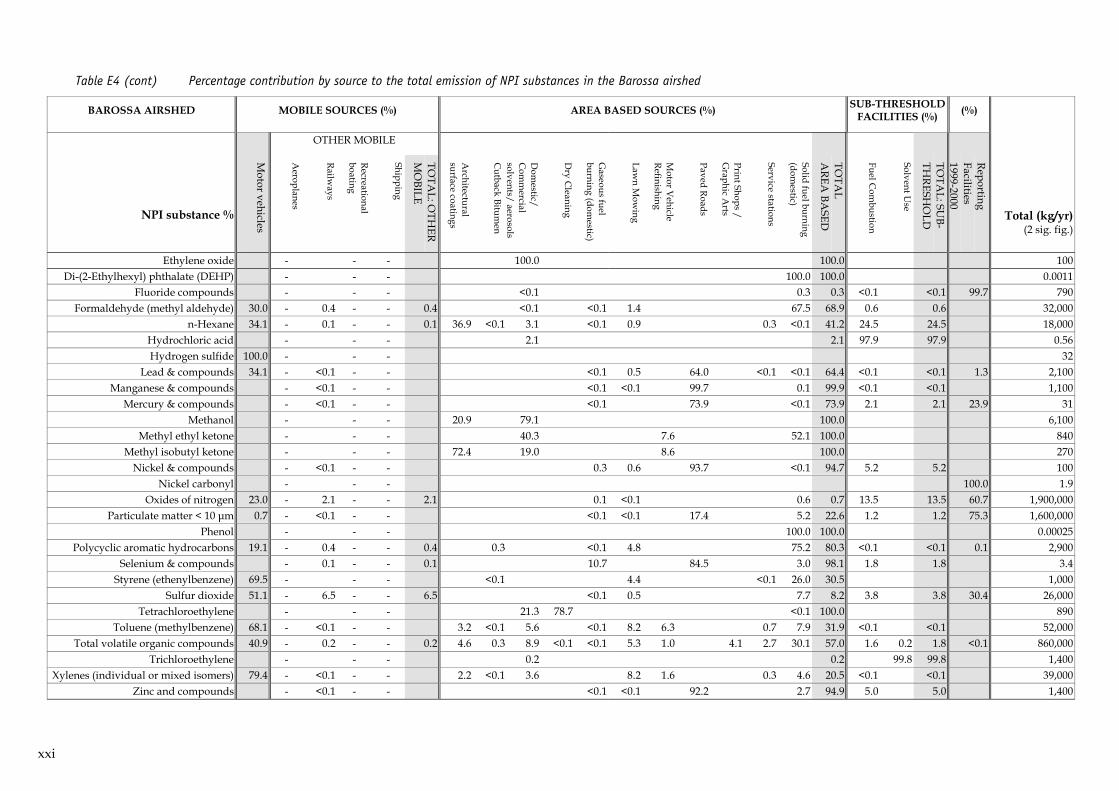
Table E4 Percentage contribution by source to the total emission of NPI substances in the Barossaairshed xx
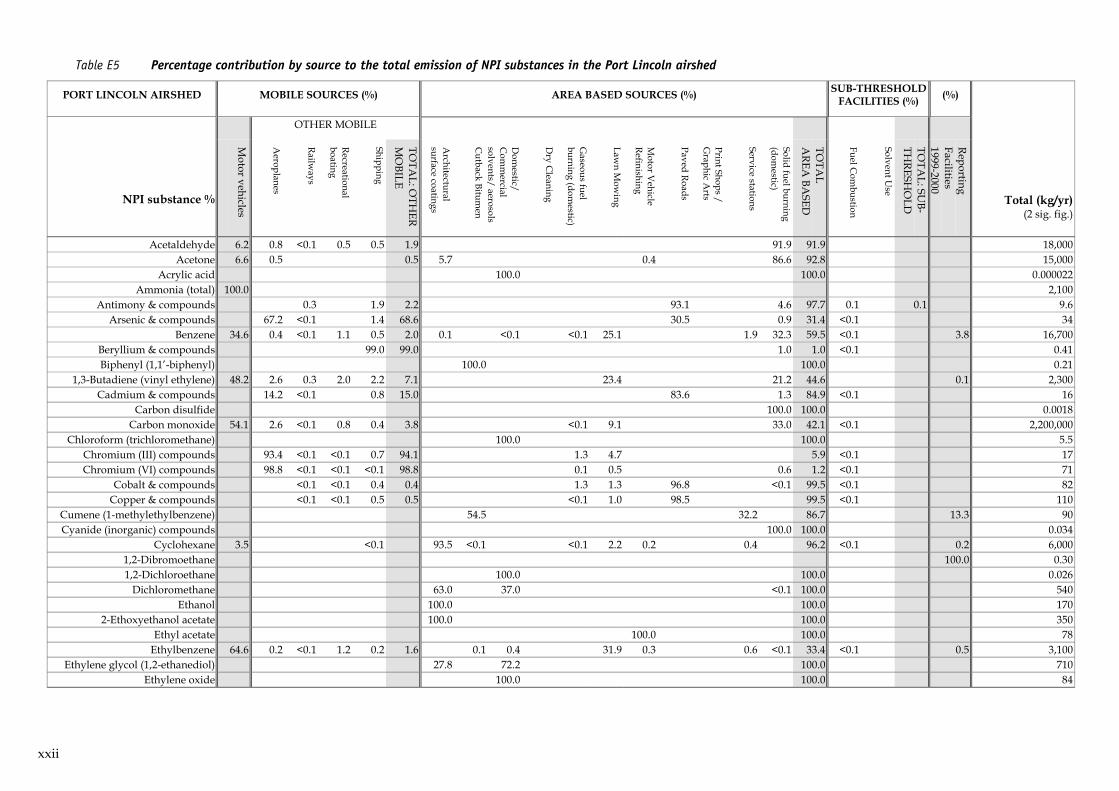
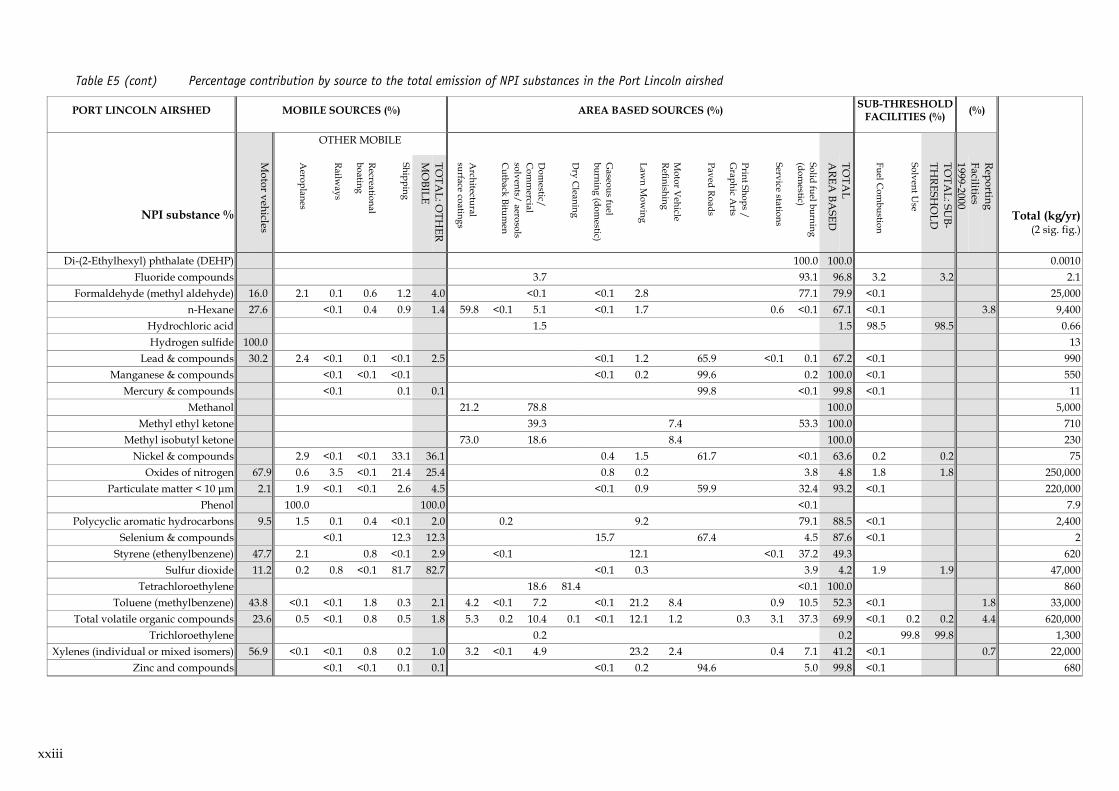
Table E5 Percentage contribution by source to the total emission of NPI substances in the PortLincoln airshed xxii
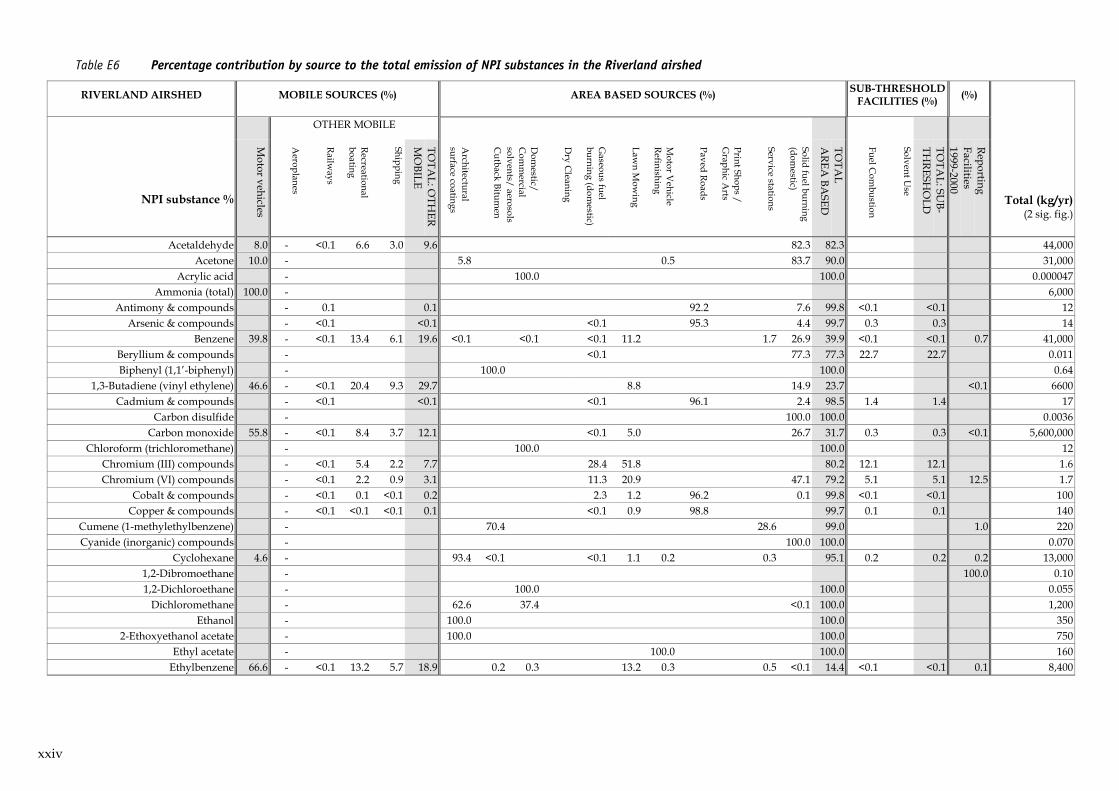
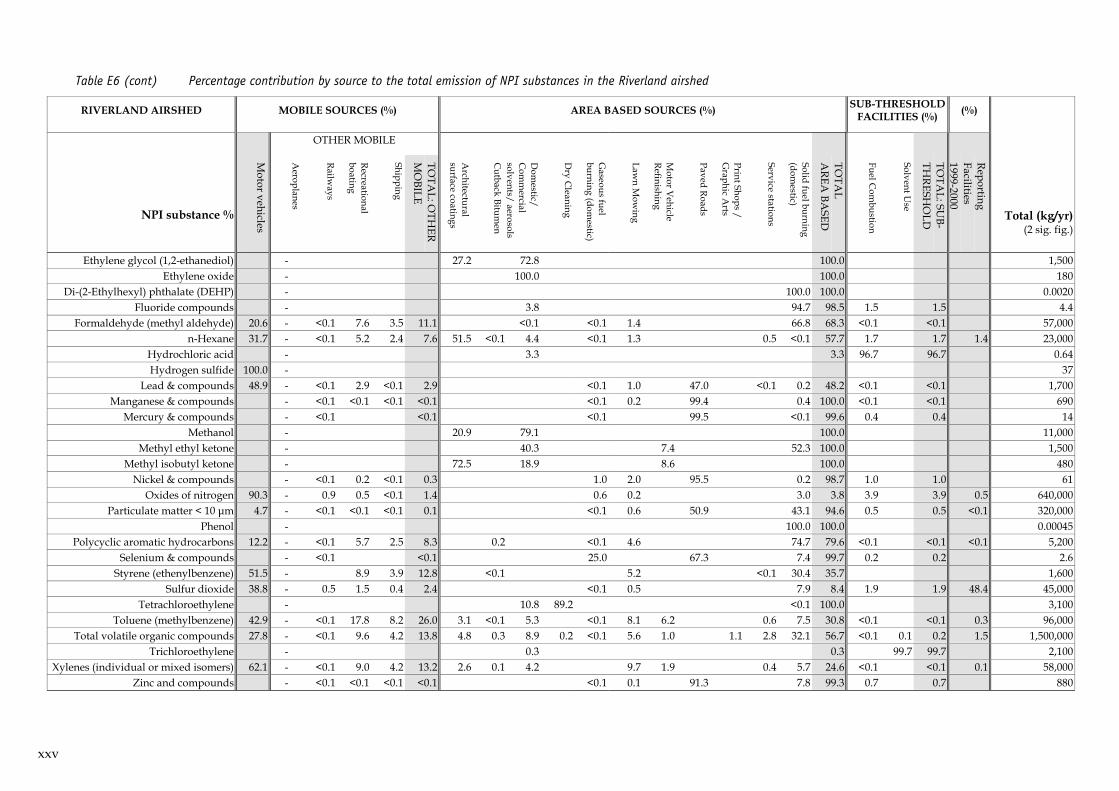
Table E6 Percentage contribution by source to the total emission of NPI substances in the Riverlandairshed xxiv
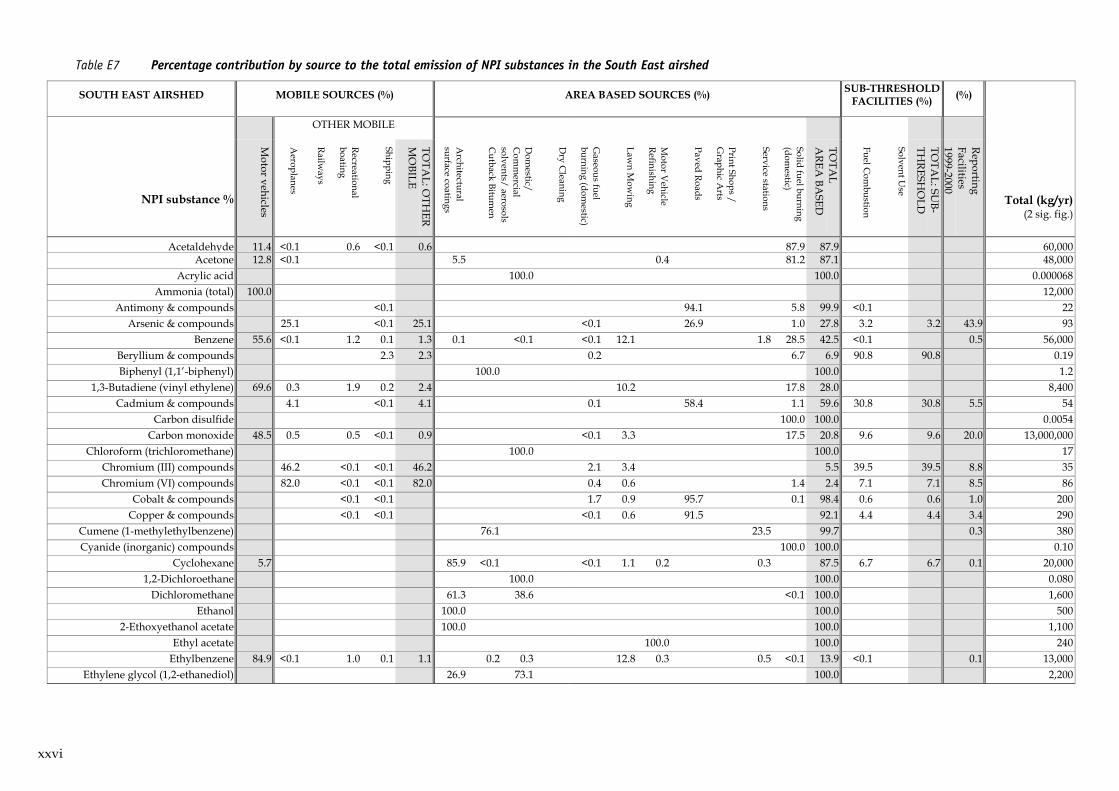
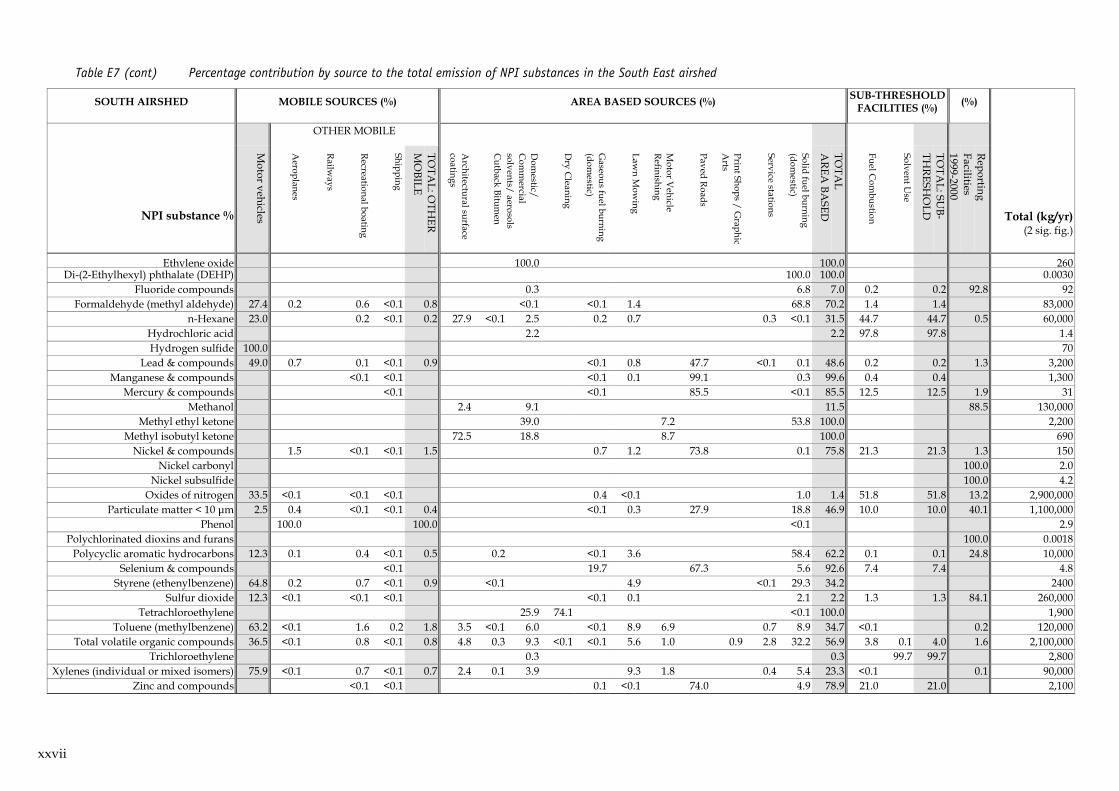
Table E7 Percentage contribution by source to the total emission of NPI substances in the SouthEast airshed xxvi
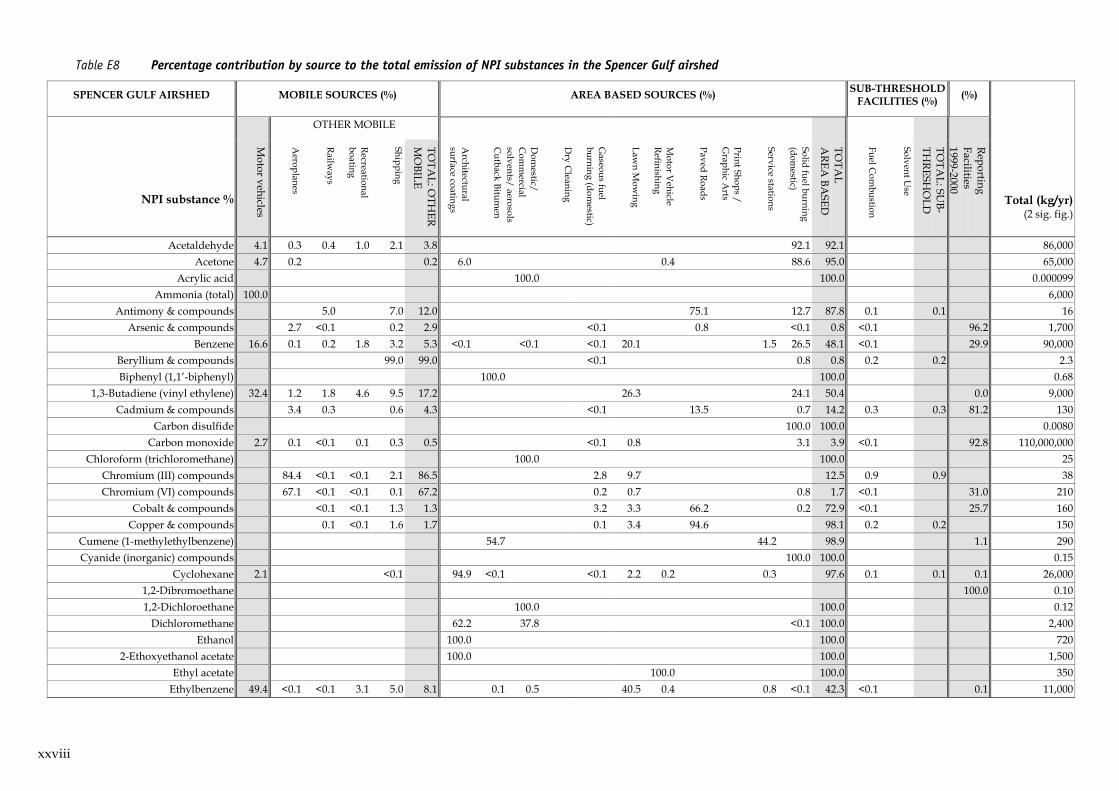
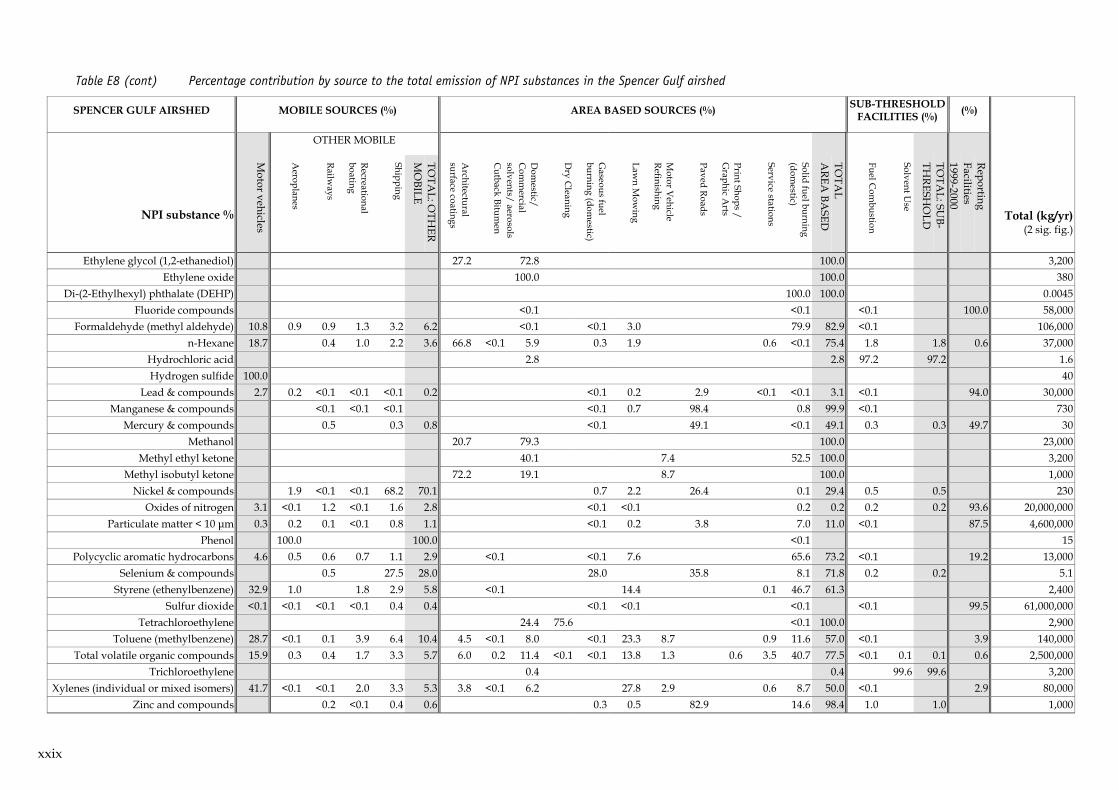
Table E8 Percentage contribution by source to the total emission of NPI substances in the SpencerGulf airshed xxviii
Report Tables
Table 1 Classification of emission sources 1
Table 2 South Australian airshed populations and housing data 3
Table 3 Aggregated sources estimated within the Adelaide and regional airsheds 10
Table 4 Aeroplane emissions in the Adelaide and major regional airsheds 17
Table 5 Aeroplane emissions in the minor regional airsheds 17
Table 6 Motor vehicle emissions in the Adelaide and major regional airsheds 20
Table 7 Motor vehicle emissions in the minor regional airsheds 21
Table 8 Railway emissions in the Adelaide and major regional airsheds 24
Table 9 Railway emissions in the minor regional airsheds 25
Table 10 Recreational boating emissions in the Adelaide and major regional airsheds 29
Table 11 Recreational boating emissions in the minor regional airsheds 30
Table 12 Shipping and commercial boating emissions in the Adelaide and major regional airsheds 34
Table 13 Shipping and commercial boating emissions in the minor regional airsheds 35
Table 14 Architectural surface coating emissions in the Adelaide and major regional airsheds 37
Table 15 Architectural surface coating emissions in the minor regional airsheds 38
Table 16 Cutback bitumen emissions in the Adelaide and major regional airsheds 40
Table 17 Cutback bitumen emissions in the minor regional airsheds 41
vi
Table 18 Domestic and commercial solvent and aerosol emissions in the Adelaide and majorregional airsheds 43
Table 19 Domestic and commercial solvent and aerosol emissions in the minor regional airsheds 44
Table 20 Domestic gas fuel emissions in the Adelaide and major regional airsheds 46
Table 21 Domestic gas fuel emissions in the minor regional airsheds 47
Table 22 Dry cleaning emissions in the Adelaide and major regional airsheds 49
Table 23 Dry cleaning emissions in the minor regional airsheds 49
Table 24 Lawn mowing (domestic) in the Adelaide and major regional airsheds 51
Table 25 Lawn mowing (domestic) in the minor regional airsheds 52
Table 26 Motor vehicle refinishing emissions in the Adelaide and major regional airsheds 54
Table 27 Motor vehicle refinishing emissions in the minor regional airsheds 55
Table 28 Paved road emissions in the Adelaide and major regional airsheds 57
Table 29 Paved road emissions in the minor regional airsheds 58
Table 30 Printing and graphic arts emissions in the Adelaide and major regional airsheds 60
Table 31 Printing and graphic arts emissions in the minor regional airsheds 60
Table 32 Service stations emissions in the Adelaide and major regional airsheds 62
Table 33 Service station emissions in the minor regional airsheds 63
Table 34 Solid fuel burning (domestic) emissions in the Adelaide and major regional airsheds 65
Table 35 Solid fuel burning (domestic) emissions in the minor regional airsheds 66
Table 36 Sub-threshold fuel combustion emissions in the Adelaide and major regional airsheds 69
Table 37 Sub-threshold fuel combustion emissions in the minor regional airsheds 70
Table 38 Sub-threshold industrial solvent emissions in the Adelaide and major regional airsheds 72
Table 39 Sub-threshold industrial solvent emissions in the minor regional airsheds 73
Table 40 Total emissions of NPI substances in the Adelaide airshed 75
Table 41 Percentage contribution by source to the total emission of NPI substances in the Adelaideairshed 76
Table 42 Total emissions of NPI substances in the Barossa airshed 78
Table 43 Percentage contribution by source to the total emission of NPI substances in the Barossaairshed 79
Table 44 Total emissions of NPI substances in the Port Lincoln airshed 81
Table 45 Percentage contribution by source to the total emission of NPI substances in the PortLincoln airshed 82
Table 46 Total emissions of NPI substances in the Riverland airshed 84
Table 47 Percentage contribution by source to the total emission of NPI substances in the Riverlandairshed 85
Table 48 Total emissions of NPI substances in the South East airshed 87
vii
Table 49 Percentage contribution by source to the total emission of NPI substances in the SouthEast airshed 88
Table 50 Total emissions of NPI substances in the Spencer Gulf airshed 90
Table 51 Percentage contribution by source to the total emission of NPI substances in the SpencerGulf airshed 91
Table 52 Percentage of occurrences where the source was the single largest contributor 97
viii
Abbreviations
ABARE Australian Bureau of Agricultural and Resource Economics
ABS Australian Bureau of Statistics
AGA Australian Natural Gas Association
AIP Australian Institute of Petroleum
ALPGA Australian Liquid Petroleum Gas Association
APMF Australian Paint Manufacturing Federation
BTEX benzene-toluene-ethylbenzene-xylene
CO carbon monoxide
EET emission estimation technique
GIS geographical information systems
km kilometres
L litres
LPG liquefied petroleum gas
MOU memorandum of understanding
NEPM National Environment Protection Measure
NOx oxides of nitrogen
NPI National Pollutant Inventory
PM10 particulate matter less than 10 µm
SA EPA South Australian Environment Protection Authority*
SO2 sulfur dioxide
VKT vehicle kilometres travelled
VOC volatile organic compounds
* Known as �Environment Protection Agency� prior to July 2002
NPI Summary Report: Adelaide and regional airsheds 1998-99
ix
Executive summary
IntroductionThis report provides an overview of the inventory work carried out within South Australia as partof the National Pollutant Inventory (NPI). Detailed methodologies describing the variousestimation techniques can be found in the referenced aggregated emissions estimation technique(EET) manuals for each source studied, available at www.npi.ea.gov.au.
NPI emissions were investigated in 17 airsheds, representing a large cross-section of the State�spopulation and commercial/industrial activities. These airsheds�one metropolitan and 16regional�were divided into grid squares measuring either 1 x 1 km or 5 x 5 km in area.
Aggregated emission sources studied in each airshed represent a range of domestic, commercialand transportation related activities. Eighteen aggregate sources were estimated for the emissionsof 90 substances in Table 2 of the National Environment Protection Measure (NEPM) for the NPI.However, emissions were only calculated for those substances for which emission factors wereknown. Substances with no data are either not related to the source or no emission factors wereavailable.
Data in this report is available on the Internet NPI database and can be viewed atwww.npi.ea.gov.au.
BackgroundThe NPI is a national database containing pollutant inventories of annual emission loads to air,land and water. NPI data is collated by individual States and consists of aggregate and industryemission estimates in kilograms emitted annually. The purpose of the NPI is to:
� provide the community, industry and governments with consistent and reliable informationabout pollutant emissions in Australia
� become an integral part of policy and program formulation for government and assist inenvironmental planning and management
� promote cleaner, more efficient manufacturing processes and energy resource savingsprograms for industry, government and the community.
As part of the NPI program, the South Australian Environment Protection Agency (SA EPA) wascommitted to supplying the national NPI database with estimations of aggregated emissions to airfrom the Adelaide and 16 regional airsheds for the 1998-99 year. This requirement is stipulated inSchedule C of the NPI Memorandum of Understanding (MOU). The MOU provides the basis forimplementation of the NEPM.
Under the NPI MOU, states and territories were not required to report emissions from aggregatedsources for which there were no relevant aggregated EET manuals. Emissions represented in thisreport were all estimated using the available manuals developed by Environment Australia.
AirshedsThe 17 South Australian airsheds examined in this report comprise six major airsheds divided intogrid squares 1 x 1 km or 5 x 5 km, and 11 minor airsheds with 1 x 1 km grid squares, each locatedwithin the boundaries of a major airshed. Airsheds cover the major populated, commercial andindustrial areas of the State in the Adelaide metropolitan area, the Barossa Valley, Port Lincoln,the Riverland, the South East and upper regions of the Spencer Gulf.
NPI Summary Report: Adelaide and regional airsheds 1998-99
x
Air emission sourcesThe sources of air pollutants studied in each of the airsheds include a range of domestic,commercial and mobile activities listed below. Each source was estimated in-house according toEET methodologies. Motor vehicle emissions in the Adelaide and regional airsheds were alsocalculated in accordance with the methodology of the NPI Aggregated Motor Vehicles EET, whilestrongly relying on emission factors, vehicle fleet profiles and other activity parametersdetermined by McLennan Magasanik Associates.
Aggregate air emission sources
Aeroplanes Paved roads
Architectural surface coatings Print shops/graphic arts
Cutback bitumen Railways
Domestic/commercial solvents/aerosols Recreational boating
Domestic gas fuel Service stations
Dry cleaning Shipping and commercial boating
Lawn mowing (domestic) Solid fuel burning (domestic)
Motor vehicles Sub-threshold fuel combustion
Motor vehicle refinishing Sub-threshold solvents
For comparative purposes, emission sources have been grouped into the five source types:
Mobile�motor vehicles: includes emissions from all passenger vehicles, four-wheel drives, lightvehicles, rigid trucks, articulated trucks, buses, motor cycles and other vehicles.
Mobile�other: includes aircraft, railways and watercraft operating within the airshed. Watercraftinclude the emission sources of ships, commercial boats and recreational boats.
Area based: includes emissions from a range of domestic and commercial activities as well asactivities associated with roads such as cutback bitumen and paved roads.
Sub-threshold facilities: includes emissions from fuel combustion and solvent use by industrialfacilities below the reporting threshold.
NPI reporting facilities: includes self-reported emissions from a range of industries operating abovethe NPI thresholds. This data is valid for the 1999�2000 reporting year and is used in place of the1998�99 preliminary data.
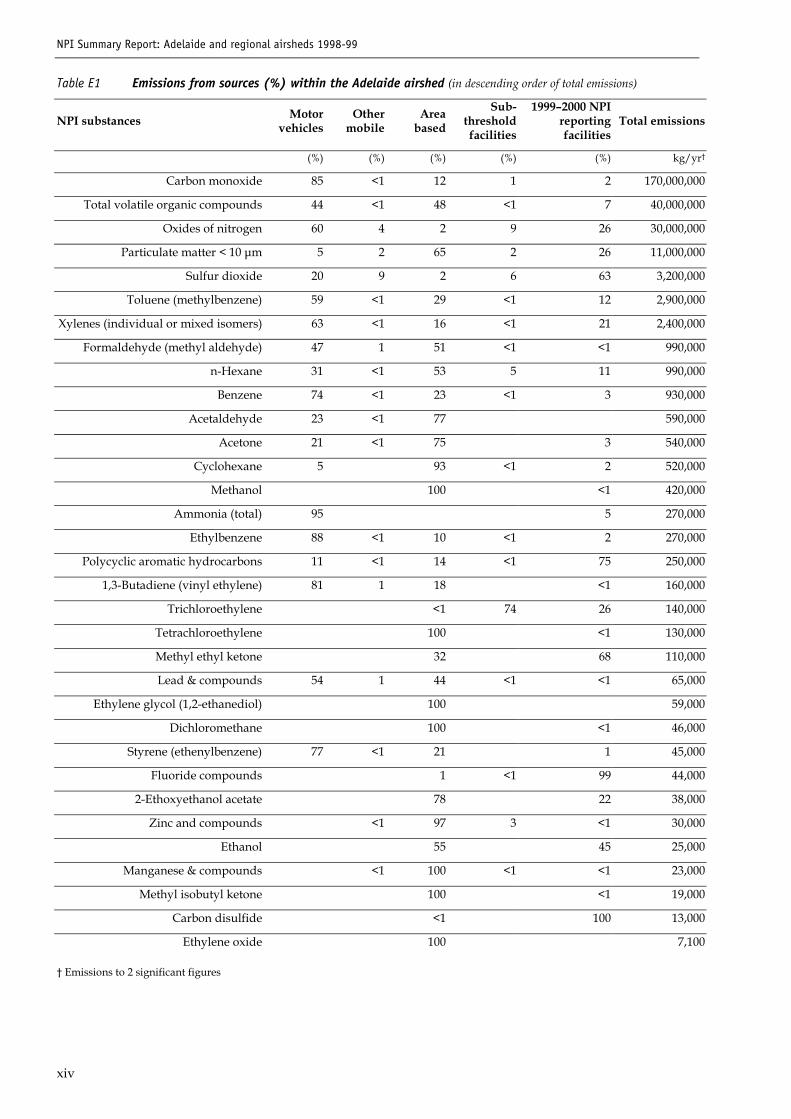
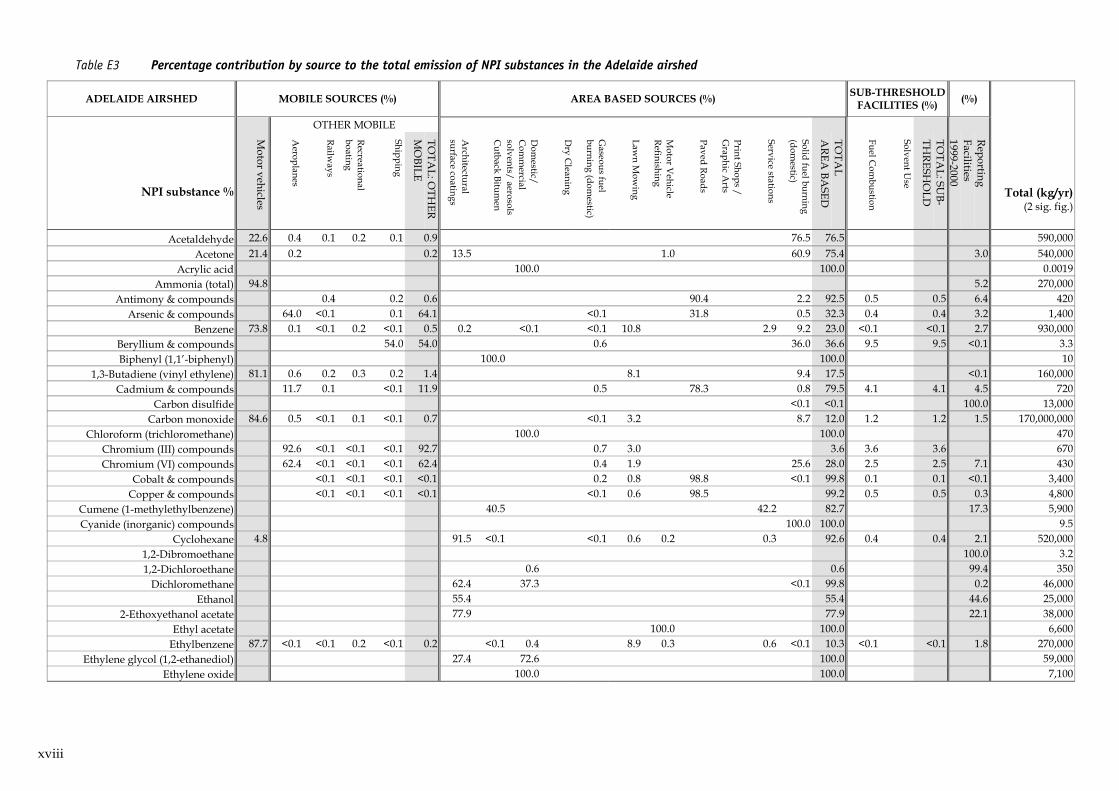
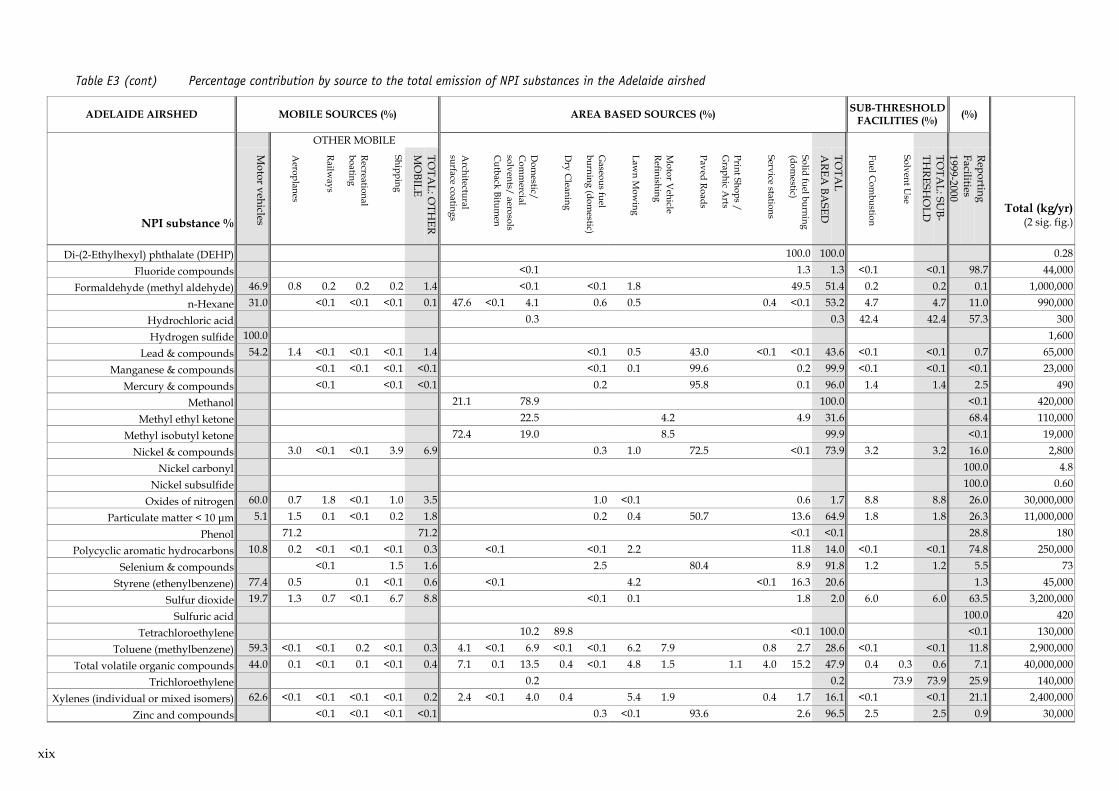
ResultsIn the Adelaide airshed, aggregate emissions from area-based sources and the single source type,motor vehicles, indicate these sources are major contributors to the emissions of the pollutantscarbon monoxide, lead, oxides of nitrogen and particulate matter. Emissions of sulfur dioxidewere predominantly from industry-reported emissions (53%), followed by motor vehicleemissions (30%). Total volatile organic compounds (VOC) were dominated by motor vehicleemissions (45%), followed by the area-based sources, largely domestic solid fuel burning (15%)and domestic and commercial solvents and aerosols (13%). Paved road emissions resulting fromvehicle use on sealed roads were identified as a major source of resuspended particulate matterless than 10 µm as well as other metallic compounds. The full list of substances estimated and thepercentage of emissions attributed to each source type is shown in Table E1.
NPI Summary Report: Adelaide and regional airsheds 1998-99
xi
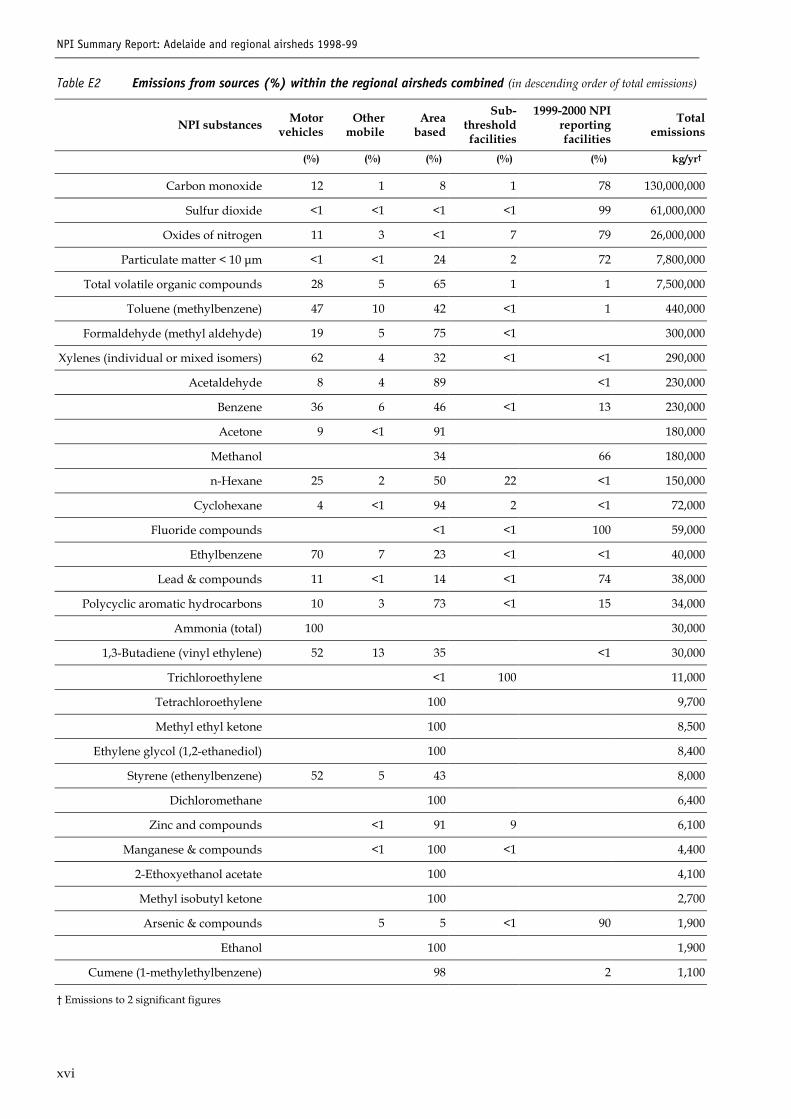
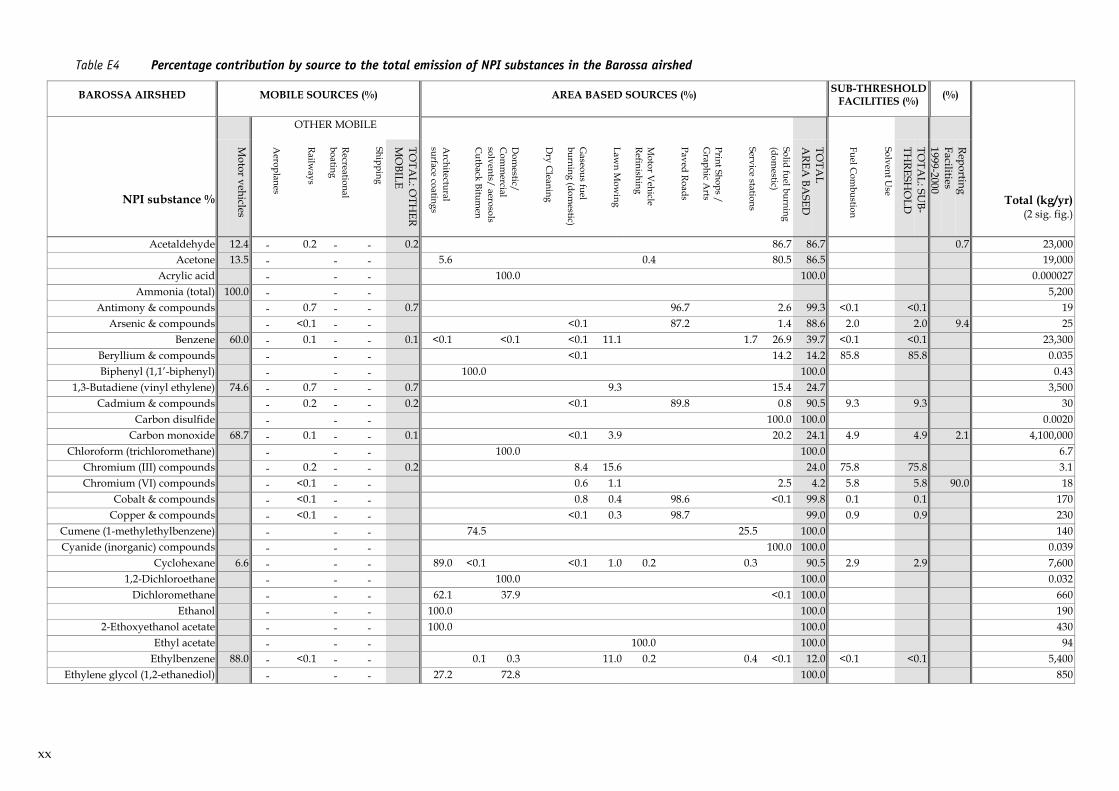
Regional airshed emissions of NPI substances were predominantly from aggregate sources,although industry emissions were found to be significant in two of the airsheds studied, Barossaand Spencer Gulf. Area-based emissions, representing 11 separate sources, were the largestcontributors of NPI substances, ranging from 58% to 79% of total emission in the airshed. Thesesources were consequently the major contributor of NPI emissions in each of the regional airshedsrelative to other sources estimated. However, between 40% and 50% of the substances emitted bymotor vehicles were identified as the largest contributors of NPI substances in each airshed. Area-based sources and motor vehicles collectively contributed more than 60% of the total NPI emissionestimates in these regional airsheds.
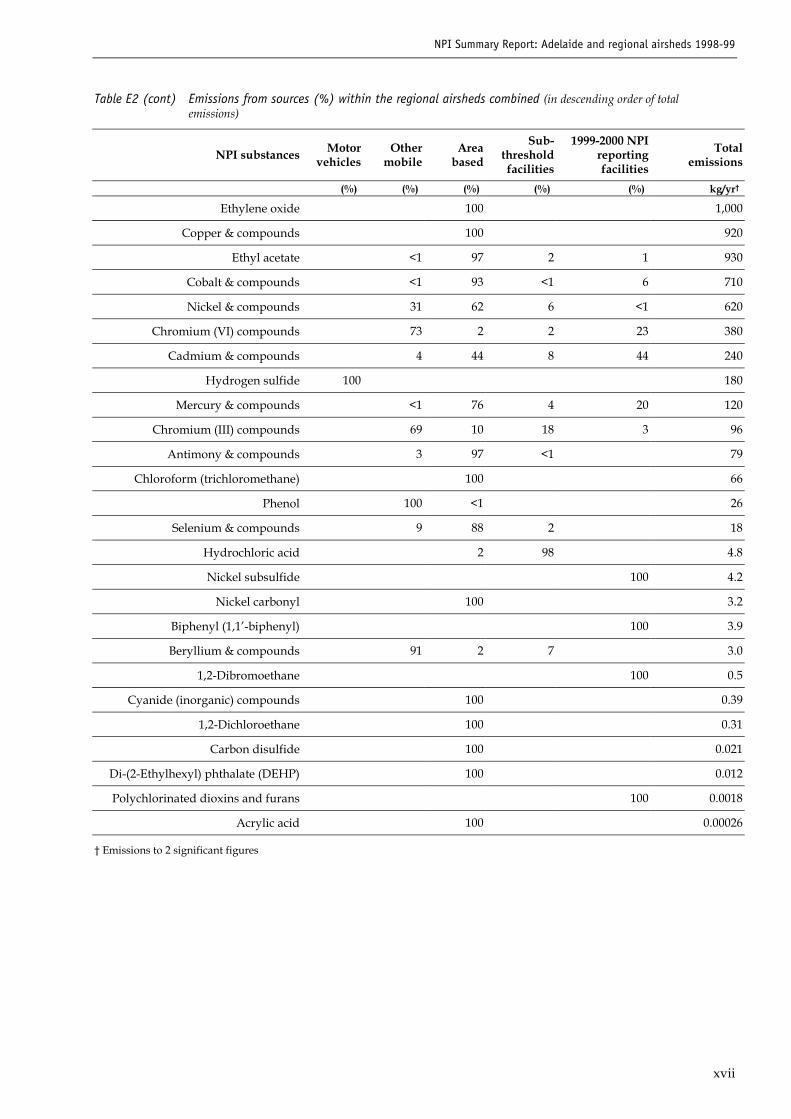
Regional emissions of the major pollutants carbon monoxide, oxides of nitrogen, particulatematter less than 10 µm, sulfur dioxide and VOC were dominated by industry sources in theBarossa and Spencer Gulf airsheds, and motor vehicle or area-based sources in the remainingairsheds. A summary of substances emitted from contributing sources, in the regional airshedscombined, is listed in Table E2; a more detailed list of sources and their percentage contribution tothe total emissions of each NPI substance is given by airshed in Table E3 to Table E8.
Emissions from natural sources such as wildfires or biogenics have not been included in thesecalculations, although these may be significant contributors in the regional airsheds. The Perthstudy, where natural sources accounted for only a small fraction of the total emissions in themetropolitan area, indicates that large contributions should not be expected from natural sourcesin the Adelaide airshed.
Paved roads included in the general source type �area-based� were highlighted as a significantsource of particulate matter less than 10 µm. However, these emissions are not newly generatedbut a result of the resuspension of loose matter from the road surface, introduced onto the roadsfrom a variety of activities such as dust fall, litter, erosion from adjacent areas or spillage.Industry-reported emissions were the largest source of newly generated particulate matter lessthan 10 µm. In regional airsheds, emissions from domestic solid fuel burning were also identifiedas a major source generating particulate matter less than 10 µm.
Emissions determined on a per capita basis for the Adelaide, Port Lincoln, Riverland and SouthEast airsheds were of similar magnitude. However, per capita emissions of selected substances inthe Barossa and Spencer Gulf airsheds were exceedingly high due to the dominance of industrysources. Similarities between the Adelaide and all regional airsheds was most evident for thefollowing substances: VOC, benzene-toluene-ethylbenzene-xylene (BTEX) and all combinedmetallic compounds, which were mostly related to area-based sources or motor vehicles. Theemission estimates of carbon monoxide, oxides of nitrogen, sulfur dioxide and particulate matterless than 10 µm were greatly influenced by industry sources within some airsheds. In the absenceof industry dominance, there was a close agreement in the per capita emission estimates betweenregional airsheds and the Adelaide airshed, suggesting the possibility of transposing data to otherregions of the State on a population basis. However, inventory estimates must be validated againstmonitoring data to confirm these findings.
Key conclusions and recommendationsThe 1998�99 NPI inventory confirms the significant contribution made by motor vehicles to thetotal emissions of the major air quality pollutants carbon monoxide, oxides of nitrogen, total VOC,and particulate matter less than 10 µm through resuspension from paved roads. Independentcomparisons of NPI substances carbon monoxide, oxides of nitrogen and VOC by ProfessorNeville Clark (Flinders Consulting Pty Ltd) indicate a very close agreement with directmeasurements from aircraft as well as other inventories3. These independent data assessmentsincrease confidence in the NPI estimates.
NPI Summary Report: Adelaide and regional airsheds 1998-99
xii
Industry emissions from facilities reporting in the 1999�2000 reporting year, the second year of theNPI reporting program, indicate significant contributions to the total emission load in the regionalairsheds of Barossa and Spencer Gulf. These included emissions of carbon monoxide, oxides ofnitrogen, total VOC, particulate matter less than 10 µm and sulfur dioxide.
Emissions of VOC are largely contributed by domestic area-based sources such as solvent andaerosol use and solid fuel burning. These sources contributed approximately half of the total VOCemission load in the airsheds studied, with the remaining portion being greatly influenced bymotor vehicle emissions.
The dominant source of BTEX substances identified under the Air Toxics Program was thecombustion of petroleum products in motor vehicles. Some area-based sources, in particular lawnmowing and solid fuel burning, also contribute.
Comparisons between the Adelaide and regional airsheds indicate a close agreement in themagnitude of emissions on a per capita basis, in the absence of industry dominance. This is notsurprising based on the methodologies applied in these estimates, which strongly rely on theapportioning of State data to airsheds according to population in the absence of locally availabledata. However, every effort was made to use locally derived data. Where industry emissions occurthese strongly influence the airshed�s total emission load. This is particularly noticeable in theBarossa and Spencer Gulf airsheds.
In view of these estimates and applied methodologies, there are several recommendations thatshould be addressed to improve the accuracy of this inventory in the future.
� The inventory should be repeated within a short period of the Australian Bureau of StatisticsCensus collection year. This will provide a more accurate representation of emissions based onthe latest demographic information.
� Domestic activity data associated with the solid fuel burning particularly should be improvedin the regional airsheds such as the South East. In the current inventory, regional responses tothe domestic survey were limited to certain areas and therefore did not provide the desirablecross-sectional representation. This may be improved with better promotion of the SouthAustralian Environment Protection Authority (SA EPA) inventory program through itscommunity education programs such as Air Watch.
� Recreational and commercial boating activity data should be improved within airsheds wherethis source is known to contribute significantly to the total emission load such as the SpencerGulf, Port Lincoln and Riverland airsheds. The current accuracy of the estimates is consideredto be less than 20%4, since activity within regional airsheds was based on a combination ofresponses from the domestic survey and boat registration data. The many assumptions madefor the estimation may have grossly over- or under- estimated the true contributions.
� The source �bushfires and prescribed burning� should be included in future inventoryestimates. Currently there is limited information available on the practice of prescribed burningwithin South Australia, and a more thorough accounting of prescribed burning practices wouldenable these emissions to be accurately represented. This can be achieved by collecting moredetailed information on the proposed burn-off activity as a condition of permit issue.Information should include the proposed burn location, area to be burnt, burn material such ascrop type, quantity to be burnt, and the time and length of burn.
� Motor vehicles were consistently the largest source of emissions in each airshed. Futurechanges in fuel and vehicle age will have significant impacts on the choice of emission factors.Efforts need to be directed to determining accurate emission factors and vehicle fleetcompositions. In addition, residential roads were determined based on population-basedemission factors rather than on actual vehicle kilometres travelled (VKT) data. Further workneeds to be directed towards determining VKT data from traffic counts on residential roads.
NPI Summary Report: Adelaide and regional airsheds 1998-99
xiii
� The inventory values need to be validated with monitoring data to determine spatial andtemporal distributions. This can be achieved with techniques such as pollutant modelling, andby independent assessments. The independent assessment by Professor Neville Clark for alimited number of substances indicated strong agreement between these estimates andalternative inventory techniques for the Adelaide airshed3. However, it remains difficult topredict if these agreements will apply to some of the regional airsheds or to other substances.
� Industry reported emissions for the 1999�2000 year, under the NPI requirement, include 218reporters state-wide from a range of industry sectors. Facilities not required to report have beenincluded in the sub-threshold estimates. However, the accuracy of data provided by industriesneeds further investigation and assessment to validate contributions and thus help to identifylong-term trends within industry sectors.
NPI Summary Report: Adelaide and regional airsheds 1998-99
xiv
Table E1 Emissions from sources (%) within the Adelaide airshed (in descending order of total emissions)
NPI substances Motorvehicles
Othermobile
Areabased
Sub-thresholdfacilities
1999�2000 NPIreportingfacilities
Total emissions
(%) (%) (%) (%) (%) kg/yr�
Carbon monoxide 85 <1 12 1 2 170,000,000
Total volatile organic compounds 44 <1 48 <1 7 40,000,000
Oxides of nitrogen 60 4 2 9 26 30,000,000
Particulate matter < 10 µm 5 2 65 2 26 11,000,000
Sulfur dioxide 20 9 2 6 63 3,200,000
Toluene (methylbenzene) 59 <1 29 <1 12 2,900,000
Xylenes (individual or mixed isomers) 63 <1 16 <1 21 2,400,000
Formaldehyde (methyl aldehyde) 47 1 51 <1 <1 990,000
n-Hexane 31 <1 53 5 11 990,000
Benzene 74 <1 23 <1 3 930,000
Acetaldehyde 23 <1 77 590,000
Acetone 21 <1 75 3 540,000
Cyclohexane 5 93 <1 2 520,000
Methanol 100 <1 420,000
Ammonia (total) 95 5 270,000
Ethylbenzene 88 <1 10 <1 2 270,000
Polycyclic aromatic hydrocarbons 11 <1 14 <1 75 250,000
1,3-Butadiene (vinyl ethylene) 81 1 18 <1 160,000
Trichloroethylene <1 74 26 140,000
Tetrachloroethylene 100 <1 130,000
Methyl ethyl ketone 32 68 110,000
Lead & compounds 54 1 44 <1 <1 65,000
Ethylene glycol (1,2-ethanediol) 100 59,000
Dichloromethane 100 <1 46,000
Styrene (ethenylbenzene) 77 <1 21 1 45,000
Fluoride compounds 1 <1 99 44,000
2-Ethoxyethanol acetate 78 22 38,000
Zinc and compounds <1 97 3 <1 30,000
Ethanol 55 45 25,000
Manganese & compounds <1 100 <1 <1 23,000
Methyl isobutyl ketone 100 <1 19,000
Carbon disulfide <1 100 13,000
Ethylene oxide 100 7,100
� Emissions to 2 significant figures
NPI Summary Report: Adelaide and regional airsheds 1998-99
xv
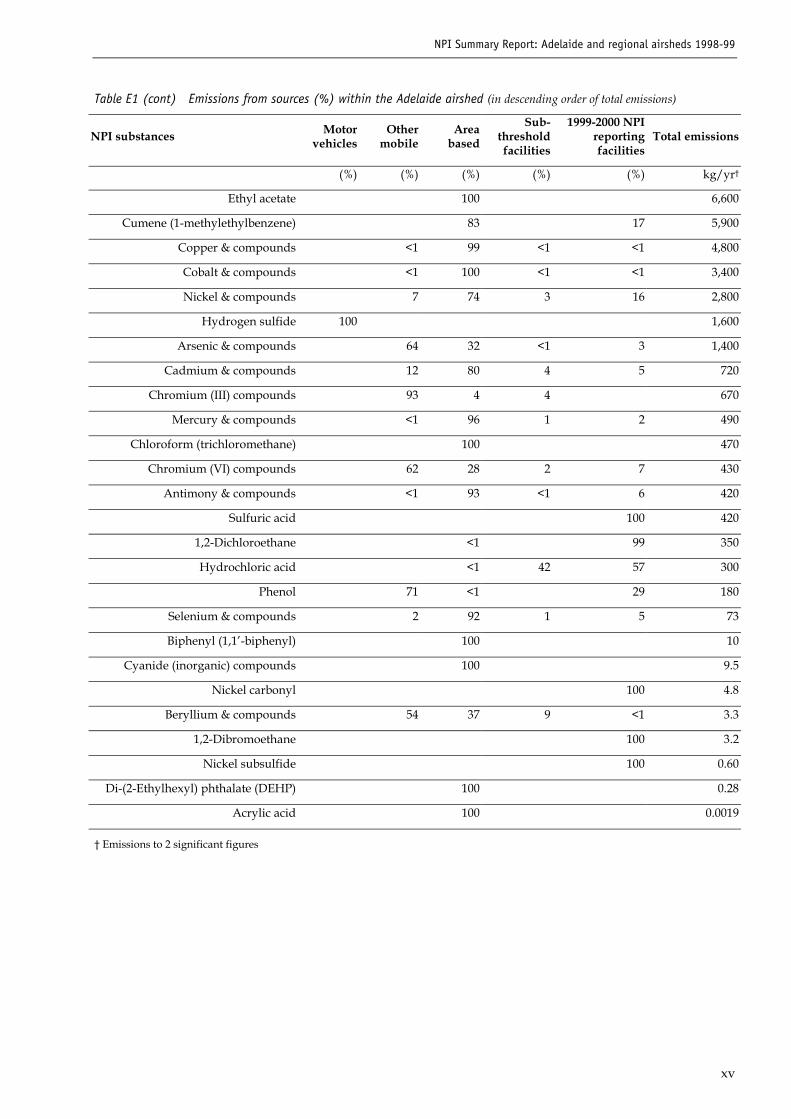
Table E1 (cont) Emissions from sources (%) within the Adelaide airshed (in descending order of total emissions)
NPI substances Motorvehicles
Othermobile
Areabased
Sub-thresholdfacilities
1999-2000 NPIreportingfacilities
Total emissions
(%) (%) (%) (%) (%) kg/yr�
Ethyl acetate 100 6,600
Cumene (1-methylethylbenzene) 83 17 5,900
Copper & compounds <1 99 <1 <1 4,800
Cobalt & compounds <1 100 <1 <1 3,400
Nickel & compounds 7 74 3 16 2,800
Hydrogen sulfide 100 1,600
Arsenic & compounds 64 32 <1 3 1,400
Cadmium & compounds 12 80 4 5 720
Chromium (III) compounds 93 4 4 670
Mercury & compounds <1 96 1 2 490
Chloroform (trichloromethane) 100 470
Chromium (VI) compounds 62 28 2 7 430
Antimony & compounds <1 93 <1 6 420
Sulfuric acid 100 420
1,2-Dichloroethane <1 99 350
Hydrochloric acid <1 42 57 300
Phenol 71 <1 29 180
Selenium & compounds 2 92 1 5 73
Biphenyl (1,1�-biphenyl) 100 10
Cyanide (inorganic) compounds 100 9.5
Nickel carbonyl 100 4.8
Beryllium & compounds 54 37 9 <1 3.3
1,2-Dibromoethane 100 3.2
Nickel subsulfide 100 0.60
Di-(2-Ethylhexyl) phthalate (DEHP) 100 0.28
Acrylic acid 100 0.0019
� Emissions to 2 significant figures
NPI Summary Report: Adelaide and regional airsheds 1998-99
xvi
Table E2 Emissions from sources (%) within the regional airsheds combined (in descending order of total emissions)
NPI substances Motor vehicles
Other mobile
Area based
Sub-threshold facilities
1999-2000 NPIreportingfacilities
Totalemissions
(%) (%) (%) (%) (%) kg/yr�
Carbon monoxide 12 1 8 1 78 130,000,000
Sulfur dioxide <1 <1 <1 <1 99 61,000,000
Oxides of nitrogen 11 3 <1 7 79 26,000,000
Particulate matter < 10 µm <1 <1 24 2 72 7,800,000
Total volatile organic compounds 28 5 65 1 1 7,500,000
Toluene (methylbenzene) 47 10 42 <1 1 440,000
Formaldehyde (methyl aldehyde) 19 5 75 <1 300,000
Xylenes (individual or mixed isomers) 62 4 32 <1 <1 290,000
Acetaldehyde 8 4 89 <1 230,000
Benzene 36 6 46 <1 13 230,000
Acetone 9 <1 91 180,000
Methanol 34 66 180,000
n-Hexane 25 2 50 22 <1 150,000
Cyclohexane 4 <1 94 2 <1 72,000
Fluoride compounds <1 <1 100 59,000
Ethylbenzene 70 7 23 <1 <1 40,000
Lead & compounds 11 <1 14 <1 74 38,000
Polycyclic aromatic hydrocarbons 10 3 73 <1 15 34,000
Ammonia (total) 100 30,000
1,3-Butadiene (vinyl ethylene) 52 13 35 <1 30,000
Trichloroethylene <1 100 11,000
Tetrachloroethylene 100 9,700
Methyl ethyl ketone 100 8,500
Ethylene glycol (1,2-ethanediol) 100 8,400
Styrene (ethenylbenzene) 52 5 43 8,000
Dichloromethane 100 6,400
Zinc and compounds <1 91 9 6,100
Manganese & compounds <1 100 <1 4,400
2-Ethoxyethanol acetate 100 4,100
Methyl isobutyl ketone 100 2,700
Arsenic & compounds 5 5 <1 90 1,900
Ethanol 100 1,900
Cumene (1-methylethylbenzene) 98 2 1,100
� Emissions to 2 significant figures
NPI Summary Report: Adelaide and regional airsheds 1998-99
xvii
Table E2 (cont) Emissions from sources (%) within the regional airsheds combined (in descending order of totalemissions)
NPI substances Motor vehicles
Other mobile
Area based
Sub-threshold facilities
1999-2000 NPIreportingfacilities
Totalemissions
(%) (%) (%) (%) (%) kg/yr�
Ethylene oxide 100 1,000
Copper & compounds 100 920
Ethyl acetate <1 97 2 1 930
Cobalt & compounds <1 93 <1 6 710
Nickel & compounds 31 62 6 <1 620
Chromium (VI) compounds 73 2 2 23 380
Cadmium & compounds 4 44 8 44 240
Hydrogen sulfide 100 180
Mercury & compounds <1 76 4 20 120
Chromium (III) compounds 69 10 18 3 96
Antimony & compounds 3 97 <1 79
Chloroform (trichloromethane) 100 66
Phenol 100 <1 26
Selenium & compounds 9 88 2 18
Hydrochloric acid 2 98 4.8
Nickel subsulfide 100 4.2
Nickel carbonyl 100 3.2
Biphenyl (1,1�-biphenyl) 100 3.9
Beryllium & compounds 91 2 7 3.0
1,2-Dibromoethane 100 0.5
Cyanide (inorganic) compounds 100 0.39
1,2-Dichloroethane 100 0.31
Carbon disulfide 100 0.021
Di-(2-Ethylhexyl) phthalate (DEHP) 100 0.012
Polychlorinated dioxins and furans 100 0.0018
Acrylic acid 100 0.00026
� Emissions to 2 significant figures
xviii
Table E3 Percentage contribution by source to the total emission of NPI substances in the Adelaide airshed
ADELAIDE AIRSHED MOBILE SOURCES (%) AREA BASED SOURCES (%) SUB-THRESHOLDFACILITIES (%) (%)
OTHER MOBILE
NPI substance %
Motor vehicles
Aeroplanes
Railways
Recreationalboating
Shipping
TOTA
L: OTH
ERM
OBILE
Architectural
surface coatings
Cutback Bitum
en
Dom
estic/C
omm
ercialsolvents / aerosols
Dry C
leaning
Gaseous fuel
burning (domestic)
Lawn M
owing
Motor V
ehicleRefinishing
Paved Roads
Print Shops /G
raphic Arts
Service stations
Solid fuel burning(dom
estic)
TOTA
LA
REA BA
SED
Fuel Com
bustion
Solvent Use
TOTA
L: SUB-
THRESH
OLD
ReportingFacilities1999-2000
Total (kg/yr)(2 sig. fig.)
Acetaldehyde 22.6 0.4 0.1 0.2 0.1 0.9 76.5 76.5 590,000Acetone 21.4 0.2 0.2 13.5 1.0 60.9 75.4 3.0 540,000
Acrylic acid 100.0 100.0 0.0019Ammonia (total) 94.8 5.2 270,000
Antimony & compounds 0.4 0.2 0.6 90.4 2.2 92.5 0.5 0.5 6.4 420Arsenic & compounds 64.0 <0.1 0.1 64.1 <0.1 31.8 0.5 32.3 0.4 0.4 3.2 1,400
Benzene 73.8 0.1 <0.1 0.2 <0.1 0.5 0.2 <0.1 <0.1 10.8 2.9 9.2 23.0 <0.1 <0.1 2.7 930,000Beryllium & compounds 54.0 54.0 0.6 36.0 36.6 9.5 9.5 <0.1 3.3Biphenyl (1,1�-biphenyl) 100.0 100.0 10
1,3-Butadiene (vinyl ethylene) 81.1 0.6 0.2 0.3 0.2 1.4 8.1 9.4 17.5 <0.1 160,000Cadmium & compounds 11.7 0.1 <0.1 11.9 0.5 78.3 0.8 79.5 4.1 4.1 4.5 720
Carbon disulfide <0.1 <0.1 100.0 13,000Carbon monoxide 84.6 0.5 <0.1 0.1 <0.1 0.7 <0.1 3.2 8.7 12.0 1.2 1.2 1.5 170,000,000
Chloroform (trichloromethane) 100.0 100.0 470Chromium (III) compounds 92.6 <0.1 <0.1 <0.1 92.7 0.7 3.0 3.6 3.6 3.6 670Chromium (VI) compounds 62.4 <0.1 <0.1 <0.1 62.4 0.4 1.9 25.6 28.0 2.5 2.5 7.1 430
Cobalt & compounds <0.1 <0.1 <0.1 <0.1 0.2 0.8 98.8 <0.1 99.8 0.1 0.1 <0.1 3,400Copper & compounds <0.1 <0.1 <0.1 <0.1 <0.1 0.6 98.5 99.2 0.5 0.5 0.3 4,800
Cumene (1-methylethylbenzene) 40.5 42.2 82.7 17.3 5,900Cyanide (inorganic) compounds 100.0 100.0 9.5
Cyclohexane 4.8 91.5 <0.1 <0.1 0.6 0.2 0.3 92.6 0.4 0.4 2.1 520,0001,2-Dibromoethane 100.0 3.21,2-Dichloroethane 0.6 0.6 99.4 350
Dichloromethane 62.4 37.3 <0.1 99.8 0.2 46,000Ethanol 55.4 55.4 44.6 25,000
2-Ethoxyethanol acetate 77.9 77.9 22.1 38,000Ethyl acetate 100.0 100.0 6,600
Ethylbenzene 87.7 <0.1 <0.1 0.2 <0.1 0.2 <0.1 0.4 8.9 0.3 0.6 <0.1 10.3 <0.1 <0.1 1.8 270,000Ethylene glycol (1,2-ethanediol) 27.4 72.6 100.0 59,000
Ethylene oxide 100.0 100.0 7,100
xix
Table E3 (cont) Percentage contribution by source to the total emission of NPI substances in the Adelaide airshed
ADELAIDE AIRSHED MOBILE SOURCES (%) AREA BASED SOURCES (%) SUB-THRESHOLDFACILITIES (%) (%)
OTHER MOBILE
NPI substance %
Motor vehicles
Aeroplanes
Railways
Recreationalboating
Shipping
TOTA
L: OTH
ERM
OBILE
Architectural
surface coatings
Cutback Bitum
en
Dom
estic/C
omm
ercialsolvents / aerosols
Dry C
leaning
Gaseous fuel
burning (domestic)
Lawn M
owing
Motor V
ehicleRefinishing
Paved Roads
Print Shops /G
raphic Arts
Service stations
Solid fuel burning(dom
estic)
TOTA
LA
REA BA
SED
Fuel Com
bustion
Solvent Use
TOTA
L: SUB-
THRESH
OLD
ReportingFacilities1999-2000
Total (kg/yr)(2 sig. fig.)
Di-(2-Ethylhexyl) phthalate (DEHP) 100.0 100.0 0.28Fluoride compounds <0.1 1.3 1.3 <0.1 <0.1 98.7 44,000
Formaldehyde (methyl aldehyde) 46.9 0.8 0.2 0.2 0.2 1.4 <0.1 <0.1 1.8 49.5 51.4 0.2 0.2 0.1 1,000,000n-Hexane 31.0 <0.1 <0.1 <0.1 0.1 47.6 <0.1 4.1 0.6 0.5 0.4 <0.1 53.2 4.7 4.7 11.0 990,000
Hydrochloric acid 0.3 0.3 42.4 42.4 57.3 300Hydrogen sulfide 100.0 1,600
Lead & compounds 54.2 1.4 <0.1 <0.1 <0.1 1.4 <0.1 0.5 43.0 <0.1 <0.1 43.6 <0.1 <0.1 0.7 65,000Manganese & compounds <0.1 <0.1 <0.1 <0.1 <0.1 0.1 99.6 0.2 99.9 <0.1 <0.1 <0.1 23,000
Mercury & compounds <0.1 <0.1 <0.1 0.2 95.8 0.1 96.0 1.4 1.4 2.5 490Methanol 21.1 78.9 100.0 <0.1 420,000
Methyl ethyl ketone 22.5 4.2 4.9 31.6 68.4 110,000Methyl isobutyl ketone 72.4 19.0 8.5 99.9 <0.1 19,000
Nickel & compounds 3.0 <0.1 <0.1 3.9 6.9 0.3 1.0 72.5 <0.1 73.9 3.2 3.2 16.0 2,800Nickel carbonyl 100.0 4.8
Nickel subsulfide 100.0 0.60Oxides of nitrogen 60.0 0.7 1.8 <0.1 1.0 3.5 1.0 <0.1 0.6 1.7 8.8 8.8 26.0 30,000,000
Particulate matter < 10 µm 5.1 1.5 0.1 <0.1 0.2 1.8 0.2 0.4 50.7 13.6 64.9 1.8 1.8 26.3 11,000,000Phenol 71.2 71.2 <0.1 <0.1 28.8 180
Polycyclic aromatic hydrocarbons 10.8 0.2 <0.1 <0.1 <0.1 0.3 <0.1 <0.1 2.2 11.8 14.0 <0.1 <0.1 74.8 250,000Selenium & compounds <0.1 1.5 1.6 2.5 80.4 8.9 91.8 1.2 1.2 5.5 73
Styrene (ethenylbenzene) 77.4 0.5 0.1 <0.1 0.6 <0.1 4.2 <0.1 16.3 20.6 1.3 45,000Sulfur dioxide 19.7 1.3 0.7 <0.1 6.7 8.8 <0.1 0.1 1.8 2.0 6.0 6.0 63.5 3,200,000
Sulfuric acid 100.0 420Tetrachloroethylene 10.2 89.8 <0.1 100.0 <0.1 130,000
Toluene (methylbenzene) 59.3 <0.1 <0.1 0.2 <0.1 0.3 4.1 <0.1 6.9 <0.1 <0.1 6.2 7.9 0.8 2.7 28.6 <0.1 <0.1 11.8 2,900,000Total volatile organic compounds 44.0 0.1 <0.1 0.1 <0.1 0.4 7.1 0.1 13.5 0.4 <0.1 4.8 1.5 1.1 4.0 15.2 47.9 0.4 0.3 0.6 7.1 40,000,000
Trichloroethylene 0.2 0.2 73.9 73.9 25.9 140,000Xylenes (individual or mixed isomers) 62.6 <0.1 <0.1 <0.1 <0.1 0.2 2.4 <0.1 4.0 0.4 5.4 1.9 0.4 1.7 16.1 <0.1 <0.1 21.1 2,400,000
Zinc and compounds <0.1 <0.1 <0.1 <0.1 0.3 <0.1 93.6 2.6 96.5 2.5 2.5 0.9 30,000
xx
Table E4 Percentage contribution by source to the total emission of NPI substances in the Barossa airshed
BAROSSA AIRSHED MOBILE SOURCES (%) AREA BASED SOURCES (%) SUB-THRESHOLDFACILITIES (%) (%)
OTHER MOBILE
NPI substance %
Motor vehicles
Aeroplanes
Railways
Recreationalboating
Shipping
TOTA
L: OTH
ERM
OBILE
Architectural
surface coatings
Cutback Bitum
en
Dom
estic/C
omm
ercialsolvents/ aerosols
Dry C
leaning
Gaseous fuel
burning (domestic)
Lawn M
owing
Motor V
ehicleRefinishing
Paved Roads
Print Shops /G
raphic Arts
Service stations
Solid fuel burning(dom
estic)
TOTA
LA
REA BA
SED
Fuel Com
bustion
Solvent Use
TOTA
L: SUB-
THRESH
OLD
ReportingFacilities1999-2000
Total (kg/yr)(2 sig. fig.)
Acetaldehyde 12.4 - 0.2 - - 0.2 86.7 86.7 0.7 23,000Acetone 13.5 - - - 5.6 0.4 80.5 86.5 19,000
Acrylic acid - - - 100.0 100.0 0.000027Ammonia (total) 100.0 - - - 5,200
Antimony & compounds - 0.7 - - 0.7 96.7 2.6 99.3 <0.1 <0.1 19Arsenic & compounds - <0.1 - - <0.1 87.2 1.4 88.6 2.0 2.0 9.4 25
Benzene 60.0 - 0.1 - - 0.1 <0.1 <0.1 <0.1 11.1 1.7 26.9 39.7 <0.1 <0.1 23,300Beryllium & compounds - - - <0.1 14.2 14.2 85.8 85.8 0.035Biphenyl (1,1�-biphenyl) - - - 100.0 100.0 0.43
1,3-Butadiene (vinyl ethylene) 74.6 - 0.7 - - 0.7 9.3 15.4 24.7 3,500Cadmium & compounds - 0.2 - - 0.2 <0.1 89.8 0.8 90.5 9.3 9.3 30
Carbon disulfide - - - 100.0 100.0 0.0020Carbon monoxide 68.7 - 0.1 - - 0.1 <0.1 3.9 20.2 24.1 4.9 4.9 2.1 4,100,000
Chloroform (trichloromethane) - - - 100.0 100.0 6.7Chromium (III) compounds - 0.2 - - 0.2 8.4 15.6 24.0 75.8 75.8 3.1Chromium (VI) compounds - <0.1 - - 0.6 1.1 2.5 4.2 5.8 5.8 90.0 18
Cobalt & compounds - <0.1 - - 0.8 0.4 98.6 <0.1 99.8 0.1 0.1 170Copper & compounds - <0.1 - - <0.1 0.3 98.7 99.0 0.9 0.9 230
Cumene (1-methylethylbenzene) - - - 74.5 25.5 100.0 140Cyanide (inorganic) compounds - - - 100.0 100.0 0.039
Cyclohexane 6.6 - - - 89.0 <0.1 <0.1 1.0 0.2 0.3 90.5 2.9 2.9 7,6001,2-Dichloroethane - - - 100.0 100.0 0.032
Dichloromethane - - - 62.1 37.9 <0.1 100.0 660Ethanol - - - 100.0 100.0 190
2-Ethoxyethanol acetate - - - 100.0 100.0 430Ethyl acetate - - - 100.0 100.0 94
Ethylbenzene 88.0 - <0.1 - - 0.1 0.3 11.0 0.2 0.4 <0.1 12.0 <0.1 <0.1 5,400Ethylene glycol (1,2-ethanediol) - - - 27.2 72.8 100.0 850
xxi
Table E4 (cont) Percentage contribution by source to the total emission of NPI substances in the Barossa airshed
BAROSSA AIRSHED MOBILE SOURCES (%) AREA BASED SOURCES (%) SUB-THRESHOLDFACILITIES (%) (%)
OTHER MOBILE
NPI substance %
Motor vehicles
Aeroplanes
Railways
Recreationalboating
Shipping
TOTA
L: OTH
ERM
OBILE
Architectural
surface coatings
Cutback Bitum
en
Dom
estic/C
omm
ercialsolvents / aerosols
Dry C
leaning
Gaseous fuel
burning (domestic)
Lawn M
owing
Motor V
ehicleRefinishing
Paved Roads
Print Shops /G
raphic Arts
Service stations
Solid fuel burning(dom
estic)
TOTA
LA
REA BA
SED
Fuel Com
bustion
Solvent Use
TOTA
L: SUB-
THRESH
OLD
ReportingFacilities1999-2000
Total (kg/yr)(2 sig. fig.)
Ethylene oxide - - - 100.0 100.0 100Di-(2-Ethylhexyl) phthalate (DEHP) - - - 100.0 100.0 0.0011
Fluoride compounds - - - <0.1 0.3 0.3 <0.1 <0.1 99.7 790Formaldehyde (methyl aldehyde) 30.0 - 0.4 - - 0.4 <0.1 <0.1 1.4 67.5 68.9 0.6 0.6 32,000
n-Hexane 34.1 - 0.1 - - 0.1 36.9 <0.1 3.1 <0.1 0.9 0.3 <0.1 41.2 24.5 24.5 18,000Hydrochloric acid - - - 2.1 2.1 97.9 97.9 0.56Hydrogen sulfide 100.0 - - - 32
Lead & compounds 34.1 - <0.1 - - <0.1 0.5 64.0 <0.1 <0.1 64.4 <0.1 <0.1 1.3 2,100Manganese & compounds - <0.1 - - <0.1 <0.1 99.7 0.1 99.9 <0.1 <0.1 1,100
Mercury & compounds - <0.1 - - <0.1 73.9 <0.1 73.9 2.1 2.1 23.9 31Methanol - - - 20.9 79.1 100.0 6,100
Methyl ethyl ketone - - - 40.3 7.6 52.1 100.0 840Methyl isobutyl ketone - - - 72.4 19.0 8.6 100.0 270
Nickel & compounds - <0.1 - - 0.3 0.6 93.7 <0.1 94.7 5.2 5.2 100Nickel carbonyl - - - 100.0 1.9
Oxides of nitrogen 23.0 - 2.1 - - 2.1 0.1 <0.1 0.6 0.7 13.5 13.5 60.7 1,900,000Particulate matter < 10 µm 0.7 - <0.1 - - <0.1 <0.1 17.4 5.2 22.6 1.2 1.2 75.3 1,600,000
Phenol - - - 100.0 100.0 0.00025Polycyclic aromatic hydrocarbons 19.1 - 0.4 - - 0.4 0.3 <0.1 4.8 75.2 80.3 <0.1 <0.1 0.1 2,900
Selenium & compounds - 0.1 - - 0.1 10.7 84.5 3.0 98.1 1.8 1.8 3.4Styrene (ethenylbenzene) 69.5 - - - <0.1 4.4 <0.1 26.0 30.5 1,000
Sulfur dioxide 51.1 - 6.5 - - 6.5 <0.1 0.5 7.7 8.2 3.8 3.8 30.4 26,000Tetrachloroethylene - - - 21.3 78.7 <0.1 100.0 890
Toluene (methylbenzene) 68.1 - <0.1 - - 3.2 <0.1 5.6 <0.1 8.2 6.3 0.7 7.9 31.9 <0.1 <0.1 52,000Total volatile organic compounds 40.9 - 0.2 - - 0.2 4.6 0.3 8.9 <0.1 <0.1 5.3 1.0 4.1 2.7 30.1 57.0 1.6 0.2 1.8 <0.1 860,000
Trichloroethylene - - - 0.2 0.2 99.8 99.8 1,400Xylenes (individual or mixed isomers) 79.4 - <0.1 - - 2.2 <0.1 3.6 8.2 1.6 0.3 4.6 20.5 <0.1 <0.1 39,000
Zinc and compounds - <0.1 - - <0.1 <0.1 92.2 2.7 94.9 5.0 5.0 1,400
xxii
Table E5 Percentage contribution by source to the total emission of NPI substances in the Port Lincoln airshed
PORT LINCOLN AIRSHED MOBILE SOURCES (%) AREA BASED SOURCES (%) SUB-THRESHOLDFACILITIES (%) (%)
OTHER MOBILE
NPI substance %
Motor vehicles
Aeroplanes
Railways
Recreationalboating
Shipping
TOTA
L: OTH
ERM
OBILE
Architectural
surface coatings
Cutback Bitum
en
Dom
estic/C
omm
ercialsolvents/ aerosols
Dry C
leaning
Gaseous fuel
burning (domestic)
Lawn M
owing
Motor V
ehicleRefinishing
Paved Roads
Print Shops /G
raphic Arts
Service stations
Solid fuel burning(dom
estic)
TOTA
LA
REA BA
SED
Fuel Com
bustion
Solvent Use
TOTA
L: SUB-
THRESH
OLD
ReportingFacilities1999-2000
Total (kg/yr)(2 sig. fig.)
Acetaldehyde 6.2 0.8 <0.1 0.5 0.5 1.9 91.9 91.9 18,000Acetone 6.6 0.5 0.5 5.7 0.4 86.6 92.8 15,000
Acrylic acid 100.0 100.0 0.000022Ammonia (total) 100.0 2,100
Antimony & compounds 0.3 1.9 2.2 93.1 4.6 97.7 0.1 0.1 9.6Arsenic & compounds 67.2 <0.1 1.4 68.6 30.5 0.9 31.4 <0.1 34
Benzene 34.6 0.4 <0.1 1.1 0.5 2.0 0.1 <0.1 <0.1 25.1 1.9 32.3 59.5 <0.1 3.8 16,700Beryllium & compounds 99.0 99.0 1.0 1.0 <0.1 0.41Biphenyl (1,1�-biphenyl) 100.0 100.0 0.21
1,3-Butadiene (vinyl ethylene) 48.2 2.6 0.3 2.0 2.2 7.1 23.4 21.2 44.6 0.1 2,300Cadmium & compounds 14.2 <0.1 0.8 15.0 83.6 1.3 84.9 <0.1 16
Carbon disulfide 100.0 100.0 0.0018Carbon monoxide 54.1 2.6 <0.1 0.8 0.4 3.8 <0.1 9.1 33.0 42.1 <0.1 2,200,000
Chloroform (trichloromethane) 100.0 100.0 5.5Chromium (III) compounds 93.4 <0.1 <0.1 0.7 94.1 1.3 4.7 5.9 <0.1 17Chromium (VI) compounds 98.8 <0.1 <0.1 <0.1 98.8 0.1 0.5 0.6 1.2 <0.1 71
Cobalt & compounds <0.1 <0.1 0.4 0.4 1.3 1.3 96.8 <0.1 99.5 <0.1 82Copper & compounds <0.1 <0.1 0.5 0.5 <0.1 1.0 98.5 99.5 <0.1 110
Cumene (1-methylethylbenzene) 54.5 32.2 86.7 13.3 90Cyanide (inorganic) compounds 100.0 100.0 0.034
Cyclohexane 3.5 <0.1 93.5 <0.1 <0.1 2.2 0.2 0.4 96.2 <0.1 0.2 6,0001,2-Dibromoethane 100.0 0.301,2-Dichloroethane 100.0 100.0 0.026
Dichloromethane 63.0 37.0 <0.1 100.0 540Ethanol 100.0 100.0 170
2-Ethoxyethanol acetate 100.0 100.0 350Ethyl acetate 100.0 100.0 78
Ethylbenzene 64.6 0.2 <0.1 1.2 0.2 1.6 0.1 0.4 31.9 0.3 0.6 <0.1 33.4 <0.1 0.5 3,100Ethylene glycol (1,2-ethanediol) 27.8 72.2 100.0 710
Ethylene oxide 100.0 100.0 84
xxiii
Table E5 (cont) Percentage contribution by source to the total emission of NPI substances in the Port Lincoln airshed
PORT LINCOLN AIRSHED MOBILE SOURCES (%) AREA BASED SOURCES (%) SUB-THRESHOLDFACILITIES (%) (%)
OTHER MOBILE
NPI substance %
Motor vehicles
Aeroplanes
Railways
Recreationalboating
Shipping
TOTA
L: OTH
ERM
OBILE
Architectural
surface coatings
Cutback Bitum
en
Dom
estic/C
omm
ercialsolvents/ aerosols
Dry C
leaning
Gaseous fuel
burning (domestic)
Lawn M
owing
Motor V
ehicleRefinishing
Paved Roads
Print Shops /G
raphic Arts
Service stations
Solid fuel burning(dom
estic)
TOTA
LA
REA BA
SED
Fuel Com
bustion
Solvent Use
TOTA
L: SUB-
THRESH
OLD
ReportingFacilities1999-2000
Total (kg/yr)(2 sig. fig.)
Di-(2-Ethylhexyl) phthalate (DEHP) 100.0 100.0 0.0010Fluoride compounds 3.7 93.1 96.8 3.2 3.2 2.1
Formaldehyde (methyl aldehyde) 16.0 2.1 0.1 0.6 1.2 4.0 <0.1 <0.1 2.8 77.1 79.9 <0.1 25,000n-Hexane 27.6 <0.1 0.4 0.9 1.4 59.8 <0.1 5.1 <0.1 1.7 0.6 <0.1 67.1 <0.1 3.8 9,400
Hydrochloric acid 1.5 1.5 98.5 98.5 0.66Hydrogen sulfide 100.0 13
Lead & compounds 30.2 2.4 <0.1 0.1 <0.1 2.5 <0.1 1.2 65.9 <0.1 0.1 67.2 <0.1 990Manganese & compounds <0.1 <0.1 <0.1 <0.1 0.2 99.6 0.2 100.0 <0.1 550
Mercury & compounds <0.1 0.1 0.1 99.8 <0.1 99.8 <0.1 11Methanol 21.2 78.8 100.0 5,000
Methyl ethyl ketone 39.3 7.4 53.3 100.0 710Methyl isobutyl ketone 73.0 18.6 8.4 100.0 230
Nickel & compounds 2.9 <0.1 <0.1 33.1 36.1 0.4 1.5 61.7 <0.1 63.6 0.2 0.2 75Oxides of nitrogen 67.9 0.6 3.5 <0.1 21.4 25.4 0.8 0.2 3.8 4.8 1.8 1.8 250,000
Particulate matter < 10 µm 2.1 1.9 <0.1 <0.1 2.6 4.5 <0.1 0.9 59.9 32.4 93.2 <0.1 220,000Phenol 100.0 100.0 <0.1 7.9
Polycyclic aromatic hydrocarbons 9.5 1.5 0.1 0.4 <0.1 2.0 0.2 9.2 79.1 88.5 <0.1 2,400Selenium & compounds <0.1 12.3 12.3 15.7 67.4 4.5 87.6 <0.1 2
Styrene (ethenylbenzene) 47.7 2.1 0.8 <0.1 2.9 <0.1 12.1 <0.1 37.2 49.3 620Sulfur dioxide 11.2 0.2 0.8 <0.1 81.7 82.7 <0.1 0.3 3.9 4.2 1.9 1.9 47,000
Tetrachloroethylene 18.6 81.4 <0.1 100.0 860Toluene (methylbenzene) 43.8 <0.1 <0.1 1.8 0.3 2.1 4.2 <0.1 7.2 <0.1 21.2 8.4 0.9 10.5 52.3 <0.1 1.8 33,000
Total volatile organic compounds 23.6 0.5 <0.1 0.8 0.5 1.8 5.3 0.2 10.4 0.1 <0.1 12.1 1.2 0.3 3.1 37.3 69.9 <0.1 0.2 0.2 4.4 620,000Trichloroethylene 0.2 0.2 99.8 99.8 1,300
Xylenes (individual or mixed isomers) 56.9 <0.1 <0.1 0.8 0.2 1.0 3.2 <0.1 4.9 23.2 2.4 0.4 7.1 41.2 <0.1 0.7 22,000Zinc and compounds <0.1 <0.1 0.1 0.1 <0.1 0.2 94.6 5.0 99.8 <0.1 680
xxiv
Table E6 Percentage contribution by source to the total emission of NPI substances in the Riverland airshed
RIVERLAND AIRSHED MOBILE SOURCES (%) AREA BASED SOURCES (%) SUB-THRESHOLDFACILITIES (%) (%)
OTHER MOBILE
NPI substance %
Motor vehicles
Aeroplanes
Railways
Recreationalboating
Shipping
TOTA
L: OTH
ERM
OBILE
Architectural
surface coatings
Cutback Bitum
en
Dom
estic/C
omm
ercialsolvents / aerosols
Dry C
leaning
Gaseous fuel
burning (domestic)
Lawn M
owing
Motor V
ehicleRefinishing
Paved Roads
Print Shops /G
raphic Arts
Service stations
Solid fuel burning(dom
estic)
TOTA
LA
REA BA
SED
Fuel Com
bustion
Solvent Use
TOTA
L: SUB-
THRESH
OLD
ReportingFacilities1999-2000
Total (kg/yr)(2 sig. fig.)
Acetaldehyde 8.0 - <0.1 6.6 3.0 9.6 82.3 82.3 44,000Acetone 10.0 - 5.8 0.5 83.7 90.0 31,000
Acrylic acid - 100.0 100.0 0.000047Ammonia (total) 100.0 - 6,000
Antimony & compounds - 0.1 0.1 92.2 7.6 99.8 <0.1 <0.1 12Arsenic & compounds - <0.1 <0.1 <0.1 95.3 4.4 99.7 0.3 0.3 14
Benzene 39.8 - <0.1 13.4 6.1 19.6 <0.1 <0.1 <0.1 11.2 1.7 26.9 39.9 <0.1 <0.1 0.7 41,000Beryllium & compounds - <0.1 77.3 77.3 22.7 22.7 0.011Biphenyl (1,1�-biphenyl) - 100.0 100.0 0.64
1,3-Butadiene (vinyl ethylene) 46.6 - <0.1 20.4 9.3 29.7 8.8 14.9 23.7 <0.1 6600Cadmium & compounds - <0.1 <0.1 <0.1 96.1 2.4 98.5 1.4 1.4 17
Carbon disulfide - 100.0 100.0 0.0036Carbon monoxide 55.8 - <0.1 8.4 3.7 12.1 <0.1 5.0 26.7 31.7 0.3 0.3 <0.1 5,600,000
Chloroform (trichloromethane) - 100.0 100.0 12Chromium (III) compounds - <0.1 5.4 2.2 7.7 28.4 51.8 80.2 12.1 12.1 1.6Chromium (VI) compounds - <0.1 2.2 0.9 3.1 11.3 20.9 47.1 79.2 5.1 5.1 12.5 1.7
Cobalt & compounds - <0.1 0.1 <0.1 0.2 2.3 1.2 96.2 0.1 99.8 <0.1 <0.1 100Copper & compounds - <0.1 <0.1 <0.1 0.1 <0.1 0.9 98.8 99.7 0.1 0.1 140
Cumene (1-methylethylbenzene) - 70.4 28.6 99.0 1.0 220Cyanide (inorganic) compounds - 100.0 100.0 0.070
Cyclohexane 4.6 - 93.4 <0.1 <0.1 1.1 0.2 0.3 95.1 0.2 0.2 0.2 13,0001,2-Dibromoethane - 100.0 0.101,2-Dichloroethane - 100.0 100.0 0.055
Dichloromethane - 62.6 37.4 <0.1 100.0 1,200Ethanol - 100.0 100.0 350
2-Ethoxyethanol acetate - 100.0 100.0 750Ethyl acetate - 100.0 100.0 160
Ethylbenzene 66.6 - <0.1 13.2 5.7 18.9 0.2 0.3 13.2 0.3 0.5 <0.1 14.4 <0.1 <0.1 0.1 8,400
xxv
Table E6 (cont) Percentage contribution by source to the total emission of NPI substances in the Riverland airshed
RIVERLAND AIRSHED MOBILE SOURCES (%) AREA BASED SOURCES (%) SUB-THRESHOLDFACILITIES (%) (%)
OTHER MOBILE
NPI substance %
Motor vehicles
Aeroplanes
Railways
Recreationalboating
Shipping
TOTA
L: OTH
ERM
OBILE
Architectural
surface coatings
Cutback Bitum
en
Dom
estic/C
omm
ercialsolvents / aerosols
Dry C
leaning
Gaseous fuel
burning (domestic)
Lawn M
owing
Motor V
ehicleRefinishing
Paved Roads
Print Shops /G
raphic Arts
Service stations
Solid fuel burning(dom
estic)
TOTA
LA
REA BA
SED
Fuel Com
bustion
Solvent Use
TOTA
L: SUB-
THRESH
OLD
ReportingFacilities1999-2000
Total (kg/yr)(2 sig. fig.)
Ethylene glycol (1,2-ethanediol) - 27.2 72.8 100.0 1,500Ethylene oxide - 100.0 100.0 180
Di-(2-Ethylhexyl) phthalate (DEHP) - 100.0 100.0 0.0020Fluoride compounds - 3.8 94.7 98.5 1.5 1.5 4.4
Formaldehyde (methyl aldehyde) 20.6 - <0.1 7.6 3.5 11.1 <0.1 <0.1 1.4 66.8 68.3 <0.1 <0.1 57,000n-Hexane 31.7 - <0.1 5.2 2.4 7.6 51.5 <0.1 4.4 <0.1 1.3 0.5 <0.1 57.7 1.7 1.7 1.4 23,000
Hydrochloric acid - 3.3 3.3 96.7 96.7 0.64Hydrogen sulfide 100.0 - 37
Lead & compounds 48.9 - <0.1 2.9 <0.1 2.9 <0.1 1.0 47.0 <0.1 0.2 48.2 <0.1 <0.1 1,700Manganese & compounds - <0.1 <0.1 <0.1 <0.1 <0.1 0.2 99.4 0.4 100.0 <0.1 <0.1 690
Mercury & compounds - <0.1 <0.1 <0.1 99.5 <0.1 99.6 0.4 0.4 14Methanol - 20.9 79.1 100.0 11,000
Methyl ethyl ketone - 40.3 7.4 52.3 100.0 1,500Methyl isobutyl ketone - 72.5 18.9 8.6 100.0 480
Nickel & compounds - <0.1 0.2 <0.1 0.3 1.0 2.0 95.5 0.2 98.7 1.0 1.0 61Oxides of nitrogen 90.3 - 0.9 0.5 <0.1 1.4 0.6 0.2 3.0 3.8 3.9 3.9 0.5 640,000
Particulate matter < 10 µm 4.7 - <0.1 <0.1 <0.1 0.1 <0.1 0.6 50.9 43.1 94.6 0.5 0.5 <0.1 320,000Phenol - 100.0 100.0 0.00045
Polycyclic aromatic hydrocarbons 12.2 - <0.1 5.7 2.5 8.3 0.2 <0.1 4.6 74.7 79.6 <0.1 <0.1 <0.1 5,200Selenium & compounds - <0.1 <0.1 25.0 67.3 7.4 99.7 0.2 0.2 2.6
Styrene (ethenylbenzene) 51.5 - 8.9 3.9 12.8 <0.1 5.2 <0.1 30.4 35.7 1,600Sulfur dioxide 38.8 - 0.5 1.5 0.4 2.4 <0.1 0.5 7.9 8.4 1.9 1.9 48.4 45,000
Tetrachloroethylene - 10.8 89.2 <0.1 100.0 3,100Toluene (methylbenzene) 42.9 - <0.1 17.8 8.2 26.0 3.1 <0.1 5.3 <0.1 8.1 6.2 0.6 7.5 30.8 <0.1 <0.1 0.3 96,000
Total volatile organic compounds 27.8 - <0.1 9.6 4.2 13.8 4.8 0.3 8.9 0.2 <0.1 5.6 1.0 1.1 2.8 32.1 56.7 <0.1 0.1 0.2 1.5 1,500,000Trichloroethylene - 0.3 0.3 99.7 99.7 2,100
Xylenes (individual or mixed isomers) 62.1 - <0.1 9.0 4.2 13.2 2.6 0.1 4.2 9.7 1.9 0.4 5.7 24.6 <0.1 <0.1 0.1 58,000Zinc and compounds - <0.1 <0.1 <0.1 <0.1 <0.1 0.1 91.3 7.8 99.3 0.7 0.7 880
xxvi
Table E7 Percentage contribution by source to the total emission of NPI substances in the South East airshed
SOUTH EAST AIRSHED MOBILE SOURCES (%) AREA BASED SOURCES (%) SUB-THRESHOLDFACILITIES (%) (%)
OTHER MOBILE
NPI substance %
Motor vehicles
Aeroplanes
Railways
Recreationalboating
Shipping
TOTA
L: OTH
ERM
OBILE
Architectural
surface coatings
Cutback Bitum
en
Dom
estic/C
omm
ercialsolvents/ aerosols
Dry C
leaning
Gaseous fuel
burning (domestic)
Lawn M
owing
Motor V
ehicleRefinishing
Paved Roads
Print Shops /G
raphic Arts
Service stations
Solid fuel burning(dom
estic)
TOTA
LA
REA BA
SED
Fuel Com
bustion
Solvent Use
TOTA
L: SUB-
THRESH
OLD
ReportingFacilities1999-2000
Total (kg/yr)(2 sig. fig.)
Acetaldehyde 11.4 <0.1 0.6 <0.1 0.6 87.9 87.9 60,000Acetone 12.8 <0.1 5.5 0.4 81.2 87.1 48,000
Acrylic acid 100.0 100.0 0.000068Ammonia (total) 100.0 12,000
Antimony & compounds <0.1 94.1 5.8 99.9 <0.1 22Arsenic & compounds 25.1 <0.1 25.1 <0.1 26.9 1.0 27.8 3.2 3.2 43.9 93
Benzene 55.6 <0.1 1.2 0.1 1.3 0.1 <0.1 <0.1 12.1 1.8 28.5 42.5 <0.1 0.5 56,000Beryllium & compounds 2.3 2.3 0.2 6.7 6.9 90.8 90.8 0.19Biphenyl (1,1�-biphenyl) 100.0 100.0 1.2
1,3-Butadiene (vinyl ethylene) 69.6 0.3 1.9 0.2 2.4 10.2 17.8 28.0 8,400Cadmium & compounds 4.1 <0.1 4.1 0.1 58.4 1.1 59.6 30.8 30.8 5.5 54
Carbon disulfide 100.0 100.0 0.0054Carbon monoxide 48.5 0.5 0.5 <0.1 0.9 <0.1 3.3 17.5 20.8 9.6 9.6 20.0 13,000,000
Chloroform (trichloromethane) 100.0 100.0 17Chromium (III) compounds 46.2 <0.1 <0.1 46.2 2.1 3.4 5.5 39.5 39.5 8.8 35Chromium (VI) compounds 82.0 <0.1 <0.1 82.0 0.4 0.6 1.4 2.4 7.1 7.1 8.5 86
Cobalt & compounds <0.1 <0.1 1.7 0.9 95.7 0.1 98.4 0.6 0.6 1.0 200Copper & compounds <0.1 <0.1 <0.1 0.6 91.5 92.1 4.4 4.4 3.4 290
Cumene (1-methylethylbenzene) 76.1 23.5 99.7 0.3 380Cyanide (inorganic) compounds 100.0 100.0 0.10
Cyclohexane 5.7 85.9 <0.1 <0.1 1.1 0.2 0.3 87.5 6.7 6.7 0.1 20,0001,2-Dichloroethane 100.0 100.0 0.080
Dichloromethane 61.3 38.6 <0.1 100.0 1,600Ethanol 100.0 100.0 500
2-Ethoxyethanol acetate 100.0 100.0 1,100Ethyl acetate 100.0 100.0 240
Ethylbenzene 84.9 <0.1 1.0 0.1 1.1 0.2 0.3 12.8 0.3 0.5 <0.1 13.9 <0.1 0.1 13,000Ethylene glycol (1,2-ethanediol) 26.9 73.1 100.0 2,200
xxvii
Table E7 (cont) Percentage contribution by source to the total emission of NPI substances in the South East airshed
SOUTH AIRSHED MOBILE SOURCES (%) AREA BASED SOURCES (%) SUB-THRESHOLDFACILITIES (%) (%)
OTHER MOBILE
NPI substance %
Motor vehicles
Aeroplanes
Railways
Recreational boating
Shipping
TOTA
L: OTH
ERM
OBILE
Architectural surface
coatings
Cutback Bitum
en
Dom
estic/C
omm
ercialsolvents / aerosols
Dry C
leaning
Gaseous fuel burning
(domestic)
Lawn M
owing
Motor V
ehicleRefinishing
Paved Roads
Print Shops / Graphic
Arts
Service stations
Solid fuel burning(dom
estic)
TOTA
LA
REA BA
SED
Fuel Com
bustion
Solvent Use
TOTA
L: SUB-
THRESH
OLD
ReportingFacilities1999-2000
Total (kg/yr)(2 sig. fig.)
Ethylene oxide 100.0 100.0 260Di-(2-Ethylhexyl) phthalate (DEHP) 100.0 100.0 0.0030
Fluoride compounds 0.3 6.8 7.0 0.2 0.2 92.8 92Formaldehyde (methyl aldehyde) 27.4 0.2 0.6 <0.1 0.8 <0.1 <0.1 1.4 68.8 70.2 1.4 1.4 83,000
n-Hexane 23.0 0.2 <0.1 0.2 27.9 <0.1 2.5 0.2 0.7 0.3 <0.1 31.5 44.7 44.7 0.5 60,000Hydrochloric acid 2.2 2.2 97.8 97.8 1.4Hydrogen sulfide 100.0 70
Lead & compounds 49.0 0.7 0.1 <0.1 0.9 <0.1 0.8 47.7 <0.1 0.1 48.6 0.2 0.2 1.3 3,200Manganese & compounds <0.1 <0.1 <0.1 0.1 99.1 0.3 99.6 0.4 0.4 1,300
Mercury & compounds <0.1 <0.1 85.5 <0.1 85.5 12.5 12.5 1.9 31Methanol 2.4 9.1 11.5 88.5 130,000
Methyl ethyl ketone 39.0 7.2 53.8 100.0 2,200Methyl isobutyl ketone 72.5 18.8 8.7 100.0 690
Nickel & compounds 1.5 <0.1 <0.1 1.5 0.7 1.2 73.8 0.1 75.8 21.3 21.3 1.3 150Nickel carbonyl 100.0 2.0
Nickel subsulfide 100.0 4.2Oxides of nitrogen 33.5 <0.1 <0.1 <0.1 0.4 <0.1 1.0 1.4 51.8 51.8 13.2 2,900,000
Particulate matter < 10 µm 2.5 0.4 <0.1 <0.1 0.4 <0.1 0.3 27.9 18.8 46.9 10.0 10.0 40.1 1,100,000Phenol 100.0 100.0 <0.1 2.9
Polychlorinated dioxins and furans 100.0 0.0018Polycyclic aromatic hydrocarbons 12.3 0.1 0.4 <0.1 0.5 0.2 <0.1 3.6 58.4 62.2 0.1 0.1 24.8 10,000
Selenium & compounds <0.1 19.7 67.3 5.6 92.6 7.4 7.4 4.8Styrene (ethenylbenzene) 64.8 0.2 0.7 <0.1 0.9 <0.1 4.9 <0.1 29.3 34.2 2400
Sulfur dioxide 12.3 <0.1 <0.1 <0.1 <0.1 0.1 2.1 2.2 1.3 1.3 84.1 260,000Tetrachloroethylene 25.9 74.1 <0.1 100.0 1,900
Toluene (methylbenzene) 63.2 <0.1 1.6 0.2 1.8 3.5 <0.1 6.0 <0.1 8.9 6.9 0.7 8.9 34.7 <0.1 0.2 120,000Total volatile organic compounds 36.5 <0.1 0.8 <0.1 0.8 4.8 0.3 9.3 <0.1 <0.1 5.6 1.0 0.9 2.8 32.2 56.9 3.8 0.1 4.0 1.6 2,100,000
Trichloroethylene 0.3 0.3 99.7 99.7 2,800Xylenes (individual or mixed isomers) 75.9 <0.1 0.7 <0.1 0.7 2.4 0.1 3.9 9.3 1.8 0.4 5.4 23.3 <0.1 0.1 90,000
Zinc and compounds <0.1 <0.1 0.1 <0.1 74.0 4.9 78.9 21.0 21.0 2,100
xxviii
Table E8 Percentage contribution by source to the total emission of NPI substances in the Spencer Gulf airshed
SPENCER GULF AIRSHED MOBILE SOURCES (%) AREA BASED SOURCES (%) SUB-THRESHOLDFACILITIES (%) (%)
OTHER MOBILE
NPI substance %
Motor vehicles
Aeroplanes
Railways
Recreationalboating
Shipping
TOTA
L: OTH
ERM
OBILE
Architectural
surface coatings
Cutback Bitum
en
Dom
estic/C
omm
ercialsolvents / aerosols
Dry C
leaning
Gaseous fuel
burning (domestic)
Lawn M
owing
Motor V
ehicleRefinishing
Paved Roads
Print Shops /G
raphic Arts
Service stations
Solid fuel burning(dom
estic)
TOTA
LA
REA BA
SED
Fuel Com
bustion
Solvent Use
TOTA
L: SUB-
THRESH
OLD
ReportingFacilities1999-2000
Total (kg/yr)(2 sig. fig.)
Acetaldehyde 4.1 0.3 0.4 1.0 2.1 3.8 92.1 92.1 86,000Acetone 4.7 0.2 0.2 6.0 0.4 88.6 95.0 65,000
Acrylic acid 100.0 100.0 0.000099Ammonia (total) 100.0 6,000
Antimony & compounds 5.0 7.0 12.0 75.1 12.7 87.8 0.1 0.1 16Arsenic & compounds 2.7 <0.1 0.2 2.9 <0.1 0.8 <0.1 0.8 <0.1 96.2 1,700
Benzene 16.6 0.1 0.2 1.8 3.2 5.3 <0.1 <0.1 <0.1 20.1 1.5 26.5 48.1 <0.1 29.9 90,000Beryllium & compounds 99.0 99.0 <0.1 0.8 0.8 0.2 0.2 2.3Biphenyl (1,1�-biphenyl) 100.0 100.0 0.68
1,3-Butadiene (vinyl ethylene) 32.4 1.2 1.8 4.6 9.5 17.2 26.3 24.1 50.4 0.0 9,000Cadmium & compounds 3.4 0.3 0.6 4.3 <0.1 13.5 0.7 14.2 0.3 0.3 81.2 130
Carbon disulfide 100.0 100.0 0.0080Carbon monoxide 2.7 0.1 <0.1 0.1 0.3 0.5 <0.1 0.8 3.1 3.9 <0.1 92.8 110,000,000
Chloroform (trichloromethane) 100.0 100.0 25Chromium (III) compounds 84.4 <0.1 <0.1 2.1 86.5 2.8 9.7 12.5 0.9 0.9 38Chromium (VI) compounds 67.1 <0.1 <0.1 0.1 67.2 0.2 0.7 0.8 1.7 <0.1 31.0 210
Cobalt & compounds <0.1 <0.1 1.3 1.3 3.2 3.3 66.2 0.2 72.9 <0.1 25.7 160Copper & compounds 0.1 <0.1 1.6 1.7 0.1 3.4 94.6 98.1 0.2 0.2 150
Cumene (1-methylethylbenzene) 54.7 44.2 98.9 1.1 290Cyanide (inorganic) compounds 100.0 100.0 0.15
Cyclohexane 2.1 <0.1 94.9 <0.1 <0.1 2.2 0.2 0.3 97.6 0.1 0.1 0.1 26,0001,2-Dibromoethane 100.0 0.101,2-Dichloroethane 100.0 100.0 0.12
Dichloromethane 62.2 37.8 <0.1 100.0 2,400Ethanol 100.0 100.0 720
2-Ethoxyethanol acetate 100.0 100.0 1,500Ethyl acetate 100.0 100.0 350
Ethylbenzene 49.4 <0.1 <0.1 3.1 5.0 8.1 0.1 0.5 40.5 0.4 0.8 <0.1 42.3 <0.1 0.1 11,000
xxix
Table E8 (cont) Percentage contribution by source to the total emission of NPI substances in the Spencer Gulf airshed
SPENCER GULF AIRSHED MOBILE SOURCES (%) AREA BASED SOURCES (%) SUB-THRESHOLDFACILITIES (%) (%)
OTHER MOBILE
NPI substance %
Motor vehicles
Aeroplanes
Railways
Recreationalboating
Shipping
TOTA
L: OTH
ERM
OBILE
Architectural
surface coatings
Cutback Bitum
en
Dom
estic/C
omm
ercialsolvents / aerosols
Dry C
leaning
Gaseous fuel
burning (domestic)
Lawn M
owing
Motor V
ehicleRefinishing
Paved Roads
Print Shops /G
raphic Arts
Service stations
Solid fuel burning(dom
estic)
TOTA
LA
REA BA
SED
Fuel Com
bustion
Solvent Use
TOTA
L: SUB-
THRESH
OLD
ReportingFacilities1999-2000
Total (kg/yr)(2 sig. fig.)
Ethylene glycol (1,2-ethanediol) 27.2 72.8 100.0 3,200Ethylene oxide 100.0 100.0 380
Di-(2-Ethylhexyl) phthalate (DEHP) 100.0 100.0 0.0045Fluoride compounds <0.1 <0.1 <0.1 100.0 58,000
Formaldehyde (methyl aldehyde) 10.8 0.9 0.9 1.3 3.2 6.2 <0.1 <0.1 3.0 79.9 82.9 <0.1 106,000n-Hexane 18.7 0.4 1.0 2.2 3.6 66.8 <0.1 5.9 0.3 1.9 0.6 <0.1 75.4 1.8 1.8 0.6 37,000
Hydrochloric acid 2.8 2.8 97.2 97.2 1.6Hydrogen sulfide 100.0 40
Lead & compounds 2.7 0.2 <0.1 <0.1 <0.1 0.2 <0.1 0.2 2.9 <0.1 <0.1 3.1 <0.1 94.0 30,000Manganese & compounds <0.1 <0.1 <0.1 <0.1 0.7 98.4 0.8 99.9 <0.1 730
Mercury & compounds 0.5 0.3 0.8 <0.1 49.1 <0.1 49.1 0.3 0.3 49.7 30Methanol 20.7 79.3 100.0 23,000
Methyl ethyl ketone 40.1 7.4 52.5 100.0 3,200Methyl isobutyl ketone 72.2 19.1 8.7 100.0 1,000
Nickel & compounds 1.9 <0.1 <0.1 68.2 70.1 0.7 2.2 26.4 0.1 29.4 0.5 0.5 230Oxides of nitrogen 3.1 <0.1 1.2 <0.1 1.6 2.8 <0.1 <0.1 0.2 0.2 0.2 0.2 93.6 20,000,000
Particulate matter < 10 µm 0.3 0.2 0.1 <0.1 0.8 1.1 <0.1 0.2 3.8 7.0 11.0 <0.1 87.5 4,600,000Phenol 100.0 100.0 <0.1 15
Polycyclic aromatic hydrocarbons 4.6 0.5 0.6 0.7 1.1 2.9 <0.1 <0.1 7.6 65.6 73.2 <0.1 19.2 13,000Selenium & compounds 0.5 27.5 28.0 28.0 35.8 8.1 71.8 0.2 0.2 5.1
Styrene (ethenylbenzene) 32.9 1.0 1.8 2.9 5.8 <0.1 14.4 0.1 46.7 61.3 2,400Sulfur dioxide <0.1 <0.1 <0.1 <0.1 0.4 0.4 <0.1 <0.1 <0.1 <0.1 99.5 61,000,000
Tetrachloroethylene 24.4 75.6 <0.1 100.0 2,900Toluene (methylbenzene) 28.7 <0.1 0.1 3.9 6.4 10.4 4.5 <0.1 8.0 <0.1 23.3 8.7 0.9 11.6 57.0 <0.1 3.9 140,000
Total volatile organic compounds 15.9 0.3 0.4 1.7 3.3 5.7 6.0 0.2 11.4 <0.1 <0.1 13.8 1.3 0.6 3.5 40.7 77.5 <0.1 0.1 0.1 0.6 2,500,000Trichloroethylene 0.4 0.4 99.6 99.6 3,200
Xylenes (individual or mixed isomers) 41.7 <0.1 <0.1 2.0 3.3 5.3 3.8 <0.1 6.2 27.8 2.9 0.6 8.7 50.0 <0.1 2.9 80,000Zinc and compounds 0.2 <0.1 0.4 0.6 0.3 0.5 82.9 14.6 98.4 1.0 1.0 1,000
NPI Summary Report: Adelaide and regional airsheds 1998-99
1
Section 1: Introduction
This report provides an overview of the aggregated air emissions estimated within the Adelaideand regional South Australian airsheds. Emissions from each source are listed in Table 2 of theNational Pollutant Inventory (NPI)�National Environment Protection Measure (NEPM). Table 2NPI substances include 90 substances that are common products of combustion, metals, andvolatile organic compounds (VOC). Aggregate air emission sources include facilities that are notrequired to report, as well as anthropogenic sources such as domestic and commercial activities.These aggregate sources together contribute a significant proportion of the total pollutionproducts emitted to the environment.
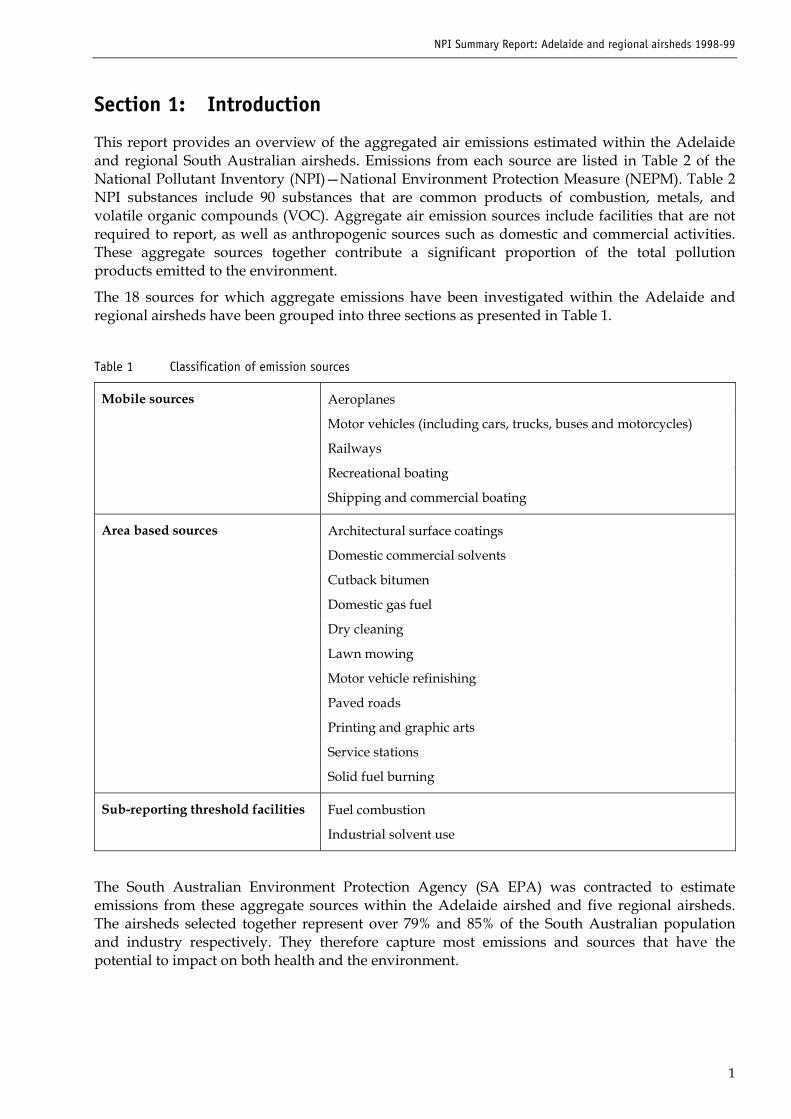
The 18 sources for which aggregate emissions have been investigated within the Adelaide andregional airsheds have been grouped into three sections as presented in Table 1.
Table 1 Classification of emission sources
Mobile sources Aeroplanes
Motor vehicles (including cars, trucks, buses and motorcycles)
Railways
Recreational boating
Shipping and commercial boating
Area based sources Architectural surface coatings
Domestic commercial solvents
Cutback bitumen
Domestic gas fuel
Dry cleaning
Lawn mowing
Motor vehicle refinishing
Paved roads
Printing and graphic arts
Service stations
Solid fuel burning
Sub-reporting threshold facilities Fuel combustion
Industrial solvent use
The South Australian Environment Protection Agency (SA EPA) was contracted to estimateemissions from these aggregate sources within the Adelaide airshed and five regional airsheds.The airsheds selected together represent over 79% and 85% of the South Australian populationand industry respectively. They therefore capture most emissions and sources that have thepotential to impact on both health and the environment.
NPI Summary Report: Adelaide and regional airsheds 1998-99
2
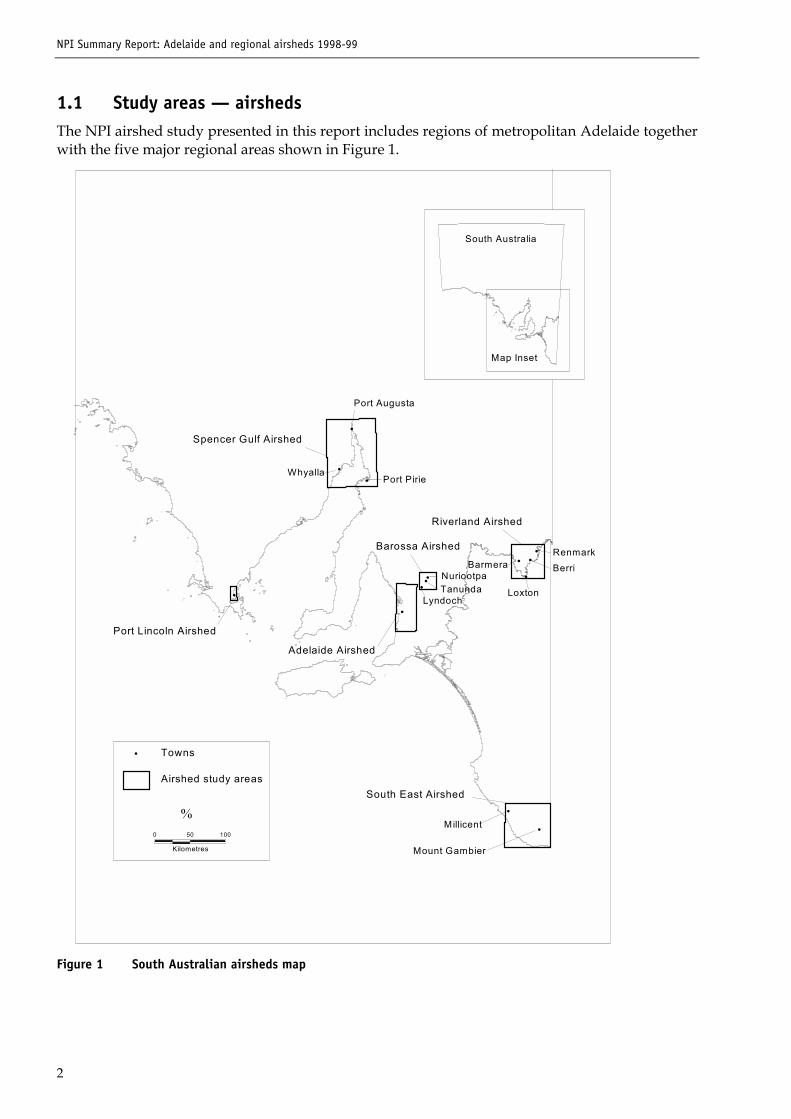
1.1 Study areas � airshedsThe NPI airshed study presented in this report includes regions of metropolitan Adelaide togetherwith the five major regional areas shown in Figure 1.
500
Kilometres
�
�
Port Lincoln Airshed
Spencer Gulf Airshed
�
Adelaide Airshed
Towns
Airshed study areas
100
South East Airshed
Mount Gambier
Millicent�
�
Port Pirie�
Port Augusta
Whyalla
�
�
�
Barossa Airshed
�
�
�
Lyndoch
BarmeraNuriootpaTanunda
Riverland Airshed
Renmark
�
�
�
�
Loxton
Berri
Map Inset
South Australia
Figure 1 South Australian airsheds map
NPI Summary Report: Adelaide and regional airsheds 1998-99
3
The five major regional airsheds�Barossa, Port Lincoln, Riverland, South East and the SpencerGulf�represent the State�s diverse land use and industrial activities. With the exception of PortLincoln, each major regional airshed was sectioned into 5-km square grids to represent each area�svarying population density as well as large areas of agricultural and natural vegetation. The PortLincoln airshed was sectioned into 1-km square grids to represent the town�s population andindustrial activities.
Within four of the major regional airsheds, smaller airsheds were constructed to better representthe town�s populations and industrial activities. These minor regional airsheds were proportionedinto grids measuring 1 km square. A total of 11 minor regional airsheds were studied within themajor regional airsheds of Barossa, Riverland, South East and Spencer Gulf.
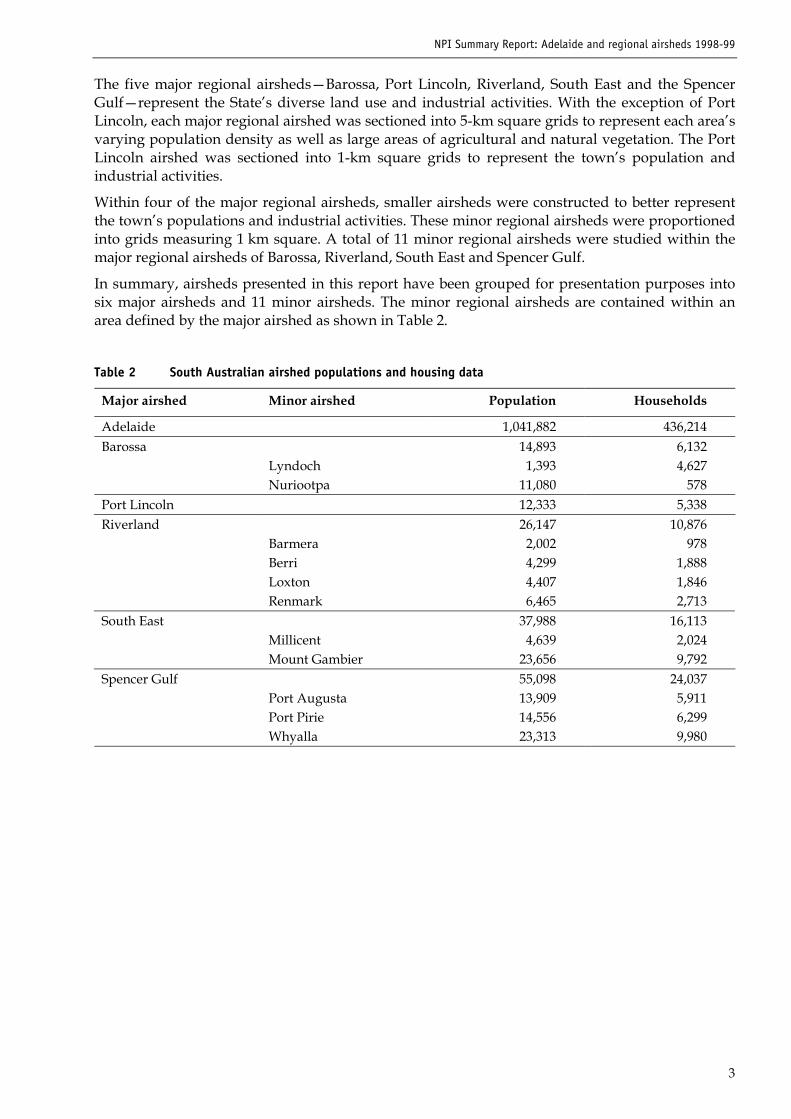
In summary, airsheds presented in this report have been grouped for presentation purposes intosix major airsheds and 11 minor airsheds. The minor regional airsheds are contained within anarea defined by the major airshed as shown in Table 2.
Table 2 South Australian airshed populations and housing data
Major airshed Minor airshed Population Households
Adelaide 1,041,882 436,214Barossa
LyndochNuriootpa
14,8931,393
11,080
6,1324,627
578Port Lincoln 12,333 5,338Riverland
BarmeraBerriLoxtonRenmark
26,1472,0024,2994,4076,465
10,876978
1,8881,8462,713
South EastMillicentMount Gambier
37,9884,639
23,656
16,1132,0249,792
Spencer GulfPort AugustaPort PirieWhyalla
55,09813,90914,55623,313
24,0375,9116,2999,980
NPI Summary Report: Adelaide and regional airsheds 1998-99
4
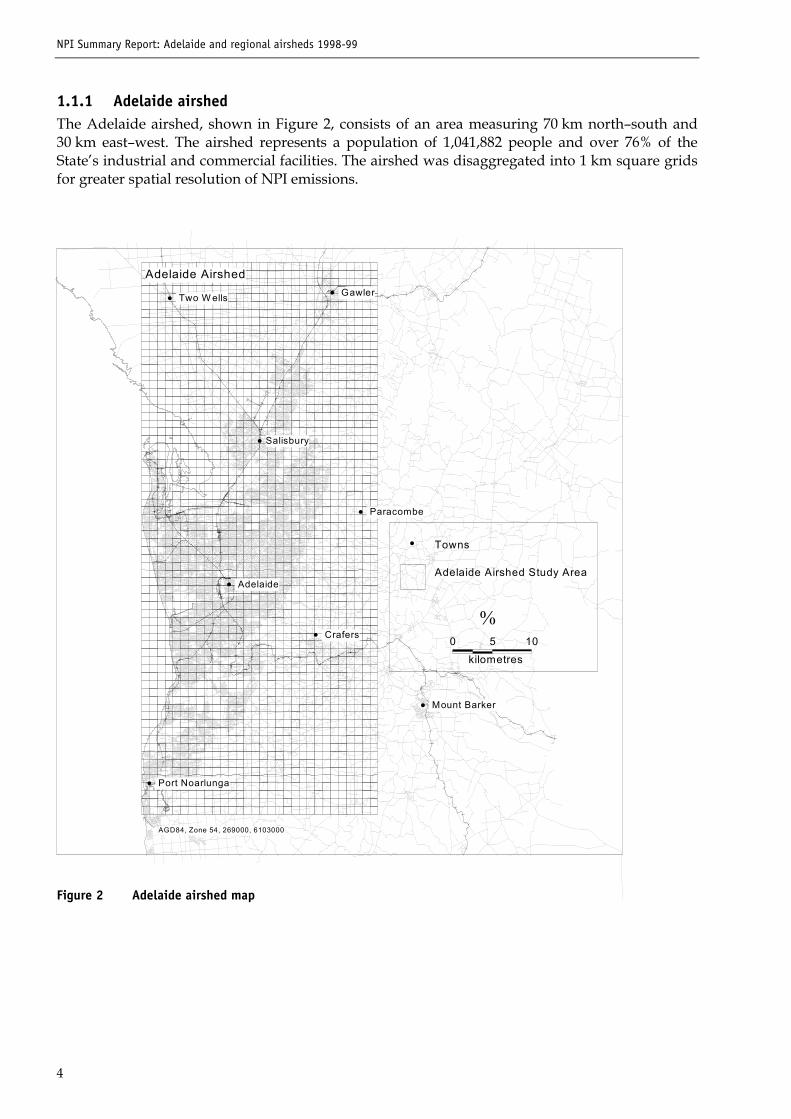
1.1.1 Adelaide airshedThe Adelaide airshed, shown in Figure 2, consists of an area measuring 70 km north�south and30 km east�west. The airshed represents a population of 1,041,882 people and over 76% of theState�s industrial and commercial facilities. The airshed was disaggregated into 1 km square gridsfor greater spatial resolution of NPI emissions.
��
�
�
�
�
�
�
AGD84, Zone 54, 269000, 6103000
Adelaide Airshed
�
kilometres5
�
0 10
Towns
Adelaide Airshed Study Area
Port Noarlunga
Mount Barker
Paracombe
Crafers
Two W ells
Adelaide
Gawler
Salisbury
Figure 2 Adelaide airshed map
NPI Summary Report: Adelaide and regional airsheds 1998-99
5
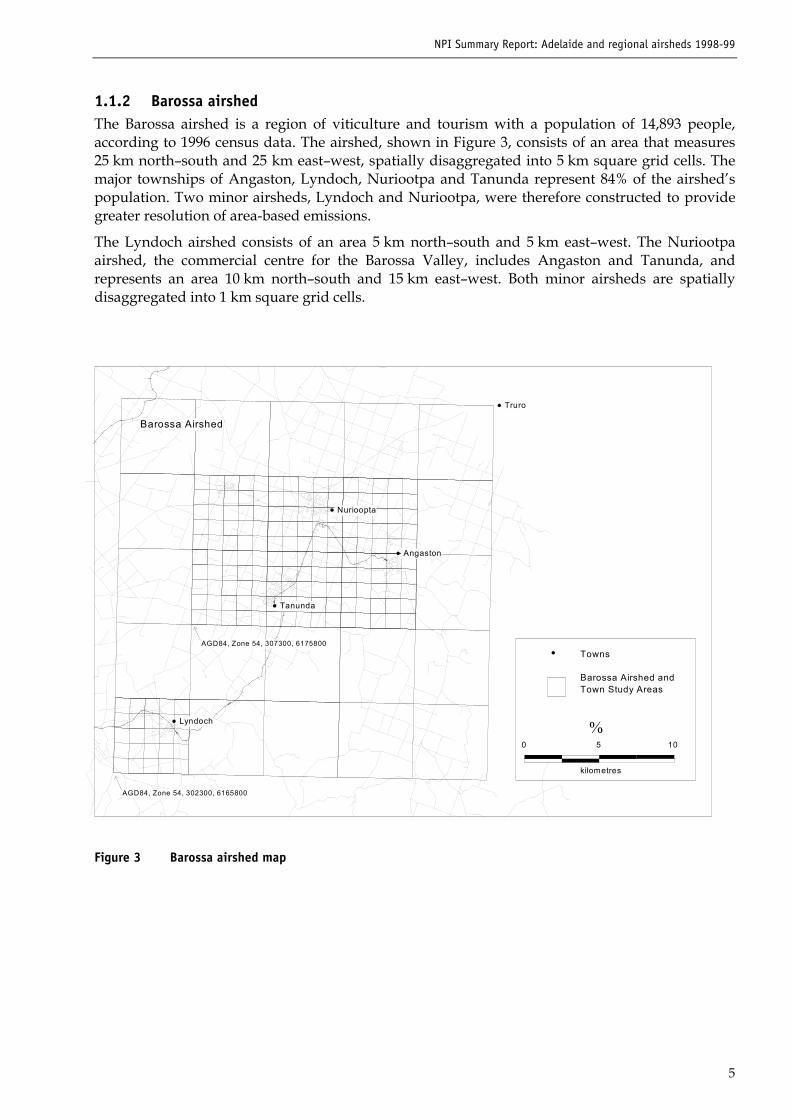
1.1.2 Barossa airshedThe Barossa airshed is a region of viticulture and tourism with a population of 14,893 people,according to 1996 census data. The airshed, shown in Figure 3, consists of an area that measures25 km north�south and 25 km east�west, spatially disaggregated into 5 km square grid cells. Themajor townships of Angaston, Lyndoch, Nuriootpa and Tanunda represent 84% of the airshed�spopulation. Two minor airsheds, Lyndoch and Nuriootpa, were therefore constructed to providegreater resolution of area-based emissions.
The Lyndoch airshed consists of an area 5 km north�south and 5 km east�west. The Nuriootpaairshed, the commercial centre for the Barossa Valley, includes Angaston and Tanunda, andrepresents an area 10 km north�south and 15 km east�west. Both minor airsheds are spatiallydisaggregated into 1 km square grid cells.
�
�
�
�
�
Barossa Airshed
AGD84, Zone 54, 302300, 6165800
AGD84, Zone 54, 307300, 6175800
0 5
�
kilometres
�
10
Towns
Barossa Airshed andTown Study Areas
Nurioopta
Lyndoch
Angaston
Tanunda
Truro
Figure 3 Barossa airshed map
NPI Summary Report: Adelaide and regional airsheds 1998-99
6
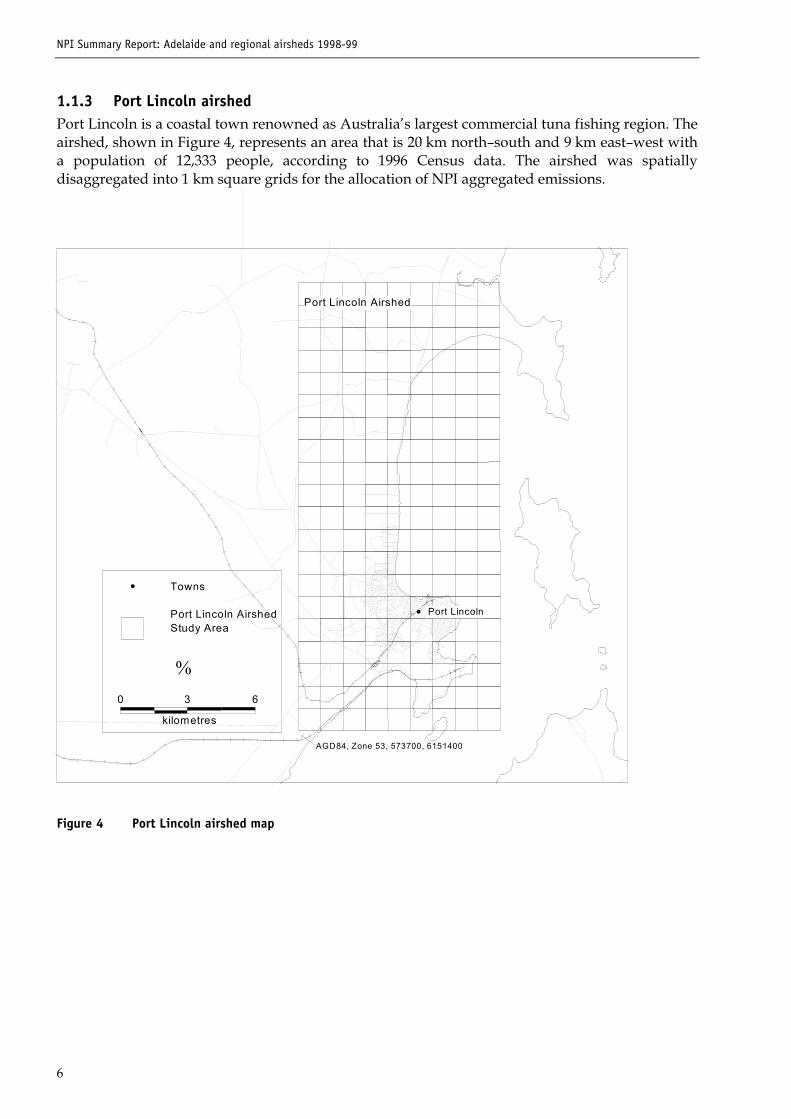
1.1.3 Port Lincoln airshedPort Lincoln is a coastal town renowned as Australia�s largest commercial tuna fishing region. Theairshed, shown in Figure 4, represents an area that is 20 km north�south and 9 km east�west witha population of 12,333 people, according to 1996 Census data. The airshed was spatiallydisaggregated into 1 km square grids for the allocation of NPI aggregated emissions.
�
30
kilometres
�
�
6
Towns
Port Lincoln Airshed Study Area
Port Lincoln Airshed
AGD84, Zone 53, 573700, 6151400
Port Lincoln
Figure 4 Port Lincoln airshed map
NPI Summary Report: Adelaide and regional airsheds 1998-99
7
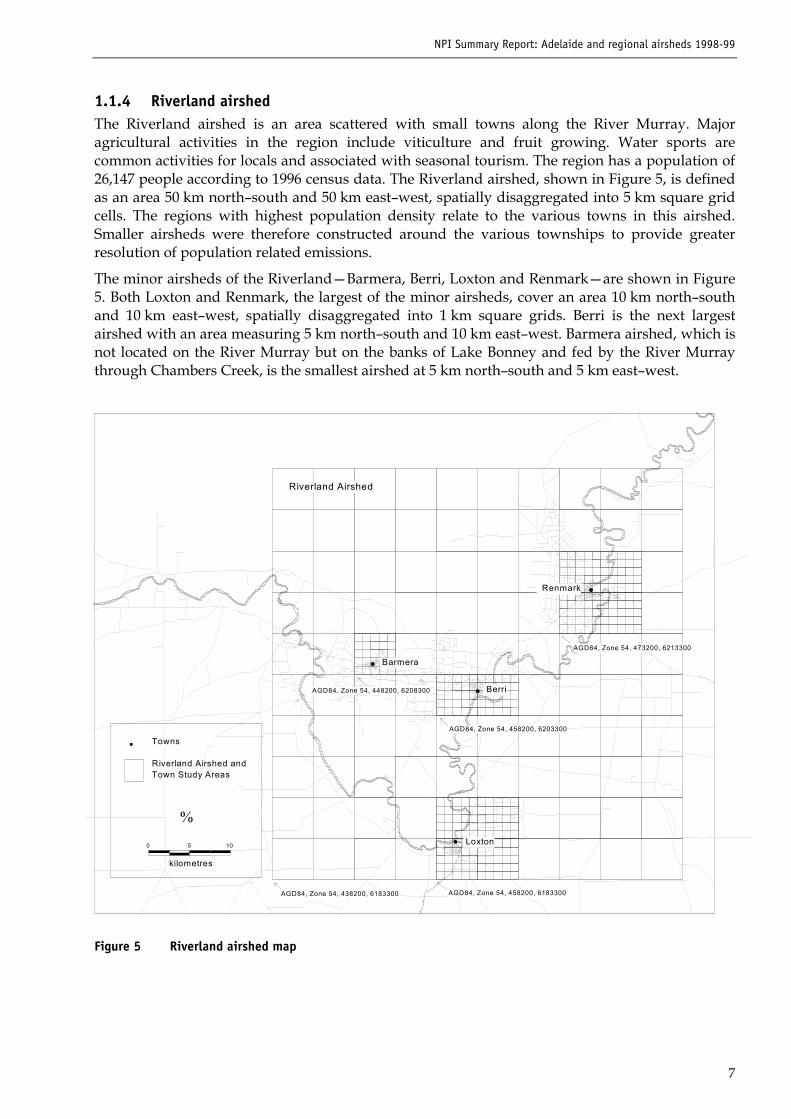
1.1.4 Riverland airshedThe Riverland airshed is an area scattered with small towns along the River Murray. Majoragricultural activities in the region include viticulture and fruit growing. Water sports arecommon activities for locals and associated with seasonal tourism. The region has a population of26,147 people according to 1996 census data. The Riverland airshed, shown in Figure 5, is definedas an area 50 km north�south and 50 km east�west, spatially disaggregated into 5 km square gridcells. The regions with highest population density relate to the various towns in this airshed.Smaller airsheds were therefore constructed around the various townships to provide greaterresolution of population related emissions.
The minor airsheds of the Riverland�Barmera, Berri, Loxton and Renmark�are shown in Figure5. Both Loxton and Renmark, the largest of the minor airsheds, cover an area 10 km north�southand 10 km east�west, spatially disaggregated into 1 km square grids. Berri is the next largestairshed with an area measuring 5 km north�south and 10 km east�west. Barmera airshed, which isnot located on the River Murray but on the banks of Lake Bonney and fed by the River Murraythrough Chambers Creek, is the smallest airshed at 5 km north�south and 5 km east�west.
�
�
�
�
0
�Towns
Riverland Airshed andTown Study Areas
5
kilometres
10
�
AGD84, Zone 54, 438200, 6183300 AGD84, Zone 54, 458200, 6183300
Riverland Airshed
AGD84, Zone 54, 448200, 6208300
AGD84, Zone 54, 473200, 6213300
AGD84, Zone 54, 458200, 6203300
Berri
Loxton
Barmera
Renmark
Figure 5 Riverland airshed map
NPI Summary Report: Adelaide and regional airsheds 1998-99
8
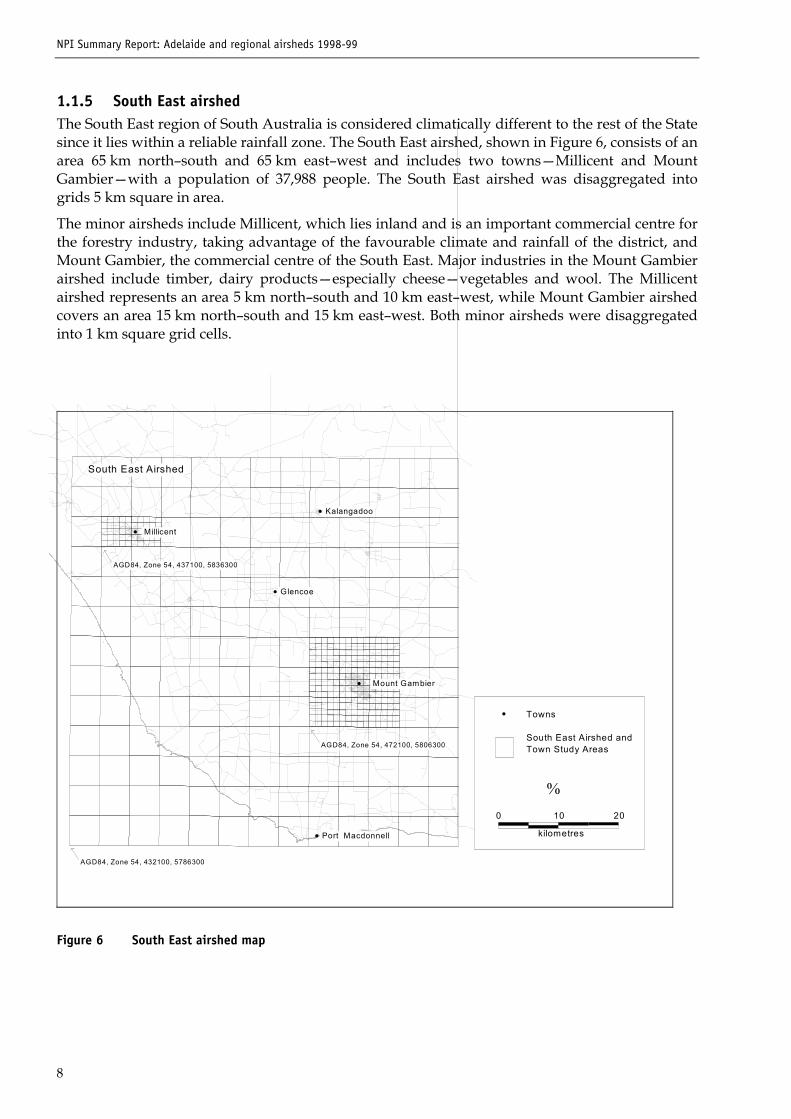
1.1.5 South East airshedThe South East region of South Australia is considered climatically different to the rest of the Statesince it lies within a reliable rainfall zone. The South East airshed, shown in Figure 6, consists of anarea 65 km north�south and 65 km east�west and includes two towns�Millicent and MountGambier�with a population of 37,988 people. The South East airshed was disaggregated intogrids 5 km square in area.
The minor airsheds include Millicent, which lies inland and is an important commercial centre forthe forestry industry, taking advantage of the favourable climate and rainfall of the district, andMount Gambier, the commercial centre of the South East. Major industries in the Mount Gambierairshed include timber, dairy products�especially cheese�vegetables and wool. The Millicentairshed represents an area 5 km north�south and 10 km east�west, while Mount Gambier airshedcovers an area 15 km north�south and 15 km east�west. Both minor airsheds were disaggregatedinto 1 km square grid cells.
�
�
�
�
�
AGD84, Zone 54, 432100, 5786300
AGD84, Zone 54, 437100, 5836300
South East Airshed
AGD84, Zone 54, 472100, 5806300
0
�
�
10 20
kilometres
Towns
South East Airshed andTown Study Areas
Port Macdonnell
Kalangadoo
Glencoe
Millicent
Mount Gambier
Figure 6 South East airshed map
NPI Summary Report: Adelaide and regional airsheds 1998-99
9
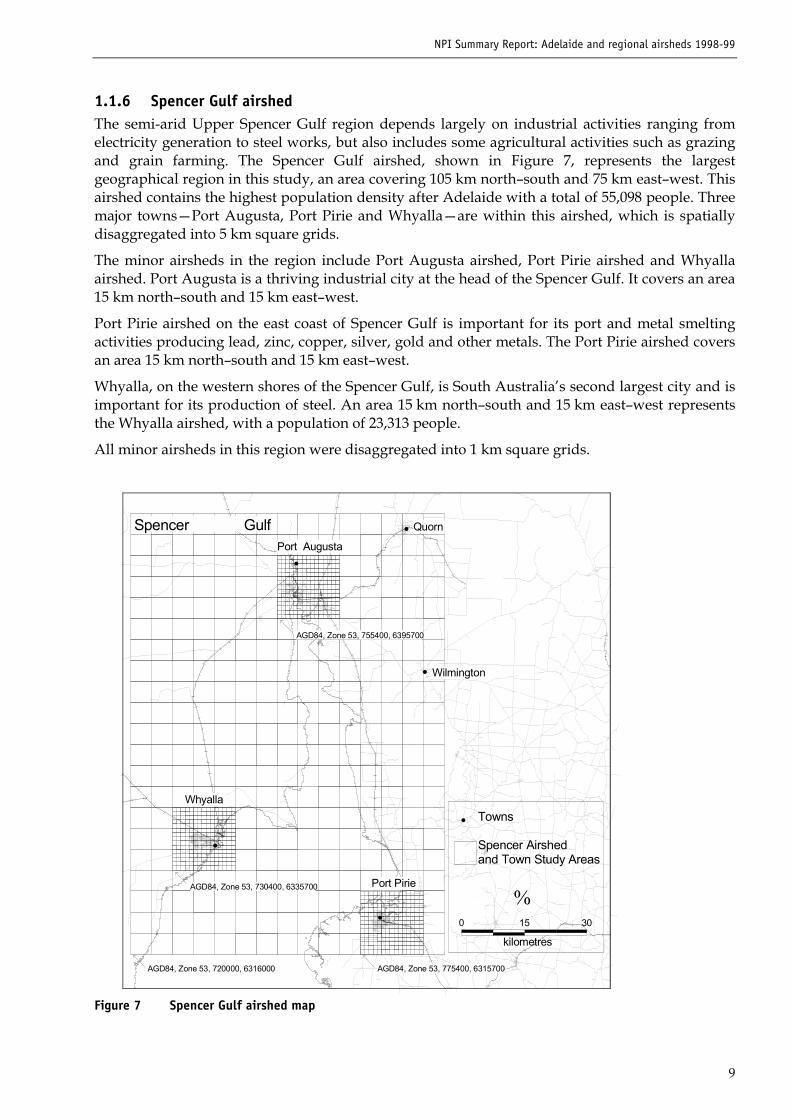
1.1.6 Spencer Gulf airshedThe semi-arid Upper Spencer Gulf region depends largely on industrial activities ranging fromelectricity generation to steel works, but also includes some agricultural activities such as grazingand grain farming. The Spencer Gulf airshed, shown in Figure 7, represents the largestgeographical region in this study, an area covering 105 km north�south and 75 km east�west. Thisairshed contains the highest population density after Adelaide with a total of 55,098 people. Threemajor towns�Port Augusta, Port Pirie and Whyalla�are within this airshed, which is spatiallydisaggregated into 5 km square grids.
The minor airsheds in the region include Port Augusta airshed, Port Pirie airshed and Whyallaairshed. Port Augusta is a thriving industrial city at the head of the Spencer Gulf. It covers an area15 km north�south and 15 km east�west.
Port Pirie airshed on the east coast of Spencer Gulf is important for its port and metal smeltingactivities producing lead, zinc, copper, silver, gold and other metals. The Port Pirie airshed coversan area 15 km north�south and 15 km east�west.
Whyalla, on the western shores of the Spencer Gulf, is South Australia�s second largest city and isimportant for its production of steel. An area 15 km north�south and 15 km east�west representsthe Whyalla airshed, with a population of 23,313 people.
All minor airsheds in this region were disaggregated into 1 km square grids.
�
�
�
�
�
Spencer Gulf
Whyalla
AGD84, Zone 53, 720000, 6316000
AGD84, Zone 53, 730400, 6335700
0
Port Pirie
AGD84, Zone 53, 775400, 6315700
�
30
Towns
Spencer Airshedand Town Study Areas
Wilmington
Quorn
Port Augusta
AGD84, Zone 53, 755400, 6395700
kilometres
15
�
Figure 7 Spencer Gulf airshed map
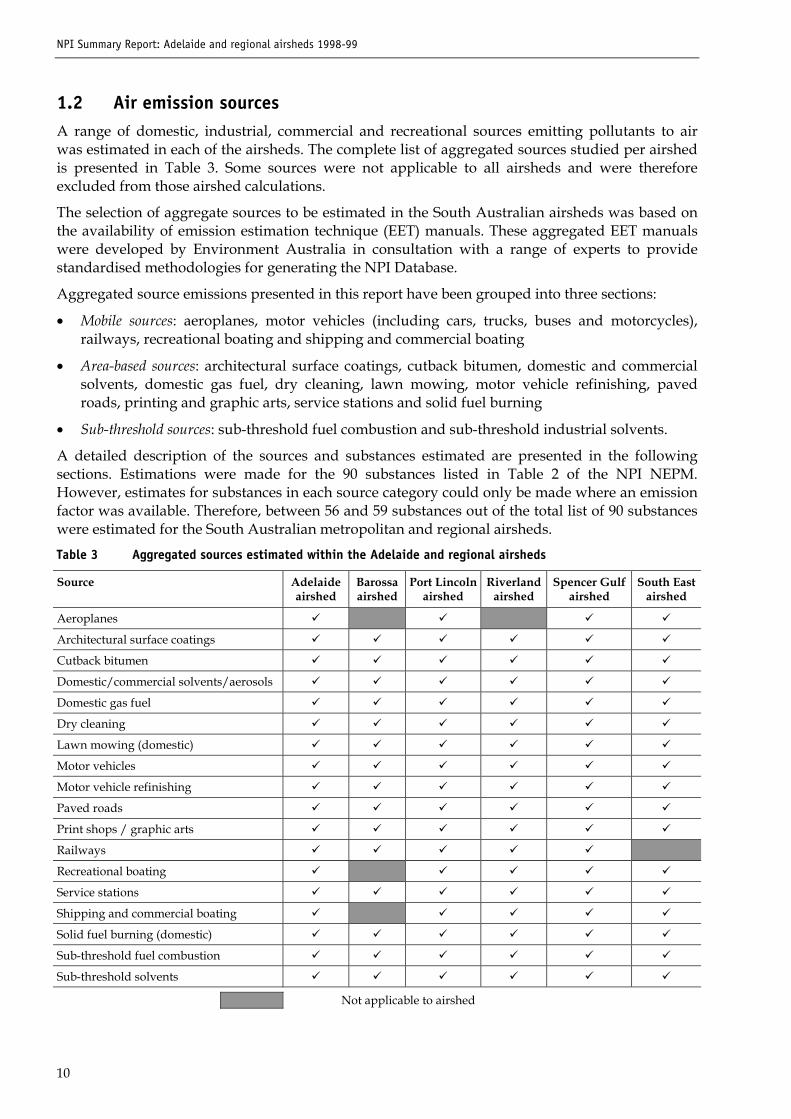
NPI Summary Report: Adelaide and regional airsheds 1998-99
10
1.2 Air emission sourcesA range of domestic, industrial, commercial and recreational sources emitting pollutants to airwas estimated in each of the airsheds. The complete list of aggregated sources studied per airshedis presented in Table 3. Some sources were not applicable to all airsheds and were thereforeexcluded from those airshed calculations.
The selection of aggregate sources to be estimated in the South Australian airsheds was based onthe availability of emission estimation technique (EET) manuals. These aggregated EET manualswere developed by Environment Australia in consultation with a range of experts to providestandardised methodologies for generating the NPI Database.
Aggregated source emissions presented in this report have been grouped into three sections:
� Mobile sources: aeroplanes, motor vehicles (including cars, trucks, buses and motorcycles),railways, recreational boating and shipping and commercial boating
� Area-based sources: architectural surface coatings, cutback bitumen, domestic and commercialsolvents, domestic gas fuel, dry cleaning, lawn mowing, motor vehicle refinishing, pavedroads, printing and graphic arts, service stations and solid fuel burning
� Sub-threshold sources: sub-threshold fuel combustion and sub-threshold industrial solvents.
A detailed description of the sources and substances estimated are presented in the followingsections. Estimations were made for the 90 substances listed in Table 2 of the NPI NEPM.However, estimates for substances in each source category could only be made where an emissionfactor was available. Therefore, between 56 and 59 substances out of the total list of 90 substanceswere estimated for the South Australian metropolitan and regional airsheds.
Table 3 Aggregated sources estimated within the Adelaide and regional airsheds
Source Adelaideairshed
Barossaairshed
Port Lincolnairshed
Riverlandairshed
Spencer Gulfairshed
South Eastairshed
Aeroplanes � � � �
Architectural surface coatings � � � � � �
Cutback bitumen � � � � � �
Domestic/commercial solvents/aerosols � � � � � �
Domestic gas fuel � � � � � �
Dry cleaning � � � � � �
Lawn mowing (domestic) � � � � � �
Motor vehicles � � � � � �
Motor vehicle refinishing � � � � � �
Paved roads � � � � � �
Print shops / graphic arts � � � � � �
Railways � � � � �
Recreational boating � � � � �
Service stations � � � � � �
Shipping and commercial boating � � � � �
Solid fuel burning (domestic) � � � � � �
Sub-threshold fuel combustion � � � � � �
Sub-threshold solvents � � � � � �
Not applicable to airshed
NPI Summary Report: Adelaide and regional airsheds 1998-99
11
1.3 Domestic surveyHousehold information relating to a range of activities was collected using a domestic survey.These activities included information on the use of solid fuel combustion heaters, lawn mowingpractices and recreational boating activities.
The survey was distributed during 1999 to high school students in the Adelaide and regional areasof the State. Students were asked to take the questionnaires home and complete them with theassistance of a parent or guardian. An incentive was offered to the school with the highest numberof returned survey forms, although some schools still chose not to participate.
The total responses to the survey from 1632 households comprised 1387 returned survey formsfrom the Adelaide metropolitan area, and only 211 forms returned from regional areas; 38 formscould not be included because they had invalid postcodes.
A large proportion of the regional responses came from the Port Lincoln area (48%); otherresponses ranged randomly from the upper Spencer Gulf to the Riverland areas. No responseswere provided by schools within the South East area. All survey responses, both regional andmetropolitan, were used to estimate domestic activity within the regional airsheds. Onlymetropolitan responses were used to estimate domestic activity estimates in the Adelaide airshed.
NPI Summary Report: Adelaide and regional airsheds 1998-99
12
Section 2: Mobile sources
2.1 AeroplanesEmissions from aircraft operating within each of the airsheds result from the various modes ofenging operation between ground level and 1000 metres above ground level, including approach,landing, taxiing, idling, take-off and climb-out. Evaporative emissions from aircraft were notincluded in these estimations since no emission factors for this process were available. Groundand maintenance operations at each airport were not included as these emissions are consideredpoint sources to be included in industry estimates provided by the airport operators as describedin the Airports Industry Handbook5.
The emission estimates included in this report were calculated according to the NPI EmissionEstimation Technique Manual for Aggregated Emissions from Aircraft6. The best practice technique wasapplied to all airports using detailed information provided by airport operators as to the numberof aircraft operating, modes of operation per aircraft type, use of auxiliary power units and timespent in each operating mode.
2.1.1 Adelaide airshed�aeroplane emissionsAeroplane emissions within the Adelaide airshed include aircraft activity at three airports,Adelaide, Parafield and Edinburgh, as shown in Figure 8. Adelaide is the airshed�s maincommuter airport, with domestic and international flights. Parafield is a busy light-aircraftaerodrome, with major activities including general aviation training. Activity data for Adelaideand Parafield airports was provided by Adelaide Airport Limited, which engaged the consultantAirport Technical Services to compile the activity information. Aircraft activity information wasprovided for the 1998�99 financial year in the form of reports and geographic information systems(GIS) data for flight arrivals and departures by aircraft type and flight track. This information wasderived from local information as well as information collected by Air Services Australia for theEnvironment Branch Noise and Flight Path Systems 1998�99 quarterly reports.
Edinburgh airport is a military facility, which operates within a military airspace performingroutine training flights. The airport generally operates three types of aircraft�PC3 Orion, PC9 andFA-18�and two types of helicopters, Black Hawk and Iroquois, used by the Air Force and Navyfor training and transits.
General helicopter activities within the Adelaide airshed mainly include the search-and-rescueand media aircraft. These aircraft commonly operate at heights below 1000 metres and thereforewithin the area of interest.
The calculated emissions from all commercial and general aviation aircraft operating within theairspace of the Adelaide airshed were attributed to the grid squares that best represented annualflight patterns. Each flight route was estimated separately for different aircraft types in thecategories: jet, turbo prop, piston and general aviation. These aircraft types have different climbrates for take-off, climb-out and approach. Flight paths were also found to vary depending on theaircraft type. The time and subsequent distance travelled in reaching heights of 200 metres and1000 metres, the heights for take-off and climb-out respectively, by each aircraft type werecalculated based on the climb rates provided by Airport Technical Services. Accordingly for eachmode of operation, aircraft type and reported annual flight paths, the length of the flight pathcorresponding to a particular mode of operation was calculated for each grid square within theairshed. Emissions were then calculated by multiplying the total emissions for each mode ofoperation by the portion of the total length corresponding to that mode�s flight path in each grid.Emissions from aircraft taxiing and idling were assigned to the grids corresponding to the
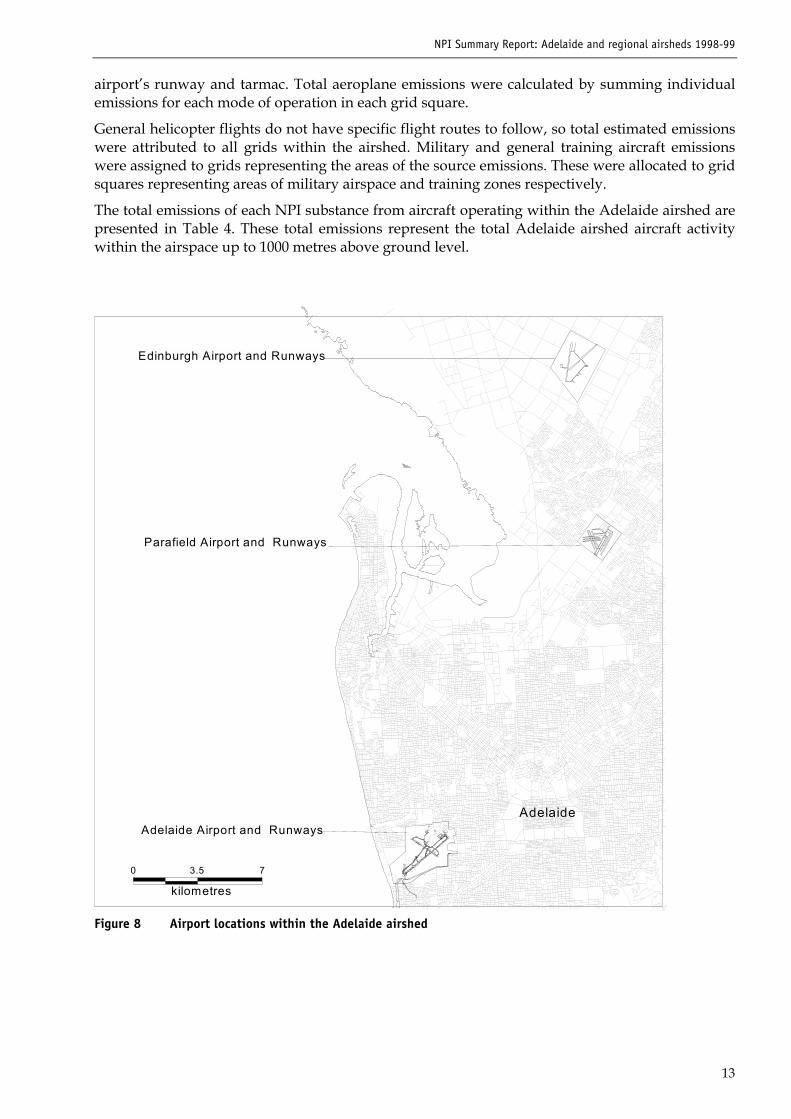
NPI Summary Report: Adelaide and regional airsheds 1998-99
13
airport�s runway and tarmac. Total aeroplane emissions were calculated by summing individualemissions for each mode of operation in each grid square.
General helicopter flights do not have specific flight routes to follow, so total estimated emissionswere attributed to all grids within the airshed. Military and general training aircraft emissionswere assigned to grids representing the areas of the source emissions. These were allocated to gridsquares representing areas of military airspace and training zones respectively.
The total emissions of each NPI substance from aircraft operating within the Adelaide airshed arepresented in Table 4. These total emissions represent the total Adelaide airshed aircraft activitywithin the airspace up to 1000 metres above ground level.
0
kilometres
3.5 7
Adelaide Airport and Runways
Edinburgh Airport and Runways
Parafield Airport and Runways
AdelaideAdelaideAdelaideAdelaideAdelaideAdelaideAdelaideAdelaideAdelaide
Figure 8 Airport locations within the Adelaide airshed
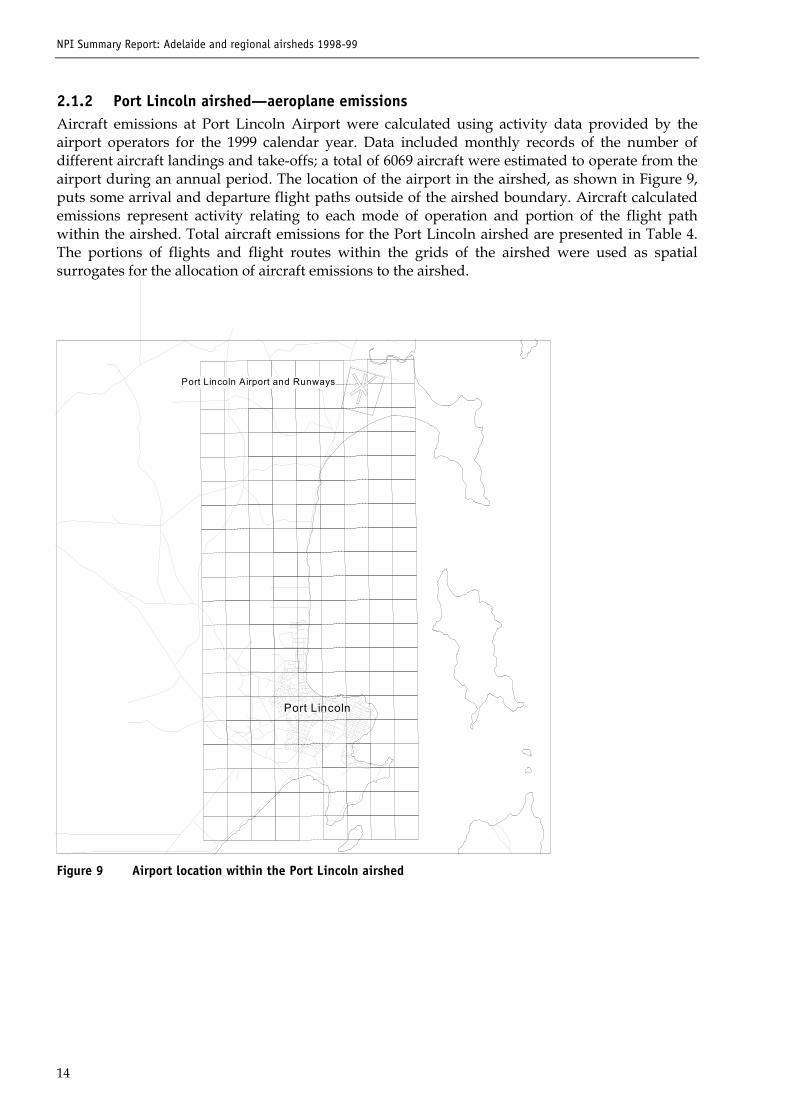
NPI Summary Report: Adelaide and regional airsheds 1998-99
14
2.1.2 Port Lincoln airshed�aeroplane emissionsAircraft emissions at Port Lincoln Airport were calculated using activity data provided by theairport operators for the 1999 calendar year. Data included monthly records of the number ofdifferent aircraft landings and take-offs; a total of 6069 aircraft were estimated to operate from theairport during an annual period. The location of the airport in the airshed, as shown in Figure 9,puts some arrival and departure flight paths outside of the airshed boundary. Aircraft calculatedemissions represent activity relating to each mode of operation and portion of the flight pathwithin the airshed. Total aircraft emissions for the Port Lincoln airshed are presented in Table 4.The portions of flights and flight routes within the grids of the airshed were used as spatialsurrogates for the allocation of aircraft emissions to the airshed.
Port Lincoln Airport and Runways
Port LincolnPort LincolnPort LincolnPort LincolnPort LincolnPort LincolnPort LincolnPort LincolnPort Lincoln
Figure 9 Airport location within the Port Lincoln airshed
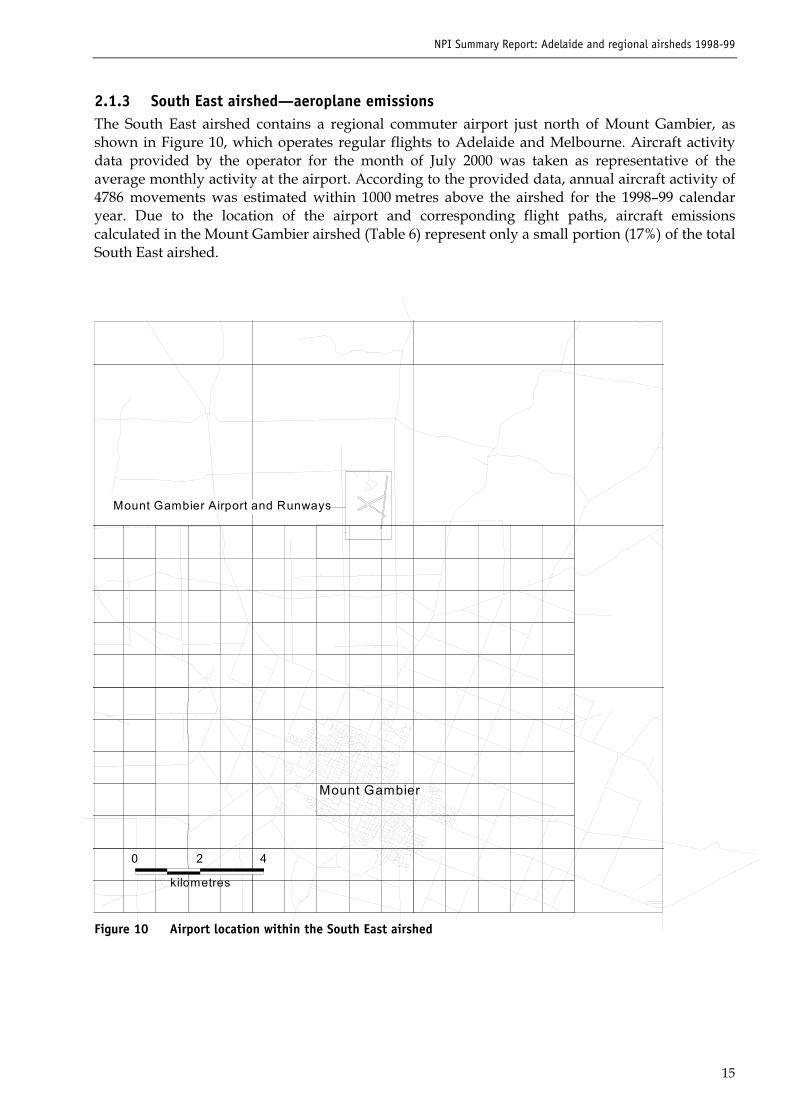
NPI Summary Report: Adelaide and regional airsheds 1998-99
15
2.1.3 South East airshed�aeroplane emissionsThe South East airshed contains a regional commuter airport just north of Mount Gambier, asshown in Figure 10, which operates regular flights to Adelaide and Melbourne. Aircraft activitydata provided by the operator for the month of July 2000 was taken as representative of theaverage monthly activity at the airport. According to the provided data, annual aircraft activity of4786 movements was estimated within 1000 metres above the airshed for the 1998�99 calendaryear. Due to the location of the airport and corresponding flight paths, aircraft emissionscalculated in the Mount Gambier airshed (Table 6) represent only a small portion (17%) of the totalSouth East airshed.
000000000 222222222
kilometreskilometreskilometreskilometreskilometreskilometreskilometreskilometreskilometres
Mount Gambier Airport and Runways
444444444
Mount GambierMount GambierMount GambierMount GambierMount GambierMount GambierMount GambierMount GambierMount Gambier
Figure 10 Airport location within the South East airshed
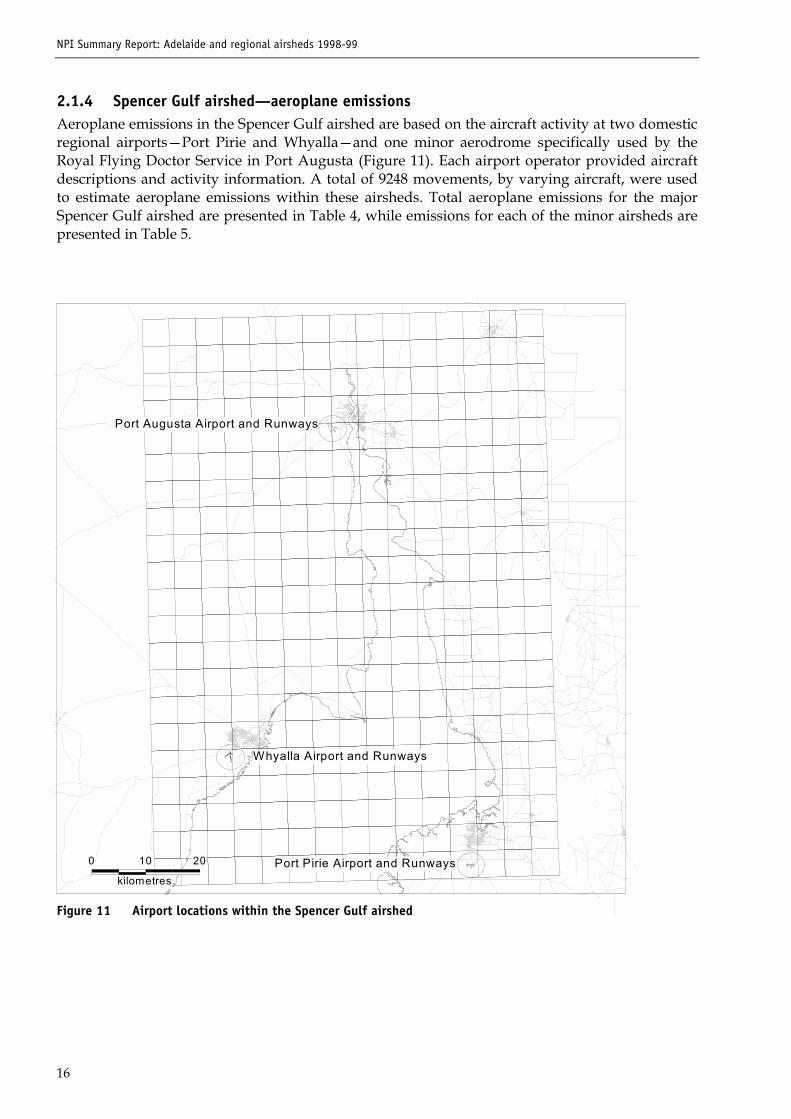
NPI Summary Report: Adelaide and regional airsheds 1998-99
16
2.1.4 Spencer Gulf airshed�aeroplane emissionsAeroplane emissions in the Spencer Gulf airshed are based on the aircraft activity at two domesticregional airports�Port Pirie and Whyalla�and one minor aerodrome specifically used by theRoyal Flying Doctor Service in Port Augusta (Figure 11). Each airport operator provided aircraftdescriptions and activity information. A total of 9248 movements, by varying aircraft, were usedto estimate aeroplane emissions within these airsheds. Total aeroplane emissions for the majorSpencer Gulf airshed are presented in Table 4, while emissions for each of the minor airsheds arepresented in Table 5.
0
kilometres
10 20
Port Augusta Airport and Runways
Port Pirie Airport and Runways
Whyalla Airport and Runways
Figure 11 Airport locations within the Spencer Gulf airshed
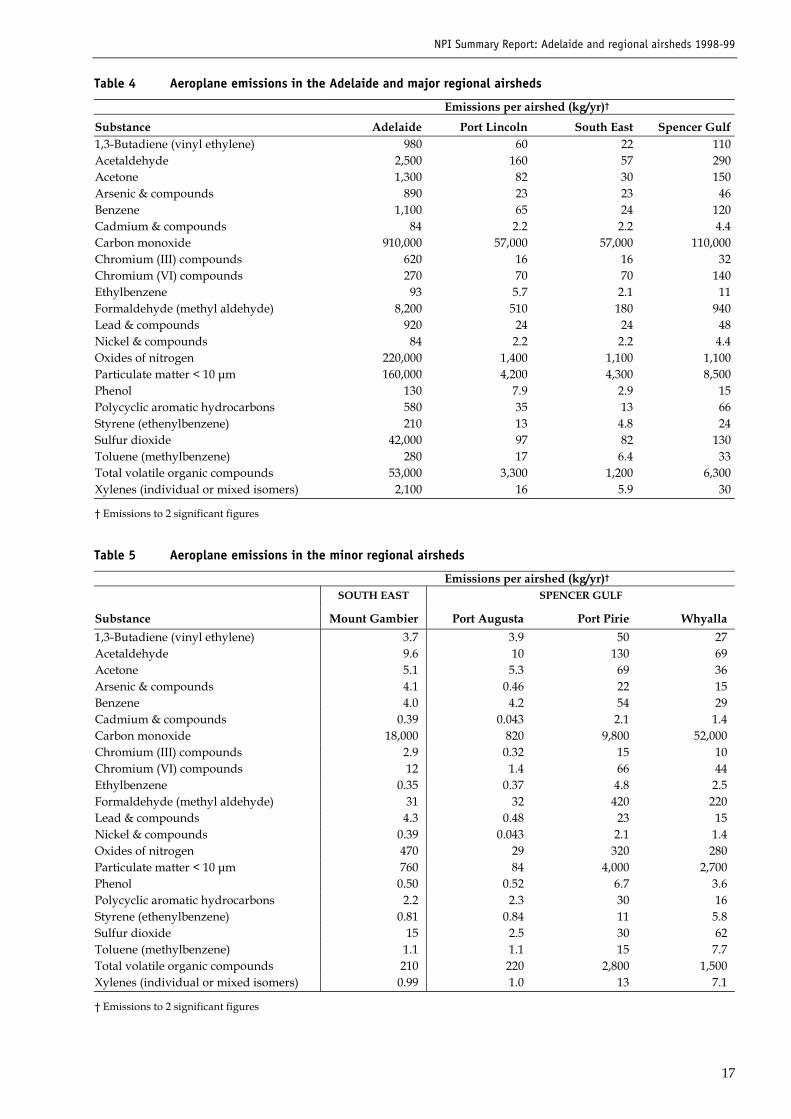
NPI Summary Report: Adelaide and regional airsheds 1998-99
17
Table 4 Aeroplane emissions in the Adelaide and major regional airsheds
Emissions per airshed (kg/yr)�
Substance Adelaide Port Lincoln South East Spencer Gulf1,3-Butadiene (vinyl ethylene) 980 60 22 110Acetaldehyde 2,500 160 57 290Acetone 1,300 82 30 150Arsenic & compounds 890 23 23 46Benzene 1,100 65 24 120Cadmium & compounds 84 2.2 2.2 4.4Carbon monoxide 910,000 57,000 57,000 110,000Chromium (III) compounds 620 16 16 32Chromium (VI) compounds 270 70 70 140Ethylbenzene 93 5.7 2.1 11Formaldehyde (methyl aldehyde) 8,200 510 180 940Lead & compounds 920 24 24 48Nickel & compounds 84 2.2 2.2 4.4Oxides of nitrogen 220,000 1,400 1,100 1,100Particulate matter < 10 µm 160,000 4,200 4,300 8,500Phenol 130 7.9 2.9 15Polycyclic aromatic hydrocarbons 580 35 13 66Styrene (ethenylbenzene) 210 13 4.8 24Sulfur dioxide 42,000 97 82 130Toluene (methylbenzene) 280 17 6.4 33Total volatile organic compounds 53,000 3,300 1,200 6,300Xylenes (individual or mixed isomers) 2,100 16 5.9 30
� Emissions to 2 significant figures
Table 5 Aeroplane emissions in the minor regional airsheds
Emissions per airshed (kg/yr)�
SOUTH EAST SPENCER GULF
Substance Mount Gambier Port Augusta Port Pirie Whyalla1,3-Butadiene (vinyl ethylene) 3.7 3.9 50 27Acetaldehyde 9.6 10 130 69Acetone 5.1 5.3 69 36Arsenic & compounds 4.1 0.46 22 15Benzene 4.0 4.2 54 29Cadmium & compounds 0.39 0.043 2.1 1.4Carbon monoxide 18,000 820 9,800 52,000Chromium (III) compounds 2.9 0.32 15 10Chromium (VI) compounds 12 1.4 66 44Ethylbenzene 0.35 0.37 4.8 2.5Formaldehyde (methyl aldehyde) 31 32 420 220Lead & compounds 4.3 0.48 23 15Nickel & compounds 0.39 0.043 2.1 1.4Oxides of nitrogen 470 29 320 280Particulate matter < 10 µm 760 84 4,000 2,700Phenol 0.50 0.52 6.7 3.6Polycyclic aromatic hydrocarbons 2.2 2.3 30 16Styrene (ethenylbenzene) 0.81 0.84 11 5.8Sulfur dioxide 15 2.5 30 62Toluene (methylbenzene) 1.1 1.1 15 7.7Total volatile organic compounds 210 220 2,800 1,500Xylenes (individual or mixed isomers) 0.99 1.0 13 7.1
� Emissions to 2 significant figures
NPI Summary Report: Adelaide and regional airsheds 1998-99
18
2.2 Motor vehiclesAggregate emissions from motor vehicle use were estimated for all on-road vehicles. This categoryincludes three age categories of passenger vehicles, four-wheel drives, light vehicles, rigid trucks,articulated trucks, buses, motor cycles and other vehicles.
Emissions from motor vehicles arise from two sources�the combustion products from the engineand the evaporation of fuel from tank and fuel lines. Emissions can vary depending on the fuelused, fuel delivery equipment, engine configuration, vehicle age, maintenance regime, engine size,engine load, emission control technology, driver behaviour, speed of acceleration and road grade.Many of these factors are difficult to quantify and correlate with emission factors. Therefore,vehicle emission rates are generally determined over a standardised drive cycle that attempts torepresent typical driving conditions7. The emissions calculated in this study were based on localactivity data and vehicle kilometres travelled (VKT), together with a range of correspondingemission factors. Emission factors represent the quantity of pollutant being released into the airper kilometre travelled. These factors have been derived from local and overseas engine testingfacilities for each vehicle category.
2.2.1 Adelaide airshed�motor vehicle emissionsTotal Adelaide airshed emissions (Table 6) were calculated using emission factors, vehicle fleetmix and speed correction data provided by McLennan Magasanik Associates consultants7,together with local activity data according to the methodology outlined in the NPI EmissionEstimation Technique Manual for Aggregated Emissions from Motor Vehicles8 (Motor vehicles EETmanual).
Activity data
Traffic count data, spatially distributed as VKT, was obtained from South Australia�s roadtransport authority, Transport SA. Relative VKT by vehicle type, vehicle numbers and fuelconsumption for vehicle�fuel type combinations were obtained from the consultant�s report7.
Road types
Road types were derived from the South Australian road network �StreetWorks� provided byERSIS Australia. A total of eight road types in this database were either ignored (e.g. pathways,lanes, malls and unsealed roads) or aggregated to approximate the three road types in eachregional airshed.
The three road types considered in the estimation were:
� freeways (made up of only �freeways�): major roads with average high speeds and lowcongestion
� arterial (made up of �highways� and �main roads�): major roads with moderate congestion
� residential (made up of �sealed roads�): secondary roads with moderate average speeds.
NPI Summary Report: Adelaide and regional airsheds 1998-99
19
Vehicle and fuel types
The vehicle and fuel types considered in the estimations were:
� passenger vehicles (pre-1976, 1976-1985, post 1985)�unleaded, leaded
� four-wheel drives�diesel, unleaded, leaded
� light commercial vehicles�unleaded, leaded
� rigid trucks�diesel
� articulated trucks�diesel
� buses�diesel
� motorcycles
� other trucks�diesel.
Derivation of gridded VKT data
VKT data for different road types (freeway, arterial and residential roads) was provided in a GISformat and was derived from traffic count data. Traffic counts did not cover every part of the roadnetwork. Estimates of traffic numbers were made in those parts of the network where data wasnot available by the following methods:
� Gridded VKT data for residential roads was derived using population data. In those cellswhere residential roads existed, the population of that cell was multiplied by the average dailyVKT per capita (km/day), method based on EPAV 1996 and NPI aggregated emissions fromMotor Vehicles, August 20008.
� For other road types, the grids of each airshed were overlaid by the road network and thelength of road segment for each road type calculated. For roads with traffic count data, theVKTs were summed to give the known total VKT for each road type in each cell. A VKT forremaining roads without traffic count data was derived by multiplying their total length (km)by the average known VKT/km for each cell.
Emission factors
Emission factors for each substance from each vehicle and fuel type were derived from locallyconducted vehicle testing data in the first instance, although this data was mostly available forpassenger vehicles only. It was necessary in the absence of locally available emission testing datato consult other sources such as the United States Environment Protection Agency�s mobile sourceemission model, Mobile 5A. These emission factors have been previously incorporated in otherNPI trials conducted within Australia9.
2.2.2 Regional airshed�motor vehicle emissionsMotor vehicle emissions within each of the regional airsheds (Table 6 and Table 7) were calculatedaccording to the methodology presented in the motor vehicles EET manual8. Emission factors,vehicle fleet mix and speed correction data provided by the consultant7 for the Adelaide airshedwere applied to all regional airsheds. VKT data for the regional airsheds consisted of actual trafficcount data where possible; however, an average was used for roads with no available data.
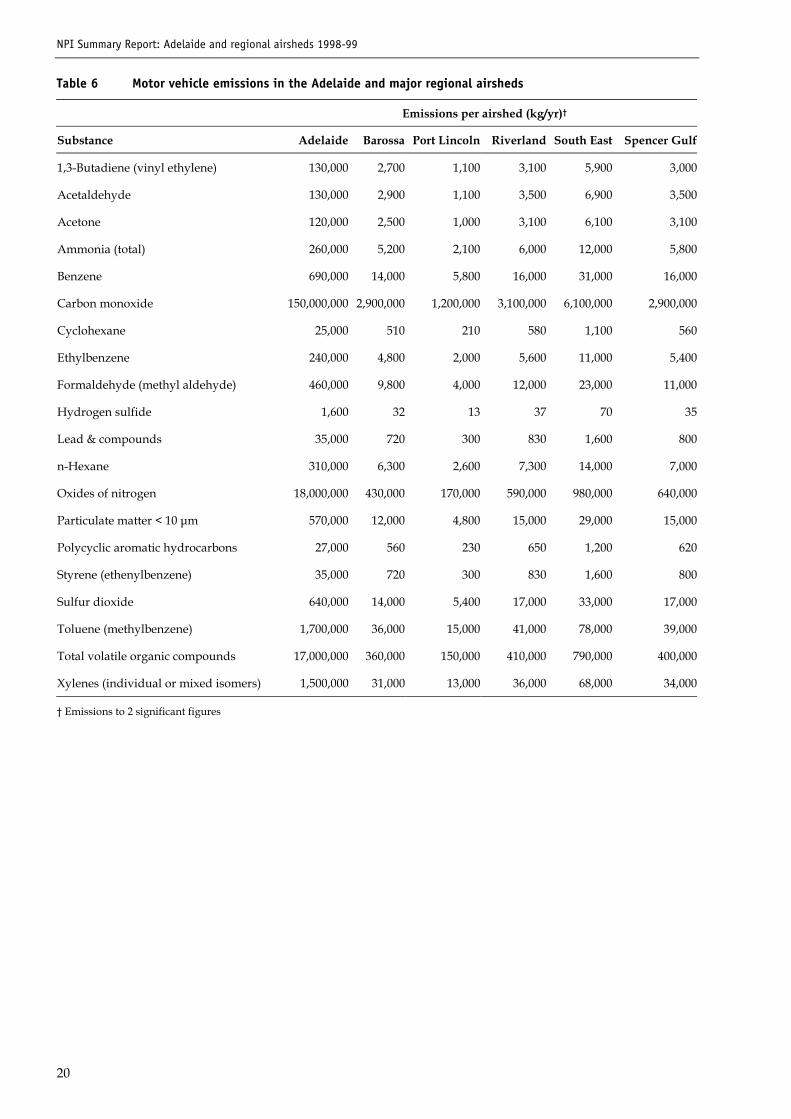
NPI Summary Report: Adelaide and regional airsheds 1998-99
20
Table 6 Motor vehicle emissions in the Adelaide and major regional airsheds
Emissions per airshed (kg/yr)�
Substance Adelaide Barossa Port Lincoln Riverland South East Spencer Gulf
1,3-Butadiene (vinyl ethylene) 130,000 2,700 1,100 3,100 5,900 3,000
Acetaldehyde 130,000 2,900 1,100 3,500 6,900 3,500
Acetone 120,000 2,500 1,000 3,100 6,100 3,100
Ammonia (total) 260,000 5,200 2,100 6,000 12,000 5,800
Benzene 690,000 14,000 5,800 16,000 31,000 16,000
Carbon monoxide 150,000,000 2,900,000 1,200,000 3,100,000 6,100,000 2,900,000
Cyclohexane 25,000 510 210 580 1,100 560
Ethylbenzene 240,000 4,800 2,000 5,600 11,000 5,400
Formaldehyde (methyl aldehyde) 460,000 9,800 4,000 12,000 23,000 11,000
Hydrogen sulfide 1,600 32 13 37 70 35
Lead & compounds 35,000 720 300 830 1,600 800
n-Hexane 310,000 6,300 2,600 7,300 14,000 7,000
Oxides of nitrogen 18,000,000 430,000 170,000 590,000 980,000 640,000
Particulate matter < 10 µm 570,000 12,000 4,800 15,000 29,000 15,000
Polycyclic aromatic hydrocarbons 27,000 560 230 650 1,200 620
Styrene (ethenylbenzene) 35,000 720 300 830 1,600 800
Sulfur dioxide 640,000 14,000 5,400 17,000 33,000 17,000
Toluene (methylbenzene) 1,700,000 36,000 15,000 41,000 78,000 39,000
Total volatile organic compounds 17,000,000 360,000 150,000 410,000 790,000 400,000
Xylenes (individual or mixed isomers) 1,500,000 31,000 13,000 36,000 68,000 34,000
� Emissions to 2 significant figures
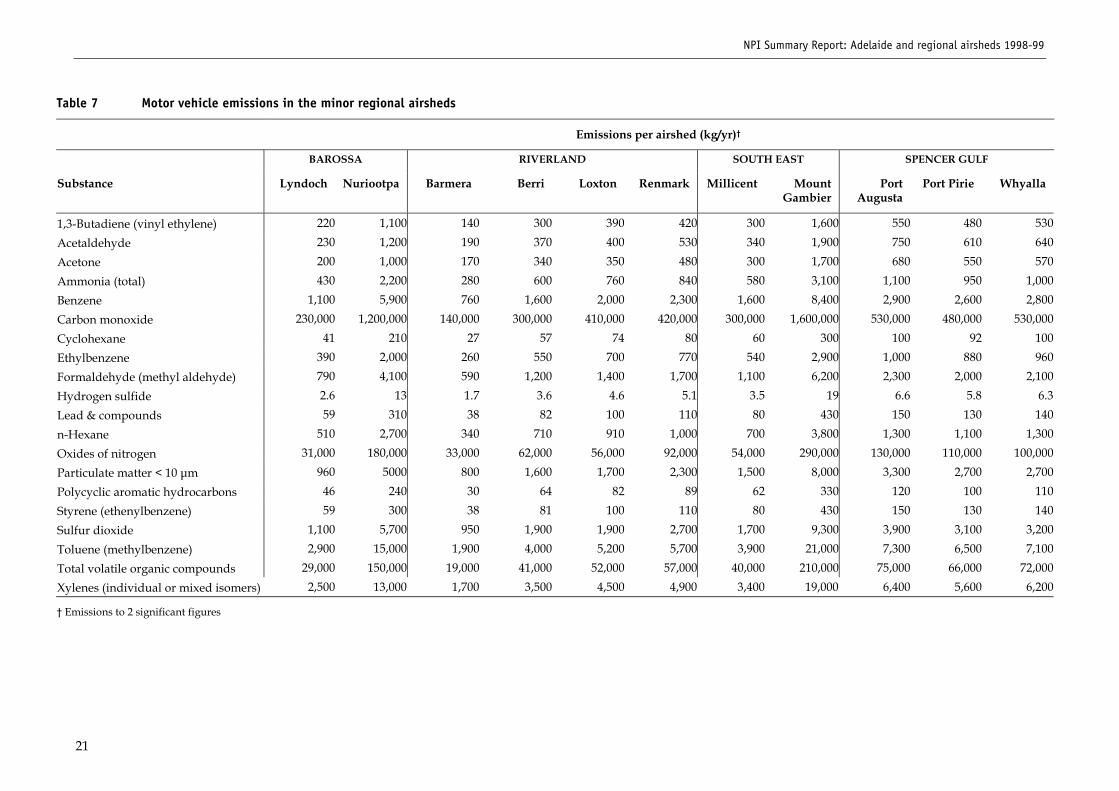
NPI Summary Report: Adelaide and regional airsheds 1998-99
21
Table 7 Motor vehicle emissions in the minor regional airsheds
Emissions per airshed (kg/yr)�
BAROSSA RIVERLAND SOUTH EAST SPENCER GULF
Substance Lyndoch Nuriootpa Barmera Berri Loxton Renmark Millicent MountGambier
PortAugusta
Port Pirie Whyalla
1,3-Butadiene (vinyl ethylene) 220 1,100 140 300 390 420 300 1,600 550 480 530Acetaldehyde 230 1,200 190 370 400 530 340 1,900 750 610 640Acetone 200 1,000 170 340 350 480 300 1,700 680 550 570Ammonia (total) 430 2,200 280 600 760 840 580 3,100 1,100 950 1,000Benzene 1,100 5,900 760 1,600 2,000 2,300 1,600 8,400 2,900 2,600 2,800Carbon monoxide 230,000 1,200,000 140,000 300,000 410,000 420,000 300,000 1,600,000 530,000 480,000 530,000Cyclohexane 41 210 27 57 74 80 60 300 100 92 100Ethylbenzene 390 2,000 260 550 700 770 540 2,900 1,000 880 960Formaldehyde (methyl aldehyde) 790 4,100 590 1,200 1,400 1,700 1,100 6,200 2,300 2,000 2,100Hydrogen sulfide 2.6 13 1.7 3.6 4.6 5.1 3.5 19 6.6 5.8 6.3Lead & compounds 59 310 38 82 100 110 80 430 150 130 140n-Hexane 510 2,700 340 710 910 1,000 700 3,800 1,300 1,100 1,300Oxides of nitrogen 31,000 180,000 33,000 62,000 56,000 92,000 54,000 290,000 130,000 110,000 100,000Particulate matter < 10 µm 960 5000 800 1,600 1,700 2,300 1,500 8,000 3,300 2,700 2,700Polycyclic aromatic hydrocarbons 46 240 30 64 82 89 62 330 120 100 110Styrene (ethenylbenzene) 59 300 38 81 100 110 80 430 150 130 140Sulfur dioxide 1,100 5,700 950 1,900 1,900 2,700 1,700 9,300 3,900 3,100 3,200Toluene (methylbenzene) 2,900 15,000 1,900 4,000 5,200 5,700 3,900 21,000 7,300 6,500 7,100Total volatile organic compounds 29,000 150,000 19,000 41,000 52,000 57,000 40,000 210,000 75,000 66,000 72,000Xylenes (individual or mixed isomers) 2,500 13,000 1,700 3,500 4,500 4,900 3,400 19,000 6,400 5,600 6,200
� Emissions to 2 significant figures
NPI Summary Report: Adelaide and regional airsheds 1998-99
22
2.3 RailwaysEmissions from railways depend on the types of operations performed by locomotives in the areaof interest. Typically the two different types of operations are line haul and yard haul. Line haullocomotives operate generally by travelling between distant locations, such as from one city ortown to another. Yard haul locomotives perform yard operations, moving railcars within aparticular railway yard. Throughout South Australia10, line haul locomotives were reported toperform most of line and yard shunt duties. Diesel�electric engines power these locomotives andthe emissions arise as a result of the generation of electricity to power the traction motors, thus theterm diesel�electric. Steam locomotives are seldom used and none were located within theairsheds studied, so steam locomotives were excluded from these emission estimates.
Railway information, such as locomotive types, total diesel consumption and rail track locations,was obtained from local and national operators. Rail track lengths per grid were determined byoverlaying GIS airshed grid data with track length data for each airshed. Emissions from theoperation of railways within each airshed were apportioned to gridded track data. The South Eastairshed does not have regular passenger or freight services and therefore was not included in thissection of the report. Railway activity within the Riverland airshed is limited to within the Loxtonairshed only, mainly as a regional freight service. The methodology for calculating andapportioning emissions was calculated according to the NPI Emissions Estimation Technique Manualfor Aggregated Emissions from Railways11 (Railways EET manual).
Railway emissions were calculated based on the volume of diesel fuel used during the 1998�99year within the two main services, Adelaide metropolitan transport service and the National Railservice. The total volume of diesel used by the metropolitan transport service was used tocalculate total emissions within the Adelaide airshed. However, diesel fuel reported for thenational service was provided as a national figure only. This diesel fuel quantity required furtherapportioning according to the length of railway tracks to determine diesel consumption perairshed.
2.3.1 Adelaide airshed�railway emissionsAdelaide airshed railway activity consists of two railway systems: the metro passenger service anda national passenger and freight service (Figure 2). The metro service operates entirely within theAdelaide airshed, so all emissions were allocated to grid squares relating to the location of railtracks within the airshed. The national train service, however, operates a only small fraction of theentire service within the Adelaide airshed., so emissions calculated for the national train servicewere apportioned according to the length of the national track within the Adelaide airshed.
The only types of locomotives used within the metro and national services are diesel�electric, soemissions were calculated from the portion of diesel fuel used within the airshed during the studyperiod. The volume of diesel fuel used during 1998�99 was multiplied by the correspondingemission factor for diesel line haul locomotives in the EET manual11 to calculate total emissions ofindividual NPI substances. These emission factors represent the mass of substance emitted perlitre of fuel used. Total emissions from railways within the Adelaide airshed are listed in Table 8.
NPI Summary Report: Adelaide and regional airsheds 1998-99
23
2.3.2 Regional airshed�railway emissions
Barossa airshed
The Barossa airshed has a regular passenger service operating three times a week betweenAdelaide and the towns of Tanunda and Angaston. Additionally, there is freight activity betweenthe Barossa airshed and the Adelaide metropolitan area. The map of the Barossa airshed (Figure 3)indicates the location of the rail network within this airshed. Total railway emissions werecalculated by multiplying the volume of diesel fuel consumed within the airshed by the emissionfactors presented in the Railways EET manual11. The volume of diesel fuel consumed wascalculated by apportioning the national diesel fuel consumption figure according to the length ofrail tracks within the airshed.
Total emissions from railways within this airshed are presented in two tables: total emissionscalculated for the major Barossa airshed in Table 8 and emissions calculated for the minor Barossaairsheds of Lyndoch and Nuriootpa in Table 9.
Port Lincoln airshed
An independent rail service within the Port Lincoln airshed provides mainly freight facilitiesbetween various towns on the Eyre Peninsula and the sea port of Port Lincoln (Figure 4).However, only a small portion of the entire rail length is represented within this airshed.Consumption of diesel fuel for this service was estimated by apportioning the national fuelconsumption figure according to the length of rail tracks within the airshed. The volume of dieselconsumed by this service was multiplied by the diesel line haul locomotive emission factors tocalculate total railway emissions in this airshed. The resultant railway emissions in the PortLincoln airshed are presented in Table 8.
Riverland airshed
The rail network within the Riverland airshed is contained entirely within the minor Loxtonairshed. This section of the rail network, shown in Figure 5, is a small branch of the majorAdelaide�Melbourne track providing mainly freight services to the area. Total railway emissionswithin these airsheds are presented in Table 8 and Table 9, for the Riverland and Loxton airshedsrespectively.
Spencer Gulf airshed
Railway activity within the Spencer Gulf airsheds (Figure 7) consists of interstate freight andpassenger services, which transect each of the towns Port Pirie, Port Augusta and Whyalla.Additionally, Port Augusta and Whyalla are termination points for industry freight services ofFlinders Power and BHP respectively. Total railway emissions for the Spencer Gulf airshed arepresented in Table 8, and Table 9 presents emissions calculated for the minor airsheds of PortAugusta, Port Pirie and Whyalla.
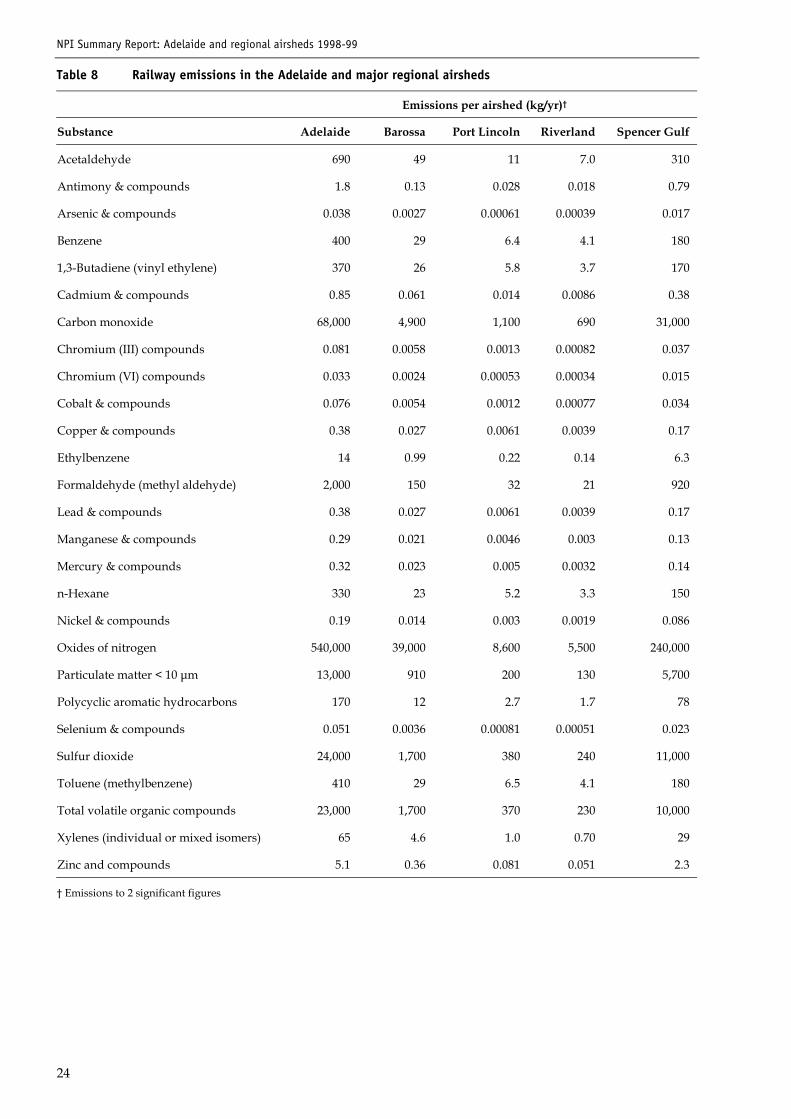
NPI Summary Report: Adelaide and regional airsheds 1998-99
24
Table 8 Railway emissions in the Adelaide and major regional airsheds
Emissions per airshed (kg/yr)�
Substance Adelaide Barossa Port Lincoln Riverland Spencer Gulf
Acetaldehyde 690 49 11 7.0 310
Antimony & compounds 1.8 0.13 0.028 0.018 0.79
Arsenic & compounds 0.038 0.0027 0.00061 0.00039 0.017
Benzene 400 29 6.4 4.1 180
1,3-Butadiene (vinyl ethylene) 370 26 5.8 3.7 170
Cadmium & compounds 0.85 0.061 0.014 0.0086 0.38
Carbon monoxide 68,000 4,900 1,100 690 31,000
Chromium (III) compounds 0.081 0.0058 0.0013 0.00082 0.037
Chromium (VI) compounds 0.033 0.0024 0.00053 0.00034 0.015
Cobalt & compounds 0.076 0.0054 0.0012 0.00077 0.034
Copper & compounds 0.38 0.027 0.0061 0.0039 0.17
Ethylbenzene 14 0.99 0.22 0.14 6.3
Formaldehyde (methyl aldehyde) 2,000 150 32 21 920
Lead & compounds 0.38 0.027 0.0061 0.0039 0.17
Manganese & compounds 0.29 0.021 0.0046 0.003 0.13
Mercury & compounds 0.32 0.023 0.005 0.0032 0.14
n-Hexane 330 23 5.2 3.3 150
Nickel & compounds 0.19 0.014 0.003 0.0019 0.086
Oxides of nitrogen 540,000 39,000 8,600 5,500 240,000
Particulate matter < 10 µm 13,000 910 200 130 5,700
Polycyclic aromatic hydrocarbons 170 12 2.7 1.7 78
Selenium & compounds 0.051 0.0036 0.00081 0.00051 0.023
Sulfur dioxide 24,000 1,700 380 240 11,000
Toluene (methylbenzene) 410 29 6.5 4.1 180
Total volatile organic compounds 23,000 1,700 370 230 10,000
Xylenes (individual or mixed isomers) 65 4.6 1.0 0.70 29
Zinc and compounds 5.1 0.36 0.081 0.051 2.3
� Emissions to 2 significant figures
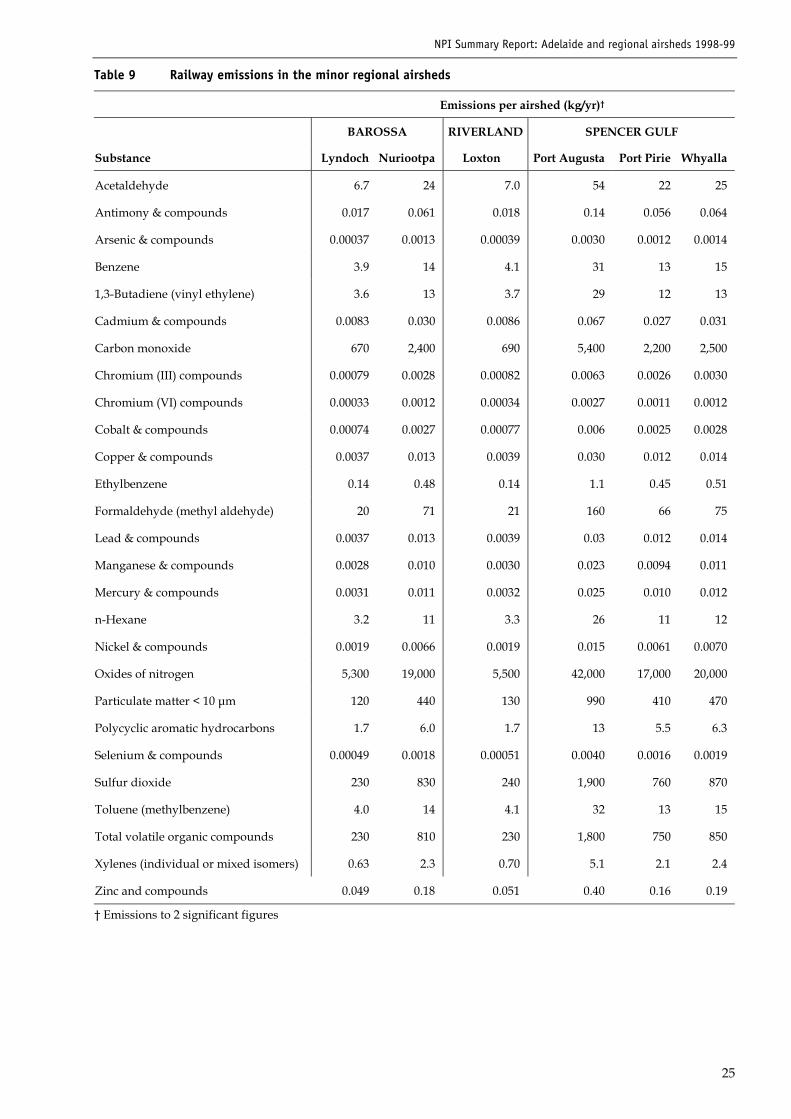
NPI Summary Report: Adelaide and regional airsheds 1998-99
25
Table 9 Railway emissions in the minor regional airsheds
Emissions per airshed (kg/yr)�
BAROSSA RIVERLAND SPENCER GULF
Substance Lyndoch Nuriootpa Loxton Port Augusta Port Pirie Whyalla
Acetaldehyde 6.7 24 7.0 54 22 25
Antimony & compounds 0.017 0.061 0.018 0.14 0.056 0.064
Arsenic & compounds 0.00037 0.0013 0.00039 0.0030 0.0012 0.0014
Benzene 3.9 14 4.1 31 13 15
1,3-Butadiene (vinyl ethylene) 3.6 13 3.7 29 12 13
Cadmium & compounds 0.0083 0.030 0.0086 0.067 0.027 0.031
Carbon monoxide 670 2,400 690 5,400 2,200 2,500
Chromium (III) compounds 0.00079 0.0028 0.00082 0.0063 0.0026 0.0030
Chromium (VI) compounds 0.00033 0.0012 0.00034 0.0027 0.0011 0.0012
Cobalt & compounds 0.00074 0.0027 0.00077 0.006 0.0025 0.0028
Copper & compounds 0.0037 0.013 0.0039 0.030 0.012 0.014
Ethylbenzene 0.14 0.48 0.14 1.1 0.45 0.51
Formaldehyde (methyl aldehyde) 20 71 21 160 66 75
Lead & compounds 0.0037 0.013 0.0039 0.03 0.012 0.014
Manganese & compounds 0.0028 0.010 0.0030 0.023 0.0094 0.011
Mercury & compounds 0.0031 0.011 0.0032 0.025 0.010 0.012
n-Hexane 3.2 11 3.3 26 11 12
Nickel & compounds 0.0019 0.0066 0.0019 0.015 0.0061 0.0070
Oxides of nitrogen 5,300 19,000 5,500 42,000 17,000 20,000
Particulate matter < 10 µm 120 440 130 990 410 470
Polycyclic aromatic hydrocarbons 1.7 6.0 1.7 13 5.5 6.3
Selenium & compounds 0.00049 0.0018 0.00051 0.0040 0.0016 0.0019
Sulfur dioxide 230 830 240 1,900 760 870
Toluene (methylbenzene) 4.0 14 4.1 32 13 15
Total volatile organic compounds 230 810 230 1,800 750 850
Xylenes (individual or mixed isomers) 0.63 2.3 0.70 5.1 2.1 2.4
Zinc and compounds 0.049 0.18 0.051 0.40 0.16 0.19
� Emissions to 2 significant figures
NPI Summary Report: Adelaide and regional airsheds 1998-99
26
2.4 Recreational boatingRecreational boating includes all powered vessels operating on coastal and river waters, includingthose used for cruising, water skiing, sport fishing and other recreational activities. Emissionsarise from the burning of fuel in inboard or outboard motors.
Emissions generated by recreational boats vary with a range of factors such as climate, type ofactivity (fishing or sporting), location and duration of activity. Boats registered at one locationmay not be used for several months or may be used several kilometres away. Each of these factorscan significantly alter the estimated emissions within a particular airshed. To minimise theseimpacts, information regarding activity patterns, volume and type of fuels used as well as enginedetails is required.
General boating information was determined from the responses to the domestic survey, whichprovided an annual indication of fuels used, preferred locations for use (sea, coast or river) andprevalence of boat engine types (inboard or outboard). The survey results, together with boatregistration data and coastline lengths, provided for the estimation of annual emissions withineach of the airsheds according to the methodology described in the NPI Emissions EstimationTechnique Manual for Aggregated Emissions from Commercial Ships/Boats and Recreational Boats4
(Boating EET manual). The section of coastline within each airshed compared to the State total(3700 km) was used to apportion boat numbers in the regional airsheds only. For the Adelaideairshed, the metropolitan survey percentage response indicating the preferred location of boatingactivity was used to apportion the use of boats to the coastal waters. The Barossa airshed with norecreational water activities was excluded from these emission estimates.
Some of the NPI substances listed in Table 10 and Table 11 indicate zero emission. These substanceemissions relate to the use of diesel fuel or fuel oil, which were considered not to be used inrecreational boats within the study airsheds. Recreational boating emissions reflect the use ofleaded and unleaded fuels only.
Recreational boating emissions calculated in each of the airsheds studied are considered of lowreliability. This is a consequence of the limited activity data particularly in determining accurateairshed boat numbers and fuel consumption statistics. It is therefore suggested that caution beused when interpreting these results.
2.4.1 Adelaide airshed�recreational boating emissionsThe Adelaide airshed contains recreational boating activities along 84 km of the coastline, 2.3% ofthe State�s coastline. The household survey identified prevalence of use according to the threecategories: at-sea, coast or river. At-sea activity refers to boating activities more than 5 km offshore, while boating activities within 5 km of the shoreline were considered as coastal. Since thesurvey estimate of boats per household overestimated the total number of boats registered withinthe State, a range of assumptions was applied in determining the number of boats operating ineach airshed.
Boats were assumed to operate in either freshwater or seawater based on a 30/70 split forpowered boats, 70/30 split for ski boats and jet skis. All houseboats were assumed to operate infresh water only. Boats assumed to operate in seawater include 80% of coastal boating and 20% at-sea. This apportioning provided a breakdown of boat numbers to the categories sea, coast andriver. Further apportioning to the Adelaide airshed was based on survey reported prevalence ofuse. Responses from the metropolitan area only indicated a prevalence of boat use of 14% and 53%at-sea and coast respectively. It was estimated that 11,600 powered vessels and 666 speedboats andjet skis operated annually within the airshed.
Powered vessels were separated into two engine types�inboard and outboard�and leaded orunleaded fuel, based on reported prevalence of boat and fuel type data. Jet skis and speedboats
NPI Summary Report: Adelaide and regional airsheds 1998-99
27
were assumed as outboard powered, using unleaded fuel only. Final boat numbers weremultiplied by the annual consumption of 362 L and 380 L per boat of leaded and unleaded fuelrespectively. However, the airshed contains only a portion of the coast and coastal waters. Todetermine the area of coastal activities within the airshed, a 5 km wide buffer was createdfollowing the shoreline. The area of the buffer within the grid squares of the Adelaide airshed wasused to apportion the total volume of fuel estimated per boat type. Approximately 20% of thecoast (as determined by the area of the buffer contained within the airshed�s grids) lies within theairshed. The airshed does not extend sufficiently out to sea (more than 5 km off shore); however,less than 5% of at-sea activity could account for boats transecting the coast.
Based on the above assumption of survey results and boat registration data it was estimated thatinboard powered boats used 48,400 L and 67,400 L annually of leaded and unleaded fuelrespectively. Boats powered by outboard motors used 19,200 L and 410,000 L annually of leadedand unleaded fuel respectively. These estimated fuel consumption figures were multiplied by therespective emission factor in the Boating EET manual to calculate emissions of each NPIsubstance. Total emissions from recreational boating activities within the Adelaide airshed (thesum of coastal and at-sea emissions) are presented in Table 10.
These estimates are based entirely on the assumptions that boats are used at one place only, that90% of registered boats are used somewhere within the State, and that domestic survey reporteddata is an accurate account of boating activity within the airsheds studied. The reliability of theseNPI emission estimates is therefore considered low, and the use of this data and consequentemissions of each NPI substance should be considered with caution until more detailed boatingactivity data becomes available.
2.4.2 Regional airsheds�recreational boating emissions
Port Lincoln airshed
The Port Lincoln airshed contains only a small portion of the State�s coastline, in fact less than 1%(33 km). Therefore emissions from recreational boating activities were apportioned in relation tothe length of coastline and area of coast within the airshed by applying a 5 km buffer, as describedin Section 2.4.1. Boats operating within this airshed were determined from the State boatregistration data provided by Transport SA.
The use of boat registration data, coastal area buffer, portion of coastline and the domestic surveyresults of fuel consumption provided an estimate of the total volume of leaded and unleaded fueluse within the airshed. Fuel consumption was determined according to the boat engineclassifications of inboard or outboard. Inboard powered boats were estimated to useapproximately 3920 L and 5450 L annually of leaded and unleaded fuel respectively. Outboardpowered boats within the Port Lincoln airshed used 5480 L and 33,100 L of leaded and unleadedfuel respectively.
Emissions were calculated by multiplying each fuel figure by the corresponding emission factorlisted in the Boating EET manual for each NPI substance. The resulting emissions are presented inTable 10 for recreational boating activities within the Port Lincoln airshed.
Riverland airshed
The River Murray is a popular destination for a range of water activities by residents as well as themany tourists visiting the area. Three of the towns, Berri, Loxton and Renmark, are located on theRiver Murray. Barmera is located on the edge of Lake Bonney, which is fed by the River Murray.
Domestic survey responses indicated that 25% of respondents owning a boat preferred to use theriver as the main location for boating activities. Responses from the Adelaide metropolitan areaindicated that as many as 33% of boat owners preferred the river for their boating activities. Theseresponses were reflected in calculating emissions from powered boats, jet skis and houseboats.
NPI Summary Report: Adelaide and regional airsheds 1998-99
28
Houseboats included in this category exclude those registered for commercial purposes, which areincluded in the Shipping/Commercial Boating section of this report.
The number of boats registered within South Australia was apportioned according to the riveractivity prevalence reported in the domestic survey and the length of the river within theRiverland airshed. It was estimated that 458 powered inboard boats, 2460 powered outboardboats, 776 jet skis/speedboats and 58 houseboats operate within the Riverland airshed on anannual basis.
The emissions were estimated for the number of outboard and inboard powered boats and theaverage annual volume of fuel per boat, as reported in the domestic survey. Powered boats werereported to operate on either leaded or unleaded fuel. Jet skis, speedboats and houseboats wereassumed to have outboard powered motors, operating unleaded fuel only. Inboard powered boatswere estimated to use approximately 64,400 L and 89,500 L annually of leaded and unleaded fuelrespectively. Outboard powered boats used 346,000 L and 783,000 L annually of leaded andunleaded fuel respectively. The total annual emissions of each NPI substance were determined bymultiplying the annual consumption of fuel by boat type by the available inboard,leaded/unleaded fuel and outboard, leaded/unleaded fuel emission factors in the Boating EETmanual4.
The resultant total emissions from recreational boating during the 1998�99 year within theRiverland airshed are presented in Table 10. Table 11 presents emissions calculated for the minorRiverland airsheds of Barmera, Berri, Loxton and Renmark.
South East airshed
The South East airshed contains less than 3% (90.4 km) of the total South Australian coastline.Coastal and at-sea activities for this airshed were proportioned according to the length of the coastas well as the area of the coastal buffer. Emissions were calculated as outlined in previous sections.In brief, the State number of registered boats was apportioned to the airshed according to thelength of coastline. Further apportioning of emissions, to less than or greater than 5 kmrepresenting coastal or at-sea activities, was made by assuming 80% of boats operate within thecoast and 20% at-sea. Approximately 29,300 L and 131,000 L of leaded and unleaded fuelrespectively were estimated as used within the South East airshed during the 1998�99 year.
The total emissions from coastal, at-sea and lake boating activities are presented in Table 10 for theSouth East airshed. Boating activities on the lake in Mount Gambier are considered minimal dueto the restricted access and size of the lake, although the lake is seasonally popular for waterskiing. Therefore emissions presented for the Mount Gambier airshed (Table 11) represent ski boatand jet ski activity only.
Spencer Gulf airshed
The Spencer Gulf airshed contains approximately 7% (240 km) of coastline, the largest portion ofcoastline relative to the other airsheds. Recreational boating activities were calculated based onsurvey responses as determined in the other airsheds and include activities along the coastline andat-sea. Emissions for this region were only calculated for the major airshed of Spencer Gulf aspresented in Table 10. These emissions reflect the total annual use of 107,000 L and 324,000 L ofleaded and unleaded fuels respectively.
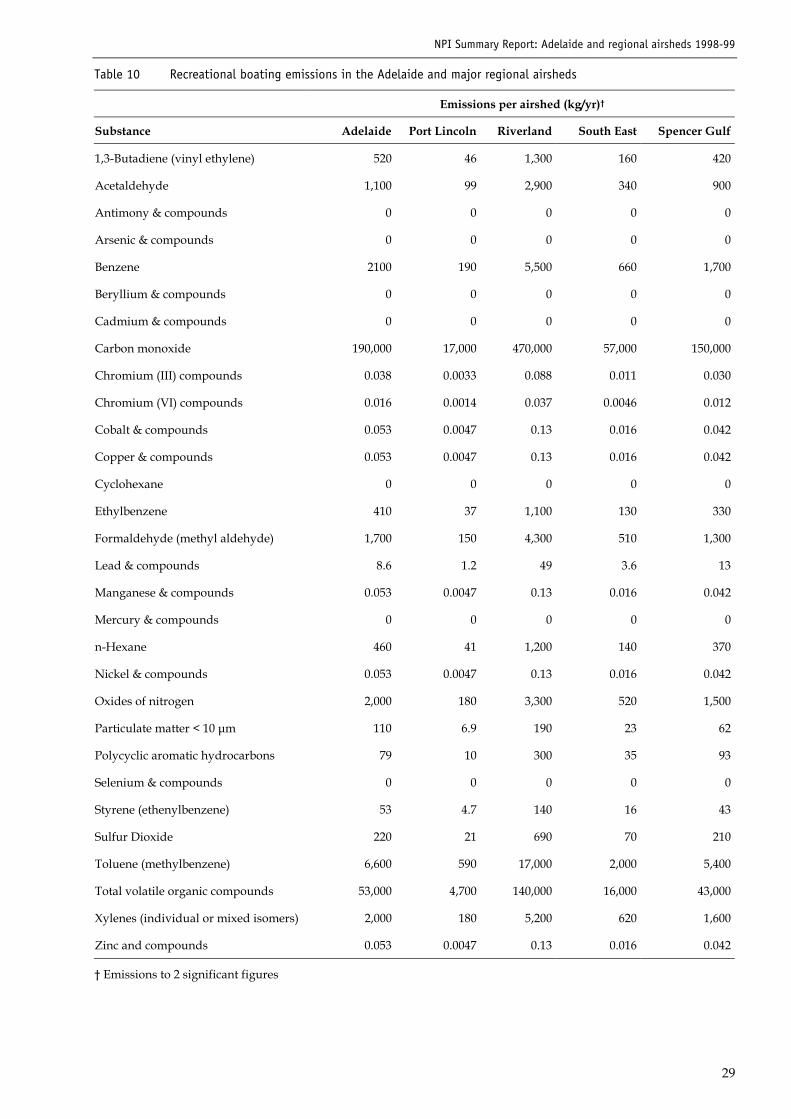
NPI Summary Report: Adelaide and regional airsheds 1998-99
29
Table 10 Recreational boating emissions in the Adelaide and major regional airsheds
Emissions per airshed (kg/yr)�
Substance Adelaide Port Lincoln Riverland South East Spencer Gulf
1,3-Butadiene (vinyl ethylene) 520 46 1,300 160 420
Acetaldehyde 1,100 99 2,900 340 900
Antimony & compounds 0 0 0 0 0
Arsenic & compounds 0 0 0 0 0
Benzene 2100 190 5,500 660 1,700
Beryllium & compounds 0 0 0 0 0
Cadmium & compounds 0 0 0 0 0
Carbon monoxide 190,000 17,000 470,000 57,000 150,000
Chromium (III) compounds 0.038 0.0033 0.088 0.011 0.030
Chromium (VI) compounds 0.016 0.0014 0.037 0.0046 0.012
Cobalt & compounds 0.053 0.0047 0.13 0.016 0.042
Copper & compounds 0.053 0.0047 0.13 0.016 0.042
Cyclohexane 0 0 0 0 0
Ethylbenzene 410 37 1,100 130 330
Formaldehyde (methyl aldehyde) 1,700 150 4,300 510 1,300
Lead & compounds 8.6 1.2 49 3.6 13
Manganese & compounds 0.053 0.0047 0.13 0.016 0.042
Mercury & compounds 0 0 0 0 0
n-Hexane 460 41 1,200 140 370
Nickel & compounds 0.053 0.0047 0.13 0.016 0.042
Oxides of nitrogen 2,000 180 3,300 520 1,500
Particulate matter < 10 µm 110 6.9 190 23 62
Polycyclic aromatic hydrocarbons 79 10 300 35 93
Selenium & compounds 0 0 0 0 0
Styrene (ethenylbenzene) 53 4.7 140 16 43
Sulfur Dioxide 220 21 690 70 210
Toluene (methylbenzene) 6,600 590 17,000 2,000 5,400
Total volatile organic compounds 53,000 4,700 140,000 16,000 43,000
Xylenes (individual or mixed isomers) 2,000 180 5,200 620 1,600
Zinc and compounds 0.053 0.0047 0.13 0.016 0.042
� Emissions to 2 significant figures
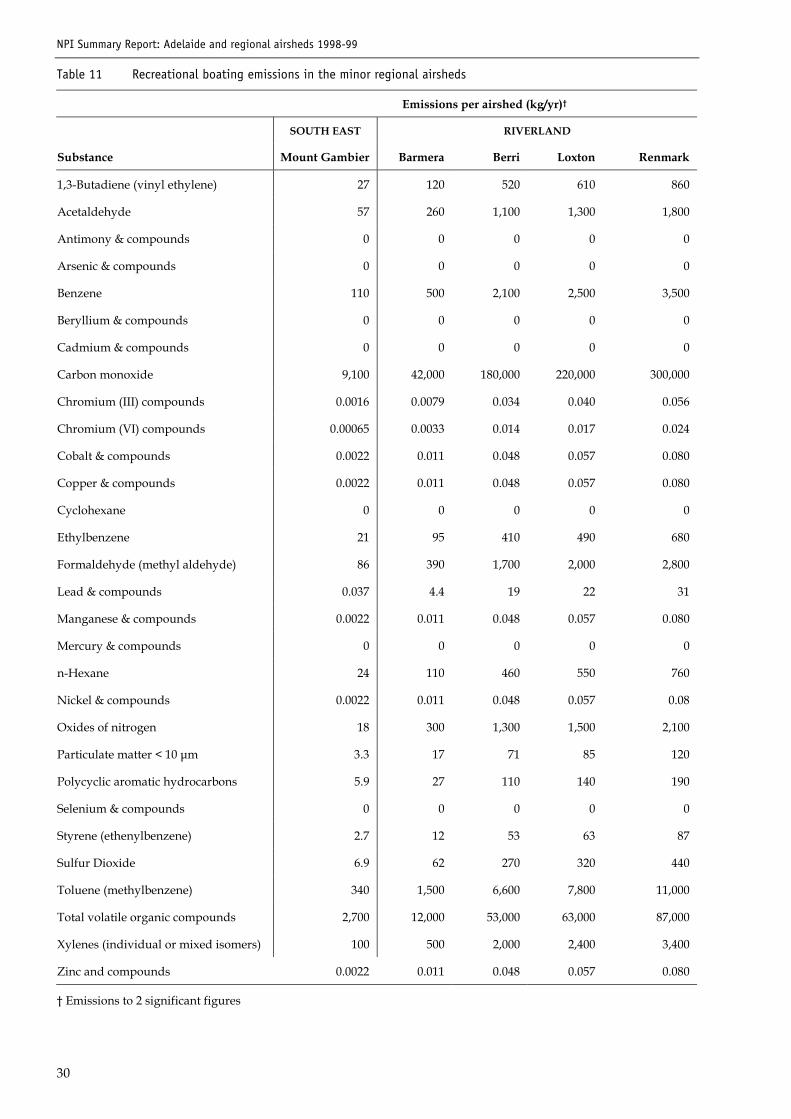
NPI Summary Report: Adelaide and regional airsheds 1998-99
30
Table 11 Recreational boating emissions in the minor regional airsheds
Emissions per airshed (kg/yr)�
SOUTH EAST RIVERLAND
Substance Mount Gambier Barmera Berri Loxton Renmark
1,3-Butadiene (vinyl ethylene) 27 120 520 610 860
Acetaldehyde 57 260 1,100 1,300 1,800
Antimony & compounds 0 0 0 0 0
Arsenic & compounds 0 0 0 0 0
Benzene 110 500 2,100 2,500 3,500
Beryllium & compounds 0 0 0 0 0
Cadmium & compounds 0 0 0 0 0
Carbon monoxide 9,100 42,000 180,000 220,000 300,000
Chromium (III) compounds 0.0016 0.0079 0.034 0.040 0.056
Chromium (VI) compounds 0.00065 0.0033 0.014 0.017 0.024
Cobalt & compounds 0.0022 0.011 0.048 0.057 0.080
Copper & compounds 0.0022 0.011 0.048 0.057 0.080
Cyclohexane 0 0 0 0 0
Ethylbenzene 21 95 410 490 680
Formaldehyde (methyl aldehyde) 86 390 1,700 2,000 2,800
Lead & compounds 0.037 4.4 19 22 31
Manganese & compounds 0.0022 0.011 0.048 0.057 0.080
Mercury & compounds 0 0 0 0 0
n-Hexane 24 110 460 550 760
Nickel & compounds 0.0022 0.011 0.048 0.057 0.08
Oxides of nitrogen 18 300 1,300 1,500 2,100
Particulate matter < 10 µm 3.3 17 71 85 120
Polycyclic aromatic hydrocarbons 5.9 27 110 140 190
Selenium & compounds 0 0 0 0 0
Styrene (ethenylbenzene) 2.7 12 53 63 87
Sulfur Dioxide 6.9 62 270 320 440
Toluene (methylbenzene) 340 1,500 6,600 7,800 11,000
Total volatile organic compounds 2,700 12,000 53,000 63,000 87,000
Xylenes (individual or mixed isomers) 100 500 2,000 2,400 3,400
Zinc and compounds 0.0022 0.011 0.048 0.057 0.080
� Emissions to 2 significant figures
NPI Summary Report: Adelaide and regional airsheds 1998-99
31
2.5 Shipping and commercial boatingCommercial shipping and boating emissions were calculated for each airshed with an active port.Shipping and commercial boating includes cargo ships, passenger ships, chemical tankers, colliers,naval ships, fishing boats, tug boats, work boats, passenger and cargo boats, and other smallcommercial utility craft. The emissions in this section were calculated according to themethodology specified by the Boating EET manual4. The emissions from shipping within eachairshed were calculated separately from commercial boating, although total emissions representthe sum of both activities.
Emissions from shipping include exhaust emissions for the vessel while under way and at berth.Excluded from the total estimates were emissions associated with the loading and unloading ofpetroleum liquids, as these were considered the responsibility of the maritime operator to report12.
Commercial boating emissions were calculated for all boats registered as �commercial� withTransport SA, and separated into less than or greater than 7 metres. This reference size separatesboats into inboard or outboard powered. Boats of less than 7 metres were considered to haveoutboard motors, while boats longer than 7 metres were categorised as inboard13. The emissionsfrom commercial boats reflect the volume of fuel consumed within an airshed.
2.5.1 Adelaide airshed�shipping and commercial boating emissionsThe Adelaide airshed includes two ports: an inner harbour located within the Port River and anouter harbour located on the tip of the Lefevre Peninsula. The inner harbour caters for roll-on roll-off and bulk cargoes. The outer harbour is equipped with specialist berths including a motorvehicle terminal for roll-on roll-off and general cargo as well as passenger transport.
Adelaide airshed shipping emissions were calculated from shipping activity data provided byPorts Corp, South Australia for both harbours14. The emissions include engine exhausts from ships�under way� and at �berth�. The unloading of petroleum fuels was not included in these estimatesneither were emissions from the refuelling of tankers. Shipping activity at the Port Stanvacrefinery was also not included as part of aggregated emissions since these emissions calculationswere considered the responsibility of the Mobil refinery and therefore should be estimated by theoperators.
Commercial boating emissions were estimated from the number of boats registered within theAdelaide airshed. These boats were classified as either under 7 metres or over 7 metres by the dataprovided by Transport SA15. Since commercial boating emissions arise from the fuel and boatengine type, boats above 7 metres were categorised as having inboard engines using diesel fueland boats under 7 metres were considered as having an outboard engine using unleaded petrolfuel. The volume of automotive diesel fuel used in recreational transport was reported as part ofthe Australian Bureau of Agricultural and Resource Economics (ABARE) research report16. Thisnational diesel fuel figure was apportioned according to the number of commercial boatsregistered in the Adelaide airshed compared to the State. Unleaded fuel use was not reported byABARE for this industry sector, so the volume was estimated by assuming that dieselconsumption by diesel powered boats was similar to that used by unleaded boats.
Fuel emission factors were used to determine total emissions of NPI substances; however, it wasnecessary to apportion these emissions according to the time spent within the airshed. In theAdelaide airshed, the distance of the coastal waters varies from 0 km to 2.5 km off shore. This isonly a small fraction of the total distance in which these boats would generally operate. Thereforethe average time boats would spend operating within the airshed was estimated at approximately10%, which was assumed to reflect the function of leaving and returning to port.
The combined emissions from shipping and commercial boating activities within the Adelaideairshed are presented in Table 12.
NPI Summary Report: Adelaide and regional airsheds 1998-99
32
2.5.2 Regional airshed�shipping and commercial boating emissions
Port Lincoln airshed
Ports Corp14 and Transport SA15 provided all of the regional airshed shipping and commercialboating data. Port Lincoln shipping emissions include emissions from engine exhaust while theboat travels along the shipping route and while at berth. Port Lincoln is also regarded as a majorcommercial fishing port, so all boats registered within the area were considered to operate fromports within the airshed.
Total emissions presented in Table 12 comprise those from combined shipping and commercialboating activities within the airshed. Since shipping emissions are calculated according to thelength of the shipping route or channel, there was no need to further apportion the total emissionsestimated. However, emissions from commercial boats do not relate to any specific route and itwas therefore necessary to determine the portion of time spent within the airshed andconsequently apportion the emissions respectively. Based on the location of the coastal waters inrelation to the airshed boundary, it was estimated that only 10% of the total commercial boatingemissions should be allocated to the airshed.
Riverland airshed
Commercial boating is the only activity estimated in this airshed, which mostly consists ofhouseboats. Data provided by Transport SA15 showed that all boats registered within the airshedarea were less than 7 metres in length. Thus emissions calculated for this airshed exclude thoserelating to inboard, diesel powered boats. A number of operators within the airshed disclosedtheir fuel use and from this the average volume of fuel used by individual houseboats wasassessed.
Emissions were calculated according to the methodology described in the Boating EET manual4
for the total number of commercial boats registered in the area. These estimates do not account forthe unknown number of boats that may be registered in other areas but operate within theairshed. Without accurate activity data, it is difficult to accurately determine the number of boatsoperating within the area. Therefore emissions were calculated with the assumption that onlyregistered boats operate entirely within the airshed, without apportioning the data by the actualtime spent in the airshed. It is possible that this assumption may overestimate emissions byincluding boats that may not have operated in the airshed during the inventory period, althoughthis may be compensated by the unknown number of boats that did operate in the area during theinventory period but were registered elsewhere.
Table 12 and Table 13 present total emissions calculated within the Riverland airshed and theminor Riverland airsheds of Berri, Loxton and Renmark. Barmera airshed was considered to haveno commercial boating activity and therefore excluded from this section of the report.
South East airshed
The South East airshed does not have an operating shipping port. Total emissions shown in Table12 relate only to the use of commercial boats registered within the South East airshed area. Again,commercial boats were grouped into the two categories of less than and greater than 7 metres inlength, which can be related to the type of fuel used for propulsion. Emissions were calculatedaccording to the methodology described in the Boating EET manual4.
The emissions presented in Table 12 have been apportioned to represent those related to the areaof coast within the airshed. Approximately 10% of the total emissions from commercial boats wasallocated to the airshed, which represents the transit of boats to and from port.
NPI Summary Report: Adelaide and regional airsheds 1998-99
33
Spencer Gulf airshed
The Spencer Gulf airshed has three active shipping ports located at Port Bonython, Port Pirie andWhyalla. Port Bonython provides shipping of liquid hydrocarbons recovered from the Cooper andEromanga basins. Port Pirie is an active port that ships large quantities of lead, zinc and other oresas well as agricultural produce such as grain. The Whyalla port exports locally produced ore andsteel from the main steelworks industry, BHP.
Shipping data was provided by Ports Corp14 and used to determine engine exhaust emissions forvessels �under way� along the shipping routes within the airshed and while berthed at dock.Information relating to the unloading of petrol fuels only was provided for the ports at Whyallaand Port Bonython. However, emissions from the unloading of leaded fuel, diesel and liquefiedpetroleum gas (LPG) were not included in these estimates.
Commercial boating emissions were calculated assuming all boats registered within the SpencerGulf airshed operate within the airshed waters. Registered boats were categorised according tolength into two groups: greater than 7 metres (operating inboard, diesel engines) and less than 7metres (operating outboard, unleaded fuel engines). The volume of diesel fuel was apportionedfrom ABARE data16. This information was used to extrapolate the volume of petrol fuel used byoutboard powered boats.
The combined emissions from shipping and commercial boating for the 1998�99 year arepresented for the major Spencer Gulf airshed in Table 12. Due to the minimal spatialrepresentation of water within the minor airsheds of Port Augusta, Port Pirie and Whyalla,shipping and commercial boating emissions were not resolved in these airsheds.
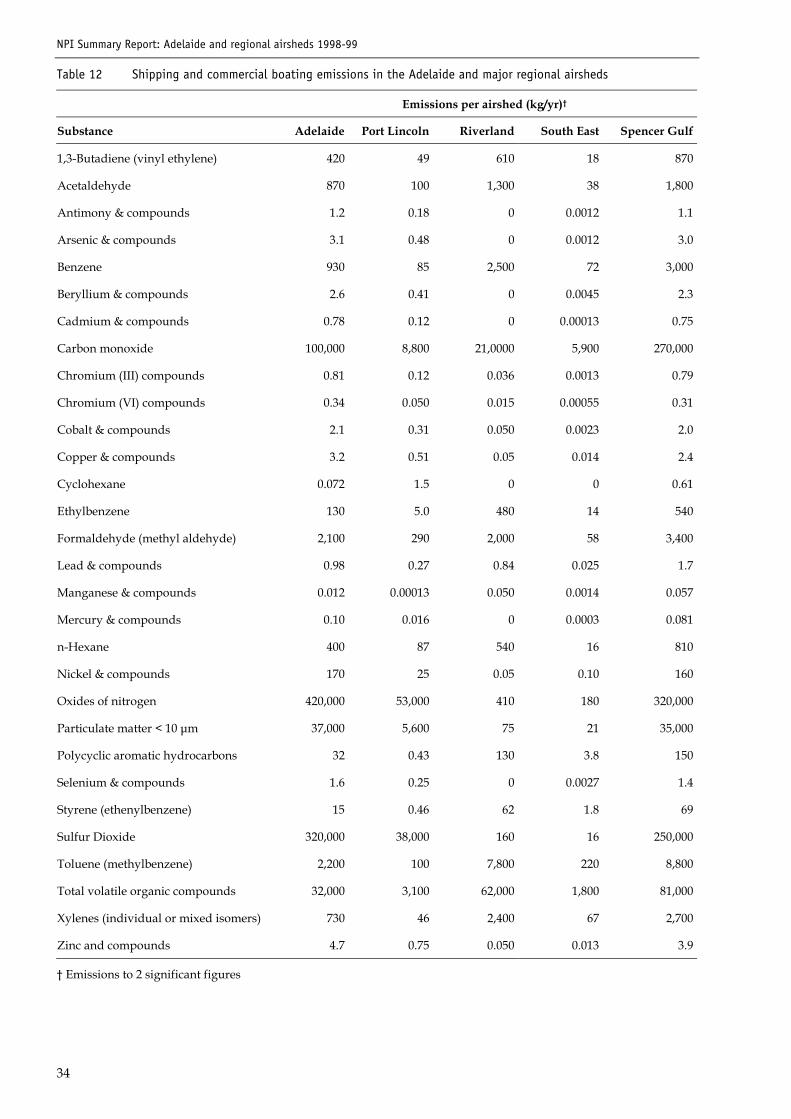
NPI Summary Report: Adelaide and regional airsheds 1998-99
34
Table 12 Shipping and commercial boating emissions in the Adelaide and major regional airsheds
Emissions per airshed (kg/yr)�
Substance Adelaide Port Lincoln Riverland South East Spencer Gulf
1,3-Butadiene (vinyl ethylene) 420 49 610 18 870
Acetaldehyde 870 100 1,300 38 1,800
Antimony & compounds 1.2 0.18 0 0.0012 1.1
Arsenic & compounds 3.1 0.48 0 0.0012 3.0
Benzene 930 85 2,500 72 3,000
Beryllium & compounds 2.6 0.41 0 0.0045 2.3
Cadmium & compounds 0.78 0.12 0 0.00013 0.75
Carbon monoxide 100,000 8,800 21,0000 5,900 270,000
Chromium (III) compounds 0.81 0.12 0.036 0.0013 0.79
Chromium (VI) compounds 0.34 0.050 0.015 0.00055 0.31
Cobalt & compounds 2.1 0.31 0.050 0.0023 2.0
Copper & compounds 3.2 0.51 0.05 0.014 2.4
Cyclohexane 0.072 1.5 0 0 0.61
Ethylbenzene 130 5.0 480 14 540
Formaldehyde (methyl aldehyde) 2,100 290 2,000 58 3,400
Lead & compounds 0.98 0.27 0.84 0.025 1.7
Manganese & compounds 0.012 0.00013 0.050 0.0014 0.057
Mercury & compounds 0.10 0.016 0 0.0003 0.081
n-Hexane 400 87 540 16 810
Nickel & compounds 170 25 0.05 0.10 160
Oxides of nitrogen 420,000 53,000 410 180 320,000
Particulate matter < 10 µm 37,000 5,600 75 21 35,000
Polycyclic aromatic hydrocarbons 32 0.43 130 3.8 150
Selenium & compounds 1.6 0.25 0 0.0027 1.4
Styrene (ethenylbenzene) 15 0.46 62 1.8 69
Sulfur Dioxide 320,000 38,000 160 16 250,000
Toluene (methylbenzene) 2,200 100 7,800 220 8,800
Total volatile organic compounds 32,000 3,100 62,000 1,800 81,000
Xylenes (individual or mixed isomers) 730 46 2,400 67 2,700
Zinc and compounds 4.7 0.75 0.050 0.013 3.9
� Emissions to 2 significant figures
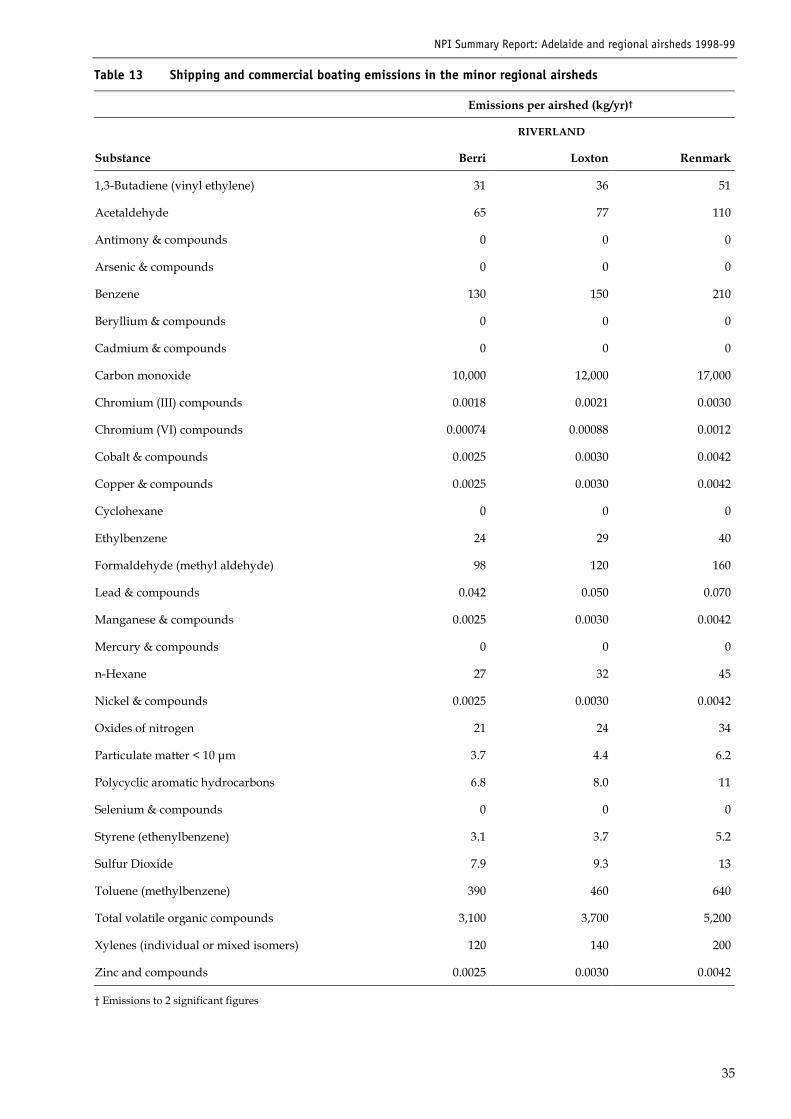
NPI Summary Report: Adelaide and regional airsheds 1998-99
35
Table 13 Shipping and commercial boating emissions in the minor regional airsheds
Emissions per airshed (kg/yr)�
RIVERLAND
Substance Berri Loxton Renmark
1,3-Butadiene (vinyl ethylene) 31 36 51
Acetaldehyde 65 77 110
Antimony & compounds 0 0 0
Arsenic & compounds 0 0 0
Benzene 130 150 210
Beryllium & compounds 0 0 0
Cadmium & compounds 0 0 0
Carbon monoxide 10,000 12,000 17,000
Chromium (III) compounds 0.0018 0.0021 0.0030
Chromium (VI) compounds 0.00074 0.00088 0.0012
Cobalt & compounds 0.0025 0.0030 0.0042
Copper & compounds 0.0025 0.0030 0.0042
Cyclohexane 0 0 0
Ethylbenzene 24 29 40
Formaldehyde (methyl aldehyde) 98 120 160
Lead & compounds 0.042 0.050 0.070
Manganese & compounds 0.0025 0.0030 0.0042
Mercury & compounds 0 0 0
n-Hexane 27 32 45
Nickel & compounds 0.0025 0.0030 0.0042
Oxides of nitrogen 21 24 34
Particulate matter < 10 µm 3.7 4.4 6.2
Polycyclic aromatic hydrocarbons 6.8 8.0 11
Selenium & compounds 0 0 0
Styrene (ethenylbenzene) 3.1 3.7 5.2
Sulfur Dioxide 7.9 9.3 13
Toluene (methylbenzene) 390 460 640
Total volatile organic compounds 3,100 3,700 5,200
Xylenes (individual or mixed isomers) 120 140 200
Zinc and compounds 0.0025 0.0030 0.0042
� Emissions to 2 significant figures
NPI Summary Report: Adelaide and regional airsheds 1998-99
36
Section 3: Area-based sources
3.1 Architectural surface coatingsArchitectural surface coatings protect the substrates to which they are applied from corrosion,abrasion, decay, ultra-violet light and water damage. The predominant emissions fromarchitectural surface coatings are volatile organic compounds (VOCs), contained both in thecoatings themselves (i.e. paint, paint primer, varnish or lacquer) and in the solvents used asthinners and for cleaning up. Emission of particulate matter was not considered in these estimatessince most applications assumed the use of brushes and rollers.
The estimation of architectural surface coating emissions was calculated from the reported sale ofpaints for domestic and industrial purposes during the 1998�99 financial year and apportionedusing population and industry densities respectively. The methodology for calculating theseemissions is outlined in the NPI Emissions Estimation Technique Manual for Aggregated Emissionsfrom Architectural Surface Coatings 17(Surface coating EET manual).
3.1.1 Adelaide airshed�architectural surface coating emissionsEmissions from architectural surface coating activities within the Adelaide airshed were estimatedfrom national paint consumption data apportioned according to population using the totalproduction and net import/export volumes data provided by the Australian Paint ManufacturingFederation18 (APMF). Various paint types were grouped into the two categories, domestic andindustrial. Domestic paints were further split into solvent and water based; industrial paints areonly solvent based.
The uses of domestic and industrial paints throughout the airshed were considered relative tohousing and industry demands. Therefore emissions from both these paint types were consideredseparately to account for the varying distribution throughout the airshed. Emission factors listedin the surface coating EET manual17 were multiplied by the volume of each paint type used withinthe airshed. For spatial distribution of total emissions, emissions were apportioned to grid squaresto reflect the corresponding housing or industry density. Total emissions from architecturalsurface coatings (Table 14) include the emissions from domestic and industrial, solvent and waterbased paints.
3.1.2 Regional airsheds�architectural surface coating emissionsEmissions from architectural surface coatings in each of the regional airsheds were estimatedaccording to the methodology described in the surface coating EET manual17 and applied incalculating architectural surface coating emissions in the Adelaide airshed.
In brief, architectural surface coating emissions were calculated by apportioning national paintconsumption data to each of the regional airsheds according to the population of each airshed.These apportioned paint consumption figures were then multiplied by the respective emissionfactors listed in the EET manual17. Emissions from domestic and industrial paints were calculatedseparately due to the variation in geographical distribution. However, once values wereapportioned to respective grid squares according to either housing or industry density data fordomestic and industrial paints respectively, total emission estimates were calculated by summingall grid squares together.
Table 14 and Table 15 present total emissions from architectural surface coatings estimated foreach of the major and minor regional airsheds respectively. The data represents total emissions ofall domestic and industrial paint used during 1998�99.
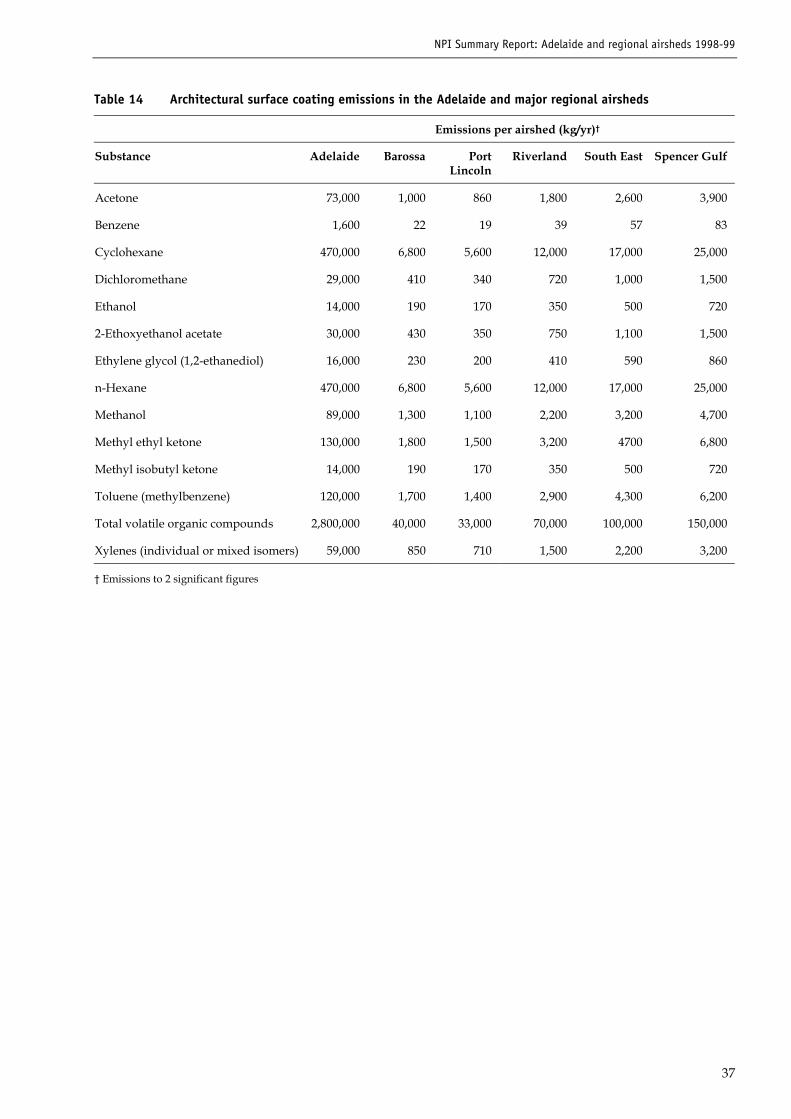
NPI Summary Report: Adelaide and regional airsheds 1998-99
37
Table 14 Architectural surface coating emissions in the Adelaide and major regional airsheds
Emissions per airshed (kg/yr)�
Substance Adelaide Barossa PortLincoln
Riverland South East Spencer Gulf
Acetone 73,000 1,000 860 1,800 2,600 3,900
Benzene 1,600 22 19 39 57 83
Cyclohexane 470,000 6,800 5,600 12,000 17,000 25,000
Dichloromethane 29,000 410 340 720 1,000 1,500
Ethanol 14,000 190 170 350 500 720
2-Ethoxyethanol acetate 30,000 430 350 750 1,100 1,500
Ethylene glycol (1,2-ethanediol) 16,000 230 200 410 590 860
n-Hexane 470,000 6,800 5,600 12,000 17,000 25,000
Methanol 89,000 1,300 1,100 2,200 3,200 4,700
Methyl ethyl ketone 130,000 1,800 1,500 3,200 4700 6,800
Methyl isobutyl ketone 14,000 190 170 350 500 720
Toluene (methylbenzene) 120,000 1,700 1,400 2,900 4,300 6,200
Total volatile organic compounds 2,800,000 40,000 33,000 70,000 100,000 150,000
Xylenes (individual or mixed isomers) 59,000 850 710 1,500 2,200 3,200
� Emissions to 2 significant figures
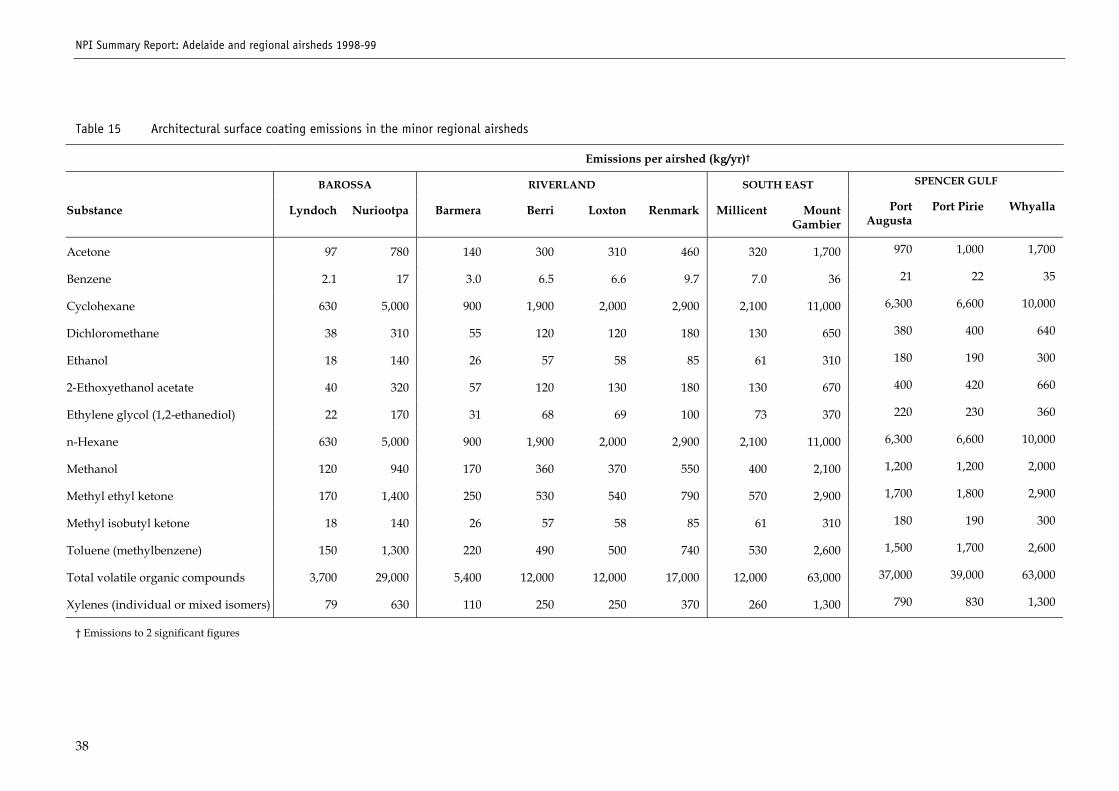
NPI Summary Report: Adelaide and regional airsheds 1998-99
38
Table 15 Architectural surface coating emissions in the minor regional airsheds
Emissions per airshed (kg/yr)�
BAROSSA RIVERLAND SOUTH EAST SPENCER GULF
Substance Lyndoch Nuriootpa Barmera Berri Loxton Renmark Millicent MountGambier
PortAugusta
Port Pirie Whyalla
Acetone 97 780 140 300 310 460 320 1,700 970 1,000 1,700
Benzene 2.1 17 3.0 6.5 6.6 9.7 7.0 36 21 22 35
Cyclohexane 630 5,000 900 1,900 2,000 2,900 2,100 11,000 6,300 6,600 10,000
Dichloromethane 38 310 55 120 120 180 130 650 380 400 640
Ethanol 18 140 26 57 58 85 61 310 180 190 300
2-Ethoxyethanol acetate 40 320 57 120 130 180 130 670 400 420 660
Ethylene glycol (1,2-ethanediol) 22 170 31 68 69 100 73 370 220 230 360
n-Hexane 630 5,000 900 1,900 2,000 2,900 2,100 11,000 6,300 6,600 10,000
Methanol 120 940 170 360 370 550 400 2,100 1,200 1,200 2,000
Methyl ethyl ketone 170 1,400 250 530 540 790 570 2,900 1,700 1,800 2,900
Methyl isobutyl ketone 18 140 26 57 58 85 61 310 180 190 300
Toluene (methylbenzene) 150 1,300 220 490 500 740 530 2,600 1,500 1,700 2,600
Total volatile organic compounds 3,700 29,000 5,400 12,000 12,000 17,000 12,000 63,000 37,000 39,000 63,000
Xylenes (individual or mixed isomers) 79 630 110 250 250 370 260 1,300 790 830 1,300
� Emissions to 2 significant figures
NPI Summary Report: Adelaide and regional airsheds 1998-99
39
3.2 Cutback bitumenCutback bitumen refers to the process of sealing or resurfacing roads. Primers or primer bindermaterials, which are generally solvents such as kerosene or aviation turbine fuels, reduce theviscosity of the bitumen. These products can be applied either as surface treatments or to primethe surface before other surfacing work, or may be blended with bitumen in spray sealingoperations.
The emissions from cutback bitumen result from the use of primers and primer binders. Theseproducts give off emissions of volatile organic compounds during the application and dryingstages. The solvent kerosene was considered the only type of primer used in each of the airsheds.Additionally, the quantity of solvent kerosene used generally falls into four categories�very lightprime, medium prime, heavy prime and cutback bitumen. These categories vary by the percentageof solvent kerosene used, from 55% in very light prime to 5% in cutback bitumen.
The calculation of emission estimates in each airshed was in accordance with the methodologydescribed in the NPI Emissions Estimation Technique Manual for Aggregated Emissions from CutbackBitumen19 (Cutback bitumen EET manual). This methodology assumes the mass balance approachwhere the annual emissions are equal to the annual consumption of product per airshed.
3.2.1 Adelaide airshed�cutback bitumen emissionsCutback bitumen emissions within the Adelaide airshed were based on data provided by themajor suppliers of primer products�Boral Asphalt, CSR Emoleum and Pioneer Road Services20-22.Approximately 400,000 L of solvent kerosene was applied to road surfaces during the 1998�99year, of which approximately 29% was used throughout the Adelaide airshed.
The resultant emissions of each NPI substance contained in solvent kerosene were determinedfrom the total airshed consumption figure. The mass of solvent kerosene was calculated from thevolume by multiplying by the density of the solvent. This resultant mass was then multiplied bythe corresponding emission factors listed in the cutback bitumen EET manual19 to determine theemissions of each NPI substance.
Total emissions estimates from the use of kerosene in the process of cutback bitumen in theAdelaide airshed are presented in Table 16. Spatial distribution of emissions within the airshedwas calculated by apportioning the emissions data according to the gridded road traffic data (VKTdata; see Section 2.2).
3.2.2 Regional airsheds�cutback bitumen emissionsThe emissions resulting from the application of cutback bitumen within regional airsheds wereestimated assuming that the solvent kerosene consumed in an airshed is emitted during theinventory period. As a result, regional consumption of solvent kerosene applied to surfaced roadswas estimated to be 284,000 L, 71% of the State�s total. Kerosene use within each regional airshedwas further estimated by apportioning the regional total consumption figure by each airshed�sVKT data. Emissions were calculated by multiplying the kerosene use by emission factors listed inthe Cutback bitumen EET manual19.
Resultant emission estimates for each major regional airshed are presented in Table 16, whileminor regional airshed emissions are presented in Table 17. Spatial distribution of total emissionswithin each airshed was calculated by apportioning emissions according to the gridded VKT data.
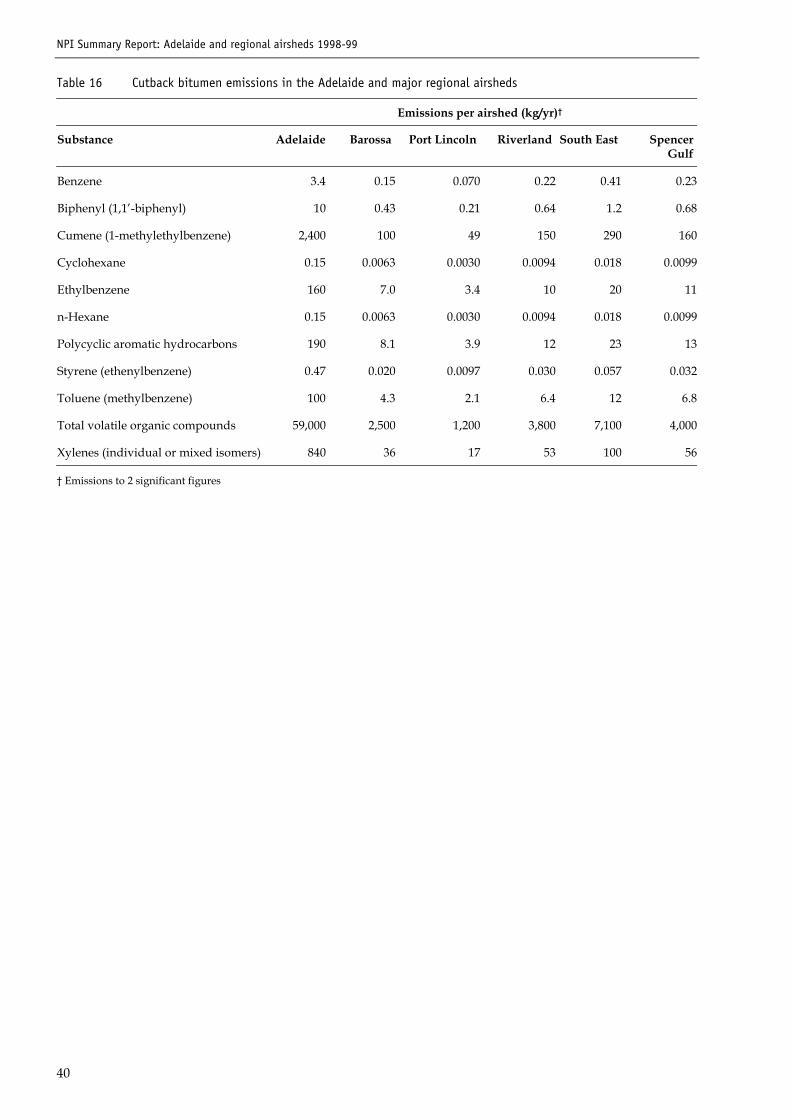
NPI Summary Report: Adelaide and regional airsheds 1998-99
40
Table 16 Cutback bitumen emissions in the Adelaide and major regional airsheds
Emissions per airshed (kg/yr)�
Substance Adelaide Barossa Port Lincoln Riverland South East SpencerGulf
Benzene 3.4 0.15 0.070 0.22 0.41 0.23
Biphenyl (1,1�-biphenyl) 10 0.43 0.21 0.64 1.2 0.68
Cumene (1-methylethylbenzene) 2,400 100 49 150 290 160
Cyclohexane 0.15 0.0063 0.0030 0.0094 0.018 0.0099
Ethylbenzene 160 7.0 3.4 10 20 11
n-Hexane 0.15 0.0063 0.0030 0.0094 0.018 0.0099
Polycyclic aromatic hydrocarbons 190 8.1 3.9 12 23 13
Styrene (ethenylbenzene) 0.47 0.020 0.0097 0.030 0.057 0.032
Toluene (methylbenzene) 100 4.3 2.1 6.4 12 6.8
Total volatile organic compounds 59,000 2,500 1,200 3,800 7,100 4,000
Xylenes (individual or mixed isomers) 840 36 17 53 100 56
� Emissions to 2 significant figures
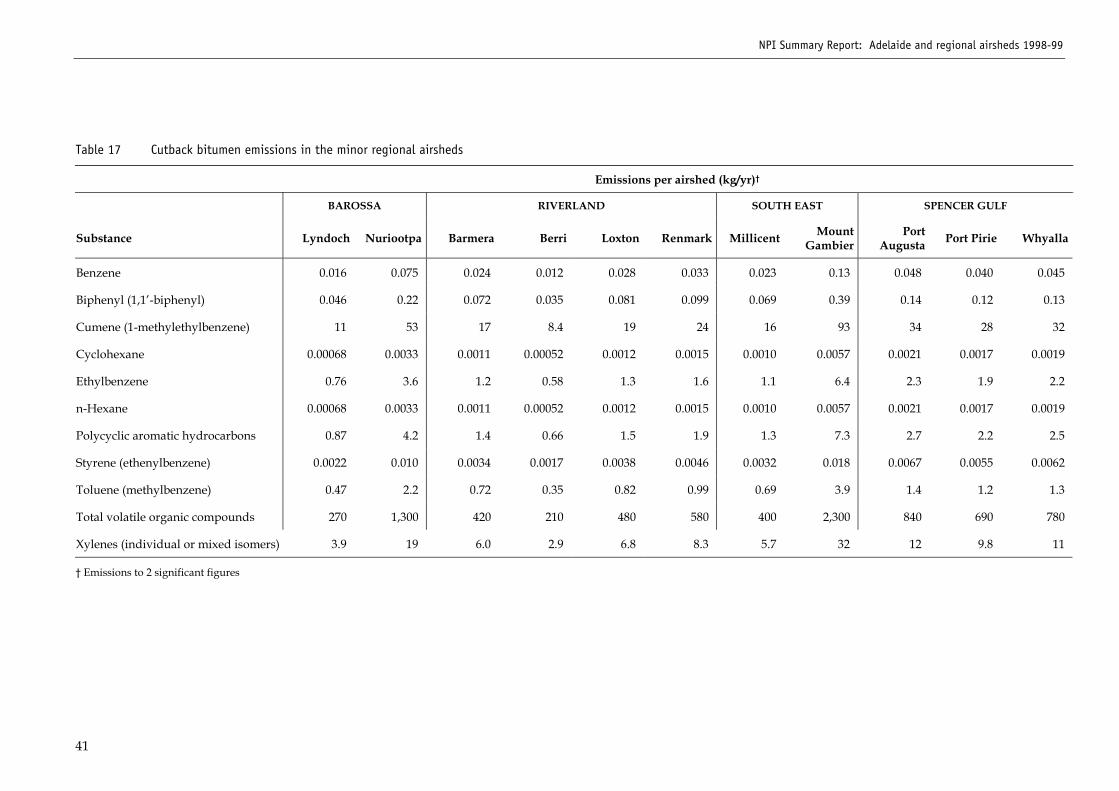
NPI Summary Report: Adelaide and regional airsheds 1998-99
41
Table 17 Cutback bitumen emissions in the minor regional airsheds
Emissions per airshed (kg/yr)�
BAROSSA RIVERLAND SOUTH EAST SPENCER GULF
Substance Lyndoch Nuriootpa Barmera Berri Loxton Renmark Millicent MountGambier
PortAugusta Port Pirie Whyalla
Benzene 0.016 0.075 0.024 0.012 0.028 0.033 0.023 0.13 0.048 0.040 0.045
Biphenyl (1,1�-biphenyl) 0.046 0.22 0.072 0.035 0.081 0.099 0.069 0.39 0.14 0.12 0.13
Cumene (1-methylethylbenzene) 11 53 17 8.4 19 24 16 93 34 28 32
Cyclohexane 0.00068 0.0033 0.0011 0.00052 0.0012 0.0015 0.0010 0.0057 0.0021 0.0017 0.0019
Ethylbenzene 0.76 3.6 1.2 0.58 1.3 1.6 1.1 6.4 2.3 1.9 2.2
n-Hexane 0.00068 0.0033 0.0011 0.00052 0.0012 0.0015 0.0010 0.0057 0.0021 0.0017 0.0019
Polycyclic aromatic hydrocarbons 0.87 4.2 1.4 0.66 1.5 1.9 1.3 7.3 2.7 2.2 2.5
Styrene (ethenylbenzene) 0.0022 0.010 0.0034 0.0017 0.0038 0.0046 0.0032 0.018 0.0067 0.0055 0.0062
Toluene (methylbenzene) 0.47 2.2 0.72 0.35 0.82 0.99 0.69 3.9 1.4 1.2 1.3
Total volatile organic compounds 270 1,300 420 210 480 580 400 2,300 840 690 780
Xylenes (individual or mixed isomers) 3.9 19 6.0 2.9 6.8 8.3 5.7 32 12 9.8 11
� Emissions to 2 significant figures
NPI Summary Report: Adelaide and regional airsheds 1998-99
42
3.3 Domestic and commercial solvent and aerosol useDomestic and commercial solvents and aerosols estimated in this section refer to a range ofdomestic and commercial products. Solvents within these products include many NPI substancesthat are emitted to the atmosphere with use. The following groups of solvent and aerosol productsare covered by the estimations in this section:
� personal care products
� household cleaners
� motor vehicle aftermarket products
� adhesives and sealants
� insecticides and herbicides
� coatings and related products
� miscellaneous products.
Not included in this section are emissions from the use of architectural surface coatings, motorvehicle refinishing and sub-reporting threshold facility solvents, which are covered in othersections of this report. Also not included in this section are emissions from broadacre andhorticultural applications of pesticides. The pesticide products covered in this section relate onlyto domestic and commercial applications.
The solvents used in these domestic and commercial products contain VOCs that act either asactive ingredients themselves or as carriers for the active ingredients. The emissions of VOCsoccur during product use by immediate evaporation (aerosol spray), evaporation after application(product drying) and direct release in the gaseous phase23.
Emissions calculated from the use of domestic and commercial solvents and aerosols weredetermined by applying emission factors listed in the NPI Emissions Estimation Technique Manualfor Aggregated Emissions from Domestic/Commercial Solvent and Aerosol Use (Solvent EET manual)24.
3.3.1 Adelaide airshed�domestic and commercial solvent emissionsEmissions estimated in the Adelaide airshed reflect the quantity of products consumed by thepopulation of that area. Emission factors listed in the EET manual for domestic and commercialsolvent and aerosol use are based on per capita usage of the various product groups. These factorshave been derived in the United States and are considered to give estimates of reasonable andacceptable accuracy for Australian conditions24.
Domestic and commercial solvent and aerosol emissions (Table 18) were calculated by multiplyingthe per capita usage emission factors in the Solvent EET manual24 by the population of theAdelaide airshed. Total emissions presented in Table 18 were spatially disaggregated to individualgrid squares, according to the population of each grid square within the Adelaide airshed.
3.3.2 Regional airsheds�domestic and commercial solvent emissionsEmissions estimated in regional airsheds were calculated according to the methodology describedin Section 3.3.1. In brief, per capita emission factors related to the use of solvents and aerosolswere multiplied by the airshed�s population.
Total emissions listed in Table 18 are for each of the major regional airsheds. Emissions presentedin Table 19 represent those estimated for each of the minor regional airsheds. Emission totals werespatially distributed according to the population of each grid square within each airshed.
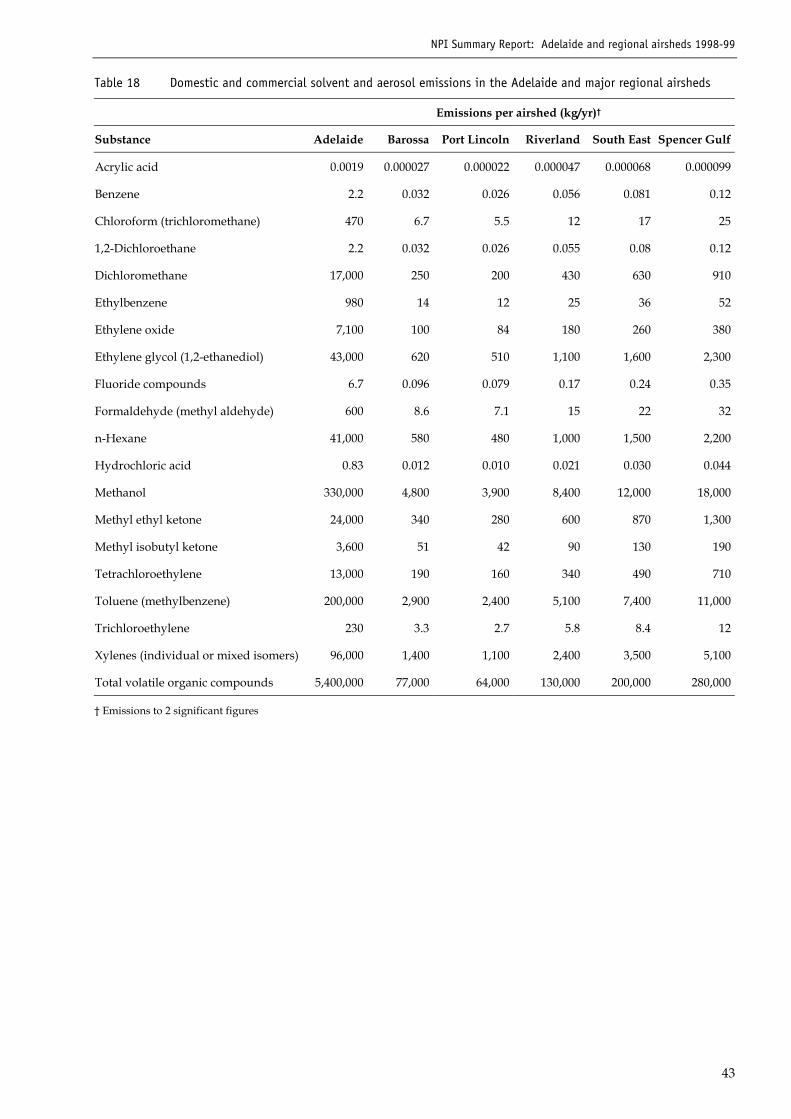
NPI Summary Report: Adelaide and regional airsheds 1998-99
43
Table 18 Domestic and commercial solvent and aerosol emissions in the Adelaide and major regional airsheds
Emissions per airshed (kg/yr)�
Substance Adelaide Barossa Port Lincoln Riverland South East Spencer Gulf
Acrylic acid 0.0019 0.000027 0.000022 0.000047 0.000068 0.000099
Benzene 2.2 0.032 0.026 0.056 0.081 0.12
Chloroform (trichloromethane) 470 6.7 5.5 12 17 25
1,2-Dichloroethane 2.2 0.032 0.026 0.055 0.08 0.12
Dichloromethane 17,000 250 200 430 630 910
Ethylbenzene 980 14 12 25 36 52
Ethylene oxide 7,100 100 84 180 260 380
Ethylene glycol (1,2-ethanediol) 43,000 620 510 1,100 1,600 2,300
Fluoride compounds 6.7 0.096 0.079 0.17 0.24 0.35
Formaldehyde (methyl aldehyde) 600 8.6 7.1 15 22 32
n-Hexane 41,000 580 480 1,000 1,500 2,200
Hydrochloric acid 0.83 0.012 0.010 0.021 0.030 0.044
Methanol 330,000 4,800 3,900 8,400 12,000 18,000
Methyl ethyl ketone 24,000 340 280 600 870 1,300
Methyl isobutyl ketone 3,600 51 42 90 130 190
Tetrachloroethylene 13,000 190 160 340 490 710
Toluene (methylbenzene) 200,000 2,900 2,400 5,100 7,400 11,000
Trichloroethylene 230 3.3 2.7 5.8 8.4 12
Xylenes (individual or mixed isomers) 96,000 1,400 1,100 2,400 3,500 5,100
Total volatile organic compounds 5,400,000 77,000 64,000 130,000 200,000 280,000
� Emissions to 2 significant figures
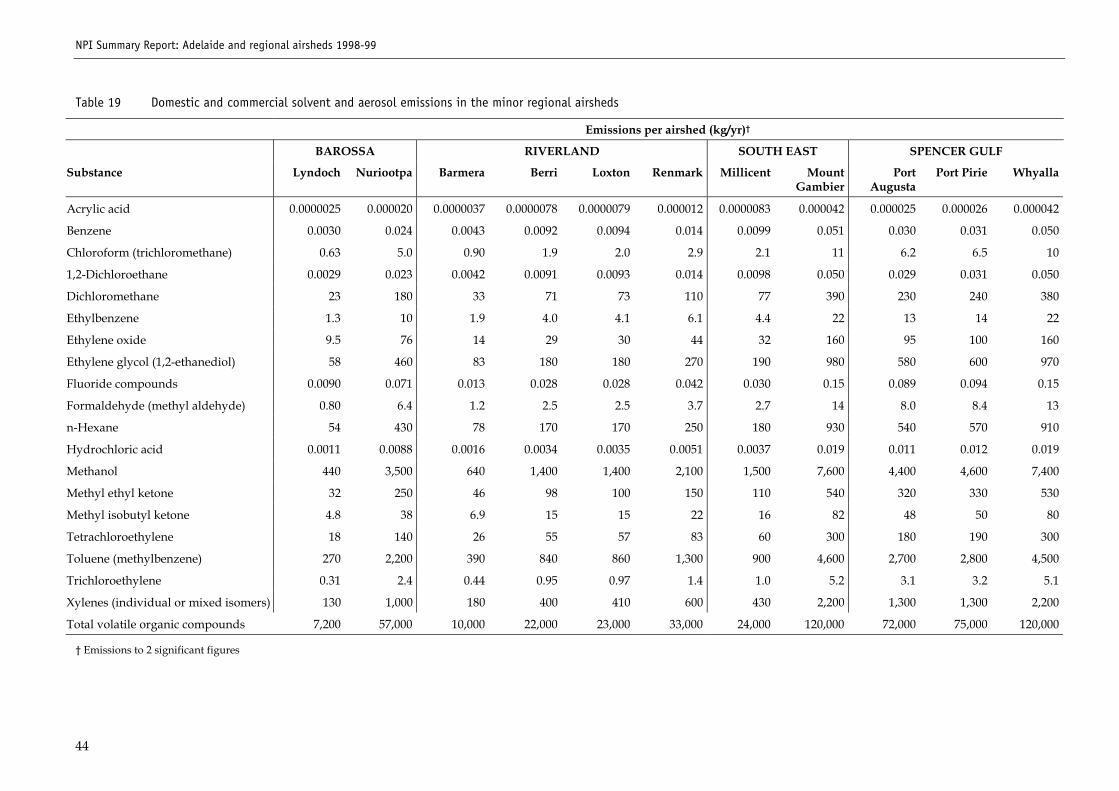
NPI Summary Report: Adelaide and regional airsheds 1998-99
44
Table 19 Domestic and commercial solvent and aerosol emissions in the minor regional airsheds
Emissions per airshed (kg/yr)�
BAROSSA RIVERLAND SOUTH EAST SPENCER GULF
Substance Lyndoch Nuriootpa Barmera Berri Loxton Renmark Millicent MountGambier
PortAugusta
Port Pirie Whyalla
Acrylic acid 0.0000025 0.000020 0.0000037 0.0000078 0.0000079 0.000012 0.0000083 0.000042 0.000025 0.000026 0.000042
Benzene 0.0030 0.024 0.0043 0.0092 0.0094 0.014 0.0099 0.051 0.030 0.031 0.050
Chloroform (trichloromethane) 0.63 5.0 0.90 1.9 2.0 2.9 2.1 11 6.2 6.5 10
1,2-Dichloroethane 0.0029 0.023 0.0042 0.0091 0.0093 0.014 0.0098 0.050 0.029 0.031 0.050
Dichloromethane 23 180 33 71 73 110 77 390 230 240 380
Ethylbenzene 1.3 10 1.9 4.0 4.1 6.1 4.4 22 13 14 22
Ethylene oxide 9.5 76 14 29 30 44 32 160 95 100 160
Ethylene glycol (1,2-ethanediol) 58 460 83 180 180 270 190 980 580 600 970
Fluoride compounds 0.0090 0.071 0.013 0.028 0.028 0.042 0.030 0.15 0.089 0.094 0.15
Formaldehyde (methyl aldehyde) 0.80 6.4 1.2 2.5 2.5 3.7 2.7 14 8.0 8.4 13
n-Hexane 54 430 78 170 170 250 180 930 540 570 910
Hydrochloric acid 0.0011 0.0088 0.0016 0.0034 0.0035 0.0051 0.0037 0.019 0.011 0.012 0.019
Methanol 440 3,500 640 1,400 1,400 2,100 1,500 7,600 4,400 4,600 7,400
Methyl ethyl ketone 32 250 46 98 100 150 110 540 320 330 530
Methyl isobutyl ketone 4.8 38 6.9 15 15 22 16 82 48 50 80
Tetrachloroethylene 18 140 26 55 57 83 60 300 180 190 300
Toluene (methylbenzene) 270 2,200 390 840 860 1,300 900 4,600 2,700 2,800 4,500
Trichloroethylene 0.31 2.4 0.44 0.95 0.97 1.4 1.0 5.2 3.1 3.2 5.1
Xylenes (individual or mixed isomers) 130 1,000 180 400 410 600 430 2,200 1,300 1,300 2,200
Total volatile organic compounds 7,200 57,000 10,000 22,000 23,000 33,000 24,000 120,000 72,000 75,000 120,000
� Emissions to 2 significant figures
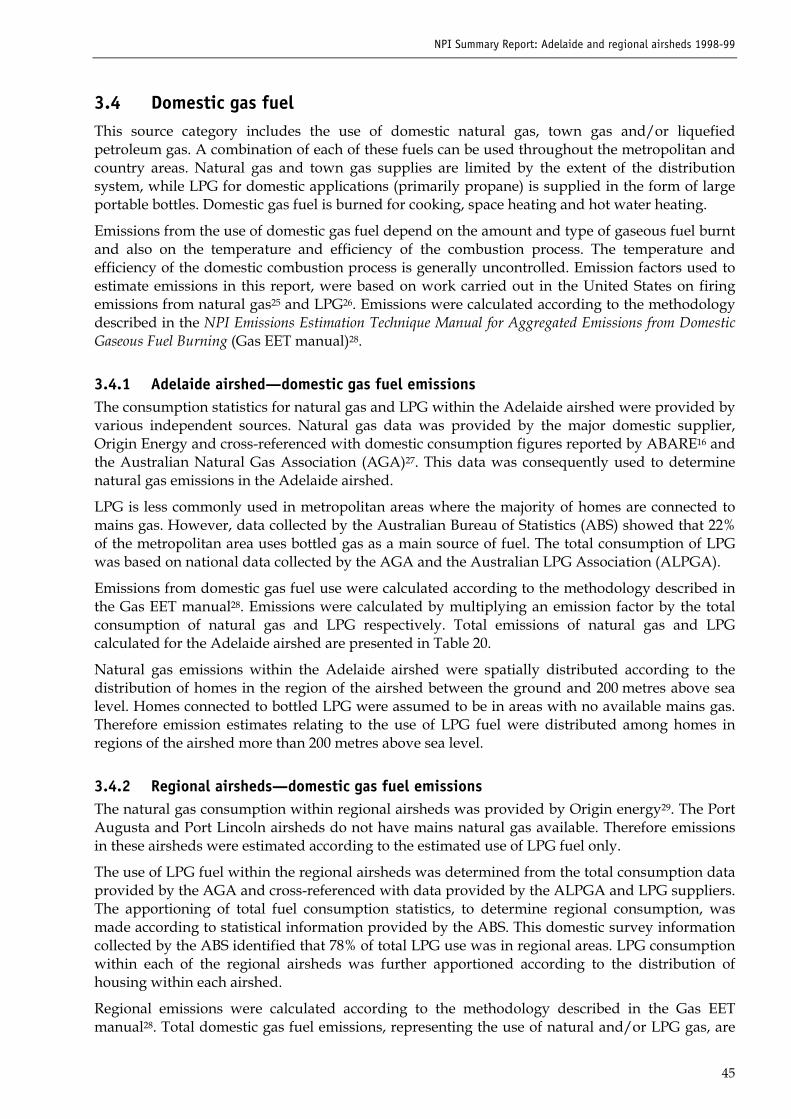
NPI Summary Report: Adelaide and regional airsheds 1998-99
45
3.4 Domestic gas fuelThis source category includes the use of domestic natural gas, town gas and/or liquefiedpetroleum gas. A combination of each of these fuels can be used throughout the metropolitan andcountry areas. Natural gas and town gas supplies are limited by the extent of the distributionsystem, while LPG for domestic applications (primarily propane) is supplied in the form of largeportable bottles. Domestic gas fuel is burned for cooking, space heating and hot water heating.
Emissions from the use of domestic gas fuel depend on the amount and type of gaseous fuel burntand also on the temperature and efficiency of the combustion process. The temperature andefficiency of the domestic combustion process is generally uncontrolled. Emission factors used toestimate emissions in this report, were based on work carried out in the United States on firingemissions from natural gas25 and LPG26. Emissions were calculated according to the methodologydescribed in the NPI Emissions Estimation Technique Manual for Aggregated Emissions from DomesticGaseous Fuel Burning (Gas EET manual)28.
3.4.1 Adelaide airshed�domestic gas fuel emissionsThe consumption statistics for natural gas and LPG within the Adelaide airshed were provided byvarious independent sources. Natural gas data was provided by the major domestic supplier,Origin Energy and cross-referenced with domestic consumption figures reported by ABARE16 andthe Australian Natural Gas Association (AGA)27. This data was consequently used to determinenatural gas emissions in the Adelaide airshed.
LPG is less commonly used in metropolitan areas where the majority of homes are connected tomains gas. However, data collected by the Australian Bureau of Statistics (ABS) showed that 22%of the metropolitan area uses bottled gas as a main source of fuel. The total consumption of LPGwas based on national data collected by the AGA and the Australian LPG Association (ALPGA).
Emissions from domestic gas fuel use were calculated according to the methodology described inthe Gas EET manual28. Emissions were calculated by multiplying an emission factor by the totalconsumption of natural gas and LPG respectively. Total emissions of natural gas and LPGcalculated for the Adelaide airshed are presented in Table 20.
Natural gas emissions within the Adelaide airshed were spatially distributed according to thedistribution of homes in the region of the airshed between the ground and 200 metres above sealevel. Homes connected to bottled LPG were assumed to be in areas with no available mains gas.Therefore emission estimates relating to the use of LPG fuel were distributed among homes inregions of the airshed more than 200 metres above sea level.
3.4.2 Regional airsheds�domestic gas fuel emissionsThe natural gas consumption within regional airsheds was provided by Origin energy29. The PortAugusta and Port Lincoln airsheds do not have mains natural gas available. Therefore emissionsin these airsheds were estimated according to the estimated use of LPG fuel only.
The use of LPG fuel within the regional airsheds was determined from the total consumption dataprovided by the AGA and cross-referenced with data provided by the ALPGA and LPG suppliers.The apportioning of total fuel consumption statistics, to determine regional consumption, wasmade according to statistical information provided by the ABS. This domestic survey informationcollected by the ABS identified that 78% of total LPG use was in regional areas. LPG consumptionwithin each of the regional airsheds was further apportioned according to the distribution ofhousing within each airshed.
Regional emissions were calculated according to the methodology described in the Gas EETmanual28. Total domestic gas fuel emissions, representing the use of natural and/or LPG gas, are
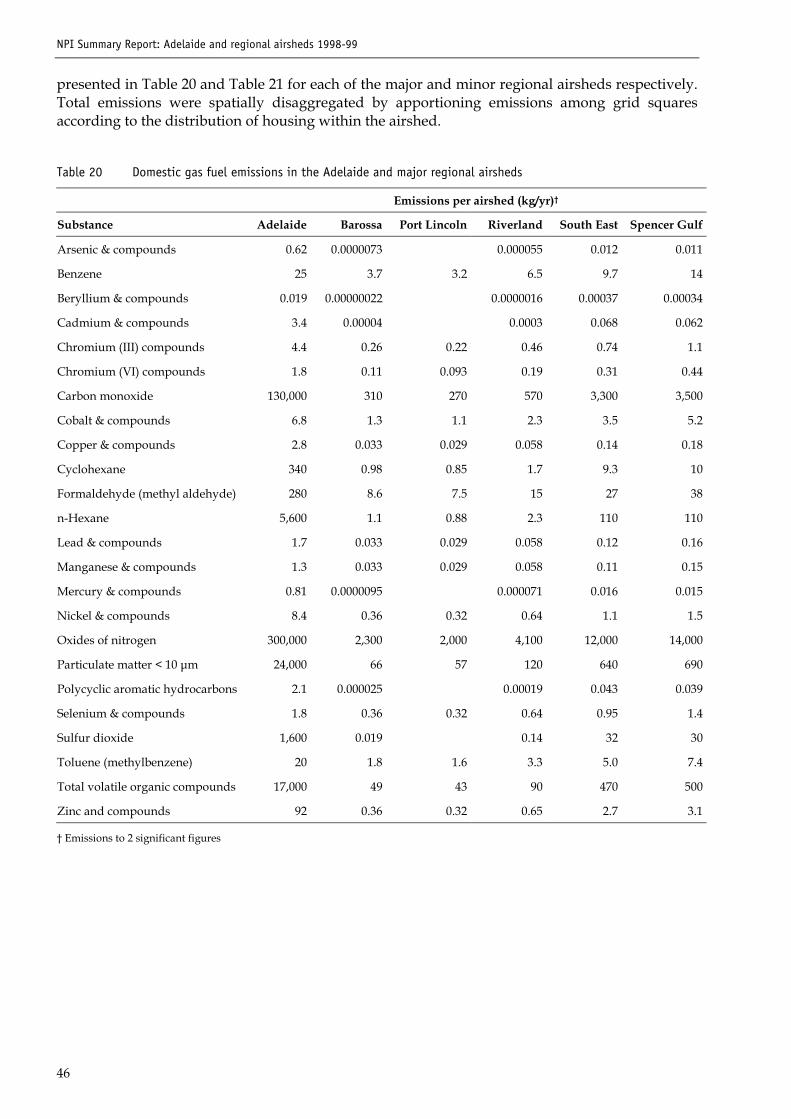
NPI Summary Report: Adelaide and regional airsheds 1998-99
46
presented in Table 20 and Table 21 for each of the major and minor regional airsheds respectively.Total emissions were spatially disaggregated by apportioning emissions among grid squaresaccording to the distribution of housing within the airshed.
Table 20 Domestic gas fuel emissions in the Adelaide and major regional airsheds
Emissions per airshed (kg/yr)�
Substance Adelaide Barossa Port Lincoln Riverland South East Spencer Gulf
Arsenic & compounds 0.62 0.0000073 0.000055 0.012 0.011
Benzene 25 3.7 3.2 6.5 9.7 14
Beryllium & compounds 0.019 0.00000022 0.0000016 0.00037 0.00034
Cadmium & compounds 3.4 0.00004 0.0003 0.068 0.062
Chromium (III) compounds 4.4 0.26 0.22 0.46 0.74 1.1
Chromium (VI) compounds 1.8 0.11 0.093 0.19 0.31 0.44
Carbon monoxide 130,000 310 270 570 3,300 3,500
Cobalt & compounds 6.8 1.3 1.1 2.3 3.5 5.2
Copper & compounds 2.8 0.033 0.029 0.058 0.14 0.18
Cyclohexane 340 0.98 0.85 1.7 9.3 10
Formaldehyde (methyl aldehyde) 280 8.6 7.5 15 27 38
n-Hexane 5,600 1.1 0.88 2.3 110 110
Lead & compounds 1.7 0.033 0.029 0.058 0.12 0.16
Manganese & compounds 1.3 0.033 0.029 0.058 0.11 0.15
Mercury & compounds 0.81 0.0000095 0.000071 0.016 0.015
Nickel & compounds 8.4 0.36 0.32 0.64 1.1 1.5
Oxides of nitrogen 300,000 2,300 2,000 4,100 12,000 14,000
Particulate matter < 10 µm 24,000 66 57 120 640 690
Polycyclic aromatic hydrocarbons 2.1 0.000025 0.00019 0.043 0.039
Selenium & compounds 1.8 0.36 0.32 0.64 0.95 1.4
Sulfur dioxide 1,600 0.019 0.14 32 30
Toluene (methylbenzene) 20 1.8 1.6 3.3 5.0 7.4
Total volatile organic compounds 17,000 49 43 90 470 500
Zinc and compounds 92 0.36 0.32 0.65 2.7 3.1
� Emissions to 2 significant figures
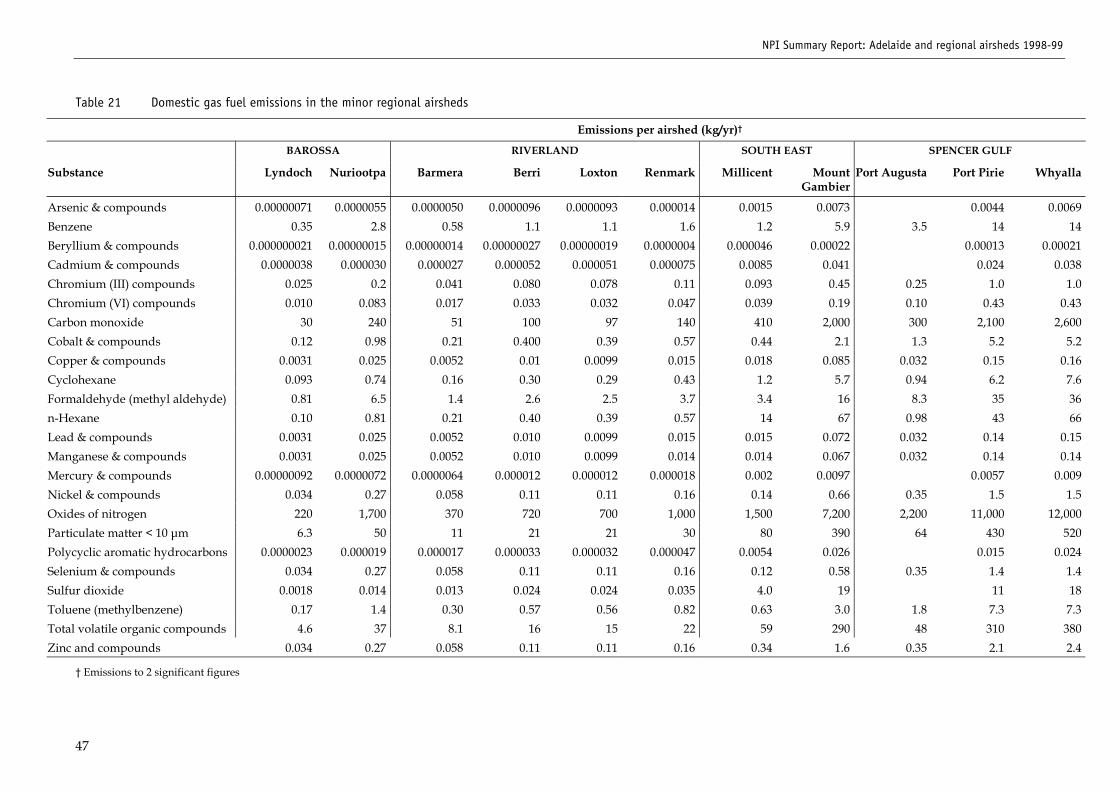
NPI Summary Report: Adelaide and regional airsheds 1998-99
47
Table 21 Domestic gas fuel emissions in the minor regional airsheds
Emissions per airshed (kg/yr)�
BAROSSA RIVERLAND SOUTH EAST SPENCER GULF
Substance Lyndoch Nuriootpa Barmera Berri Loxton Renmark Millicent MountGambier
Port Augusta Port Pirie Whyalla
Arsenic & compounds 0.00000071 0.0000055 0.0000050 0.0000096 0.0000093 0.000014 0.0015 0.0073 0.0044 0.0069Benzene 0.35 2.8 0.58 1.1 1.1 1.6 1.2 5.9 3.5 14 14Beryllium & compounds 0.000000021 0.00000015 0.00000014 0.00000027 0.00000019 0.0000004 0.000046 0.00022 0.00013 0.00021Cadmium & compounds 0.0000038 0.000030 0.000027 0.000052 0.000051 0.000075 0.0085 0.041 0.024 0.038Chromium (III) compounds 0.025 0.2 0.041 0.080 0.078 0.11 0.093 0.45 0.25 1.0 1.0Chromium (VI) compounds 0.010 0.083 0.017 0.033 0.032 0.047 0.039 0.19 0.10 0.43 0.43Carbon monoxide 30 240 51 100 97 140 410 2,000 300 2,100 2,600Cobalt & compounds 0.12 0.98 0.21 0.400 0.39 0.57 0.44 2.1 1.3 5.2 5.2Copper & compounds 0.0031 0.025 0.0052 0.01 0.0099 0.015 0.018 0.085 0.032 0.15 0.16Cyclohexane 0.093 0.74 0.16 0.30 0.29 0.43 1.2 5.7 0.94 6.2 7.6Formaldehyde (methyl aldehyde) 0.81 6.5 1.4 2.6 2.5 3.7 3.4 16 8.3 35 36n-Hexane 0.10 0.81 0.21 0.40 0.39 0.57 14 67 0.98 43 66Lead & compounds 0.0031 0.025 0.0052 0.010 0.0099 0.015 0.015 0.072 0.032 0.14 0.15Manganese & compounds 0.0031 0.025 0.0052 0.010 0.0099 0.014 0.014 0.067 0.032 0.14 0.14Mercury & compounds 0.00000092 0.0000072 0.0000064 0.000012 0.000012 0.000018 0.002 0.0097 0.0057 0.009Nickel & compounds 0.034 0.27 0.058 0.11 0.11 0.16 0.14 0.66 0.35 1.5 1.5Oxides of nitrogen 220 1,700 370 720 700 1,000 1,500 7,200 2,200 11,000 12,000Particulate matter < 10 µm 6.3 50 11 21 21 30 80 390 64 430 520Polycyclic aromatic hydrocarbons 0.0000023 0.000019 0.000017 0.000033 0.000032 0.000047 0.0054 0.026 0.015 0.024Selenium & compounds 0.034 0.27 0.058 0.11 0.11 0.16 0.12 0.58 0.35 1.4 1.4Sulfur dioxide 0.0018 0.014 0.013 0.024 0.024 0.035 4.0 19 11 18Toluene (methylbenzene) 0.17 1.4 0.30 0.57 0.56 0.82 0.63 3.0 1.8 7.3 7.3Total volatile organic compounds 4.6 37 8.1 16 15 22 59 290 48 310 380Zinc and compounds 0.034 0.27 0.058 0.11 0.11 0.16 0.34 1.6 0.35 2.1 2.4
� Emissions to 2 significant figures
NPI Summary Report: Adelaide and regional airsheds 1998-99
48
3.5 Dry cleaningDry cleaning emissions arise from the use of cleaning solvents, trichloroethylene�also known asperchloroethylene (perc)�and small amounts of white spirit. White spirit contains the chemicalsxylene and toluene. Tetrachloroethylene, xylene and toluene are individually considered as NPIsubstances and collectively as VOCs.
Volatile NPI substances are emitted during dry cleaning operations. Solvent is given off bywasher, drier, solvent still, cooker, still residue and filter cake storage areas, as well as by leakypipes, flanges and pumps. These emissions are found to vary depending on equipment type aswell as age. Most tetrachloroethylene machines are fitted with recovery plants to recycle solvent,increasing cost savings and worker safety. Emission control can also be improved by goodhousekeeping (maintaining all equipment and using good operating practices). White spiritmachines do not generally employ solvent recovery, because of the already low cost of thesepetroleum-based solvents as well as the fire hazards associated with collecting the vapours30.
Dry cleaning emissions of VOCs and individual NPI substances were calculated in accordancewith the methodology presented in the NPI Emissions Estimation Technique Manual for AggregatedEmissions from Dry Cleaning (Dry cleaning EET manual)30.
3.5.1 Adelaide airshed�dry cleaning emissionsThe activities associated with dry cleaning facilities were determined by conducting a survey ofthe industry and communicating with the industry president. The dry cleaning survey providedinformation on the number of active machines at each site, number of active sites, types ofmachines, solvent type used, volume of solvent and the number of employees. Over 33% of drycleaning facilities returned completed survey responses. Advice was also sought from the DryCleaning Association to determine the accuracy of the estimated number of machines atindividual sites31. The average volume of perc and white spirit used per machine was determinedfrom the returned survey responses.
Emissions from dry cleaning activities were calculated according to the dry cleaning EETmanual30, which employs a mass balance approach, assuming that all solvent used is eventuallyemitted to the air during the year, even if it is initially recycled or subjected to other processes.This approach required known volumes of solvent used per facility to be converted to a mass,based on the specific gravity of each solvent. Tetrachloroethylene and white spirits contributeentirely to the total VOCs listed in Table 22. White spirit also contains smaller amounts of the NPIsubstances toluene and xylene. Total emissions of each NPI substance emitted in the Adelaideairshed from dry cleaning activities are presented in Table 22. Spatial distribution of emissionswas made to grid squares according to the location of each dry cleaning facility within the airshed.
3.5.2 Regional airsheds�dry cleaning emissionsDry cleaning emissions were calculated according to the methodology outlined in Section 3.5.1 foreach of the regional airsheds with active dry cleaning facilities. Total emissions from dry cleaningactivities within the major regional airsheds are presented in Table 23. Minor regional airshedshave at least one dry cleaning facility. Lyndoch airshed was excluded from the data presented inTable 23 since no active facilities were identified.
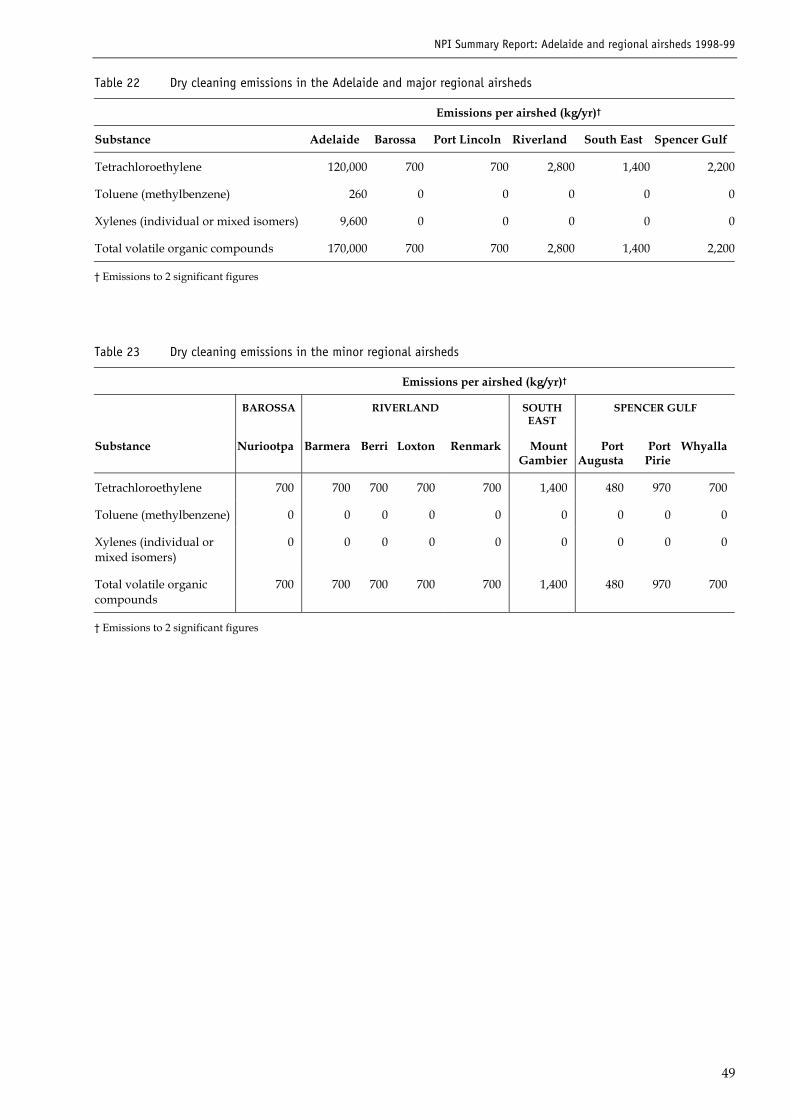
NPI Summary Report: Adelaide and regional airsheds 1998-99
49
Table 22 Dry cleaning emissions in the Adelaide and major regional airsheds
Emissions per airshed (kg/yr)�
Substance Adelaide Barossa Port Lincoln Riverland South East Spencer Gulf
Tetrachloroethylene 120,000 700 700 2,800 1,400 2,200
Toluene (methylbenzene) 260 0 0 0 0 0
Xylenes (individual or mixed isomers) 9,600 0 0 0 0 0
Total volatile organic compounds 170,000 700 700 2,800 1,400 2,200
� Emissions to 2 significant figures
Table 23 Dry cleaning emissions in the minor regional airsheds
Emissions per airshed (kg/yr)�
BAROSSA RIVERLAND SOUTHEAST
SPENCER GULF
Substance Nuriootpa Barmera Berri Loxton Renmark MountGambier
PortAugusta
PortPirie
Whyalla
Tetrachloroethylene 700 700 700 700 700 1,400 480 970 700
Toluene (methylbenzene) 0 0 0 0 0 0 0 0 0
Xylenes (individual ormixed isomers)
0 0 0 0 0 0 0 0 0
Total volatile organiccompounds
700 700 700 700 700 1,400 480 970 700
� Emissions to 2 significant figures
NPI Summary Report: Adelaide and regional airsheds 1998-99
50
3.6 Lawn mowingThis section considers domestic lawn mowing only. This includes mowing of the household lawnby individual residents or small contractors. Lawn mowing of parks, schools, and other openspaces is not included in these estimates.
Lawn mowing is considered to contribute a significant amount of VOCs, emitted as exhaust fumesfrom the mower�s engine. There are four types of lawn mowers used in Australia�2-strokeengined mowers, 4-stroke engined mowers, electric mowers and push mowers. Only the first twotypes emit pollutants to the atmosphere at the point of use32.
Four-stroke mowers have lower emissions of VOCs, carbon monoxide (CO) and particulate matterless than 10 µm (PM10) than two-stroke mowers, but have higher emissions of oxides of nitrogen(NOx). Fuel type (leaded or unleaded petrol) can also affect emissions, especially for lead andsulfur dioxide (SO2)32.
Emissions resulting from lawn mowing will vary depending on factors such as climate, land use,lot size, population demographics and the availability of water in more arid regions33. Themethodology to estimate emissions in the Adelaide and regional airsheds was in accordance withthe NPI Emissions Estimation Technique Manual for Aggregated Emissions from Domestic Lawn Mowing(Lawn mowing EET manual)32.
3.6.1 Adelaide airshed�lawn mowing emissionsDomestic lawn mowing emissions are known to vary by regions due to a variety of factors. Adomestic survey, completed by high school students, was used to determine the frequency,duration, lawn mower type and the volume of fuel used for lawn mowing per householdannually. These responses were compiled to estimate the average mowing time in hours perhousehold and the volume of fuel used per household for each mower type, 2-stroke or 4-stroke.
The results of the survey found that the use of 2-stroke mowers was greater than that of 4-stroke inall regions. In the Adelaide metropolitan area, over 57% of responses indicated using 2-strokemowers compared to 31% using 4-stroke. These survey responses were used to estimate the totalannual hours of operation of 2-stroke and 4-stroke mowers in the Adelaide airshed. The totalannual hours of mower usage were further divided into 2-stroke and 4-stroke, leaded andunleaded fuel respectively.
Emissions were calculated by multiplying the annual hours of operation of each mower type,using leaded or unleaded fuel, by lawn mower emission factors listed in the lawn mowing EETmanual32. Emission factors were derived from Australian testing data of 29 in-use mowers32. Thetotal emissions from domestic lawn mowing, calculated for the Adelaide airshed, are presented inTable 24. Total emissions were disaggregated among the airshed according to the number ofhomes within each one kilometre square grid.
3.6.2 Regional airsheds�lawn mowing emissionsLawn mowing emissions within the regional airsheds were calculated as in Section 3.6.1. Theactivity associated with domestic lawn mowing within the regional airsheds was considered to besignificantly different to those in the Adelaide area, especially since the average plot size andwater supply would be the major distinguishing factors. Therefore the total hours of operation ofeach lawn mower type were determined from domestic survey responses received from regionalareas only. The regional responses were further segregated into two categories�semi-arid andarid. Survey responses from the areas of Barossa, Riverland and South East were grouped togetherto estimate the total hours of mower operation in the semi-arid region. The arid region includedresponses from areas of Spencer Gulf as well as Port Lincoln. Responses from airshed regions
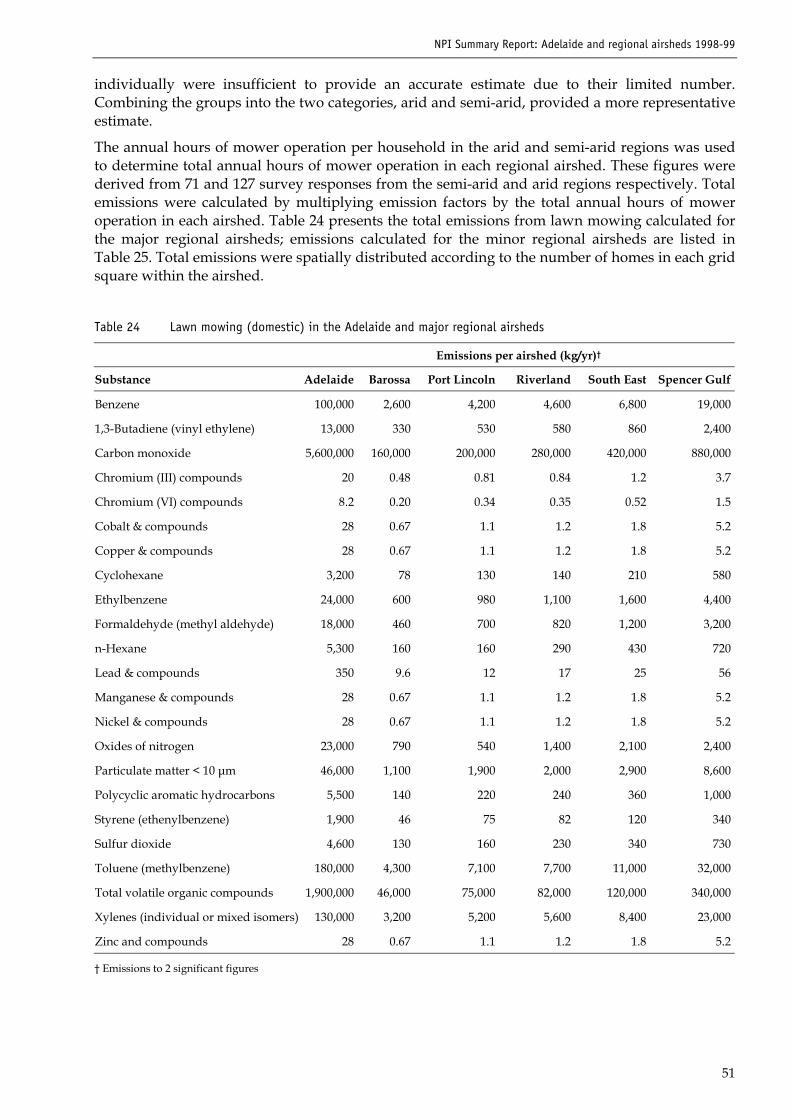
NPI Summary Report: Adelaide and regional airsheds 1998-99
51
individually were insufficient to provide an accurate estimate due to their limited number.Combining the groups into the two categories, arid and semi-arid, provided a more representativeestimate.
The annual hours of mower operation per household in the arid and semi-arid regions was usedto determine total annual hours of mower operation in each regional airshed. These figures werederived from 71 and 127 survey responses from the semi-arid and arid regions respectively. Totalemissions were calculated by multiplying emission factors by the total annual hours of moweroperation in each airshed. Table 24 presents the total emissions from lawn mowing calculated forthe major regional airsheds; emissions calculated for the minor regional airsheds are listed inTable 25. Total emissions were spatially distributed according to the number of homes in each gridsquare within the airshed.
Table 24 Lawn mowing (domestic) in the Adelaide and major regional airsheds
Emissions per airshed (kg/yr)�
Substance Adelaide Barossa Port Lincoln Riverland South East Spencer Gulf
Benzene 100,000 2,600 4,200 4,600 6,800 19,000
1,3-Butadiene (vinyl ethylene) 13,000 330 530 580 860 2,400
Carbon monoxide 5,600,000 160,000 200,000 280,000 420,000 880,000
Chromium (III) compounds 20 0.48 0.81 0.84 1.2 3.7
Chromium (VI) compounds 8.2 0.20 0.34 0.35 0.52 1.5
Cobalt & compounds 28 0.67 1.1 1.2 1.8 5.2
Copper & compounds 28 0.67 1.1 1.2 1.8 5.2
Cyclohexane 3,200 78 130 140 210 580
Ethylbenzene 24,000 600 980 1,100 1,600 4,400
Formaldehyde (methyl aldehyde) 18,000 460 700 820 1,200 3,200
n-Hexane 5,300 160 160 290 430 720
Lead & compounds 350 9.6 12 17 25 56
Manganese & compounds 28 0.67 1.1 1.2 1.8 5.2
Nickel & compounds 28 0.67 1.1 1.2 1.8 5.2
Oxides of nitrogen 23,000 790 540 1,400 2,100 2,400
Particulate matter < 10 µm 46,000 1,100 1,900 2,000 2,900 8,600
Polycyclic aromatic hydrocarbons 5,500 140 220 240 360 1,000
Styrene (ethenylbenzene) 1,900 46 75 82 120 340
Sulfur dioxide 4,600 130 160 230 340 730
Toluene (methylbenzene) 180,000 4,300 7,100 7,700 11,000 32,000
Total volatile organic compounds 1,900,000 46,000 75,000 82,000 120,000 340,000
Xylenes (individual or mixed isomers) 130,000 3,200 5,200 5,600 8,400 23,000
Zinc and compounds 28 0.67 1.1 1.2 1.8 5.2
� Emissions to 2 significant figures
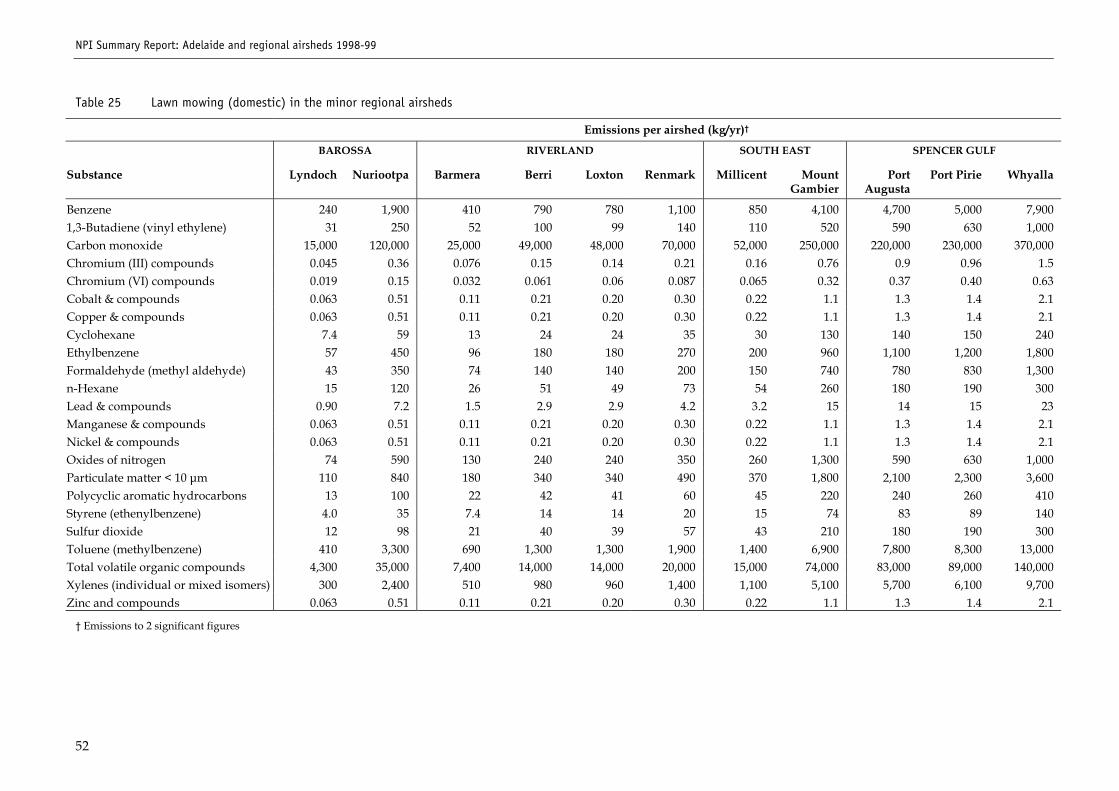
NPI Summary Report: Adelaide and regional airsheds 1998-99
52
Table 25 Lawn mowing (domestic) in the minor regional airsheds
Emissions per airshed (kg/yr)�
BAROSSA RIVERLAND SOUTH EAST SPENCER GULF
Substance Lyndoch Nuriootpa Barmera Berri Loxton Renmark Millicent MountGambier
PortAugusta
Port Pirie Whyalla
Benzene 240 1,900 410 790 780 1,100 850 4,100 4,700 5,000 7,9001,3-Butadiene (vinyl ethylene) 31 250 52 100 99 140 110 520 590 630 1,000Carbon monoxide 15,000 120,000 25,000 49,000 48,000 70,000 52,000 250,000 220,000 230,000 370,000Chromium (III) compounds 0.045 0.36 0.076 0.15 0.14 0.21 0.16 0.76 0.9 0.96 1.5Chromium (VI) compounds 0.019 0.15 0.032 0.061 0.06 0.087 0.065 0.32 0.37 0.40 0.63Cobalt & compounds 0.063 0.51 0.11 0.21 0.20 0.30 0.22 1.1 1.3 1.4 2.1Copper & compounds 0.063 0.51 0.11 0.21 0.20 0.30 0.22 1.1 1.3 1.4 2.1Cyclohexane 7.4 59 13 24 24 35 30 130 140 150 240Ethylbenzene 57 450 96 180 180 270 200 960 1,100 1,200 1,800Formaldehyde (methyl aldehyde) 43 350 74 140 140 200 150 740 780 830 1,300n-Hexane 15 120 26 51 49 73 54 260 180 190 300Lead & compounds 0.90 7.2 1.5 2.9 2.9 4.2 3.2 15 14 15 23Manganese & compounds 0.063 0.51 0.11 0.21 0.20 0.30 0.22 1.1 1.3 1.4 2.1Nickel & compounds 0.063 0.51 0.11 0.21 0.20 0.30 0.22 1.1 1.3 1.4 2.1Oxides of nitrogen 74 590 130 240 240 350 260 1,300 590 630 1,000Particulate matter < 10 µm 110 840 180 340 340 490 370 1,800 2,100 2,300 3,600Polycyclic aromatic hydrocarbons 13 100 22 42 41 60 45 220 240 260 410Styrene (ethenylbenzene) 4.0 35 7.4 14 14 20 15 74 83 89 140Sulfur dioxide 12 98 21 40 39 57 43 210 180 190 300Toluene (methylbenzene) 410 3,300 690 1,300 1,300 1,900 1,400 6,900 7,800 8,300 13,000Total volatile organic compounds 4,300 35,000 7,400 14,000 14,000 20,000 15,000 74,000 83,000 89,000 140,000Xylenes (individual or mixed isomers) 300 2,400 510 980 960 1,400 1,100 5,100 5,700 6,100 9,700Zinc and compounds 0.063 0.51 0.11 0.21 0.20 0.30 0.22 1.1 1.3 1.4 2.1
� Emissions to 2 significant figures
NPI Summary Report: Adelaide and regional airsheds 1998-99
53
3.7 Motor vehicle refinishingMotor vehicle refinishing applies to all paint applications subsequent to those applied by theoriginal manufacturer. Hence emissions result from the use of paints and solvents by spraypainters, crash repairers and panel beaters. Primers, topcoats and hardeners used for motorvehicle refinishing contain solvents containing VOCs as well as other NPI identified substances.This source category does not include emissions from motor vehicle manufacturing plants as theseare considered to exceed the NPI threshold and are required to provide their own emissionestimates.
Most work of motor refinishing is carried out within garages and workshops. However, VOCs areemitted during the application of coatings, the drying phase and from the cleaning of equipmentsuch as spray guns. Chemical reactions may also cause emissions to occur during the refinishing,drying, curing and hardening phases. Particle emissions were considered comparatively small inrelation to other emissions since most are generally confined to the workshop or booth. Booths areoften fitted with water curtain scrubbers or filter pads that remove most of the particulate matter,therefore particulate emissions were not estimated for this source. However, these filteringtechniques are of little benefit in removing VOC emissions.
3.7.1 Adelaide airshed�motor vehicle refinishing emissionsEmissions from motor vehicle refinishing were estimated according to the methodology describedin the NPI Emissions Estimation Technique Manual for Aggregated Emissions from Motor VehicleRefinishing (Refinishing EET manual)34. The technique for estimating emissions is based on a massbalance approach, which assumes that all solvent purchased in a year is used in that year and thatall VOCs in the coating formulation evaporate and are emitted to the atmosphere. Thismethodology requires that the total consumption and composition of automotive surface coatingswithin each of the airsheds be known.
The consumption of automotive paints for motor vehicle refinishing was estimated from dataprovided by the APMF, which compiled a national Automotive Refinishing Sales survey toestimate the consumption and surface coating types over a quarterly period during 1997�98. Thetotal consumption of automotive refinishing paints in the Adelaide airshed was then determinedby apportioning from the national total to the airshed according to its population. The totalvolume of paint used in the Adelaide airshed was estimated as 839,000 L.
The emissions of each NPI substance were calculated by multiplying the volume of each painttype consumed by the corresponding emission factors listed in the EET manual. Table 26 presentsthe total emissions from motor vehicle refinishing facilities within the Adelaide airshed. Theseemissions were spatially distributed among the airshed according to the average volume of paintused by each motor refinishing facility, 523 of which were identified using telephone directorylistings. Facilities were allocated to grid squares within the Adelaide airshed.
A survey of the motor refinishing facilities within the Adelaide airshed revealed the volume andtype of automotive paints used among 12% of the facilities. The survey identified averageconsumption of automotive refinishing paints and solvents at 1609 L per facility, which correlatedwell with the average figure of 1604.5 L per facility calculated from the APMF data. The averagevolume determined from the APMF data was used to apportion the airshed�s emissions amongmotor refinishing facilities, except for facilities with reported consumption volumes of automotivepaints and solvents; these were allocated emissions according to that data.
3.7.2 Regional airshed�motor vehicle refinishing emissionsEmissions for the regional airsheds were calculated according to the methodology in the EETmanual34 and outlined in Section 3.7.1 above. In brief, national automotive refinishing paint
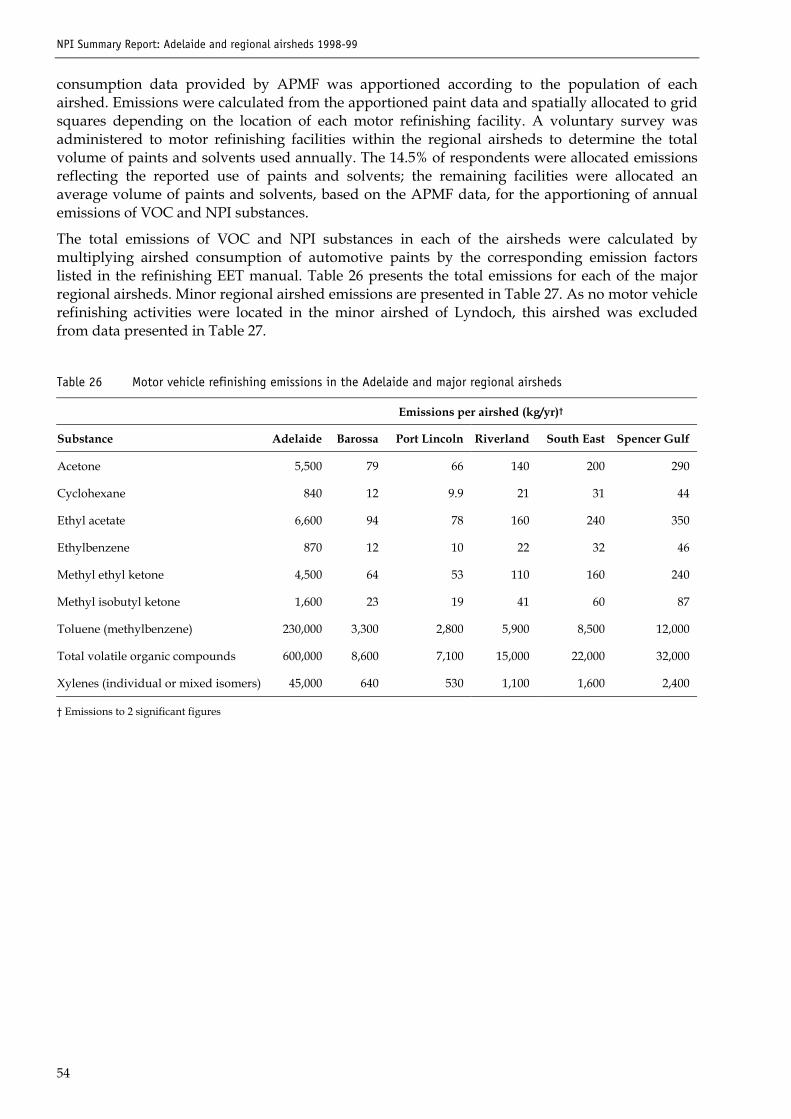
NPI Summary Report: Adelaide and regional airsheds 1998-99
54
consumption data provided by APMF was apportioned according to the population of eachairshed. Emissions were calculated from the apportioned paint data and spatially allocated to gridsquares depending on the location of each motor refinishing facility. A voluntary survey wasadministered to motor refinishing facilities within the regional airsheds to determine the totalvolume of paints and solvents used annually. The 14.5% of respondents were allocated emissionsreflecting the reported use of paints and solvents; the remaining facilities were allocated anaverage volume of paints and solvents, based on the APMF data, for the apportioning of annualemissions of VOC and NPI substances.
The total emissions of VOC and NPI substances in each of the airsheds were calculated bymultiplying airshed consumption of automotive paints by the corresponding emission factorslisted in the refinishing EET manual. Table 26 presents the total emissions for each of the majorregional airsheds. Minor regional airshed emissions are presented in Table 27. As no motor vehiclerefinishing activities were located in the minor airshed of Lyndoch, this airshed was excludedfrom data presented in Table 27.
Table 26 Motor vehicle refinishing emissions in the Adelaide and major regional airsheds
Emissions per airshed (kg/yr)�
Substance Adelaide Barossa Port Lincoln Riverland South East Spencer Gulf
Acetone 5,500 79 66 140 200 290
Cyclohexane 840 12 9.9 21 31 44
Ethyl acetate 6,600 94 78 160 240 350
Ethylbenzene 870 12 10 22 32 46
Methyl ethyl ketone 4,500 64 53 110 160 240
Methyl isobutyl ketone 1,600 23 19 41 60 87
Toluene (methylbenzene) 230,000 3,300 2,800 5,900 8,500 12,000
Total volatile organic compounds 600,000 8,600 7,100 15,000 22,000 32,000
Xylenes (individual or mixed isomers) 45,000 640 530 1,100 1,600 2,400
� Emissions to 2 significant figures
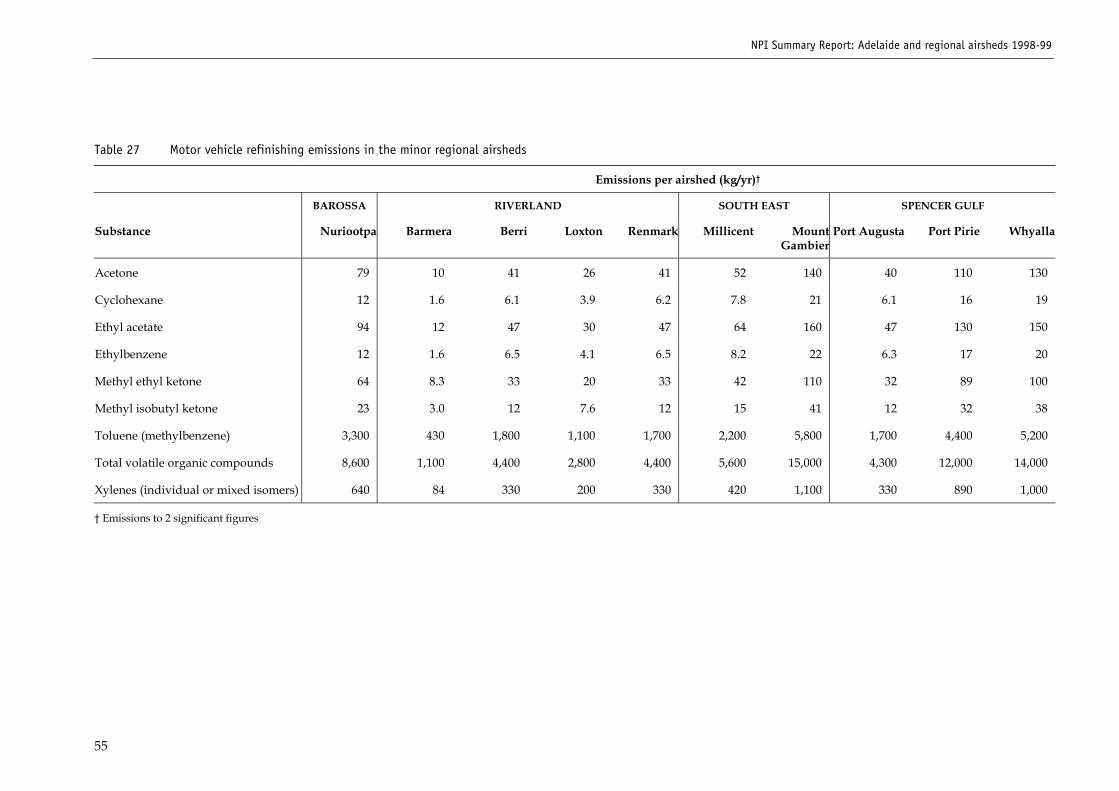
NPI Summary Report: Adelaide and regional airsheds 1998-99
55
Table 27 Motor vehicle refinishing emissions in the minor regional airsheds
Emissions per airshed (kg/yr)�
BAROSSA RIVERLAND SOUTH EAST SPENCER GULF
Substance Nuriootpa Barmera Berri Loxton Renmark Millicent MountGambier
Port Augusta Port Pirie Whyalla
Acetone 79 10 41 26 41 52 140 40 110 130
Cyclohexane 12 1.6 6.1 3.9 6.2 7.8 21 6.1 16 19
Ethyl acetate 94 12 47 30 47 64 160 47 130 150
Ethylbenzene 12 1.6 6.5 4.1 6.5 8.2 22 6.3 17 20
Methyl ethyl ketone 64 8.3 33 20 33 42 110 32 89 100
Methyl isobutyl ketone 23 3.0 12 7.6 12 15 41 12 32 38
Toluene (methylbenzene) 3,300 430 1,800 1,100 1,700 2,200 5,800 1,700 4,400 5,200
Total volatile organic compounds 8,600 1,100 4,400 2,800 4,400 5,600 15,000 4,300 12,000 14,000
Xylenes (individual or mixed isomers) 640 84 330 200 330 420 1,100 330 890 1,000
� Emissions to 2 significant figures
NPI Summary Report: Adelaide and regional airsheds 1998-99
56
3.8 Paved roadsPaved and unpaved roads are considered a major source of atmospheric particulate matter withinan airshed35 due to the suspension or resuspension of loose material on the road surface. The highuncertainty associated with the sparseness of emission factors and activity data for unpaved roadsmeans that even small errors in the estimation technique may have a relatively large impact on theoverall particulate emissions inventory36. Unpaved roads are generally present within regionalairsheds, where road traffic information is often limited. Due to the relatively large uncertaintiesin estimating particulate emissions and following discussions with other jurisdictions at theAggregate Air Emission Workshop in Tasmania37, estimation of unpaved road emissions wasexcluded from this source category.
The source category of paved roads includes all public road surfaces that have a covering ofbitumen or pavers to help reduce base road surface dust. However, when a vehicle travels over apaved road it generates emission of dust and particulate matter by suspension or resuspension ofloose material on the road�s surface. This material is introduced onto the roads from a variety ofactivities such as dust fall, litter, erosion from adjacent areas and spillage.
Particulate emissions from paved roads are continually moved and removed; however, due to thesize of the particulates, deposition processes lead to a constant supply of loose material.Additionally, particulate matter also arises from exhaust and other emissions directly associatedwith motor vehicles, but these are included in the total annual emissions from motor vehicles,covered in Section 2.2.
Emissions from paved road surfaces presented in this section were calculated according to therecommended methodology outlined in the NPI Emissions Estimation Technique Manual forAggregated Emissions from Paved and Unpaved Roads (Roads EET manual)36.
3.8.1 Adelaide airshed�paved road emissionsPaved road emissions within the Adelaide airshed were calculated according to the methodologydescribed in the Roads EET manual36. In brief, emissions were calculated by multiplying empiricalfactors for particle size by the road surface silt loading, the average vehicle weight, and the VKT.The VKT data used in these calculations was derived for estimating motor vehicle emissions inSection 2.2. The average vehicle weight was calculated by averaging the product of averagevehicle weight by the VKT fraction for all vehicle classes. The silt loading applied to all pavedroads within the Adelaide airshed was based on normal conditions and assuming average dailytraffic to be at least 5000 vehicles per day.
Table 28 presents the total annual load of particulate matter and NPI substances from paved roadsin the Adelaide airshed. The spatial allocation of emissions was made by apportioning emissionsaccording to the VKTs per grid square within the airshed.
3.8.2 Regional airsheds�paved road emissionsRegional emissions from paved roads were calculated according to the methodology described inthe EET manual36 and detailed in Section 3.8.1. VKT data for each regional airshed was calculatedfrom locally available data or estimated on the basis of road category, as described in regionalmotor vehicle emissions, Section 2.2.2. Emissions were calculated based on the average weight ofvehicles, as determined for the Adelaide airshed, and the silt loading for normal conditions basedon high or low average daily traffic, depending on the location. The Barossa and Port Lincolnairsheds were assumed to have average daily traffic of less than 5000 vehicles per day, while theRiverland, South East and Spencer Gulf were assumed to have a high daily traffic (greater than5000 vehicles per day).
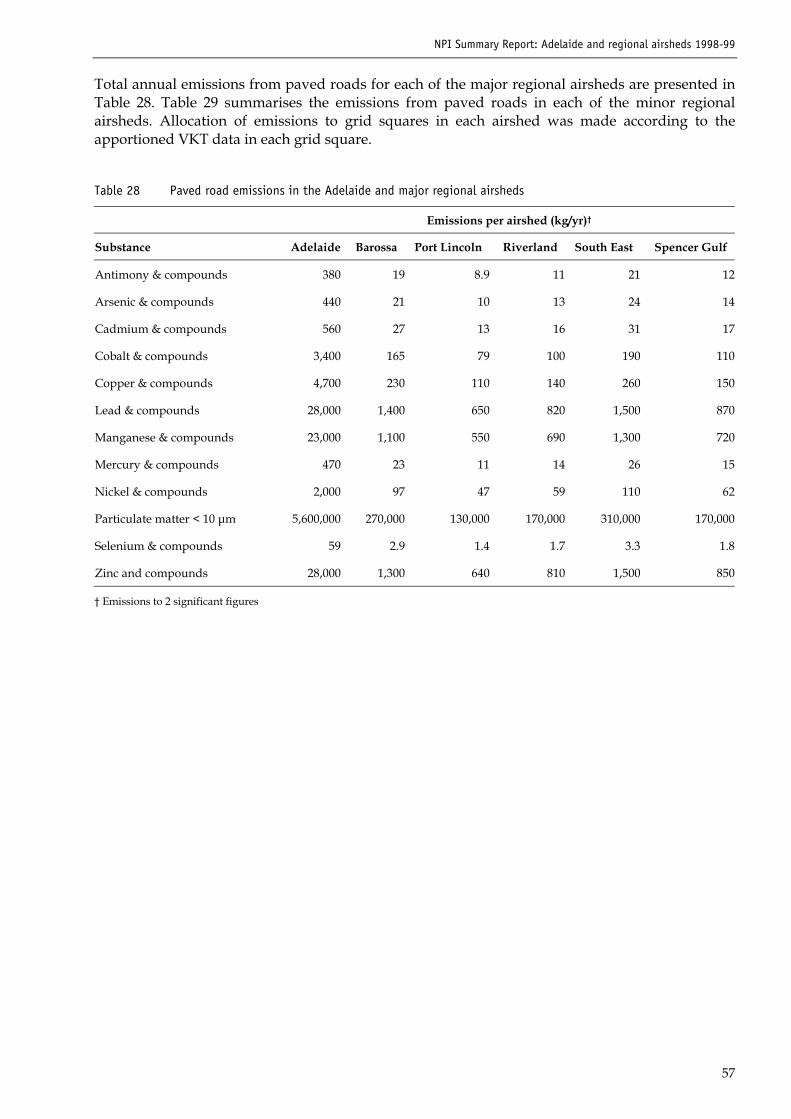
NPI Summary Report: Adelaide and regional airsheds 1998-99
57
Total annual emissions from paved roads for each of the major regional airsheds are presented inTable 28. Table 29 summarises the emissions from paved roads in each of the minor regionalairsheds. Allocation of emissions to grid squares in each airshed was made according to theapportioned VKT data in each grid square.
Table 28 Paved road emissions in the Adelaide and major regional airsheds
Emissions per airshed (kg/yr)�
Substance Adelaide Barossa Port Lincoln Riverland South East Spencer Gulf
Antimony & compounds 380 19 8.9 11 21 12
Arsenic & compounds 440 21 10 13 24 14
Cadmium & compounds 560 27 13 16 31 17
Cobalt & compounds 3,400 165 79 100 190 110
Copper & compounds 4,700 230 110 140 260 150
Lead & compounds 28,000 1,400 650 820 1,500 870
Manganese & compounds 23,000 1,100 550 690 1,300 720
Mercury & compounds 470 23 11 14 26 15
Nickel & compounds 2,000 97 47 59 110 62
Particulate matter < 10 µm 5,600,000 270,000 130,000 170,000 310,000 170,000
Selenium & compounds 59 2.9 1.4 1.7 3.3 1.8
Zinc and compounds 28,000 1,300 640 810 1,500 850
� Emissions to 2 significant figures
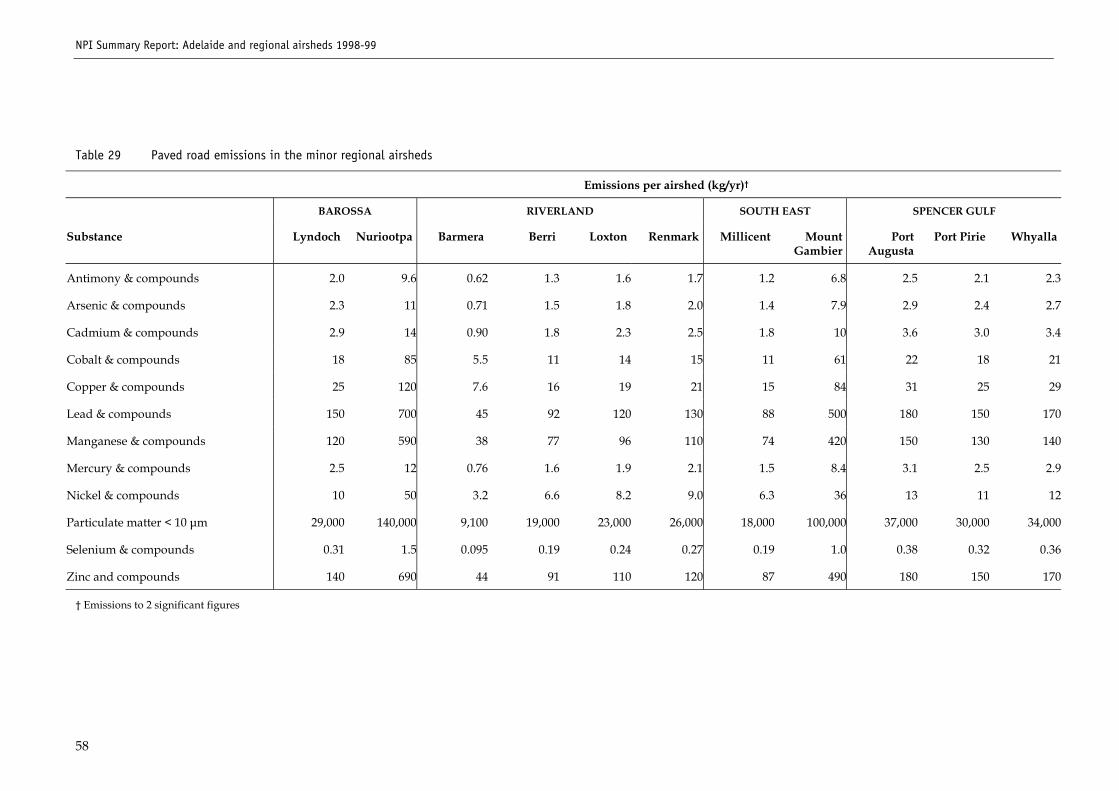
NPI Summary Report: Adelaide and regional airsheds 1998-99
58
Table 29 Paved road emissions in the minor regional airsheds
Emissions per airshed (kg/yr)�
BAROSSA RIVERLAND SOUTH EAST SPENCER GULF
Substance Lyndoch Nuriootpa Barmera Berri Loxton Renmark Millicent MountGambier
PortAugusta
Port Pirie Whyalla
Antimony & compounds 2.0 9.6 0.62 1.3 1.6 1.7 1.2 6.8 2.5 2.1 2.3
Arsenic & compounds 2.3 11 0.71 1.5 1.8 2.0 1.4 7.9 2.9 2.4 2.7
Cadmium & compounds 2.9 14 0.90 1.8 2.3 2.5 1.8 10 3.6 3.0 3.4
Cobalt & compounds 18 85 5.5 11 14 15 11 61 22 18 21
Copper & compounds 25 120 7.6 16 19 21 15 84 31 25 29
Lead & compounds 150 700 45 92 120 130 88 500 180 150 170
Manganese & compounds 120 590 38 77 96 110 74 420 150 130 140
Mercury & compounds 2.5 12 0.76 1.6 1.9 2.1 1.5 8.4 3.1 2.5 2.9
Nickel & compounds 10 50 3.2 6.6 8.2 9.0 6.3 36 13 11 12
Particulate matter < 10 µm 29,000 140,000 9,100 19,000 23,000 26,000 18,000 100,000 37,000 30,000 34,000
Selenium & compounds 0.31 1.5 0.095 0.19 0.24 0.27 0.19 1.0 0.38 0.32 0.36
Zinc and compounds 140 690 44 91 110 120 87 490 180 150 170
� Emissions to 2 significant figures
NPI Summary Report: Adelaide and regional airsheds 1998-99
59
3.9 Printing and graphic artsThe predominant emissions from the printing and graphic arts industry are VOCs contained in theprinting inks, fountain and cleaning solutions. Emissions from the printing industry can alsooriginate from presses, cleaning operations, ink mixing operations and ink storage tanks.However, emissions from storage tanks were not estimated in the studied airsheds.
The term printing includes five basic operations of the printing industry�gravure, offsetlithographic, letterpress, flexographic and screen-printing. In the Adelaide airshed the use ofgravure and flexographic printing is limited to one and three sites respectively. Offset lithographicand screen-printing were identified as the predominant techniques employed throughout theAdelaide and regional airsheds.
The composition of inks used for each of the printing processes determines the quantity of VOCsand other NPI substances that are emitted. Unfortunately, there is a serious lack of reliablespeciation data for the other NPI substances from either local or overseas data38. Therefore untilmore comprehensive and accurate data becomes available emissions estimated in this study reflecttotal VOCs only.
3.9.1 Adelaide airshed�printing and graphic arts emissionsPrinting and graphic arts emissions within the Adelaide airshed were calculated according to theemployee-based emission factor approach as described in the NPI Emissions Estimation TechniqueManual for Aggregated Emissions from Printing and Graphic Arts (Printing EET manual)38. Theemployee-based emission factor was derived locally through a survey of the printing industry thatdetermined local consumption of inks, solvents and cleaning solutions. The survey requiredparticipants to indicate the type of process carried out at their facility and describe the solventsused annually. Some survey responses (14%) provided quantities of solvents and inks usedtogether with material safety data sheets as to the composition of these. This information gave thebasis for calculating an employee-based emission factor for the printing industry. The employee-based emission factor included the two main printing processes, offset lithographic and screen-printing, which use a range of solvents and inks high in VOCs but also include the use of UVcured inks, which are considerably lower in VOC emissions.
The employee-based emission factor was based on detailed responses from six facilities, threeoffset lithographic and three screen printers, representing only 6% of the total industry. Othersurvey responses were not included in this calculation because they were limited or incomplete.The facilities using lithographic printing were all of relatively the same size with a mean andstandard deviation of 75�3 employees. Screen-printing facilities were significantly smaller thanthe lithographic facilities, with 1, 3 and 21 employees respectively. The average emission factor peremployee for printing and graphic arts emissions was determined as 193 kg/yr.
The employee-based emission factor derived from local data was found to be 14% higher than thedefault employee-based emission factor quoted in the Printing EET manual (169 kg/yr)38.However, in view of the fact that the default factor was derived from survey information in south-east Queensland and also subject to similar limitations, it may not be the best representation of theSouth Australian printing industry. Therefore the locally derived employee-based emission factorwill be used until more information becomes available.
The employee-based emission factor, together with the average number of printing and graphicarts employees per facility, was used to estimate total airshed emissions. Employee numbers wereprovided by the ABS for the printing industry during the 1998�99 year. Employee data, togetherwith the number of facilities located within the Adelaide metropolitan area, was used todetermine the average number of employees per facility as 9.5 employees. All printing andgraphic arts facilities were geo-coded to grid squares within the Adelaide airshed, then emissions
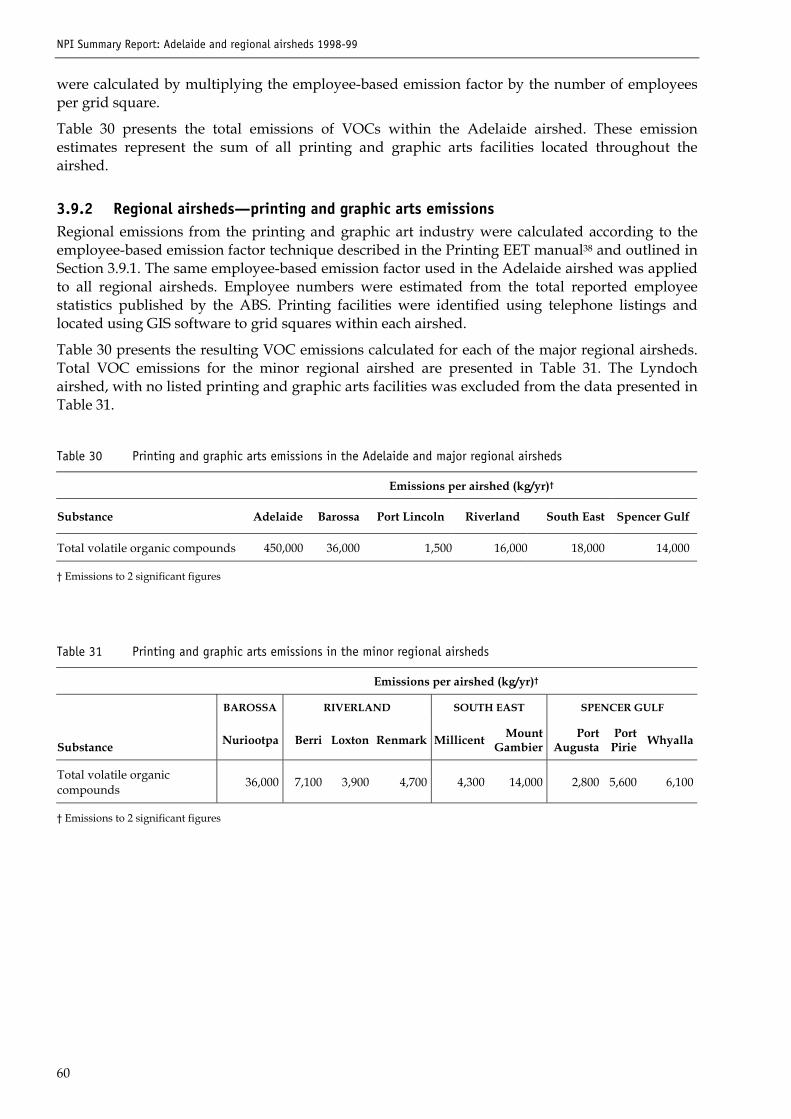
NPI Summary Report: Adelaide and regional airsheds 1998-99
60
were calculated by multiplying the employee-based emission factor by the number of employeesper grid square.
Table 30 presents the total emissions of VOCs within the Adelaide airshed. These emissionestimates represent the sum of all printing and graphic arts facilities located throughout theairshed.
3.9.2 Regional airsheds�printing and graphic arts emissionsRegional emissions from the printing and graphic art industry were calculated according to theemployee-based emission factor technique described in the Printing EET manual38 and outlined inSection 3.9.1. The same employee-based emission factor used in the Adelaide airshed was appliedto all regional airsheds. Employee numbers were estimated from the total reported employeestatistics published by the ABS. Printing facilities were identified using telephone listings andlocated using GIS software to grid squares within each airshed.
Table 30 presents the resulting VOC emissions calculated for each of the major regional airsheds.Total VOC emissions for the minor regional airshed are presented in Table 31. The Lyndochairshed, with no listed printing and graphic arts facilities was excluded from the data presented inTable 31.
Table 30 Printing and graphic arts emissions in the Adelaide and major regional airsheds
Emissions per airshed (kg/yr)�
Substance Adelaide Barossa Port Lincoln Riverland South East Spencer Gulf
Total volatile organic compounds 450,000 36,000 1,500 16,000 18,000 14,000
� Emissions to 2 significant figures
Table 31 Printing and graphic arts emissions in the minor regional airsheds
Emissions per airshed (kg/yr)�
BAROSSA RIVERLAND SOUTH EAST SPENCER GULF
Substance Nuriootpa Berri Loxton Renmark Millicent MountGambier
PortAugusta
PortPirie Whyalla
Total volatile organiccompounds 36,000 7,100 3,900 4,700 4,300 14,000 2,800 5,600 6,100
� Emissions to 2 significant figures
NPI Summary Report: Adelaide and regional airsheds 1998-99
61
3.10 Service stationsService stations are the main suppliers of petrol and related products to road vehicles. Thesepetroleum products contain a mixture of VOCs, including hydrocarbons, oxygenates andhalocarbons. Air emissions are generated during the unloading of petrol from tankers tounderground storage tanks, by underground storage tank breathing losses and during vehiclerefuelling.
The air emissions of various NPI substances were estimated according to the best practicetechnique described in the NPI Emissions Estimation Technique Manual for Aggregated Emissions fromService Stations (Service station EET manual)39. These emission estimates reflect fuel sales, fuelcomposition, fuel handling practices, and vapour control methods employed.
3.10.1 Adelaide airshed�service station emissionsPetrol consumption within the Adelaide airshed was estimated from the 1998�99 nationalpetroleum sales figures supplied by the Australian Institute of Petroleum (AIP)40. These figuresprovided an estimate of leaded, unleaded, premium unleaded, diesel and LPG fuels soldthroughout Australia. South Australia�s consumption and the consumption of petrol fuels in eachairshed were determined by apportioning the national consumption figures, based on population,for each fuel type.
Air emissions of total VOCs from each fuel type were determined using emission factors in theService station EET manual39 and the volume of each fuel sold within the airshed. VOC emissionswere calculated for all evaporative emissions associated with fuel delivery. Tank refuelling wasinitially assumed as 100% submerged without vapour recovery. Vapour recovery is a processwhereby vapours are returned to the refuelling tanker rather than vented to air. Within theAdelaide airshed, vapour recovery facilities are available at newer service stations and used whereavailable to speed up the process of refuelling. However, since a vapour recovery unit has not yetbeen installed in South Australia40, vapours are consequently vented from the tanker to theatmosphere at the tanker depot. Only 30�40% of Mobil-operated service stations use a submerged-with-vapour-recovery filling technique, and venting emissions at the terminal have been includedin point source industry emissions calculated by Mobil. Therefore a combination of fillingtechniques, submerged and submerged-with-vapour-recovery, were included in the current fuelVOC emission estimates. For diesel and LPG fuels, the total throughput was multiplied by thecorresponding emission factor in the service station EET manual39, which accounts for thedifferent filling and venting methods.
The composition of NPI substances in each fuel type was sourced through communications withthe major local supplier Mobil41 and the AIP. Local compositions of petrol were preferred overnational data, since petrol products do vary between jurisdictions due to the requirements toregulate volatility to compensate for climate variations39. However, local data for all substanceswas limited and was supplemented by national data. These composition data were provided as aweight fraction of the total VOC emissions of each fuel.
The liquid and vapour composition of petrol fuels was determined in the first instance from thelocal data provided by Mobil. Some fuel compositions were sourced from AIP, which provided anaverage of all fuel types used nationally. Vapour compositions of styrene and lead compoundswere calculated according to Equation 2 in the Service station EET manual from liquidcomposition data. The speciation of cyclohexane was determined in a previous study42. Thesecompositions were used to determine the amount of each NPI substance in the total volume of fuelused within each airshed.
The total air emissions of each NPI substance were then divided by the total apportioned airshedpetrol sales to provide a throughput emission factor for each substance in kg/yr/kL. This enabled
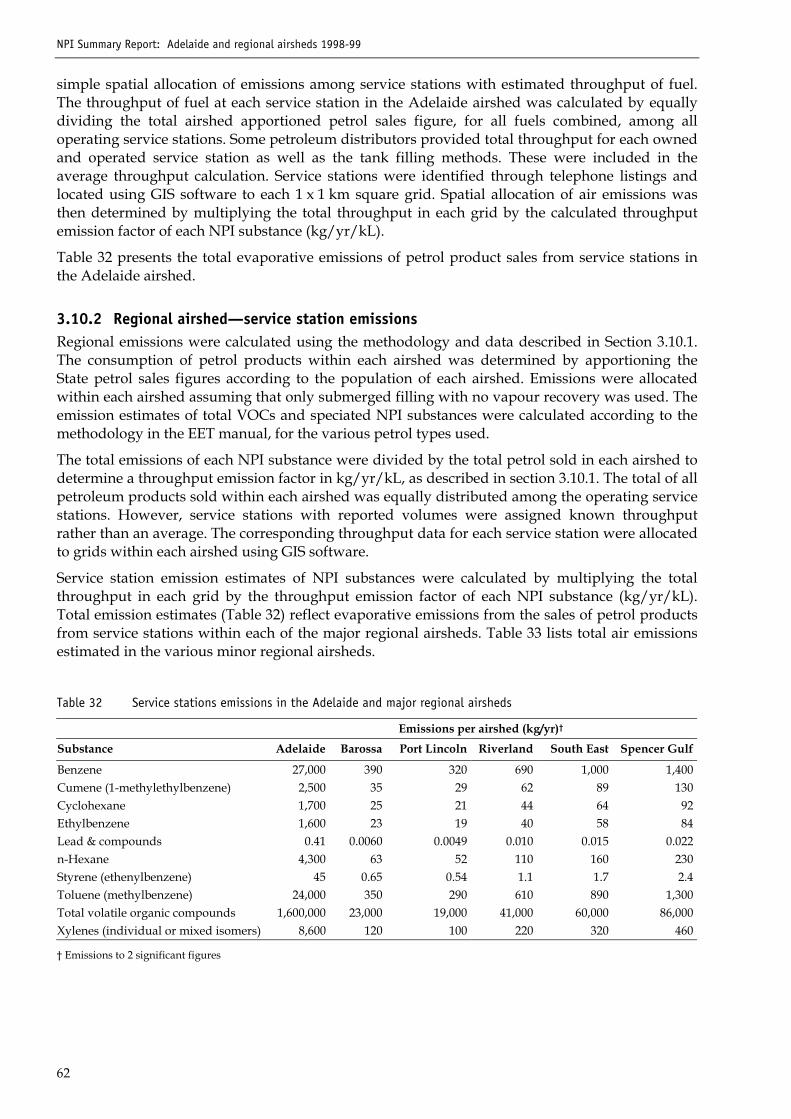
NPI Summary Report: Adelaide and regional airsheds 1998-99
62
simple spatial allocation of emissions among service stations with estimated throughput of fuel.The throughput of fuel at each service station in the Adelaide airshed was calculated by equallydividing the total airshed apportioned petrol sales figure, for all fuels combined, among alloperating service stations. Some petroleum distributors provided total throughput for each ownedand operated service station as well as the tank filling methods. These were included in theaverage throughput calculation. Service stations were identified through telephone listings andlocated using GIS software to each 1 x 1 km square grid. Spatial allocation of air emissions wasthen determined by multiplying the total throughput in each grid by the calculated throughputemission factor of each NPI substance (kg/yr/kL).
Table 32 presents the total evaporative emissions of petrol product sales from service stations inthe Adelaide airshed.
3.10.2 Regional airshed�service station emissionsRegional emissions were calculated using the methodology and data described in Section 3.10.1.The consumption of petrol products within each airshed was determined by apportioning theState petrol sales figures according to the population of each airshed. Emissions were allocatedwithin each airshed assuming that only submerged filling with no vapour recovery was used. Theemission estimates of total VOCs and speciated NPI substances were calculated according to themethodology in the EET manual, for the various petrol types used.
The total emissions of each NPI substance were divided by the total petrol sold in each airshed todetermine a throughput emission factor in kg/yr/kL, as described in section 3.10.1. The total of allpetroleum products sold within each airshed was equally distributed among the operating servicestations. However, service stations with reported volumes were assigned known throughputrather than an average. The corresponding throughput data for each service station were allocatedto grids within each airshed using GIS software.
Service station emission estimates of NPI substances were calculated by multiplying the totalthroughput in each grid by the throughput emission factor of each NPI substance (kg/yr/kL).Total emission estimates (Table 32) reflect evaporative emissions from the sales of petrol productsfrom service stations within each of the major regional airsheds. Table 33 lists total air emissionsestimated in the various minor regional airsheds.
Table 32 Service stations emissions in the Adelaide and major regional airsheds
Emissions per airshed (kg/yr)�
Substance Adelaide Barossa Port Lincoln Riverland South East Spencer Gulf
Benzene 27,000 390 320 690 1,000 1,400Cumene (1-methylethylbenzene) 2,500 35 29 62 89 130Cyclohexane 1,700 25 21 44 64 92Ethylbenzene 1,600 23 19 40 58 84Lead & compounds 0.41 0.0060 0.0049 0.010 0.015 0.022n-Hexane 4,300 63 52 110 160 230Styrene (ethenylbenzene) 45 0.65 0.54 1.1 1.7 2.4Toluene (methylbenzene) 24,000 350 290 610 890 1,300Total volatile organic compounds 1,600,000 23,000 19,000 41,000 60,000 86,000Xylenes (individual or mixed isomers) 8,600 120 100 220 320 460
� Emissions to 2 significant figures
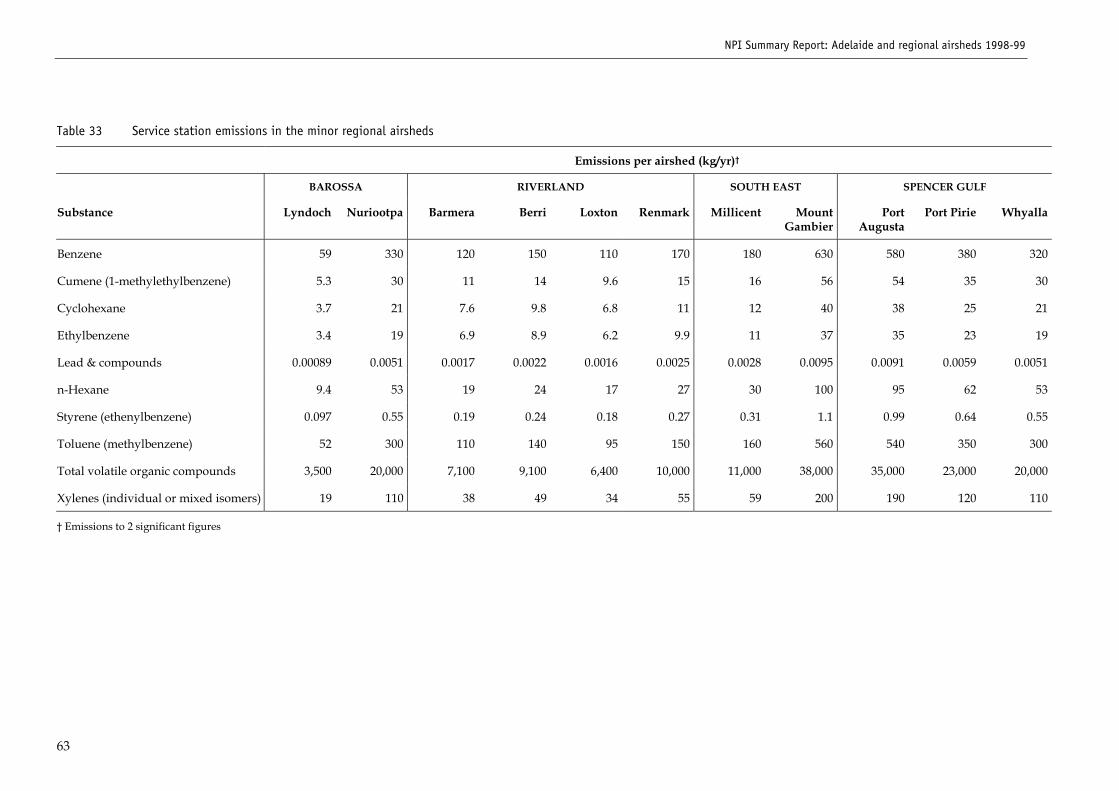
NPI Summary Report: Adelaide and regional airsheds 1998-99
63
Table 33 Service station emissions in the minor regional airsheds
Emissions per airshed (kg/yr)�
BAROSSA RIVERLAND SOUTH EAST SPENCER GULF
Substance Lyndoch Nuriootpa Barmera Berri Loxton Renmark Millicent MountGambier
PortAugusta
Port Pirie Whyalla
Benzene 59 330 120 150 110 170 180 630 580 380 320
Cumene (1-methylethylbenzene) 5.3 30 11 14 9.6 15 16 56 54 35 30
Cyclohexane 3.7 21 7.6 9.8 6.8 11 12 40 38 25 21
Ethylbenzene 3.4 19 6.9 8.9 6.2 9.9 11 37 35 23 19
Lead & compounds 0.00089 0.0051 0.0017 0.0022 0.0016 0.0025 0.0028 0.0095 0.0091 0.0059 0.0051
n-Hexane 9.4 53 19 24 17 27 30 100 95 62 53
Styrene (ethenylbenzene) 0.097 0.55 0.19 0.24 0.18 0.27 0.31 1.1 0.99 0.64 0.55
Toluene (methylbenzene) 52 300 110 140 95 150 160 560 540 350 300
Total volatile organic compounds 3,500 20,000 7,100 9,100 6,400 10,000 11,000 38,000 35,000 23,000 20,000
Xylenes (individual or mixed isomers) 19 110 38 49 34 55 59 200 190 120 110
� Emissions to 2 significant figures
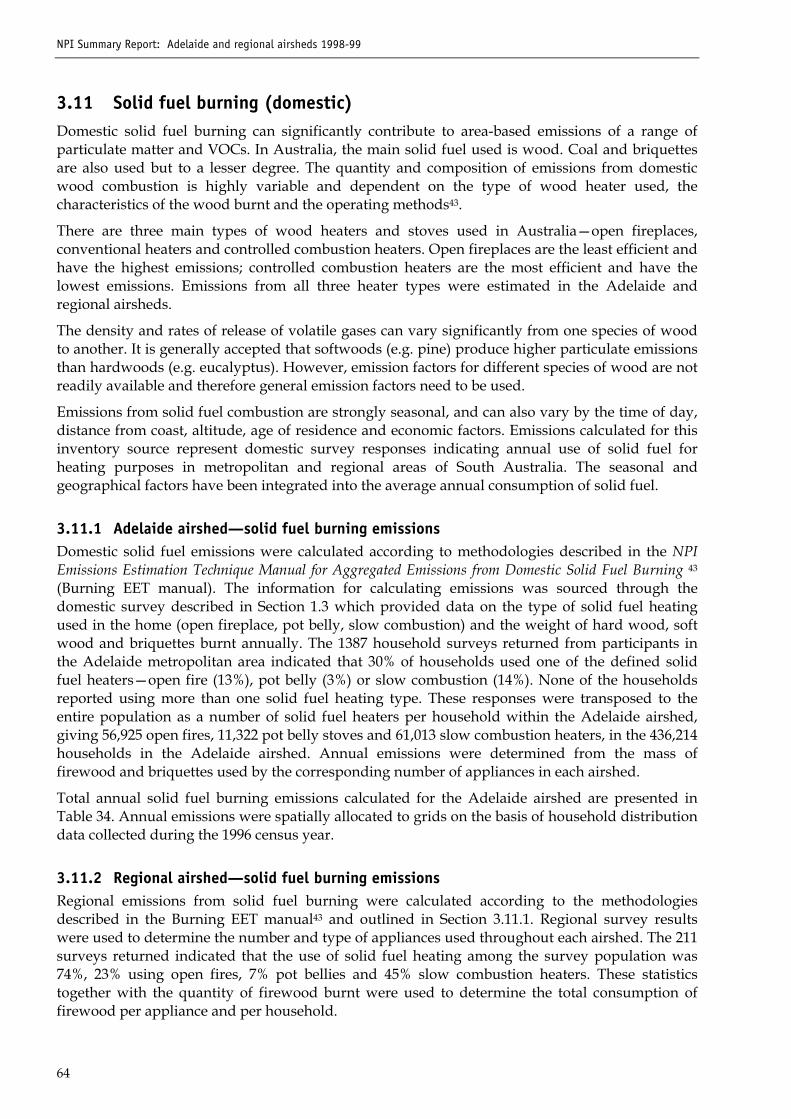
NPI Summary Report: Adelaide and regional airsheds 1998-99
64
3.11 Solid fuel burning (domestic)Domestic solid fuel burning can significantly contribute to area-based emissions of a range ofparticulate matter and VOCs. In Australia, the main solid fuel used is wood. Coal and briquettesare also used but to a lesser degree. The quantity and composition of emissions from domesticwood combustion is highly variable and dependent on the type of wood heater used, thecharacteristics of the wood burnt and the operating methods43.
There are three main types of wood heaters and stoves used in Australia�open fireplaces,conventional heaters and controlled combustion heaters. Open fireplaces are the least efficient andhave the highest emissions; controlled combustion heaters are the most efficient and have thelowest emissions. Emissions from all three heater types were estimated in the Adelaide andregional airsheds.
The density and rates of release of volatile gases can vary significantly from one species of woodto another. It is generally accepted that softwoods (e.g. pine) produce higher particulate emissionsthan hardwoods (e.g. eucalyptus). However, emission factors for different species of wood are notreadily available and therefore general emission factors need to be used.
Emissions from solid fuel combustion are strongly seasonal, and can also vary by the time of day,distance from coast, altitude, age of residence and economic factors. Emissions calculated for thisinventory source represent domestic survey responses indicating annual use of solid fuel forheating purposes in metropolitan and regional areas of South Australia. The seasonal andgeographical factors have been integrated into the average annual consumption of solid fuel.
3.11.1 Adelaide airshed�solid fuel burning emissionsDomestic solid fuel emissions were calculated according to methodologies described in the NPIEmissions Estimation Technique Manual for Aggregated Emissions from Domestic Solid Fuel Burning 43
(Burning EET manual). The information for calculating emissions was sourced through thedomestic survey described in Section 1.3 which provided data on the type of solid fuel heatingused in the home (open fireplace, pot belly, slow combustion) and the weight of hard wood, softwood and briquettes burnt annually. The 1387 household surveys returned from participants inthe Adelaide metropolitan area indicated that 30% of households used one of the defined solidfuel heaters�open fire (13%), pot belly (3%) or slow combustion (14%). None of the householdsreported using more than one solid fuel heating type. These responses were transposed to theentire population as a number of solid fuel heaters per household within the Adelaide airshed,giving 56,925 open fires, 11,322 pot belly stoves and 61,013 slow combustion heaters, in the 436,214households in the Adelaide airshed. Annual emissions were determined from the mass offirewood and briquettes used by the corresponding number of appliances in each airshed.
Total annual solid fuel burning emissions calculated for the Adelaide airshed are presented inTable 34. Annual emissions were spatially allocated to grids on the basis of household distributiondata collected during the 1996 census year.
3.11.2 Regional airshed�solid fuel burning emissionsRegional emissions from solid fuel burning were calculated according to the methodologiesdescribed in the Burning EET manual43 and outlined in Section 3.11.1. Regional survey resultswere used to determine the number and type of appliances used throughout each airshed. The 211surveys returned indicated that the use of solid fuel heating among the survey population was74%, 23% using open fires, 7% pot bellies and 45% slow combustion heaters. These statisticstogether with the quantity of firewood burnt were used to determine the total consumption offirewood per appliance and per household.
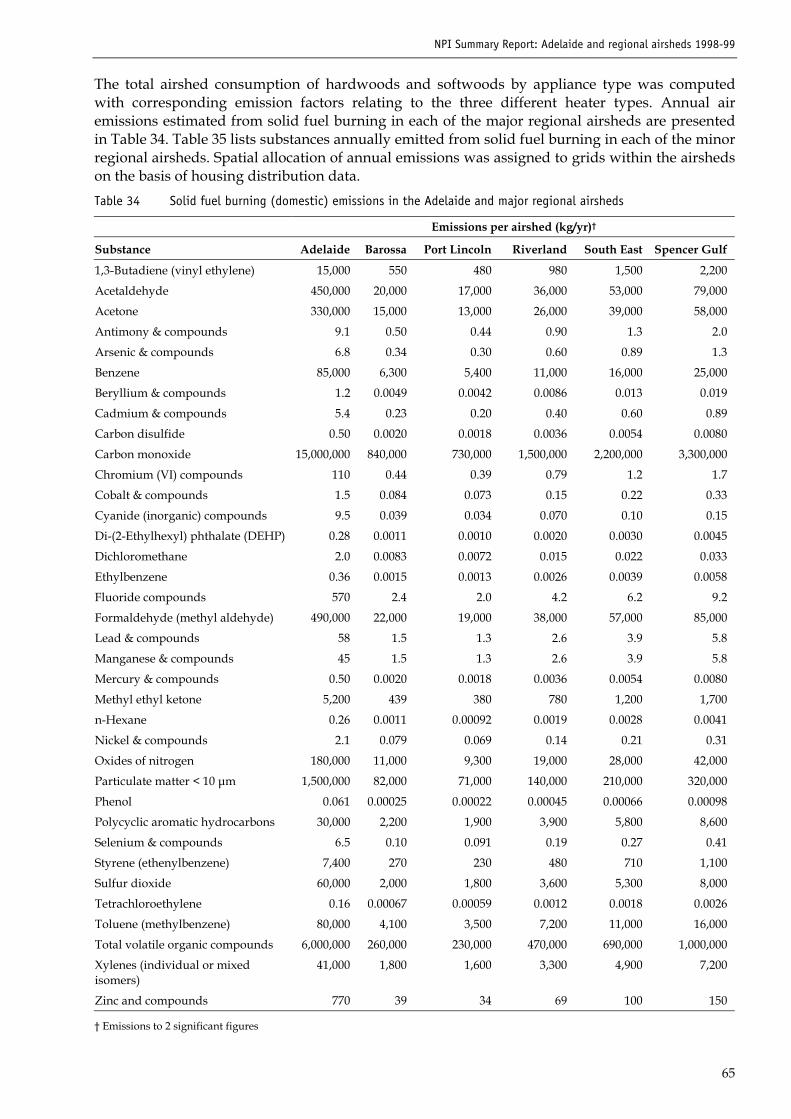
NPI Summary Report: Adelaide and regional airsheds 1998-99
65
The total airshed consumption of hardwoods and softwoods by appliance type was computedwith corresponding emission factors relating to the three different heater types. Annual airemissions estimated from solid fuel burning in each of the major regional airsheds are presentedin Table 34. Table 35 lists substances annually emitted from solid fuel burning in each of the minorregional airsheds. Spatial allocation of annual emissions was assigned to grids within the airshedson the basis of housing distribution data.Table 34 Solid fuel burning (domestic) emissions in the Adelaide and major regional airsheds
Emissions per airshed (kg/yr)�
Substance Adelaide Barossa Port Lincoln Riverland South East Spencer Gulf
1,3-Butadiene (vinyl ethylene) 15,000 550 480 980 1,500 2,200
Acetaldehyde 450,000 20,000 17,000 36,000 53,000 79,000
Acetone 330,000 15,000 13,000 26,000 39,000 58,000
Antimony & compounds 9.1 0.50 0.44 0.90 1.3 2.0
Arsenic & compounds 6.8 0.34 0.30 0.60 0.89 1.3
Benzene 85,000 6,300 5,400 11,000 16,000 25,000
Beryllium & compounds 1.2 0.0049 0.0042 0.0086 0.013 0.019
Cadmium & compounds 5.4 0.23 0.20 0.40 0.60 0.89
Carbon disulfide 0.50 0.0020 0.0018 0.0036 0.0054 0.0080
Carbon monoxide 15,000,000 840,000 730,000 1,500,000 2,200,000 3,300,000
Chromium (VI) compounds 110 0.44 0.39 0.79 1.2 1.7
Cobalt & compounds 1.5 0.084 0.073 0.15 0.22 0.33
Cyanide (inorganic) compounds 9.5 0.039 0.034 0.070 0.10 0.15
Di-(2-Ethylhexyl) phthalate (DEHP) 0.28 0.0011 0.0010 0.0020 0.0030 0.0045
Dichloromethane 2.0 0.0083 0.0072 0.015 0.022 0.033
Ethylbenzene 0.36 0.0015 0.0013 0.0026 0.0039 0.0058
Fluoride compounds 570 2.4 2.0 4.2 6.2 9.2
Formaldehyde (methyl aldehyde) 490,000 22,000 19,000 38,000 57,000 85,000
Lead & compounds 58 1.5 1.3 2.6 3.9 5.8
Manganese & compounds 45 1.5 1.3 2.6 3.9 5.8
Mercury & compounds 0.50 0.0020 0.0018 0.0036 0.0054 0.0080
Methyl ethyl ketone 5,200 439 380 780 1,200 1,700
n-Hexane 0.26 0.0011 0.00092 0.0019 0.0028 0.0041
Nickel & compounds 2.1 0.079 0.069 0.14 0.21 0.31
Oxides of nitrogen 180,000 11,000 9,300 19,000 28,000 42,000
Particulate matter < 10 µm 1,500,000 82,000 71,000 140,000 210,000 320,000
Phenol 0.061 0.00025 0.00022 0.00045 0.00066 0.00098
Polycyclic aromatic hydrocarbons 30,000 2,200 1,900 3,900 5,800 8,600
Selenium & compounds 6.5 0.10 0.091 0.19 0.27 0.41
Styrene (ethenylbenzene) 7,400 270 230 480 710 1,100
Sulfur dioxide 60,000 2,000 1,800 3,600 5,300 8,000
Tetrachloroethylene 0.16 0.00067 0.00059 0.0012 0.0018 0.0026
Toluene (methylbenzene) 80,000 4,100 3,500 7,200 11,000 16,000
Total volatile organic compounds 6,000,000 260,000 230,000 470,000 690,000 1,000,000
Xylenes (individual or mixedisomers)
41,000 1,800 1,600 3,300 4,900 7,200
Zinc and compounds 770 39 34 69 100 150
� Emissions to 2 significant figures
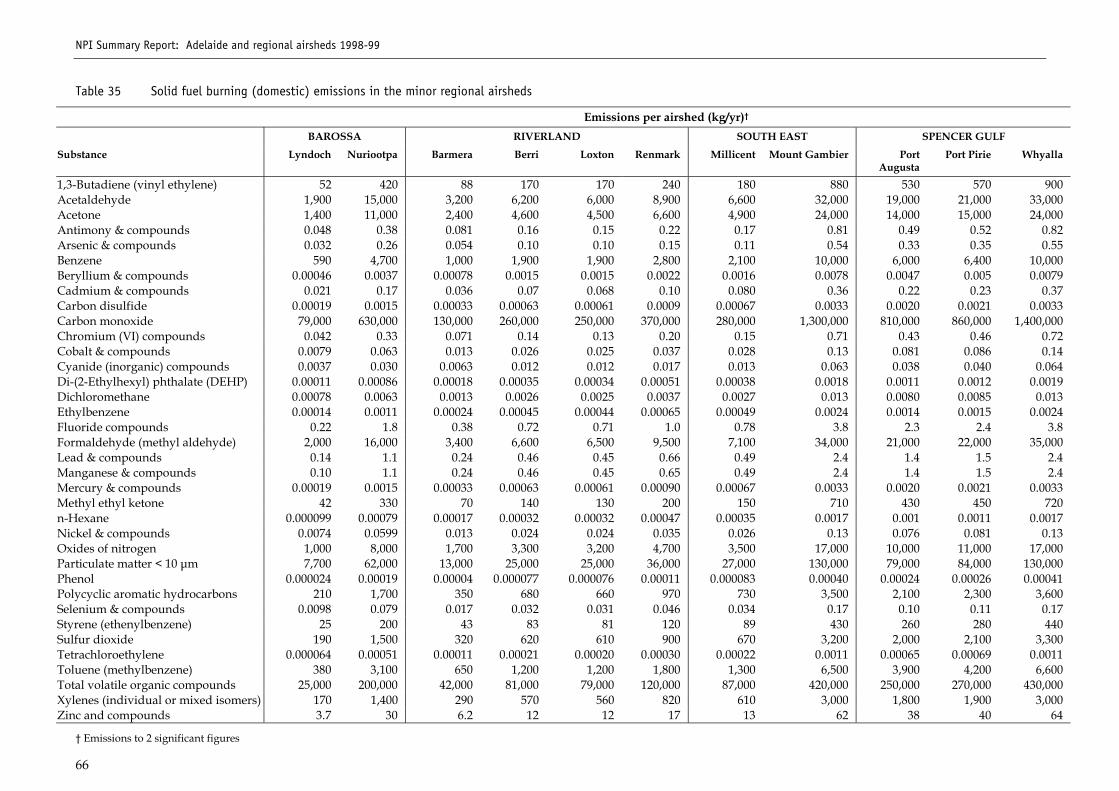
NPI Summary Report: Adelaide and regional airsheds 1998-99
66
Table 35 Solid fuel burning (domestic) emissions in the minor regional airsheds
Emissions per airshed (kg/yr)�
BAROSSA RIVERLAND SOUTH EAST SPENCER GULFSubstance Lyndoch Nuriootpa Barmera Berri Loxton Renmark Millicent Mount Gambier Port
AugustaPort Pirie Whyalla
1,3-Butadiene (vinyl ethylene) 52 420 88 170 170 240 180 880 530 570 900Acetaldehyde 1,900 15,000 3,200 6,200 6,000 8,900 6,600 32,000 19,000 21,000 33,000Acetone 1,400 11,000 2,400 4,600 4,500 6,600 4,900 24,000 14,000 15,000 24,000Antimony & compounds 0.048 0.38 0.081 0.16 0.15 0.22 0.17 0.81 0.49 0.52 0.82Arsenic & compounds 0.032 0.26 0.054 0.10 0.10 0.15 0.11 0.54 0.33 0.35 0.55Benzene 590 4,700 1,000 1,900 1,900 2,800 2,100 10,000 6,000 6,400 10,000Beryllium & compounds 0.00046 0.0037 0.00078 0.0015 0.0015 0.0022 0.0016 0.0078 0.0047 0.005 0.0079Cadmium & compounds 0.021 0.17 0.036 0.07 0.068 0.10 0.080 0.36 0.22 0.23 0.37Carbon disulfide 0.00019 0.0015 0.00033 0.00063 0.00061 0.0009 0.00067 0.0033 0.0020 0.0021 0.0033Carbon monoxide 79,000 630,000 130,000 260,000 250,000 370,000 280,000 1,300,000 810,000 860,000 1,400,000Chromium (VI) compounds 0.042 0.33 0.071 0.14 0.13 0.20 0.15 0.71 0.43 0.46 0.72Cobalt & compounds 0.0079 0.063 0.013 0.026 0.025 0.037 0.028 0.13 0.081 0.086 0.14Cyanide (inorganic) compounds 0.0037 0.030 0.0063 0.012 0.012 0.017 0.013 0.063 0.038 0.040 0.064Di-(2-Ethylhexyl) phthalate (DEHP) 0.00011 0.00086 0.00018 0.00035 0.00034 0.00051 0.00038 0.0018 0.0011 0.0012 0.0019Dichloromethane 0.00078 0.0063 0.0013 0.0026 0.0025 0.0037 0.0027 0.013 0.0080 0.0085 0.013Ethylbenzene 0.00014 0.0011 0.00024 0.00045 0.00044 0.00065 0.00049 0.0024 0.0014 0.0015 0.0024Fluoride compounds 0.22 1.8 0.38 0.72 0.71 1.0 0.78 3.8 2.3 2.4 3.8Formaldehyde (methyl aldehyde) 2,000 16,000 3,400 6,600 6,500 9,500 7,100 34,000 21,000 22,000 35,000Lead & compounds 0.14 1.1 0.24 0.46 0.45 0.66 0.49 2.4 1.4 1.5 2.4Manganese & compounds 0.10 1.1 0.24 0.46 0.45 0.65 0.49 2.4 1.4 1.5 2.4Mercury & compounds 0.00019 0.0015 0.00033 0.00063 0.00061 0.00090 0.00067 0.0033 0.0020 0.0021 0.0033Methyl ethyl ketone 42 330 70 140 130 200 150 710 430 450 720n-Hexane 0.000099 0.00079 0.00017 0.00032 0.00032 0.00047 0.00035 0.0017 0.001 0.0011 0.0017Nickel & compounds 0.0074 0.0599 0.013 0.024 0.024 0.035 0.026 0.13 0.076 0.081 0.13Oxides of nitrogen 1,000 8,000 1,700 3,300 3,200 4,700 3,500 17,000 10,000 11,000 17,000Particulate matter < 10 µm 7,700 62,000 13,000 25,000 25,000 36,000 27,000 130,000 79,000 84,000 130,000Phenol 0.000024 0.00019 0.00004 0.000077 0.000076 0.00011 0.000083 0.00040 0.00024 0.00026 0.00041Polycyclic aromatic hydrocarbons 210 1,700 350 680 660 970 730 3,500 2,100 2,300 3,600Selenium & compounds 0.0098 0.079 0.017 0.032 0.031 0.046 0.034 0.17 0.10 0.11 0.17Styrene (ethenylbenzene) 25 200 43 83 81 120 89 430 260 280 440Sulfur dioxide 190 1,500 320 620 610 900 670 3,200 2,000 2,100 3,300Tetrachloroethylene 0.000064 0.00051 0.00011 0.00021 0.00020 0.00030 0.00022 0.0011 0.00065 0.00069 0.0011Toluene (methylbenzene) 380 3,100 650 1,200 1,200 1,800 1,300 6,500 3,900 4,200 6,600Total volatile organic compounds 25,000 200,000 42,000 81,000 79,000 120,000 87,000 420,000 250,000 270,000 430,000Xylenes (individual or mixed isomers) 170 1,400 290 570 560 820 610 3,000 1,800 1,900 3,000Zinc and compounds 3.7 30 6.2 12 12 17 13 62 38 40 64
� Emissions to 2 significant figures
NPI Summary Report: Adelaide and regional airsheds 1998-99
67
Section 4: Sub-reporting threshold facilities
Sub-reporting threshold facilities represent industrial and commercial facilities that were belowthe NPI reporting threshold in the reporting year or were above the threshold but did not reportbecause:
� NPI manuals were not published for their industry sector (NPI does not require facilities toreport unless a relevant handbook is published)
� the facility elected not to report (1998�99 reporting was not compulsory).
4.1 Fuel combustionFuel combustion from sub-reporting threshold facilities includes industrial and commercialfacilities that:
� burn less than 400 tonnes of fuel or waste in a year (i.e. facilities that do not trigger the NPICategory 2 thresholds)
� trigger the NPI Category 2a and/or 2b thresholds but fail to submit an annual report.
The consumption of fuels was determined from data provided by local suppliers or compiled byABARE16. The manufacturing and electricity generation industries are the main fuel consumers inurban airsheds when the consumption of residential and commercial sectors is excluded.Electricity generation can also be excluded since operators have reported NPI emissions as part ofthe above thresholds requirements. This leaves the manufacturing sector as the principal source ofaggregated emissions from fuel combustion to be estimated.
Fuel use among the industrial manufacturing sector was assessed according to the market share ofeach fuel. Black coal, coke and coal by-products all have a market share of more than 10%;however, nearly all of these products have been accounted for by reporting facilities. Natural gasand electricity also exceed 10% of the market fuel share, but only natural gas is considered in thissection since emissions occur at place of use. LPG, used to a lesser degree with a market share ofaround 3%, was also considered a combustion product among the industry sector particularly inairsheds where natural gas is unavailable. Fuel oil combustion emissions were estimated eventhough the market share of this fuel among the industrial sector was less than 1%.
The commercial sector was defined according to the Australian energy report16 classificationincluding the total of Divisions F, G, H, J, K, L, M, N, O, P and Q. The dominance of each fuel inthe commercial sector was assessed according to each fuel�s share of the market. Excludingelectricity, natural gas and LPG were considered the dominant fuels with a market share of 84%and 8% respectively. Fuel oil and wood waste both had a market share of less than 1%; however,fuel oil was still estimated using emission factors provided in the NPI Emissions EstimationTechnique Manual for Aggregated Emissions from Fuel Combustion (Sub-Threshold) (Fuel combustionEET manual)44.
Manufacturing plants are located in industrial zones, while commercial facilities are usuallylocated near residential areas. Emissions from the industrial and commercial sectors weretherefore calculated and allocated to grid squares separately to provide a better representation ofarea-based emissions. The spatial surrogate for allocating emissions from sub-threshold industrialfacilities was the portion of industry within each grid cell (industry density). Overlaying industrynumbers by postcode, provided by the ABS, created the gridded industry data per airshed. Theindustry density for each grid square was calculated by dividing the cell industry total by the totalnumber of industry within the airshed. Commercial emissions were allocated according to thecommercial density of each grid square. This data was determined in the same way as the industrydensity.
NPI Summary Report: Adelaide and regional airsheds 1998-99
68
4.1.1 Adelaide airshed�fuel combustion emissionsEmissions from sub-reporting threshold facility fuel combustion were calculated using emissionfactors, according to the methodology described in the fuel combustion EET manual44.
Natural gas consumption data for the Adelaide and regional airsheds were provided by OriginEnergy29,45. LPG and fuel oil consumption data were sourced from ABARE16, and required furthercomputation to apportion data to the respective airshed before calculating emissions. Theapportioning of LPG and fuel oil consumption data was made on the basis of the number ofcommercial and industrial sites within each airshed. Approximately 76% of commercial andindustrial sites were located within the Adelaide airshed, thus corresponding to 76% of the totalLPG and fuel oil consumed in South Australia. The total consumption of natural gas, LPG and fueloil within the Adelaide airshed, excludes consumption data accounted for by industry reporters in1999�2000.
Emission factors from the fuel combustion EET manual44 were applied to natural gas and fuel oilconsumption figures. Emission factors listed in the NPI industrial handbook for combustion inboilers46 for propane LPG fuel were used to calculate industrial and commercial boiler emissions.Industrial and commercial fuel combustion emissions were spatially allocated according toindustrial and commercial zones respectively within the Adelaide airshed. Table 36 presents thetotal calculated emissions of individual NPI substances from fuel combustion processes of sub-threshold reporting facilities within the Adelaide airshed during 1998�99.
4.1.2 Regional airshed�fuel combustion emissionsThe sub-threshold fuel combustion emissions estimated in each of the regional airsheds weremade according to the methodology described in the fuel combustion EET manual44 and reviewedin Section 4.1.1 above.
The data on state consumption of LPG and fuel oil provided by ABARE was allocated to regionalairsheds according to the proportion of commercial and industrial sites respectively. Natural gasdata supplied to the major regional airsheds was provided by Origin energy. The natural gaspipeline network does not extend to the airsheds of Port Augusta and Port Lincoln, so theseairsheds were classified as �without mains natural gas� and excluded from subsequent natural gasemissions calculation.
A total of 3772 industrial facilities and 10,067 commercial facilities were located outside theAdelaide metropolitan region. These facilities were classified as regional but only a proportion ofthem were located within the regional airsheds. Of the total regional commercial and industrialfacilities only 3.6% and 4.5% respectively were located in the Barossa airshed, 4.5% and 5.3% in thePort Lincoln airshed, 4.9% and 4.9% in the Riverland airshed and 10.3% and 10.8% in the SouthEast airshed. The largest proportion of commercial and industrial facilities was located in theSpencer airshed, with 14.4% and 11.3% respectively. Subsequent fuel consumption data wasapportioned to each airshed based on these distributions.
The total annual emissions from fuel combustion at sub-threshold facilities estimated for each ofthe major regional airsheds is presented in Table 36. Table 37 lists total emissions of all NPIsubstances estimated in each of the minor airsheds for 1998�99.
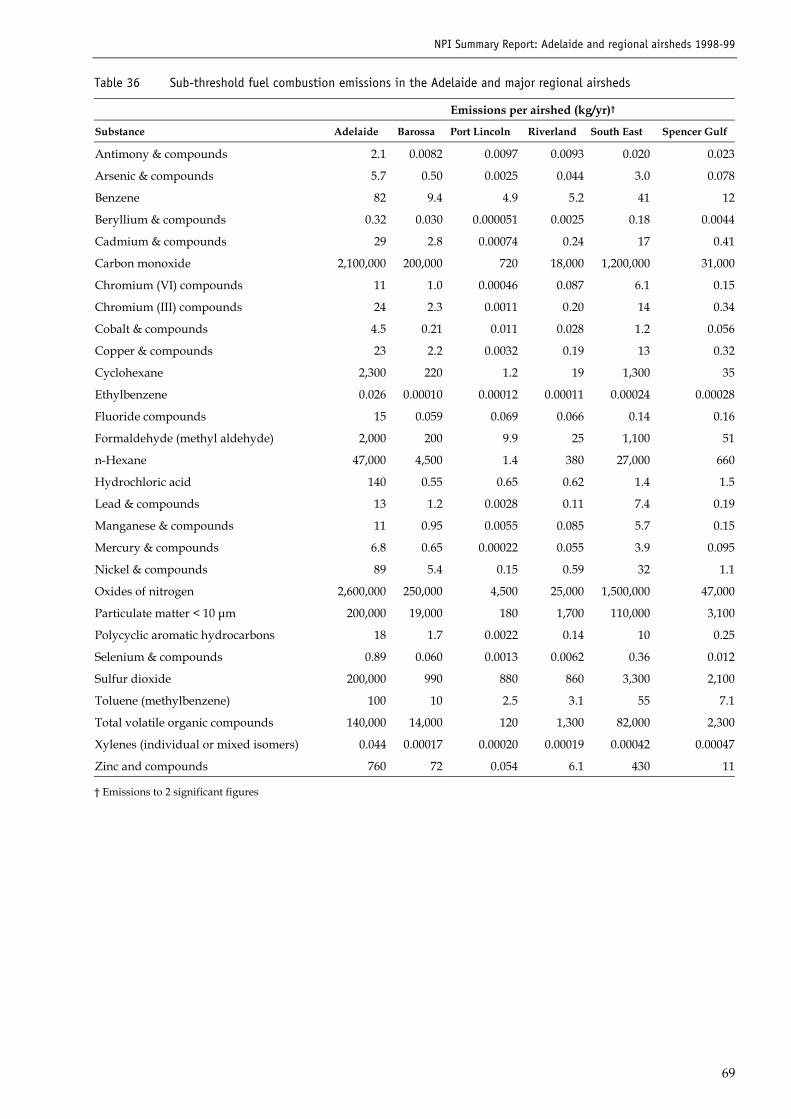
NPI Summary Report: Adelaide and regional airsheds 1998-99
69
Table 36 Sub-threshold fuel combustion emissions in the Adelaide and major regional airsheds
Emissions per airshed (kg/yr)�
Substance Adelaide Barossa Port Lincoln Riverland South East Spencer Gulf
Antimony & compounds 2.1 0.0082 0.0097 0.0093 0.020 0.023
Arsenic & compounds 5.7 0.50 0.0025 0.044 3.0 0.078
Benzene 82 9.4 4.9 5.2 41 12
Beryllium & compounds 0.32 0.030 0.000051 0.0025 0.18 0.0044
Cadmium & compounds 29 2.8 0.00074 0.24 17 0.41
Carbon monoxide 2,100,000 200,000 720 18,000 1,200,000 31,000
Chromium (VI) compounds 11 1.0 0.00046 0.087 6.1 0.15
Chromium (III) compounds 24 2.3 0.0011 0.20 14 0.34
Cobalt & compounds 4.5 0.21 0.011 0.028 1.2 0.056
Copper & compounds 23 2.2 0.0032 0.19 13 0.32
Cyclohexane 2,300 220 1.2 19 1,300 35
Ethylbenzene 0.026 0.00010 0.00012 0.00011 0.00024 0.00028
Fluoride compounds 15 0.059 0.069 0.066 0.14 0.16
Formaldehyde (methyl aldehyde) 2,000 200 9.9 25 1,100 51
n-Hexane 47,000 4,500 1.4 380 27,000 660
Hydrochloric acid 140 0.55 0.65 0.62 1.4 1.5
Lead & compounds 13 1.2 0.0028 0.11 7.4 0.19
Manganese & compounds 11 0.95 0.0055 0.085 5.7 0.15
Mercury & compounds 6.8 0.65 0.00022 0.055 3.9 0.095
Nickel & compounds 89 5.4 0.15 0.59 32 1.1
Oxides of nitrogen 2,600,000 250,000 4,500 25,000 1,500,000 47,000
Particulate matter < 10 µm 200,000 19,000 180 1,700 110,000 3,100
Polycyclic aromatic hydrocarbons 18 1.7 0.0022 0.14 10 0.25
Selenium & compounds 0.89 0.060 0.0013 0.0062 0.36 0.012
Sulfur dioxide 200,000 990 880 860 3,300 2,100
Toluene (methylbenzene) 100 10 2.5 3.1 55 7.1
Total volatile organic compounds 140,000 14,000 120 1,300 82,000 2,300
Xylenes (individual or mixed isomers) 0.044 0.00017 0.00020 0.00019 0.00042 0.00047
Zinc and compounds 760 72 0.054 6.1 430 11
� Emissions to 2 significant figures
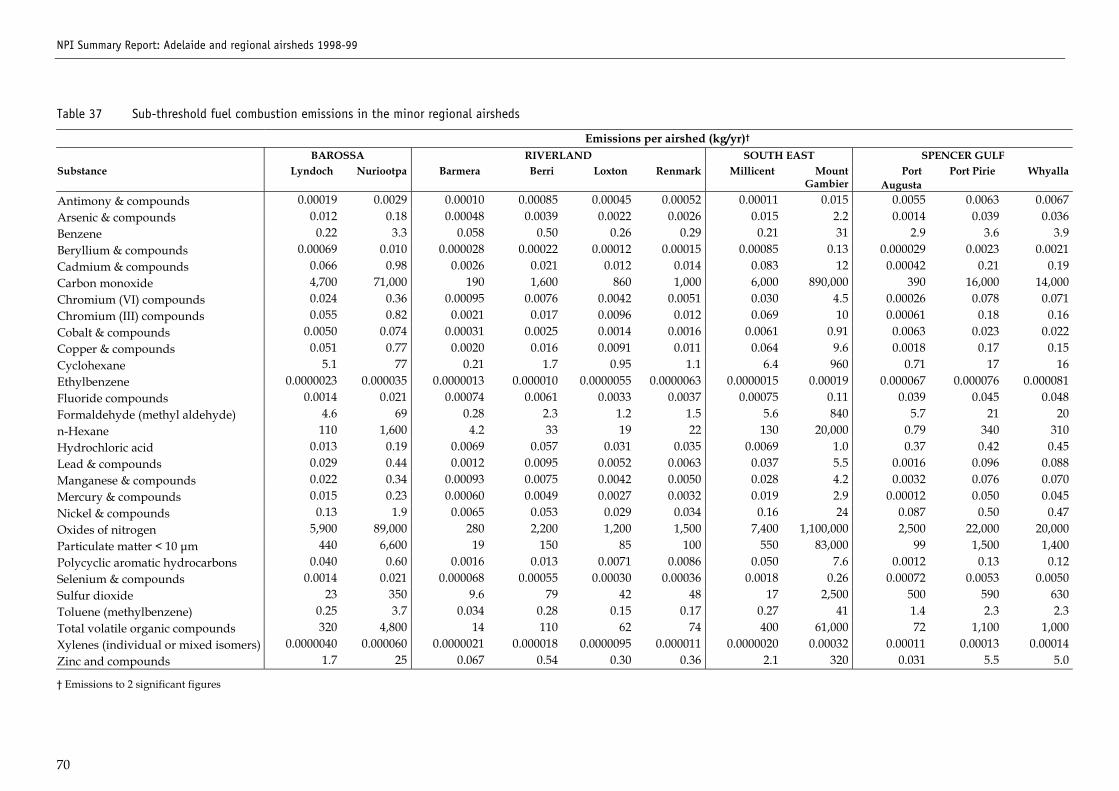
NPI Summary Report: Adelaide and regional airsheds 1998-99
70
Table 37 Sub-threshold fuel combustion emissions in the minor regional airsheds
Emissions per airshed (kg/yr)�
BAROSSA RIVERLAND SOUTH EAST SPENCER GULFSubstance Lyndoch Nuriootpa Barmera Berri Loxton Renmark Millicent Mount
GambierPort
AugustaPort Pirie Whyalla
Antimony & compounds 0.00019 0.0029 0.00010 0.00085 0.00045 0.00052 0.00011 0.015 0.0055 0.0063 0.0067Arsenic & compounds 0.012 0.18 0.00048 0.0039 0.0022 0.0026 0.015 2.2 0.0014 0.039 0.036Benzene 0.22 3.3 0.058 0.50 0.26 0.29 0.21 31 2.9 3.6 3.9Beryllium & compounds 0.00069 0.010 0.000028 0.00022 0.00012 0.00015 0.00085 0.13 0.000029 0.0023 0.0021Cadmium & compounds 0.066 0.98 0.0026 0.021 0.012 0.014 0.083 12 0.00042 0.21 0.19Carbon monoxide 4,700 71,000 190 1,600 860 1,000 6,000 890,000 390 16,000 14,000Chromium (VI) compounds 0.024 0.36 0.00095 0.0076 0.0042 0.0051 0.030 4.5 0.00026 0.078 0.071Chromium (III) compounds 0.055 0.82 0.0021 0.017 0.0096 0.012 0.069 10 0.00061 0.18 0.16Cobalt & compounds 0.0050 0.074 0.00031 0.0025 0.0014 0.0016 0.0061 0.91 0.0063 0.023 0.022Copper & compounds 0.051 0.77 0.0020 0.016 0.0091 0.011 0.064 9.6 0.0018 0.17 0.15Cyclohexane 5.1 77 0.21 1.7 0.95 1.1 6.4 960 0.71 17 16Ethylbenzene 0.0000023 0.000035 0.0000013 0.000010 0.0000055 0.0000063 0.0000015 0.00019 0.000067 0.000076 0.000081Fluoride compounds 0.0014 0.021 0.00074 0.0061 0.0033 0.0037 0.00075 0.11 0.039 0.045 0.048Formaldehyde (methyl aldehyde) 4.6 69 0.28 2.3 1.2 1.5 5.6 840 5.7 21 20n-Hexane 110 1,600 4.2 33 19 22 130 20,000 0.79 340 310Hydrochloric acid 0.013 0.19 0.0069 0.057 0.031 0.035 0.0069 1.0 0.37 0.42 0.45Lead & compounds 0.029 0.44 0.0012 0.0095 0.0052 0.0063 0.037 5.5 0.0016 0.096 0.088Manganese & compounds 0.022 0.34 0.00093 0.0075 0.0042 0.0050 0.028 4.2 0.0032 0.076 0.070Mercury & compounds 0.015 0.23 0.00060 0.0049 0.0027 0.0032 0.019 2.9 0.00012 0.050 0.045Nickel & compounds 0.13 1.9 0.0065 0.053 0.029 0.034 0.16 24 0.087 0.50 0.47Oxides of nitrogen 5,900 89,000 280 2,200 1,200 1,500 7,400 1,100,000 2,500 22,000 20,000Particulate matter < 10 µm 440 6,600 19 150 85 100 550 83,000 99 1,500 1,400Polycyclic aromatic hydrocarbons 0.040 0.60 0.0016 0.013 0.0071 0.0086 0.050 7.6 0.0012 0.13 0.12Selenium & compounds 0.0014 0.021 0.000068 0.00055 0.00030 0.00036 0.0018 0.26 0.00072 0.0053 0.0050Sulfur dioxide 23 350 9.6 79 42 48 17 2,500 500 590 630Toluene (methylbenzene) 0.25 3.7 0.034 0.28 0.15 0.17 0.27 41 1.4 2.3 2.3Total volatile organic compounds 320 4,800 14 110 62 74 400 61,000 72 1,100 1,000Xylenes (individual or mixed isomers) 0.0000040 0.000060 0.0000021 0.000018 0.0000095 0.000011 0.0000020 0.00032 0.00011 0.00013 0.00014Zinc and compounds 1.7 25 0.067 0.54 0.30 0.36 2.1 320 0.031 5.5 5.0
� Emissions to 2 significant figures
NPI Summary Report: Adelaide and regional airsheds 1998-99
71
4.2 Industrial solventsThe air emissions generated from this source category are derived from the use of solvents fordegreasing and surface cleaning in the industrial sector. Uses of solvents for other purposes havebeen estimated under their respective sections such as architectural surface coatings, motor vehiclerefinishing, and printing and graphic arts.
Degreasing and surface cleaning prepares the surface for subsequent surface protection processes.The only solvent considered for this purpose is trichloroethylene, which in itself is a NPIsubstance as well as a total VOC.
Trichloroethylene is used in most industries as a solvent degreaser although its primary use is inthe metal working industry. The typical uses of trichloroethylene include:
� airframe and automotive manufacturing
� electronics manufacturing and assembling
� glass fabrication and finishing
� machine parts manufacturing
� mechanical workshops
� repair, overhaul and equipment maintenance.
Three processes of degreasing are generally employed�vapour degreasing, cold degreasing andconveyorised degreasing. For the purpose of these emission calculations, the mass balance methodis used to calculate emissions, assuming that total volume of trichloroethylene consumed in anairshed will totally evaporate to the atmosphere, regardless of the degreasing method applied.This approach is further discussed in the NPI Emissions Estimation Technique Manual for AggregatedEmissions from Use of Industrial Solvents (Sub-Threshold) (Solvents EET manual)47.
4.2.1 Adelaide airshed�industrial solvent emissionsIndustrial solvent emissions within the Adelaide airshed were calculated in accordance with theSolvents EET manual47. Total sales of trichloroethylene solvent for the South Australia marketwere sourced through two of the major suppliers, Orica Australia Pty Ltd48 and ConsolidatedChemicals Company49. The use of trichloroethylene reported by industries providing their ownemission calculations was subtracted from the total South Australian supply.
The use of trichloroethylene was attributed to those industries with ANZSIC codes 27 and 28,corresponding to metal product, machinery and equipment manufacture. The proportion of thesetwo industry sectors within the Adelaide airshed was used to scale down State use oftrichloroethylene. Assuming the mass balance approach, the entire annual consumption oftrichloroethylene solvent was used to estimate the total airshed emissions of each NPI substance.
Total air emissions of trichloroethylene and VOC calculated for the Adelaide airshed are listed inTable 38. Emissions were spatially distributed throughout the airshed among grid squarescorresponding to industrial densities for the manufacturing industry only, using GIS software.
4.2.2 Regional airshed�industrial solvent emissionsRegional emissions from the use of trichloroethylene as a degreasing solvent were calculatedaccording to the best practice method described in the Solvents EET manual47 and outlined inSection 4.2.1.
In brief, the consumption of trichloroethylene within each regional airshed was apportionedaccording to the number of facilities involved with metal product, machinery and equipment
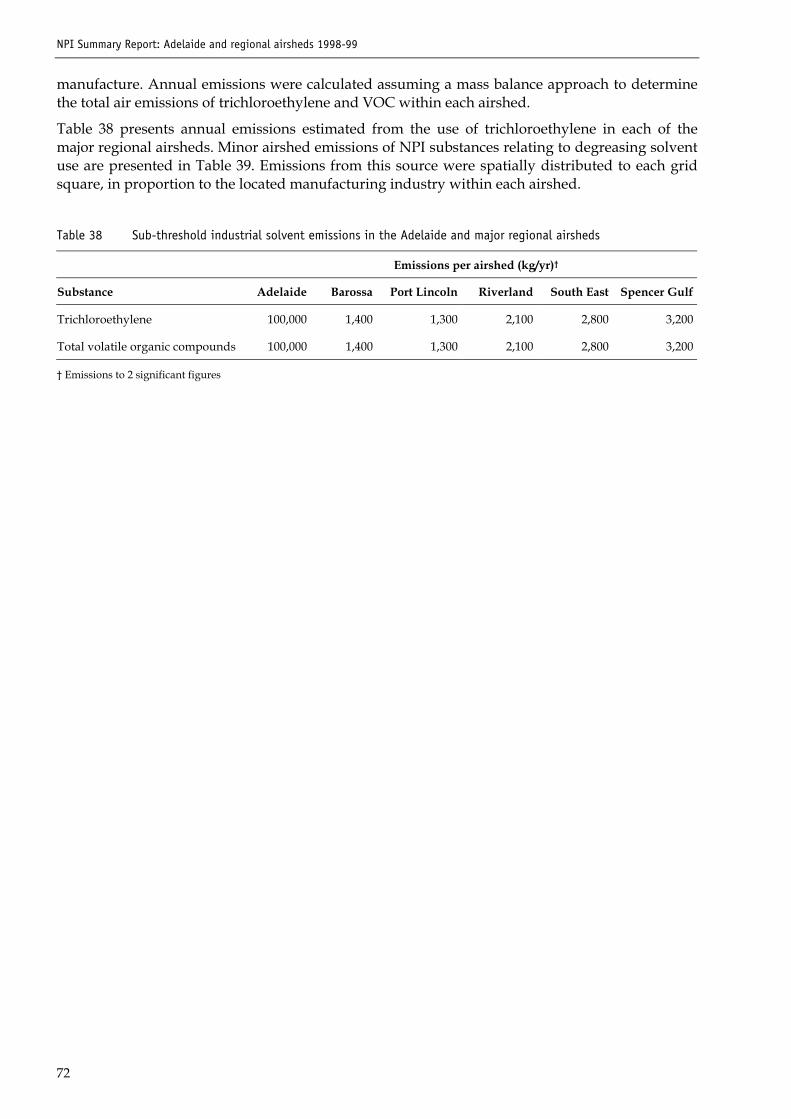
NPI Summary Report: Adelaide and regional airsheds 1998-99
72
manufacture. Annual emissions were calculated assuming a mass balance approach to determinethe total air emissions of trichloroethylene and VOC within each airshed.
Table 38 presents annual emissions estimated from the use of trichloroethylene in each of themajor regional airsheds. Minor airshed emissions of NPI substances relating to degreasing solventuse are presented in Table 39. Emissions from this source were spatially distributed to each gridsquare, in proportion to the located manufacturing industry within each airshed.
Table 38 Sub-threshold industrial solvent emissions in the Adelaide and major regional airsheds
Emissions per airshed (kg/yr)�
Substance Adelaide Barossa Port Lincoln Riverland South East Spencer Gulf
Trichloroethylene 100,000 1,400 1,300 2,100 2,800 3,200
Total volatile organic compounds 100,000 1,400 1,300 2,100 2,800 3,200
� Emissions to 2 significant figures
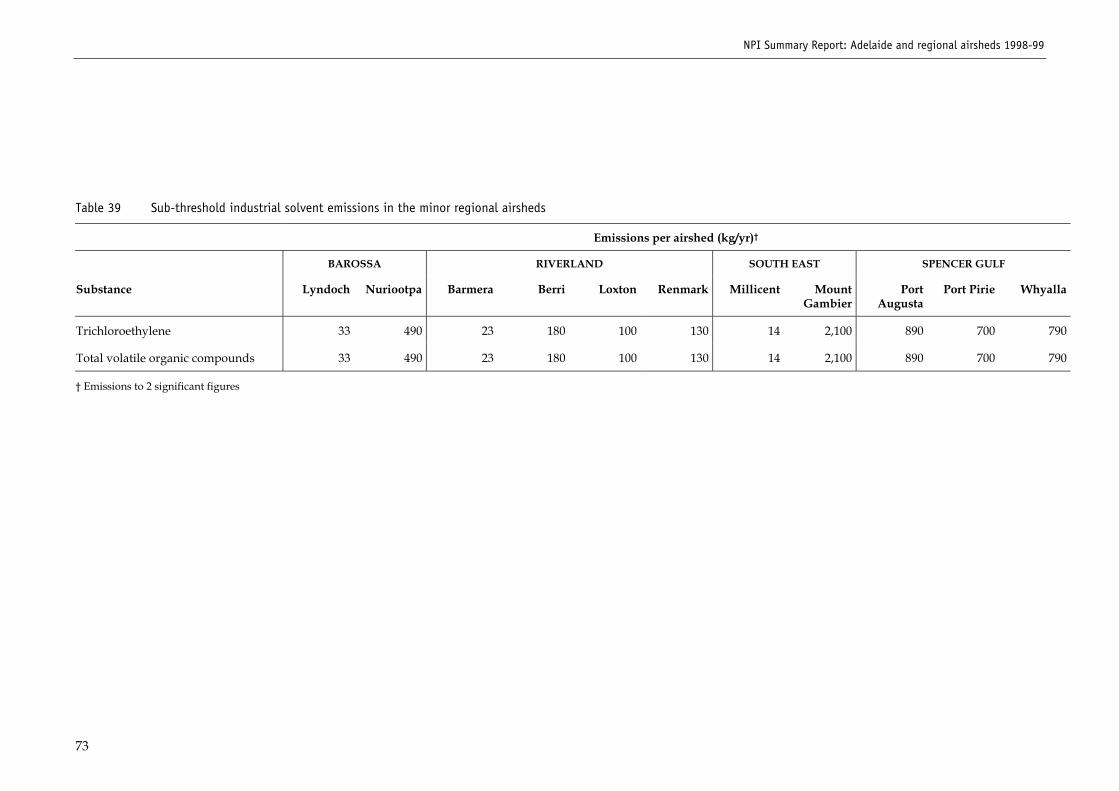
NPI Summary Report: Adelaide and regional airsheds 1998-99
73
Table 39 Sub-threshold industrial solvent emissions in the minor regional airsheds
Emissions per airshed (kg/yr)�
BAROSSA RIVERLAND SOUTH EAST SPENCER GULF
Substance Lyndoch Nuriootpa Barmera Berri Loxton Renmark Millicent MountGambier
PortAugusta
Port Pirie Whyalla
Trichloroethylene 33 490 23 180 100 130 14 2,100 890 700 790
Total volatile organic compounds 33 490 23 180 100 130 14 2,100 890 700 790
� Emissions to 2 significant figures
NPI Summary Report: Adelaide and regional airsheds 1998-99
74
Section 5: Results summary
The results presented in this section provide an overview of all NPI substance emissions by eachaggregated source type. The information is provided in the form of tables indicating actual andpercentage contributions. Comparisons have been made between airsheds, sources and NPIsubstances emitted in the Adelaide and each of the major regional airsheds. These are presentedaccording to the following category types: mobile (motor vehicles), mobile (other), area-based,sub-threshold reporting and industry reported sources. Some comparisons are made for the threebasic source categories�mobile, area-based and industry.
5.1 Results
5.1.1 Total emissions of NPI substancesThe total inventory of NPI substances in the Adelaide airshed is presented in Table 40. This tableprovides a summary of emissions estimated from aggregate sources as well as industry reportedemissions for 1999�2000. The aggregate emissions consist of emissions estimated for 1998�99 fromthe three main source categories�mobile, area-based and sub-threshold facilities. For comparisonpurposes, industry reported emissions for 1999�2000 are included as opposed to the 1998�99 data.These were considered more complete than the early version that consisted of preliminary datacollected during the implementation period of the NPI. For the latest industry reported data,please refer to the NPI Internet database directly: www.npi.ea.gov.au.
The NPI provides emission estimates for 59 substances in the Adelaide airshed, 58 substances inthe South East airshed and 56 substances in the remaining airsheds�Barossa, Port Lincoln,Riverland and Spencer Gulf�from the total list of 90 substances. However, NPI substanceemissions were only calculated for those substances where emission factors were available.Substances with no emission data are either not related to the sources studied or emission factorsfor their estimation were unavailable.
The total NPI substance estimates for the Adelaide airsheds are presented in Table 40. Table 41indicates the percentage contribution made by individual sources to the total annual emissions ofeach NPI substance in the Adelaide airshed. These include all aggregate and industry emissionsources and the totals for each of the grouped source categories�motor vehicles, other mobile,area-based, sub-threshold and industry reported. The list of substances presented includes onlythose with actual estimates.
The complete list of NPI substances emitted in the Barossa is presented in Table 42. Emissionsfrom aggregate source emissions are provided separate to those reported by NPI reportingfacilities. The percentage contribution made by individual sources to the annual total of each NPIsubstance is presented in Table 43.
Similarly, total annual estimates of NPI substances for the remaining regional airsheds of PortLincoln, Riverland, South East and Spencer Gulf are presented in Table 44, Table 46, Table 48 andTable 50 respectively. The proportion each source contributes to the total emissions of eachsubstance within these airsheds is presented in Table 45, Table 47, Table 49 and Table 51.
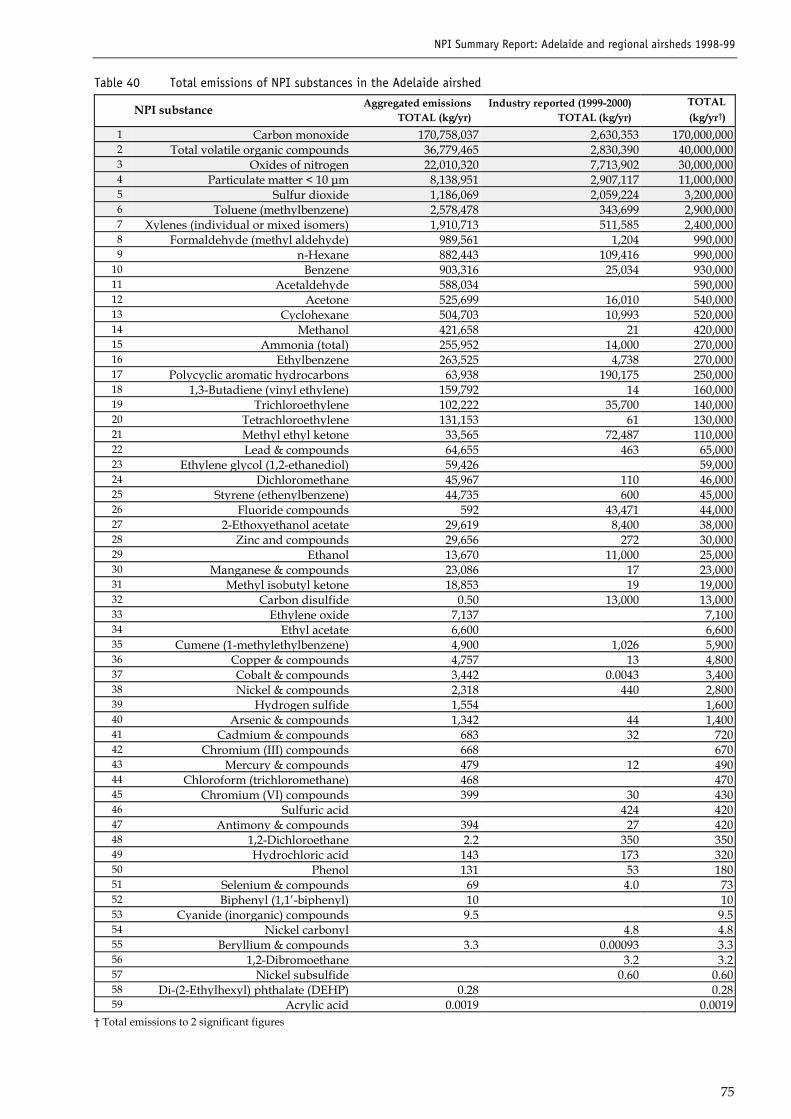
NPI Summary Report: Adelaide and regional airsheds 1998-99
75
Table 40 Total emissions of NPI substances in the Adelaide airshed
NPI substance Aggregated emissionsTOTAL (kg/yr)
Industry reported (1999-2000)TOTAL (kg/yr)
TOTAL(kg/yr�)
1 Carbon monoxide 170,758,037 2,630,353 170,000,0002 Total volatile organic compounds 36,779,465 2,830,390 40,000,0003 Oxides of nitrogen 22,010,320 7,713,902 30,000,0004 Particulate matter < 10 µm 8,138,951 2,907,117 11,000,0005 Sulfur dioxide 1,186,069 2,059,224 3,200,0006 Toluene (methylbenzene) 2,578,478 343,699 2,900,0007 Xylenes (individual or mixed isomers) 1,910,713 511,585 2,400,0008 Formaldehyde (methyl aldehyde) 989,561 1,204 990,0009 n-Hexane 882,443 109,416 990,000
10 Benzene 903,316 25,034 930,00011 Acetaldehyde 588,034 590,00012 Acetone 525,699 16,010 540,00013 Cyclohexane 504,703 10,993 520,00014 Methanol 421,658 21 420,00015 Ammonia (total) 255,952 14,000 270,00016 Ethylbenzene 263,525 4,738 270,00017 Polycyclic aromatic hydrocarbons 63,938 190,175 250,00018 1,3-Butadiene (vinyl ethylene) 159,792 14 160,00019 Trichloroethylene 102,222 35,700 140,00020 Tetrachloroethylene 131,153 61 130,00021 Methyl ethyl ketone 33,565 72,487 110,00022 Lead & compounds 64,655 463 65,00023 Ethylene glycol (1,2-ethanediol) 59,426 59,00024 Dichloromethane 45,967 110 46,00025 Styrene (ethenylbenzene) 44,735 600 45,00026 Fluoride compounds 592 43,471 44,00027 2-Ethoxyethanol acetate 29,619 8,400 38,00028 Zinc and compounds 29,656 272 30,00029 Ethanol 13,670 11,000 25,00030 Manganese & compounds 23,086 17 23,00031 Methyl isobutyl ketone 18,853 19 19,00032 Carbon disulfide 0.50 13,000 13,00033 Ethylene oxide 7,137 7,10034 Ethyl acetate 6,600 6,60035 Cumene (1-methylethylbenzene) 4,900 1,026 5,90036 Copper & compounds 4,757 13 4,80037 Cobalt & compounds 3,442 0.0043 3,40038 Nickel & compounds 2,318 440 2,80039 Hydrogen sulfide 1,554 1,60040 Arsenic & compounds 1,342 44 1,40041 Cadmium & compounds 683 32 72042 Chromium (III) compounds 668 67043 Mercury & compounds 479 12 49044 Chloroform (trichloromethane) 468 47045 Chromium (VI) compounds 399 30 43046 Sulfuric acid 424 42047 Antimony & compounds 394 27 42048 1,2-Dichloroethane 2.2 350 35049 Hydrochloric acid 143 173 32050 Phenol 131 53 18051 Selenium & compounds 69 4.0 7352 Biphenyl (1,1�-biphenyl) 10 1053 Cyanide (inorganic) compounds 9.5 9.554 Nickel carbonyl 4.8 4.855 Beryllium & compounds 3.3 0.00093 3.356 1,2-Dibromoethane 3.2 3.257 Nickel subsulfide 0.60 0.6058 Di-(2-Ethylhexyl) phthalate (DEHP) 0.28 0.2859 Acrylic acid 0.0019 0.0019
� Total emissions to 2 significant figures
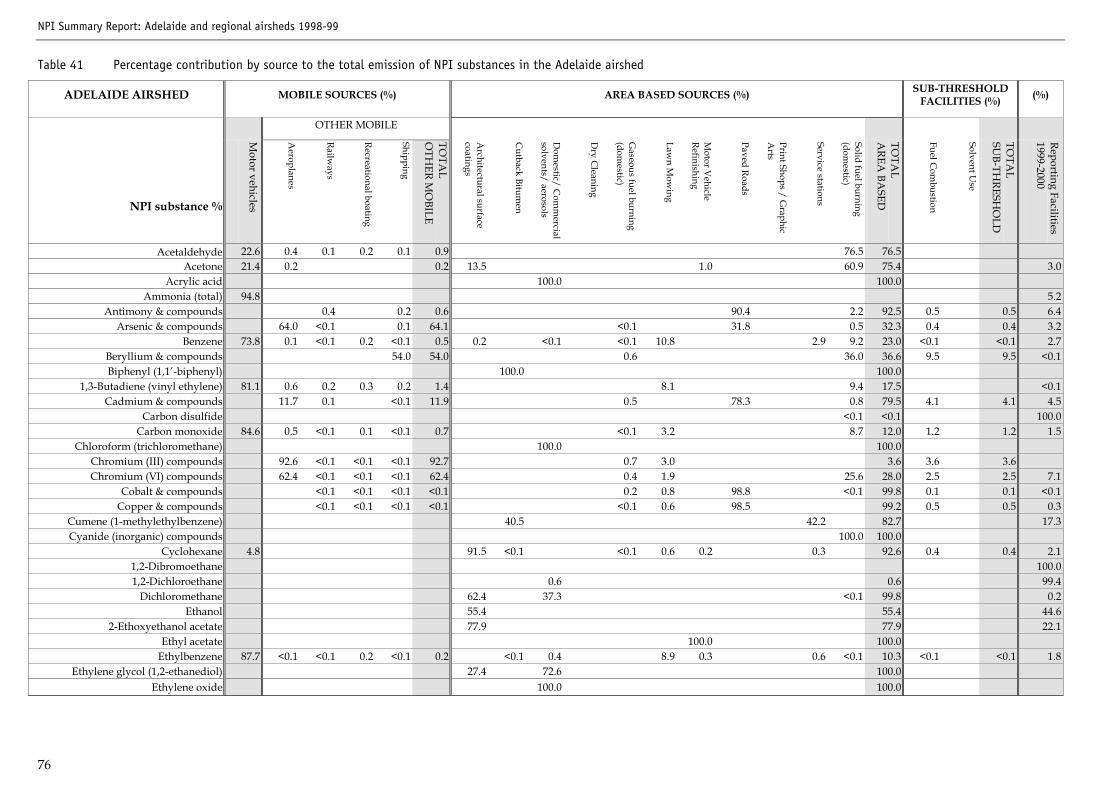
NPI Summary Report: Adelaide and regional airsheds 1998-99
76
Table 41 Percentage contribution by source to the total emission of NPI substances in the Adelaide airshed
ADELAIDE AIRSHED MOBILE SOURCES (%) AREA BASED SOURCES (%) SUB-THRESHOLDFACILITIES (%) (%)
OTHER MOBILE
NPI substance %
Motor vehicles
Aeroplanes
Railways
Recreational boating
Shipping
TOTA
LO
THER M
OBILE
Architectural surface
coatings
Cutback Bitum
en
Dom
estic/ Com
mercial
solvents/ aerosols
Dry C
leaning
Gaseous fuel burning
(domestic)
Lawn M
owing
Motor V
ehicleRefinishing
Paved Roads
Print Shops / Graphic
Arts
Service stations
Solid fuel burning(dom
estic)
TOTA
LA
REA BA
SED
Fuel Com
bustion
Solvent Use
TOTA
LSU
B-THRESH
OLD
Reporting Facilities
1999-2000
Acetaldehyde 22.6 0.4 0.1 0.2 0.1 0.9 76.5 76.5Acetone 21.4 0.2 0.2 13.5 1.0 60.9 75.4 3.0
Acrylic acid 100.0 100.0Ammonia (total) 94.8 5.2
Antimony & compounds 0.4 0.2 0.6 90.4 2.2 92.5 0.5 0.5 6.4Arsenic & compounds 64.0 <0.1 0.1 64.1 <0.1 31.8 0.5 32.3 0.4 0.4 3.2
Benzene 73.8 0.1 <0.1 0.2 <0.1 0.5 0.2 <0.1 <0.1 10.8 2.9 9.2 23.0 <0.1 <0.1 2.7Beryllium & compounds 54.0 54.0 0.6 36.0 36.6 9.5 9.5 <0.1Biphenyl (1,1�-biphenyl) 100.0 100.0
1,3-Butadiene (vinyl ethylene) 81.1 0.6 0.2 0.3 0.2 1.4 8.1 9.4 17.5 <0.1Cadmium & compounds 11.7 0.1 <0.1 11.9 0.5 78.3 0.8 79.5 4.1 4.1 4.5
Carbon disulfide <0.1 <0.1 100.0Carbon monoxide 84.6 0.5 <0.1 0.1 <0.1 0.7 <0.1 3.2 8.7 12.0 1.2 1.2 1.5
Chloroform (trichloromethane) 100.0 100.0Chromium (III) compounds 92.6 <0.1 <0.1 <0.1 92.7 0.7 3.0 3.6 3.6 3.6Chromium (VI) compounds 62.4 <0.1 <0.1 <0.1 62.4 0.4 1.9 25.6 28.0 2.5 2.5 7.1
Cobalt & compounds <0.1 <0.1 <0.1 <0.1 0.2 0.8 98.8 <0.1 99.8 0.1 0.1 <0.1Copper & compounds <0.1 <0.1 <0.1 <0.1 <0.1 0.6 98.5 99.2 0.5 0.5 0.3
Cumene (1-methylethylbenzene) 40.5 42.2 82.7 17.3Cyanide (inorganic) compounds 100.0 100.0
Cyclohexane 4.8 91.5 <0.1 <0.1 0.6 0.2 0.3 92.6 0.4 0.4 2.11,2-Dibromoethane 100.01,2-Dichloroethane 0.6 0.6 99.4
Dichloromethane 62.4 37.3 <0.1 99.8 0.2Ethanol 55.4 55.4 44.6
2-Ethoxyethanol acetate 77.9 77.9 22.1Ethyl acetate 100.0 100.0
Ethylbenzene 87.7 <0.1 <0.1 0.2 <0.1 0.2 <0.1 0.4 8.9 0.3 0.6 <0.1 10.3 <0.1 <0.1 1.8Ethylene glycol (1,2-ethanediol) 27.4 72.6 100.0
Ethylene oxide 100.0 100.0
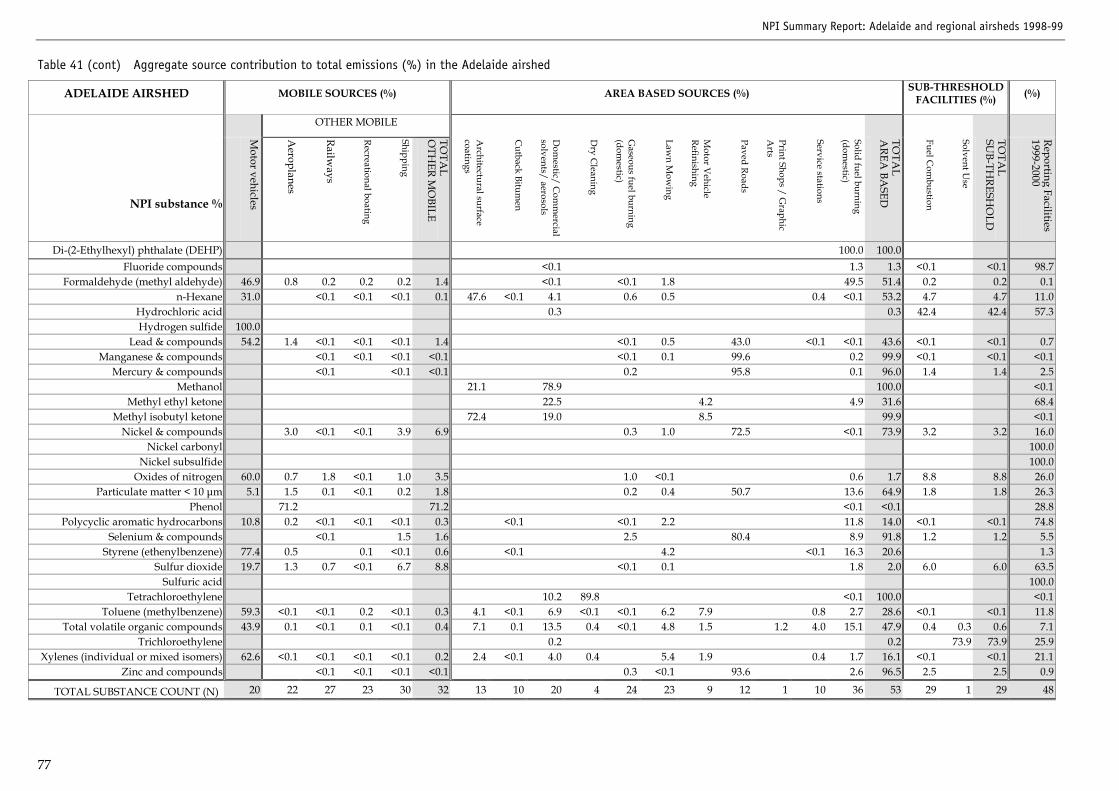
NPI Summary Report: Adelaide and regional airsheds 1998-99
77
Table 41 (cont) Aggregate source contribution to total emissions (%) in the Adelaide airshed
ADELAIDE AIRSHED MOBILE SOURCES (%) AREA BASED SOURCES (%) SUB-THRESHOLDFACILITIES (%) (%)
OTHER MOBILE
NPI substance %
Motor vehicles
Aeroplanes
Railw
ays
Recreational boating
Shipping
TOTA
LO
THER M
OBILE
Architectural surface
coatings
Cutback Bitum
en
Dom
estic/ Com
mercial
solvents/ aerosols
Dry C
leaning
Gaseous fuel burning
(domestic)
Lawn M
owing
Motor V
ehicleRefinishing
Paved Roads
Print Shops / Graphic
Arts
Service stations
Solid fuel burning(dom
estic)
TOTA
LA
REA BA
SED
Fuel Com
bustion
Solvent Use
TOTA
LSU
B-THRESH
OLD
Reporting Facilities
1999-2000
Di-(2-Ethylhexyl) phthalate (DEHP) 100.0 100.0Fluoride compounds <0.1 1.3 1.3 <0.1 <0.1 98.7
Formaldehyde (methyl aldehyde) 46.9 0.8 0.2 0.2 0.2 1.4 <0.1 <0.1 1.8 49.5 51.4 0.2 0.2 0.1n-Hexane 31.0 <0.1 <0.1 <0.1 0.1 47.6 <0.1 4.1 0.6 0.5 0.4 <0.1 53.2 4.7 4.7 11.0
Hydrochloric acid 0.3 0.3 42.4 42.4 57.3Hydrogen sulfide 100.0
Lead & compounds 54.2 1.4 <0.1 <0.1 <0.1 1.4 <0.1 0.5 43.0 <0.1 <0.1 43.6 <0.1 <0.1 0.7Manganese & compounds <0.1 <0.1 <0.1 <0.1 <0.1 0.1 99.6 0.2 99.9 <0.1 <0.1 <0.1
Mercury & compounds <0.1 <0.1 <0.1 0.2 95.8 0.1 96.0 1.4 1.4 2.5Methanol 21.1 78.9 100.0 <0.1
Methyl ethyl ketone 22.5 4.2 4.9 31.6 68.4Methyl isobutyl ketone 72.4 19.0 8.5 99.9 <0.1
Nickel & compounds 3.0 <0.1 <0.1 3.9 6.9 0.3 1.0 72.5 <0.1 73.9 3.2 3.2 16.0Nickel carbonyl 100.0
Nickel subsulfide 100.0Oxides of nitrogen 60.0 0.7 1.8 <0.1 1.0 3.5 1.0 <0.1 0.6 1.7 8.8 8.8 26.0
Particulate matter < 10 µm 5.1 1.5 0.1 <0.1 0.2 1.8 0.2 0.4 50.7 13.6 64.9 1.8 1.8 26.3Phenol 71.2 71.2 <0.1 <0.1 28.8
Polycyclic aromatic hydrocarbons 10.8 0.2 <0.1 <0.1 <0.1 0.3 <0.1 <0.1 2.2 11.8 14.0 <0.1 <0.1 74.8Selenium & compounds <0.1 1.5 1.6 2.5 80.4 8.9 91.8 1.2 1.2 5.5
Styrene (ethenylbenzene) 77.4 0.5 0.1 <0.1 0.6 <0.1 4.2 <0.1 16.3 20.6 1.3Sulfur dioxide 19.7 1.3 0.7 <0.1 6.7 8.8 <0.1 0.1 1.8 2.0 6.0 6.0 63.5
Sulfuric acid 100.0Tetrachloroethylene 10.2 89.8 <0.1 100.0 <0.1
Toluene (methylbenzene) 59.3 <0.1 <0.1 0.2 <0.1 0.3 4.1 <0.1 6.9 <0.1 <0.1 6.2 7.9 0.8 2.7 28.6 <0.1 <0.1 11.8Total volatile organic compounds 43.9 0.1 <0.1 0.1 <0.1 0.4 7.1 0.1 13.5 0.4 <0.1 4.8 1.5 1.2 4.0 15.1 47.9 0.4 0.3 0.6 7.1
Trichloroethylene 0.2 0.2 73.9 73.9 25.9Xylenes (individual or mixed isomers) 62.6 <0.1 <0.1 <0.1 <0.1 0.2 2.4 <0.1 4.0 0.4 5.4 1.9 0.4 1.7 16.1 <0.1 <0.1 21.1
Zinc and compounds <0.1 <0.1 <0.1 <0.1 0.3 <0.1 93.6 2.6 96.5 2.5 2.5 0.9
TOTAL SUBSTANCE COUNT (N) 20 22 27 23 30 32 13 10 20 4 24 23 9 12 1 10 36 53 29 1 29 48
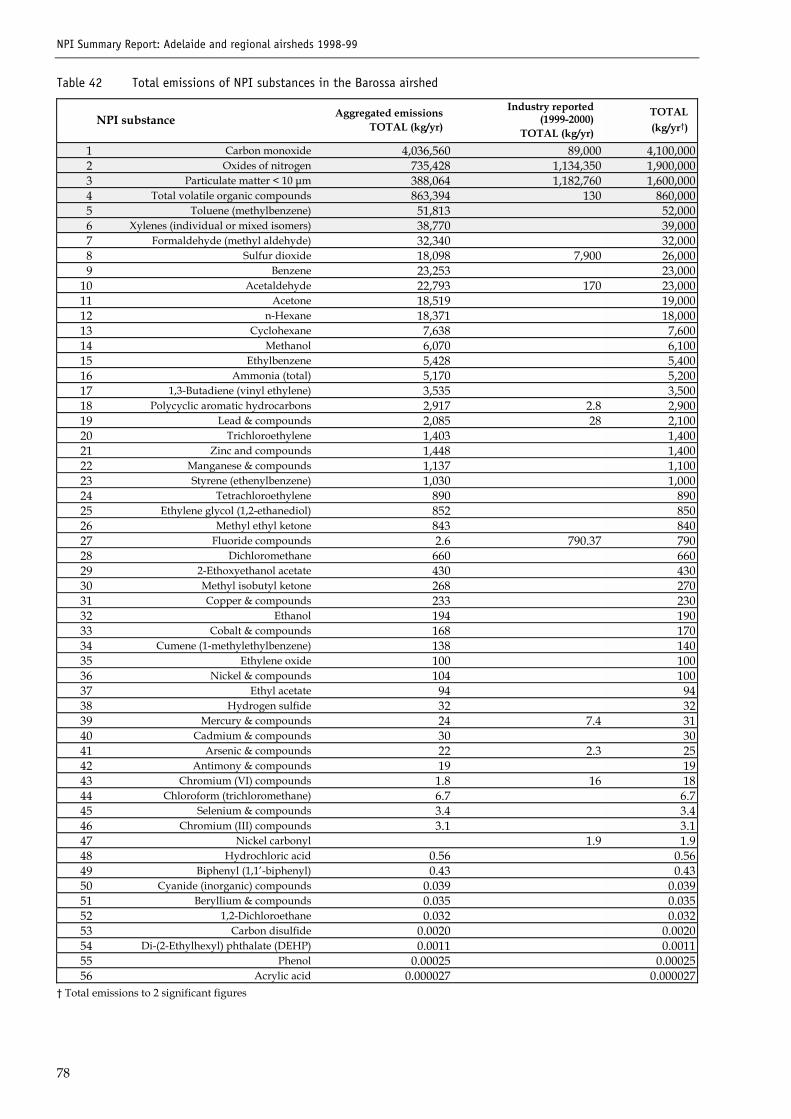
NPI Summary Report: Adelaide and regional airsheds 1998-99
78
Table 42 Total emissions of NPI substances in the Barossa airshed
NPI substance Aggregated emissionsTOTAL (kg/yr)
Industry reported(1999-2000)
TOTAL (kg/yr)
TOTAL(kg/yr�)
1 Carbon monoxide 4,036,560 89,000 4,100,0002 Oxides of nitrogen 735,428 1,134,350 1,900,0003 Particulate matter < 10 µm 388,064 1,182,760 1,600,0004 Total volatile organic compounds 863,394 130 860,0005 Toluene (methylbenzene) 51,813 52,0006 Xylenes (individual or mixed isomers) 38,770 39,0007 Formaldehyde (methyl aldehyde) 32,340 32,0008 Sulfur dioxide 18,098 7,900 26,0009 Benzene 23,253 23,000
10 Acetaldehyde 22,793 170 23,00011 Acetone 18,519 19,00012 n-Hexane 18,371 18,00013 Cyclohexane 7,638 7,60014 Methanol 6,070 6,10015 Ethylbenzene 5,428 5,40016 Ammonia (total) 5,170 5,20017 1,3-Butadiene (vinyl ethylene) 3,535 3,50018 Polycyclic aromatic hydrocarbons 2,917 2.8 2,90019 Lead & compounds 2,085 28 2,10020 Trichloroethylene 1,403 1,40021 Zinc and compounds 1,448 1,40022 Manganese & compounds 1,137 1,10023 Styrene (ethenylbenzene) 1,030 1,00024 Tetrachloroethylene 890 89025 Ethylene glycol (1,2-ethanediol) 852 85026 Methyl ethyl ketone 843 84027 Fluoride compounds 2.6 790.37 79028 Dichloromethane 660 66029 2-Ethoxyethanol acetate 430 43030 Methyl isobutyl ketone 268 27031 Copper & compounds 233 23032 Ethanol 194 19033 Cobalt & compounds 168 17034 Cumene (1-methylethylbenzene) 138 14035 Ethylene oxide 100 10036 Nickel & compounds 104 10037 Ethyl acetate 94 9438 Hydrogen sulfide 32 3239 Mercury & compounds 24 7.4 3140 Cadmium & compounds 30 3041 Arsenic & compounds 22 2.3 2542 Antimony & compounds 19 1943 Chromium (VI) compounds 1.8 16 1844 Chloroform (trichloromethane) 6.7 6.745 Selenium & compounds 3.4 3.446 Chromium (III) compounds 3.1 3.147 Nickel carbonyl 1.9 1.948 Hydrochloric acid 0.56 0.5649 Biphenyl (1,1�-biphenyl) 0.43 0.4350 Cyanide (inorganic) compounds 0.039 0.03951 Beryllium & compounds 0.035 0.03552 1,2-Dichloroethane 0.032 0.03253 Carbon disulfide 0.0020 0.002054 Di-(2-Ethylhexyl) phthalate (DEHP) 0.0011 0.001155 Phenol 0.00025 0.0002556 Acrylic acid 0.000027 0.000027
� Total emissions to 2 significant figures
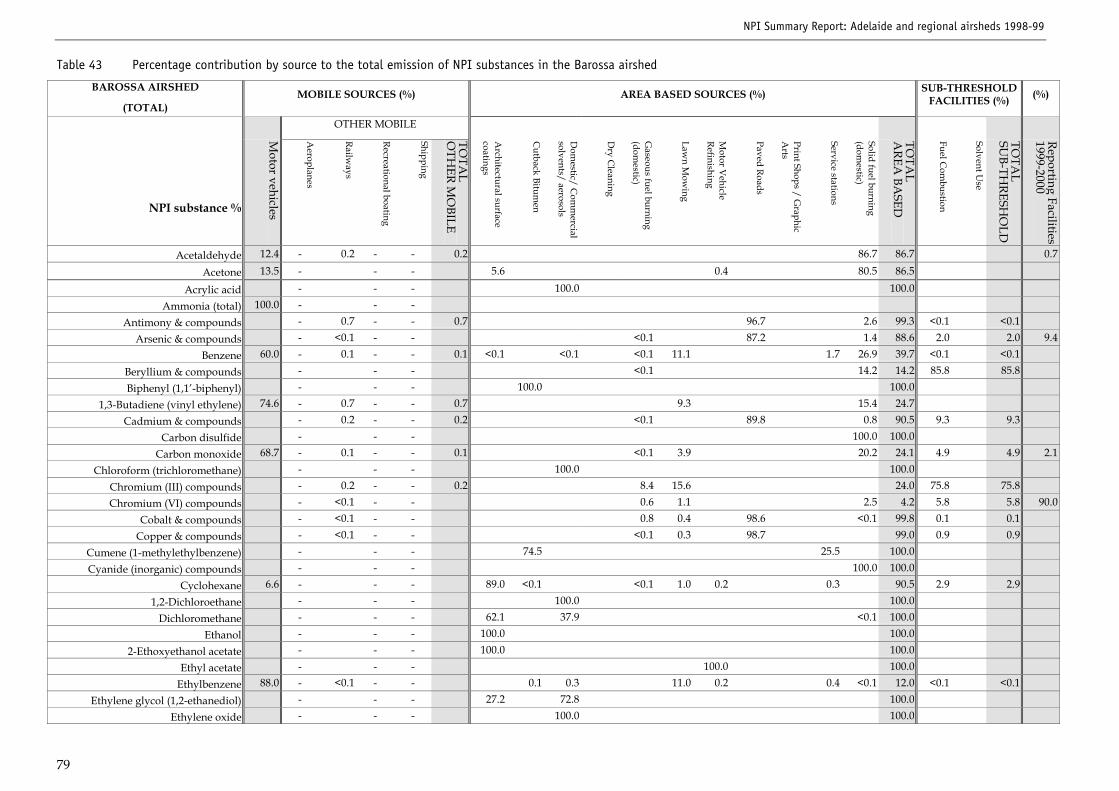
NPI Summary Report: Adelaide and regional airsheds 1998-99
79
Table 43 Percentage contribution by source to the total emission of NPI substances in the Barossa airshed
BAROSSA AIRSHED
(TOTAL)MOBILE SOURCES (%) AREA BASED SOURCES (%) SUB-THRESHOLD
FACILITIES (%) (%)
OTHER MOBILE
NPI substance %
Motor vehicles
Aeroplanes
Railways
Recreational boating
Shipping
TOTA
LO
THER M
OBILE
Architectural surface
coatings
Cutback Bitum
en
Dom
estic/ Com
mercial
solvents/ aerosols
Dry C
leaning
Gaseous fuel burning
(domestic)
Lawn M
owing
Motor V
ehicleRefinishing
Paved Roads
Print Shops / Graphic
Arts
Service stations
Solid fuel burning(dom
estic)
TOTA
LA
REA BA
SED
Fuel Com
bustion
Solvent Use
TOTA
LSU
B-THRESH
OLD
Reporting Facilities1999-2000
Acetaldehyde 12.4 - 0.2 - - 0.2 86.7 86.7 0.7
Acetone 13.5 - - - 5.6 0.4 80.5 86.5
Acrylic acid - - - 100.0 100.0Ammonia (total) 100.0 - - -
Antimony & compounds - 0.7 - - 0.7 96.7 2.6 99.3 <0.1 <0.1Arsenic & compounds - <0.1 - - <0.1 87.2 1.4 88.6 2.0 2.0 9.4
Benzene 60.0 - 0.1 - - 0.1 <0.1 <0.1 <0.1 11.1 1.7 26.9 39.7 <0.1 <0.1Beryllium & compounds - - - <0.1 14.2 14.2 85.8 85.8Biphenyl (1,1�-biphenyl) - - - 100.0 100.0
1,3-Butadiene (vinyl ethylene) 74.6 - 0.7 - - 0.7 9.3 15.4 24.7Cadmium & compounds - 0.2 - - 0.2 <0.1 89.8 0.8 90.5 9.3 9.3
Carbon disulfide - - - 100.0 100.0Carbon monoxide 68.7 - 0.1 - - 0.1 <0.1 3.9 20.2 24.1 4.9 4.9 2.1
Chloroform (trichloromethane) - - - 100.0 100.0Chromium (III) compounds - 0.2 - - 0.2 8.4 15.6 24.0 75.8 75.8Chromium (VI) compounds - <0.1 - - 0.6 1.1 2.5 4.2 5.8 5.8 90.0
Cobalt & compounds - <0.1 - - 0.8 0.4 98.6 <0.1 99.8 0.1 0.1Copper & compounds - <0.1 - - <0.1 0.3 98.7 99.0 0.9 0.9
Cumene (1-methylethylbenzene) - - - 74.5 25.5 100.0Cyanide (inorganic) compounds - - - 100.0 100.0
Cyclohexane 6.6 - - - 89.0 <0.1 <0.1 1.0 0.2 0.3 90.5 2.9 2.91,2-Dichloroethane - - - 100.0 100.0
Dichloromethane - - - 62.1 37.9 <0.1 100.0Ethanol - - - 100.0 100.0
2-Ethoxyethanol acetate - - - 100.0 100.0Ethyl acetate - - - 100.0 100.0
Ethylbenzene 88.0 - <0.1 - - 0.1 0.3 11.0 0.2 0.4 <0.1 12.0 <0.1 <0.1Ethylene glycol (1,2-ethanediol) - - - 27.2 72.8 100.0
Ethylene oxide - - - 100.0 100.0
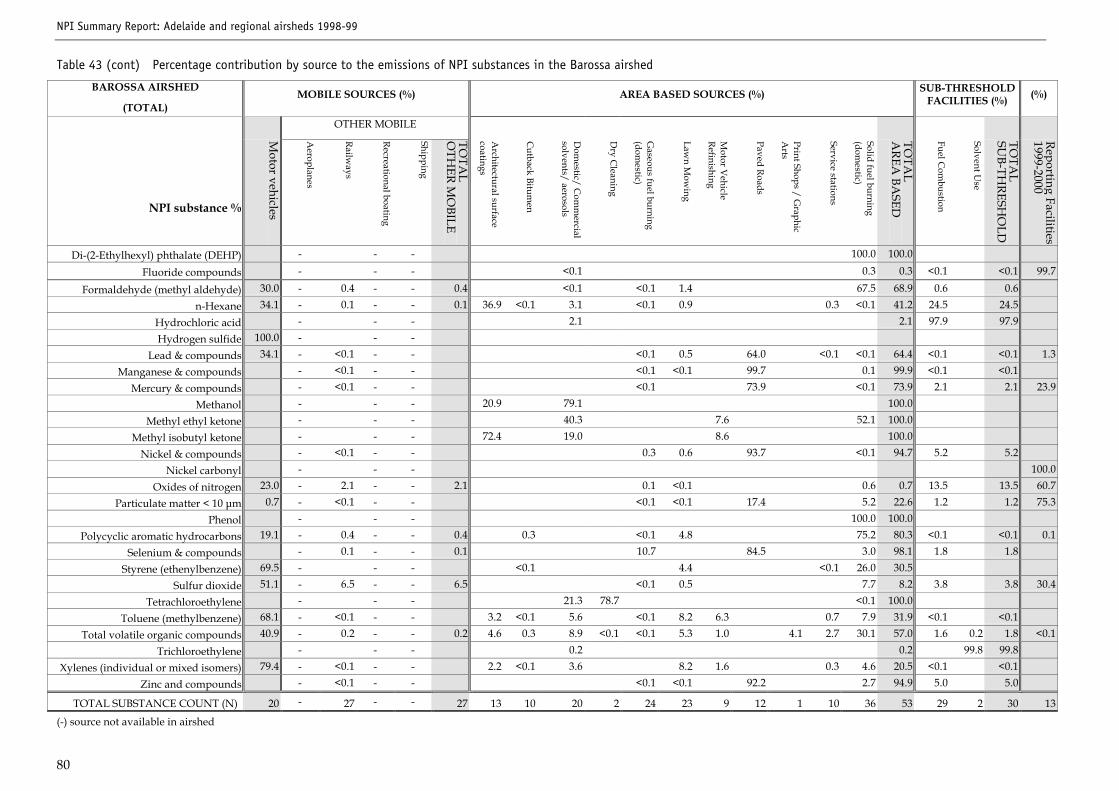
NPI Summary Report: Adelaide and regional airsheds 1998-99
80
Table 43 (cont) Percentage contribution by source to the emissions of NPI substances in the Barossa airshed
BAROSSA AIRSHED
(TOTAL)MOBILE SOURCES (%) AREA BASED SOURCES (%) SUB-THRESHOLD
FACILITIES (%) (%)
OTHER MOBILE
NPI substance %
Motor vehicles
Aeroplanes
Railways
Recreational boating
Shipping
TOTA
LO
THER M
OBILE
Architectural surface
coatings
Cutback Bitum
en
Dom
estic/ Com
mercial
solvents/ aerosols
Dry C
leaning
Gaseous fuel burning
(domestic)
Lawn M
owing
Motor V
ehicleRefinishing
Paved Roads
Print Shops / Graphic
Arts
Service stations
Solid fuel burning(dom
estic)
TOTA
LA
REA BA
SED
Fuel Com
bustion
Solvent Use
TOTA
LSU
B-THRESH
OLD
Reporting Facilities1999-2000
Di-(2-Ethylhexyl) phthalate (DEHP) - - - 100.0 100.0
Fluoride compounds - - - <0.1 0.3 0.3 <0.1 <0.1 99.7
Formaldehyde (methyl aldehyde) 30.0 - 0.4 - - 0.4 <0.1 <0.1 1.4 67.5 68.9 0.6 0.6n-Hexane 34.1 - 0.1 - - 0.1 36.9 <0.1 3.1 <0.1 0.9 0.3 <0.1 41.2 24.5 24.5
Hydrochloric acid - - - 2.1 2.1 97.9 97.9Hydrogen sulfide 100.0 - - -
Lead & compounds 34.1 - <0.1 - - <0.1 0.5 64.0 <0.1 <0.1 64.4 <0.1 <0.1 1.3Manganese & compounds - <0.1 - - <0.1 <0.1 99.7 0.1 99.9 <0.1 <0.1
Mercury & compounds - <0.1 - - <0.1 73.9 <0.1 73.9 2.1 2.1 23.9Methanol - - - 20.9 79.1 100.0
Methyl ethyl ketone - - - 40.3 7.6 52.1 100.0Methyl isobutyl ketone - - - 72.4 19.0 8.6 100.0
Nickel & compounds - <0.1 - - 0.3 0.6 93.7 <0.1 94.7 5.2 5.2Nickel carbonyl - - - 100.0
Oxides of nitrogen 23.0 - 2.1 - - 2.1 0.1 <0.1 0.6 0.7 13.5 13.5 60.7Particulate matter < 10 µm 0.7 - <0.1 - - <0.1 <0.1 17.4 5.2 22.6 1.2 1.2 75.3
Phenol - - - 100.0 100.0Polycyclic aromatic hydrocarbons 19.1 - 0.4 - - 0.4 0.3 <0.1 4.8 75.2 80.3 <0.1 <0.1 0.1
Selenium & compounds - 0.1 - - 0.1 10.7 84.5 3.0 98.1 1.8 1.8Styrene (ethenylbenzene) 69.5 - - - <0.1 4.4 <0.1 26.0 30.5
Sulfur dioxide 51.1 - 6.5 - - 6.5 <0.1 0.5 7.7 8.2 3.8 3.8 30.4Tetrachloroethylene - - - 21.3 78.7 <0.1 100.0
Toluene (methylbenzene) 68.1 - <0.1 - - 3.2 <0.1 5.6 <0.1 8.2 6.3 0.7 7.9 31.9 <0.1 <0.1Total volatile organic compounds 40.9 - 0.2 - - 0.2 4.6 0.3 8.9 <0.1 <0.1 5.3 1.0 4.1 2.7 30.1 57.0 1.6 0.2 1.8 <0.1
Trichloroethylene - - - 0.2 0.2 99.8 99.8Xylenes (individual or mixed isomers) 79.4 - <0.1 - - 2.2 <0.1 3.6 8.2 1.6 0.3 4.6 20.5 <0.1 <0.1
Zinc and compounds - <0.1 - - <0.1 <0.1 92.2 2.7 94.9 5.0 5.0
TOTAL SUBSTANCE COUNT (N) 20 - 27 - - 27 13 10 20 2 24 23 9 12 1 10 36 53 29 2 30 13
(-) source not available in airshed

NPI Summary Report: Adelaide and regional airsheds 1998-99
81
Table 44 Total emissions of NPI substances in the Port Lincoln airshed
NPI substance Aggregated emissionsTOTAL (kg/yr)
Industry reported (1999-2000)TOTAL (kg/yr)
TOTAL(kg/yr�)
1 Carbon monoxide 2,201,640 2,200,0002 Total volatile organic compounds 589,937 27,370 620,0003 Oxides of nitrogen 247,625 250,0004 Particulate matter < 10 µm 219,055 220,0005 Sulfur dioxide 46,526 47,0006 Toluene (methylbenzene) 32,712 590 33,0007 Formaldehyde (methyl aldehyde) 24,535 25,0008 Xylenes (individual or mixed isomers) 22,183 166 22,0009 Acetaldehyde 18,448 18,000
10 Benzene 16,018 639 17,00011 Acetone 14,947 15,00012 n-Hexane 8,997 355 9,40013 Cyclohexane 5,972 14 6,00014 Methanol 4,950 5,00015 Ethylbenzene 3,041 14 3,10016 Polycyclic aromatic hydrocarbons 2,401 2,40017 1,3-Butadiene (vinyl ethylene) 2,255 2.2 2,30018 Ammonia (total) 2,131 2,10019 Trichloroethylene 1,303 1,30020 Tetrachloroethylene 986 99021 Lead & compounds 860 86022 Methyl ethyl ketone 713 71023 Ethylene glycol (1,2-ethanediol) 706 71024 Styrene (ethenylbenzene) 678 68025 Dichloromethane 619 62026 Zinc and compounds 547 55027 Manganese & compounds 540 54028 2-Ethoxyethanol acetate 348 35029 Methyl isobutyl ketone 226 23030 Ethanol 165 17031 Ethylene oxide 112 11032 Copper & compounds 78 12 9033 Cumene (1-methylethylbenzene) 84 8434 Ethyl acetate 82 8235 Chromium (VI) compounds 78 7836 Nickel & compounds 75 7537 Cobalt & compounds 71 7138 Arsenic & compounds 34 3439 Chromium (III) compounds 17 1740 Hydrogen sulfide 16 1641 Cadmium & compounds 13 1342 Mercury & compounds 11.0 11.043 Phenol 9.6 9.644 Antimony & compounds 7.9 7.945 Chloroform (trichloromethane) 5.5 5.546 Fluoride compounds 2.1 2.147 Selenium & compounds 2.0 2.048 Hydrochloric acid 0.66 0.6649 Beryllium & compounds 0.41 0.4150 1,2-Dibromoethane 0.3 0.3051 Biphenyl (1,1�-biphenyl) 0.21 0.2152 Cyanide (inorganic) compounds 0.034 0.03453 1,2-Dichloroethane 0.026 0.02654 Carbon disulfide 0.0018 0.001855 Di-(2-Ethylhexyl) phthalate (DEHP) 0.0010 0.001056 Acrylic acid 0.000022 0.000022
� Total emissions to 2 significant figures
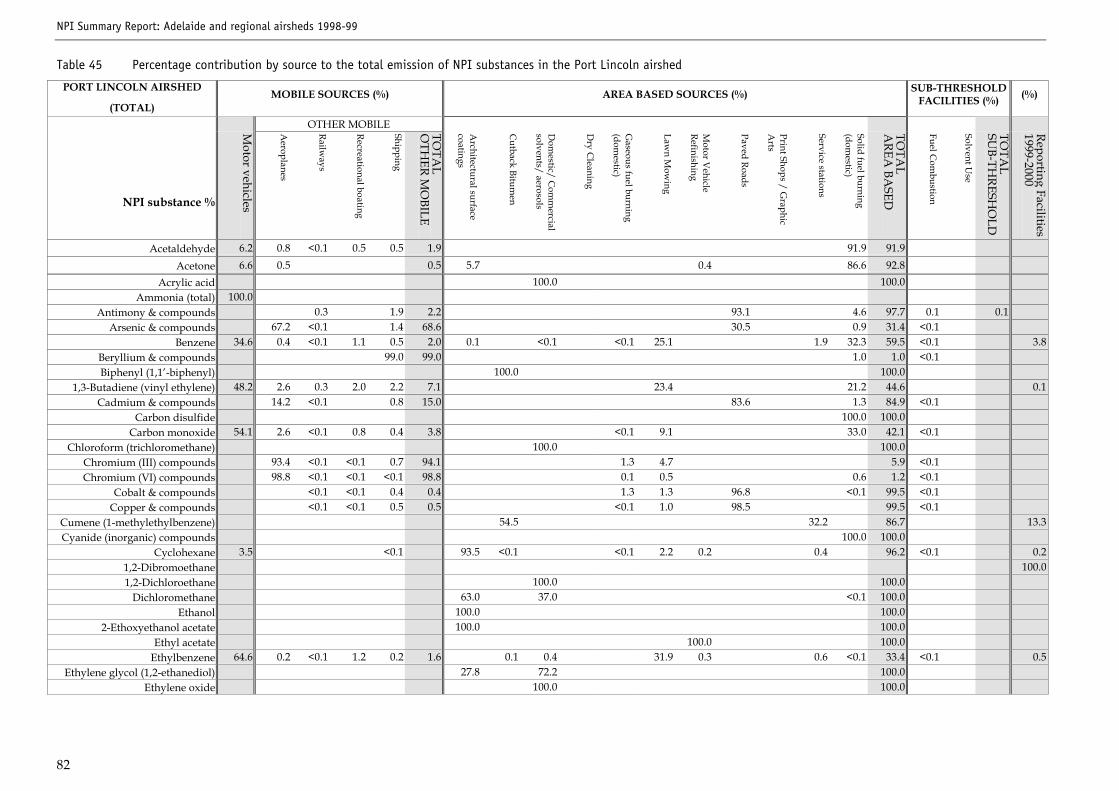
NPI Summary Report: Adelaide and regional airsheds 1998-99
82
Table 45 Percentage contribution by source to the total emission of NPI substances in the Port Lincoln airshed
PORT LINCOLN AIRSHED
(TOTAL)MOBILE SOURCES (%) AREA BASED SOURCES (%) SUB-THRESHOLD
FACILITIES (%) (%)
OTHER MOBILE
NPI substance %
Motor vehicles
Aeroplanes
Railways
Recreational boating
Shipping
TOTA
LO
THER M
OBILE
Architectural surface
coatings
Cutback Bitum
en
Dom
estic/ Com
mercial
solvents/ aerosols
Dry C
leaning
Gaseous fuel burning
(domestic)
Lawn M
owing
Motor V
ehicleRefinishing
Paved Roads
Print Shops / Graphic
Arts
Service stations
Solid fuel burning(dom
estic)
TOTA
LA
REA BA
SED
Fuel Com
bustion
Solvent Use
TOTA
LSU
B-THRESH
OLD
Reporting Facilities1999-2000
Acetaldehyde 6.2 0.8 <0.1 0.5 0.5 1.9 91.9 91.9Acetone 6.6 0.5 0.5 5.7 0.4 86.6 92.8
Acrylic acid 100.0 100.0Ammonia (total) 100.0
Antimony & compounds 0.3 1.9 2.2 93.1 4.6 97.7 0.1 0.1Arsenic & compounds 67.2 <0.1 1.4 68.6 30.5 0.9 31.4 <0.1
Benzene 34.6 0.4 <0.1 1.1 0.5 2.0 0.1 <0.1 <0.1 25.1 1.9 32.3 59.5 <0.1 3.8Beryllium & compounds 99.0 99.0 1.0 1.0 <0.1Biphenyl (1,1�-biphenyl) 100.0 100.0
1,3-Butadiene (vinyl ethylene) 48.2 2.6 0.3 2.0 2.2 7.1 23.4 21.2 44.6 0.1Cadmium & compounds 14.2 <0.1 0.8 15.0 83.6 1.3 84.9 <0.1
Carbon disulfide 100.0 100.0Carbon monoxide 54.1 2.6 <0.1 0.8 0.4 3.8 <0.1 9.1 33.0 42.1 <0.1
Chloroform (trichloromethane) 100.0 100.0Chromium (III) compounds 93.4 <0.1 <0.1 0.7 94.1 1.3 4.7 5.9 <0.1Chromium (VI) compounds 98.8 <0.1 <0.1 <0.1 98.8 0.1 0.5 0.6 1.2 <0.1
Cobalt & compounds <0.1 <0.1 0.4 0.4 1.3 1.3 96.8 <0.1 99.5 <0.1Copper & compounds <0.1 <0.1 0.5 0.5 <0.1 1.0 98.5 99.5 <0.1
Cumene (1-methylethylbenzene) 54.5 32.2 86.7 13.3Cyanide (inorganic) compounds 100.0 100.0
Cyclohexane 3.5 <0.1 93.5 <0.1 <0.1 2.2 0.2 0.4 96.2 <0.1 0.21,2-Dibromoethane 100.01,2-Dichloroethane 100.0 100.0
Dichloromethane 63.0 37.0 <0.1 100.0Ethanol 100.0 100.0
2-Ethoxyethanol acetate 100.0 100.0Ethyl acetate 100.0 100.0
Ethylbenzene 64.6 0.2 <0.1 1.2 0.2 1.6 0.1 0.4 31.9 0.3 0.6 <0.1 33.4 <0.1 0.5Ethylene glycol (1,2-ethanediol) 27.8 72.2 100.0
Ethylene oxide 100.0 100.0
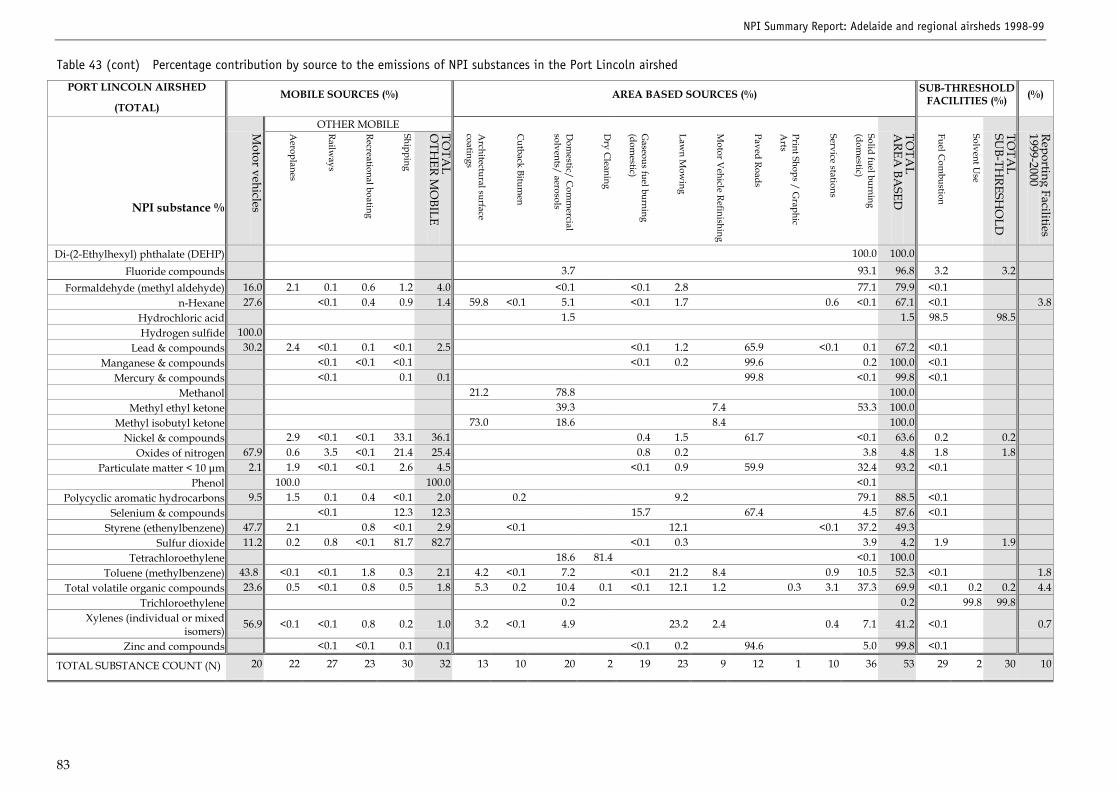
NPI Summary Report: Adelaide and regional airsheds 1998-99
83
Table 43 (cont) Percentage contribution by source to the emissions of NPI substances in the Port Lincoln airshed
PORT LINCOLN AIRSHED
(TOTAL)MOBILE SOURCES (%) AREA BASED SOURCES (%) SUB-THRESHOLD
FACILITIES (%) (%)
OTHER MOBILE
NPI substance %
Motor vehicles
Aeroplanes
Railways
Recreational boating
Shipping
TOTA
LO
THER M
OBILE
Architectural surface
coatings
Cutback Bitum
en
Dom
estic/ Com
mercial
solvents/ aerosols
Dry C
leaning
Gaseous fuel burning
(domestic)
Lawn M
owing
Motor V
ehicle Refinishing
Paved Roads
Print Shops / Graphic
Arts
Service stations
Solid fuel burning(dom
estic)
TOTA
LA
REA BA
SED
Fuel Com
bustion
Solvent Use
TOTA
LSU
B-THRESH
OLD
Reporting Facilities1999-2000
Di-(2-Ethylhexyl) phthalate (DEHP) 100.0 100.0Fluoride compounds 3.7 93.1 96.8 3.2 3.2
Formaldehyde (methyl aldehyde) 16.0 2.1 0.1 0.6 1.2 4.0 <0.1 <0.1 2.8 77.1 79.9 <0.1n-Hexane 27.6 <0.1 0.4 0.9 1.4 59.8 <0.1 5.1 <0.1 1.7 0.6 <0.1 67.1 <0.1 3.8
Hydrochloric acid 1.5 1.5 98.5 98.5Hydrogen sulfide 100.0
Lead & compounds 30.2 2.4 <0.1 0.1 <0.1 2.5 <0.1 1.2 65.9 <0.1 0.1 67.2 <0.1Manganese & compounds <0.1 <0.1 <0.1 <0.1 0.2 99.6 0.2 100.0 <0.1
Mercury & compounds <0.1 0.1 0.1 99.8 <0.1 99.8 <0.1Methanol 21.2 78.8 100.0
Methyl ethyl ketone 39.3 7.4 53.3 100.0Methyl isobutyl ketone 73.0 18.6 8.4 100.0
Nickel & compounds 2.9 <0.1 <0.1 33.1 36.1 0.4 1.5 61.7 <0.1 63.6 0.2 0.2Oxides of nitrogen 67.9 0.6 3.5 <0.1 21.4 25.4 0.8 0.2 3.8 4.8 1.8 1.8
Particulate matter < 10 µm 2.1 1.9 <0.1 <0.1 2.6 4.5 <0.1 0.9 59.9 32.4 93.2 <0.1Phenol 100.0 100.0 <0.1
Polycyclic aromatic hydrocarbons 9.5 1.5 0.1 0.4 <0.1 2.0 0.2 9.2 79.1 88.5 <0.1Selenium & compounds <0.1 12.3 12.3 15.7 67.4 4.5 87.6 <0.1
Styrene (ethenylbenzene) 47.7 2.1 0.8 <0.1 2.9 <0.1 12.1 <0.1 37.2 49.3Sulfur dioxide 11.2 0.2 0.8 <0.1 81.7 82.7 <0.1 0.3 3.9 4.2 1.9 1.9
Tetrachloroethylene 18.6 81.4 <0.1 100.0Toluene (methylbenzene) 43.8 <0.1 <0.1 1.8 0.3 2.1 4.2 <0.1 7.2 <0.1 21.2 8.4 0.9 10.5 52.3 <0.1 1.8
Total volatile organic compounds 23.6 0.5 <0.1 0.8 0.5 1.8 5.3 0.2 10.4 0.1 <0.1 12.1 1.2 0.3 3.1 37.3 69.9 <0.1 0.2 0.2 4.4Trichloroethylene 0.2 0.2 99.8 99.8
Xylenes (individual or mixedisomers)
56.9 <0.1 <0.1 0.8 0.2 1.0 3.2 <0.1 4.9 23.2 2.4 0.4 7.1 41.2 <0.1 0.7
Zinc and compounds <0.1 <0.1 0.1 0.1 <0.1 0.2 94.6 5.0 99.8 <0.1
TOTAL SUBSTANCE COUNT (N) 20 22 27 23 30 32 13 10 20 2 19 23 9 12 1 10 36 53 29 2 30 10
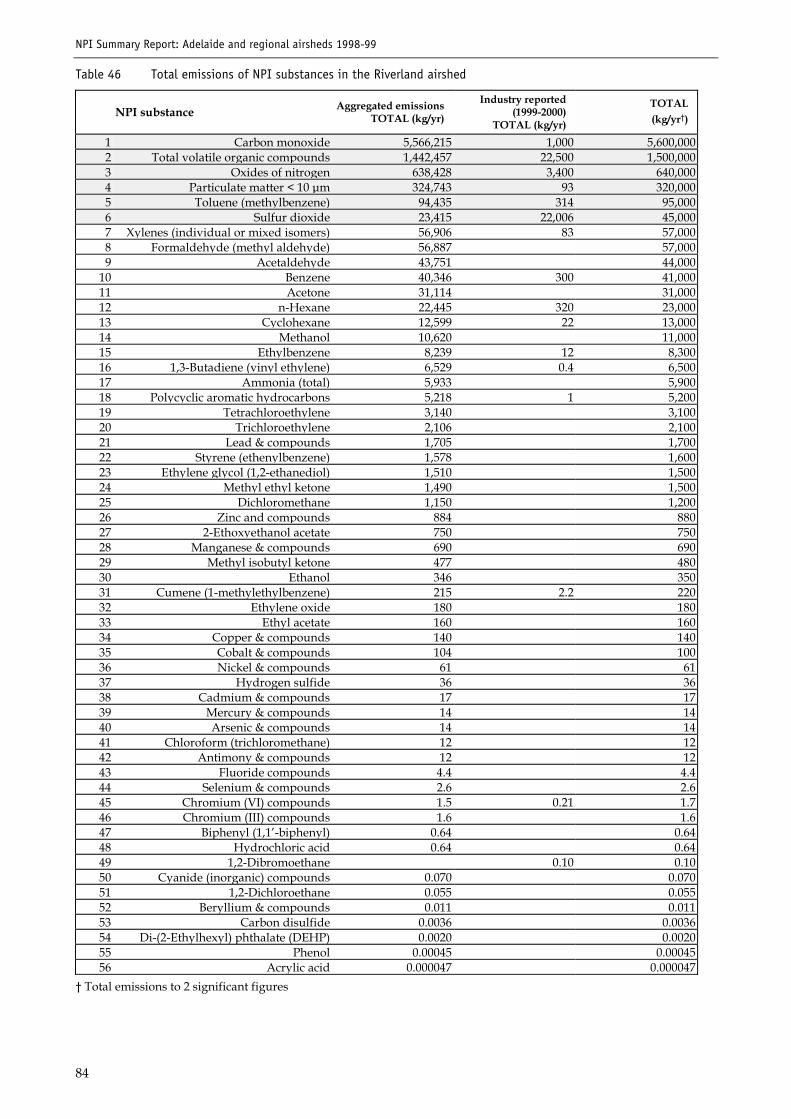
NPI Summary Report: Adelaide and regional airsheds 1998-99
84
Table 46 Total emissions of NPI substances in the Riverland airshed
NPI substance Aggregated emissionsTOTAL (kg/yr)
Industry reported(1999-2000)
TOTAL (kg/yr)
TOTAL(kg/yr�)
1 Carbon monoxide 5,566,215 1,000 5,600,0002 Total volatile organic compounds 1,442,457 22,500 1,500,0003 Oxides of nitrogen 638,428 3,400 640,0004 Particulate matter < 10 µm 324,743 93 320,0005 Toluene (methylbenzene) 94,435 314 95,0006 Sulfur dioxide 23,415 22,006 45,0007 Xylenes (individual or mixed isomers) 56,906 83 57,0008 Formaldehyde (methyl aldehyde) 56,887 57,0009 Acetaldehyde 43,751 44,000
10 Benzene 40,346 300 41,00011 Acetone 31,114 31,00012 n-Hexane 22,445 320 23,00013 Cyclohexane 12,599 22 13,00014 Methanol 10,620 11,00015 Ethylbenzene 8,239 12 8,30016 1,3-Butadiene (vinyl ethylene) 6,529 0.4 6,50017 Ammonia (total) 5,933 5,90018 Polycyclic aromatic hydrocarbons 5,218 1 5,20019 Tetrachloroethylene 3,140 3,10020 Trichloroethylene 2,106 2,10021 Lead & compounds 1,705 1,70022 Styrene (ethenylbenzene) 1,578 1,60023 Ethylene glycol (1,2-ethanediol) 1,510 1,50024 Methyl ethyl ketone 1,490 1,50025 Dichloromethane 1,150 1,20026 Zinc and compounds 884 88027 2-Ethoxyethanol acetate 750 75028 Manganese & compounds 690 69029 Methyl isobutyl ketone 477 48030 Ethanol 346 35031 Cumene (1-methylethylbenzene) 215 2.2 22032 Ethylene oxide 180 18033 Ethyl acetate 160 16034 Copper & compounds 140 14035 Cobalt & compounds 104 10036 Nickel & compounds 61 6137 Hydrogen sulfide 36 3638 Cadmium & compounds 17 1739 Mercury & compounds 14 1440 Arsenic & compounds 14 1441 Chloroform (trichloromethane) 12 1242 Antimony & compounds 12 1243 Fluoride compounds 4.4 4.444 Selenium & compounds 2.6 2.645 Chromium (VI) compounds 1.5 0.21 1.746 Chromium (III) compounds 1.6 1.647 Biphenyl (1,1�-biphenyl) 0.64 0.6448 Hydrochloric acid 0.64 0.6449 1,2-Dibromoethane 0.10 0.1050 Cyanide (inorganic) compounds 0.070 0.07051 1,2-Dichloroethane 0.055 0.05552 Beryllium & compounds 0.011 0.01153 Carbon disulfide 0.0036 0.003654 Di-(2-Ethylhexyl) phthalate (DEHP) 0.0020 0.002055 Phenol 0.00045 0.0004556 Acrylic acid 0.000047 0.000047
� Total emissions to 2 significant figures
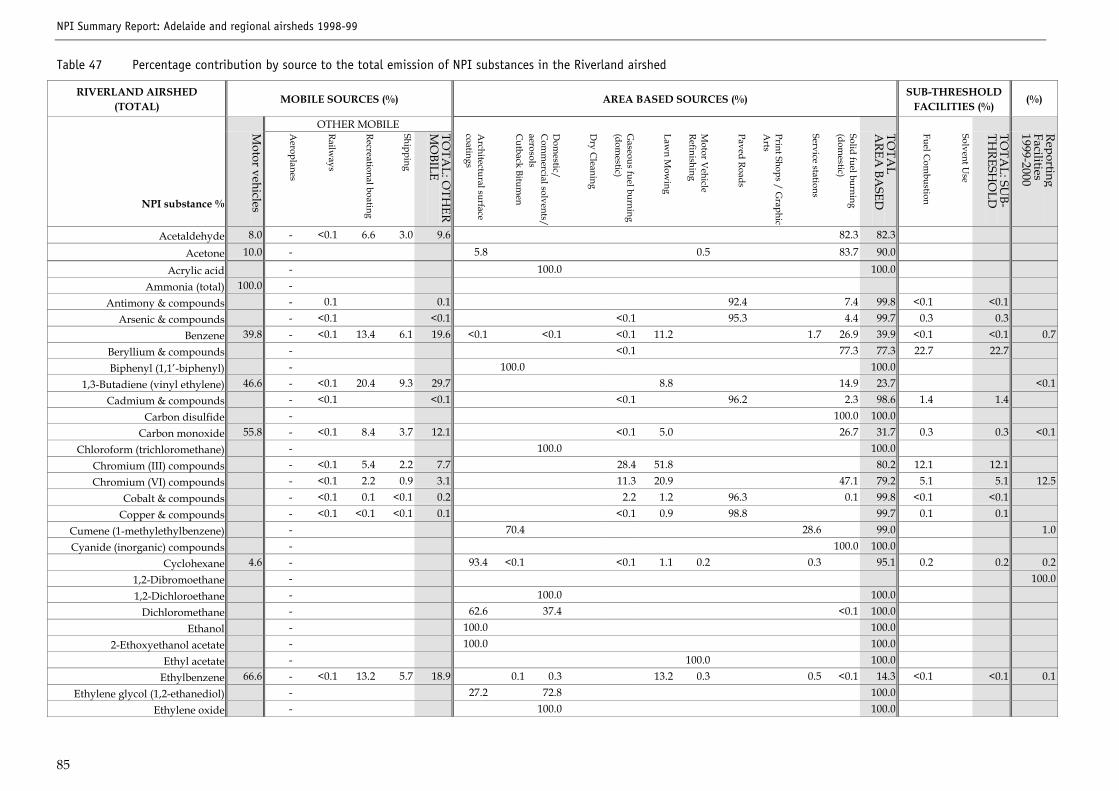
NPI Summary Report: Adelaide and regional airsheds 1998-99
85
Table 47 Percentage contribution by source to the total emission of NPI substances in the Riverland airshed
RIVERLAND AIRSHED(TOTAL)
MOBILE SOURCES (%) AREA BASED SOURCES (%)SUB-THRESHOLD
FACILITIES (%)(%)
OTHER MOBILE
NPI substance %
Motor vehicles
Aeroplanes
Railways
Recreational boating
Shipping
TOTA
L: OTH
ERM
OBILE
Architectural surface
coatings
Cutback Bitum
en
Dom
estic/C
omm
ercial solvents/aerosols
Dry C
leaning
Gaseous fuel burning
(domestic)
Lawn M
owing
Motor V
ehicleRefinishing
Paved Roads
Print Shops / Graphic
Arts
Service stations
Solid fuel burning(dom
estic)
TOTA
LA
REA BA
SED
Fuel Com
bustion
Solvent Use
TOTA
L: SUB-
THRESH
OLD
ReportingFacilities1999-2000
Acetaldehyde 8.0 - <0.1 6.6 3.0 9.6 82.3 82.3
Acetone 10.0 - 5.8 0.5 83.7 90.0
Acrylic acid - 100.0 100.0Ammonia (total) 100.0 -
Antimony & compounds - 0.1 0.1 92.4 7.4 99.8 <0.1 <0.1Arsenic & compounds - <0.1 <0.1 <0.1 95.3 4.4 99.7 0.3 0.3
Benzene 39.8 - <0.1 13.4 6.1 19.6 <0.1 <0.1 <0.1 11.2 1.7 26.9 39.9 <0.1 <0.1 0.7Beryllium & compounds - <0.1 77.3 77.3 22.7 22.7Biphenyl (1,1�-biphenyl) - 100.0 100.0
1,3-Butadiene (vinyl ethylene) 46.6 - <0.1 20.4 9.3 29.7 8.8 14.9 23.7 <0.1Cadmium & compounds - <0.1 <0.1 <0.1 96.2 2.3 98.6 1.4 1.4
Carbon disulfide - 100.0 100.0Carbon monoxide 55.8 - <0.1 8.4 3.7 12.1 <0.1 5.0 26.7 31.7 0.3 0.3 <0.1
Chloroform (trichloromethane) - 100.0 100.0Chromium (III) compounds - <0.1 5.4 2.2 7.7 28.4 51.8 80.2 12.1 12.1Chromium (VI) compounds - <0.1 2.2 0.9 3.1 11.3 20.9 47.1 79.2 5.1 5.1 12.5
Cobalt & compounds - <0.1 0.1 <0.1 0.2 2.2 1.2 96.3 0.1 99.8 <0.1 <0.1Copper & compounds - <0.1 <0.1 <0.1 0.1 <0.1 0.9 98.8 99.7 0.1 0.1
Cumene (1-methylethylbenzene) - 70.4 28.6 99.0 1.0Cyanide (inorganic) compounds - 100.0 100.0
Cyclohexane 4.6 - 93.4 <0.1 <0.1 1.1 0.2 0.3 95.1 0.2 0.2 0.21,2-Dibromoethane - 100.01,2-Dichloroethane - 100.0 100.0
Dichloromethane - 62.6 37.4 <0.1 100.0Ethanol - 100.0 100.0
2-Ethoxyethanol acetate - 100.0 100.0Ethyl acetate - 100.0 100.0
Ethylbenzene 66.6 - <0.1 13.2 5.7 18.9 0.1 0.3 13.2 0.3 0.5 <0.1 14.3 <0.1 <0.1 0.1Ethylene glycol (1,2-ethanediol) - 27.2 72.8 100.0
Ethylene oxide - 100.0 100.0
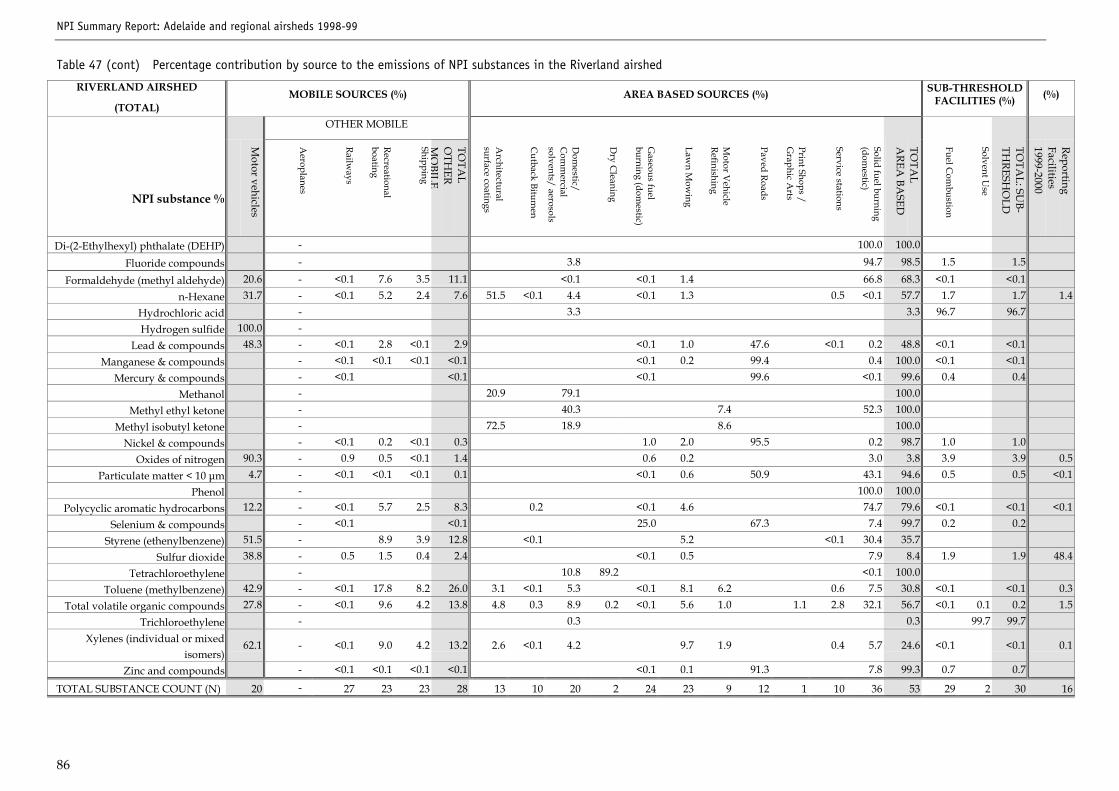
NPI Summary Report: Adelaide and regional airsheds 1998-99
86
Table 47 (cont) Percentage contribution by source to the emissions of NPI substances in the Riverland airshed
RIVERLAND AIRSHED
(TOTAL)MOBILE SOURCES (%) AREA BASED SOURCES (%) SUB-THRESHOLD
FACILITIES (%) (%)
OTHER MOBILE
NPI substance %
Motor vehicles
Aeroplanes
Railways
Recreationalboating
Shipping
TOTA
LO
THER
MO
BILE
Architectural
surface coatings
Cutback Bitum
en
Dom
estic/C
omm
ercialsolvents/ aerosols
Dry C
leaning
Gaseous fuel
burning (domestic)
Lawn M
owing
Motor V
ehicleRefinishing
Paved Roads
Print Shops /G
raphic Arts
Service stations
Solid fuel burning(dom
estic)
TOTA
LA
REA BA
SED
Fuel Com
bustion
Solvent Use
TOTA
L: SUB-
THRESH
OLD
ReportingFacilities1999-2000
Di-(2-Ethylhexyl) phthalate (DEHP) - 100.0 100.0
Fluoride compounds - 3.8 94.7 98.5 1.5 1.5
Formaldehyde (methyl aldehyde) 20.6 - <0.1 7.6 3.5 11.1 <0.1 <0.1 1.4 66.8 68.3 <0.1 <0.1n-Hexane 31.7 - <0.1 5.2 2.4 7.6 51.5 <0.1 4.4 <0.1 1.3 0.5 <0.1 57.7 1.7 1.7 1.4
Hydrochloric acid - 3.3 3.3 96.7 96.7Hydrogen sulfide 100.0 -
Lead & compounds 48.3 - <0.1 2.8 <0.1 2.9 <0.1 1.0 47.6 <0.1 0.2 48.8 <0.1 <0.1Manganese & compounds - <0.1 <0.1 <0.1 <0.1 <0.1 0.2 99.4 0.4 100.0 <0.1 <0.1
Mercury & compounds - <0.1 <0.1 <0.1 99.6 <0.1 99.6 0.4 0.4Methanol - 20.9 79.1 100.0
Methyl ethyl ketone - 40.3 7.4 52.3 100.0Methyl isobutyl ketone - 72.5 18.9 8.6 100.0
Nickel & compounds - <0.1 0.2 <0.1 0.3 1.0 2.0 95.5 0.2 98.7 1.0 1.0Oxides of nitrogen 90.3 - 0.9 0.5 <0.1 1.4 0.6 0.2 3.0 3.8 3.9 3.9 0.5
Particulate matter < 10 µm 4.7 - <0.1 <0.1 <0.1 0.1 <0.1 0.6 50.9 43.1 94.6 0.5 0.5 <0.1Phenol - 100.0 100.0
Polycyclic aromatic hydrocarbons 12.2 - <0.1 5.7 2.5 8.3 0.2 <0.1 4.6 74.7 79.6 <0.1 <0.1 <0.1Selenium & compounds - <0.1 <0.1 25.0 67.3 7.4 99.7 0.2 0.2
Styrene (ethenylbenzene) 51.5 - 8.9 3.9 12.8 <0.1 5.2 <0.1 30.4 35.7Sulfur dioxide 38.8 - 0.5 1.5 0.4 2.4 <0.1 0.5 7.9 8.4 1.9 1.9 48.4
Tetrachloroethylene - 10.8 89.2 <0.1 100.0Toluene (methylbenzene) 42.9 - <0.1 17.8 8.2 26.0 3.1 <0.1 5.3 <0.1 8.1 6.2 0.6 7.5 30.8 <0.1 <0.1 0.3
Total volatile organic compounds 27.8 - <0.1 9.6 4.2 13.8 4.8 0.3 8.9 0.2 <0.1 5.6 1.0 1.1 2.8 32.1 56.7 <0.1 0.1 0.2 1.5Trichloroethylene - 0.3 0.3 99.7 99.7
Xylenes (individual or mixedisomers)
62.1 - <0.1 9.0 4.2 13.2 2.6 <0.1 4.2 9.7 1.9 0.4 5.7 24.6 <0.1 <0.1 0.1
Zinc and compounds - <0.1 <0.1 <0.1 <0.1 <0.1 0.1 91.3 7.8 99.3 0.7 0.7
TOTAL SUBSTANCE COUNT (N) 20 - 27 23 23 28 13 10 20 2 24 23 9 12 1 10 36 53 29 2 30 16
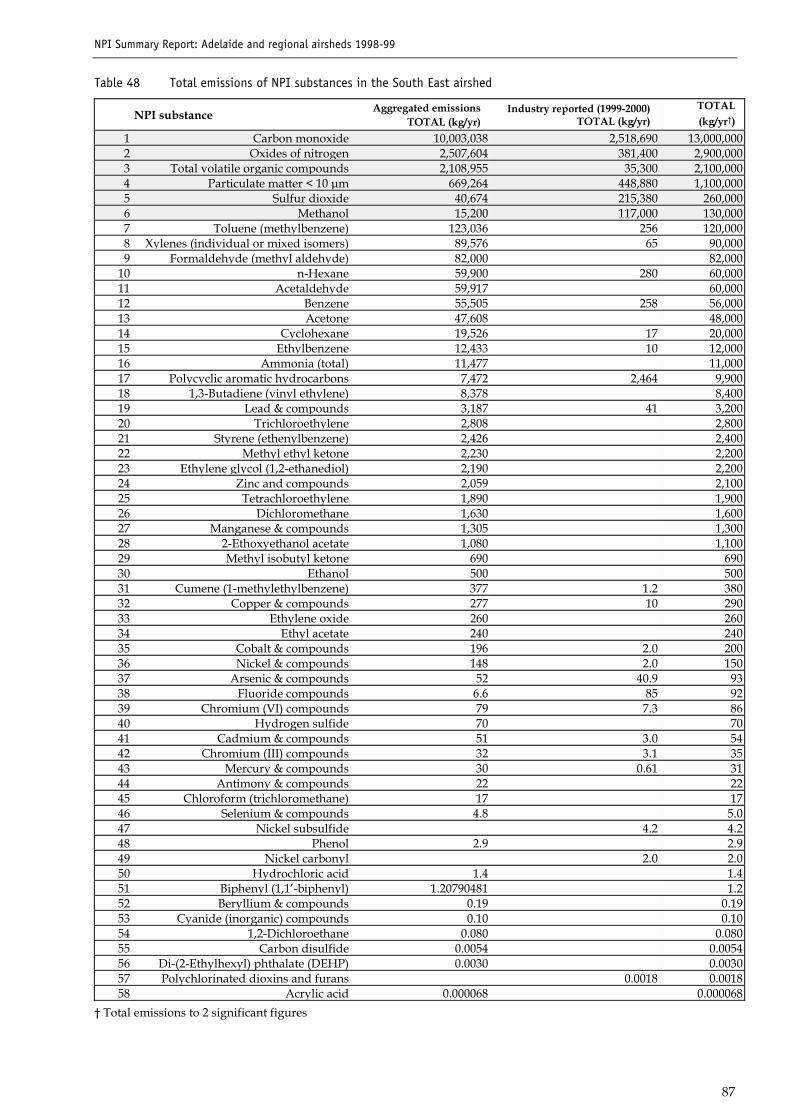
NPI Summary Report: Adelaide and regional airsheds 1998-99
87
Table 48 Total emissions of NPI substances in the South East airshed
NPI substance Aggregated emissionsTOTAL (kg/yr)
Industry reported (1999-2000)TOTAL (kg/yr)
TOTAL(kg/yr�)
1 Carbon monoxide 10,003,038 2,518,690 13,000,0002 Oxides of nitrogen 2,507,604 381,400 2,900,0003 Total volatile organic compounds 2,108,955 35,300 2,100,0004 Particulate matter < 10 µm 669,264 448,880 1,100,0005 Sulfur dioxide 40,674 215,380 260,0006 Methanol 15,200 117,000 130,0007 Toluene (methylbenzene) 123,036 256 120,0008 Xylenes (individual or mixed isomers) 89,576 65 90,0009 Formaldehyde (methyl aldehyde) 82,000 82,000
10 n-Hexane 59,900 280 60,00011 Acetaldehyde 59,917 60,00012 Benzene 55,505 258 56,00013 Acetone 47,608 48,00014 Cyclohexane 19,526 17 20,00015 Ethylbenzene 12,433 10 12,00016 Ammonia (total) 11,477 11,00017 Polycyclic aromatic hydrocarbons 7,472 2,464 9,90018 1,3-Butadiene (vinyl ethylene) 8,378 8,40019 Lead & compounds 3,187 41 3,20020 Trichloroethylene 2,808 2,80021 Styrene (ethenylbenzene) 2,426 2,40022 Methyl ethyl ketone 2,230 2,20023 Ethylene glycol (1,2-ethanediol) 2,190 2,20024 Zinc and compounds 2,059 2,10025 Tetrachloroethylene 1,890 1,90026 Dichloromethane 1,630 1,60027 Manganese & compounds 1,305 1,30028 2-Ethoxyethanol acetate 1,080 1,10029 Methyl isobutyl ketone 690 69030 Ethanol 500 50031 Cumene (1-methylethylbenzene) 377 1.2 38032 Copper & compounds 277 10 29033 Ethylene oxide 260 26034 Ethyl acetate 240 24035 Cobalt & compounds 196 2.0 20036 Nickel & compounds 148 2.0 15037 Arsenic & compounds 52 40.9 9338 Fluoride compounds 6.6 85 9239 Chromium (VI) compounds 79 7.3 8640 Hydrogen sulfide 70 7041 Cadmium & compounds 51 3.0 5442 Chromium (III) compounds 32 3.1 3543 Mercury & compounds 30 0.61 3144 Antimony & compounds 22 2245 Chloroform (trichloromethane) 17 1746 Selenium & compounds 4.8 5.047 Nickel subsulfide 4.2 4.248 Phenol 2.9 2.949 Nickel carbonyl 2.0 2.050 Hydrochloric acid 1.4 1.451 Biphenyl (1,1�-biphenyl) 1.20790481 1.252 Beryllium & compounds 0.19 0.1953 Cyanide (inorganic) compounds 0.10 0.1054 1,2-Dichloroethane 0.080 0.08055 Carbon disulfide 0.0054 0.005456 Di-(2-Ethylhexyl) phthalate (DEHP) 0.0030 0.003057 Polychlorinated dioxins and furans 0.0018 0.001858 Acrylic acid 0.000068 0.000068
� Total emissions to 2 significant figures
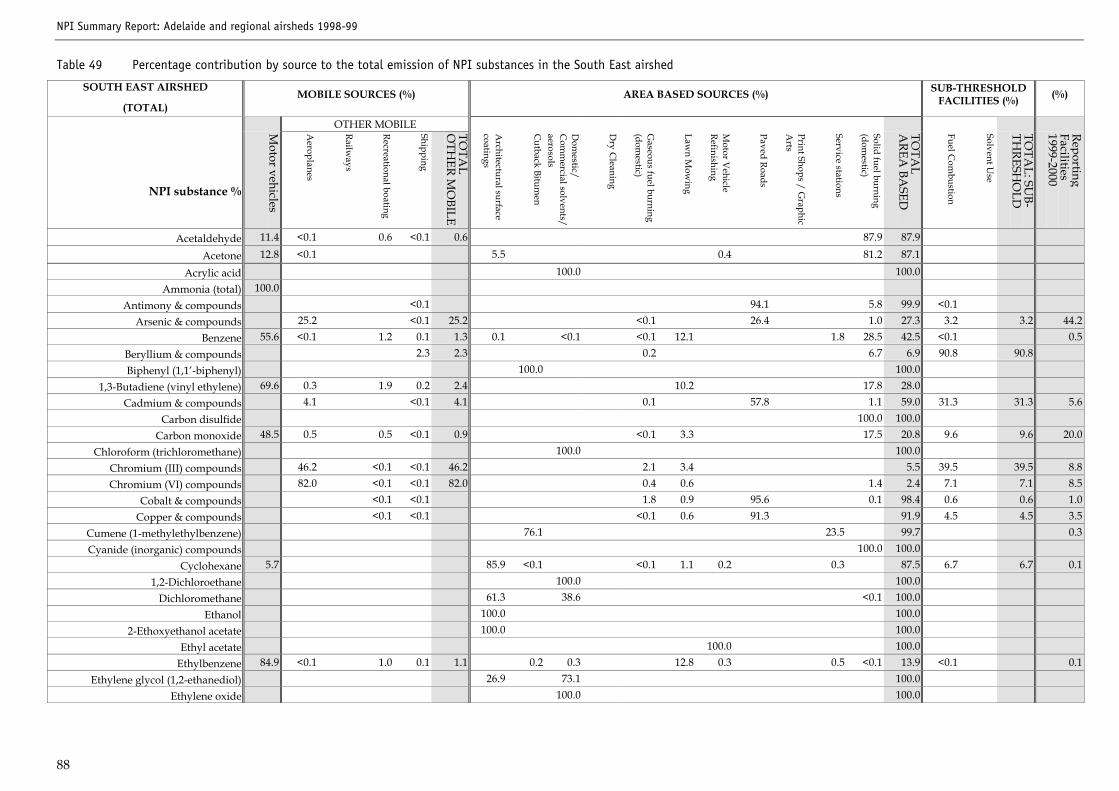
NPI Summary Report: Adelaide and regional airsheds 1998-99
88
Table 49 Percentage contribution by source to the total emission of NPI substances in the South East airshed
SOUTH EAST AIRSHED
(TOTAL)MOBILE SOURCES (%) AREA BASED SOURCES (%) SUB-THRESHOLD
FACILITIES (%) (%)
OTHER MOBILE
NPI substance %
Motor vehicles
Aeroplanes
Railways
Recreational boating
Shipping
TOTA
LO
THER M
OBILE
Architectural surface
coatings
Cutback Bitum
en
Dom
estic/C
omm
ercial solvents/aerosols
Dry C
leaning
Gaseous fuel burning
(domestic)
Lawn M
owing
Motor V
ehicleRefinishing
Paved Roads
Print Shops / Graphic
Arts
Service stations
Solid fuel burning(dom
estic)
TOTA
LA
REA BA
SED
Fuel Com
bustion
Solvent Use
TOTA
L: SUB-
THRESH
OLD
ReportingFacilities1999-2000
Acetaldehyde 11.4 <0.1 0.6 <0.1 0.6 87.9 87.9
Acetone 12.8 <0.1 5.5 0.4 81.2 87.1
Acrylic acid 100.0 100.0Ammonia (total) 100.0
Antimony & compounds <0.1 94.1 5.8 99.9 <0.1Arsenic & compounds 25.2 <0.1 25.2 <0.1 26.4 1.0 27.3 3.2 3.2 44.2
Benzene 55.6 <0.1 1.2 0.1 1.3 0.1 <0.1 <0.1 12.1 1.8 28.5 42.5 <0.1 0.5Beryllium & compounds 2.3 2.3 0.2 6.7 6.9 90.8 90.8Biphenyl (1,1�-biphenyl) 100.0 100.0
1,3-Butadiene (vinyl ethylene) 69.6 0.3 1.9 0.2 2.4 10.2 17.8 28.0Cadmium & compounds 4.1 <0.1 4.1 0.1 57.8 1.1 59.0 31.3 31.3 5.6
Carbon disulfide 100.0 100.0Carbon monoxide 48.5 0.5 0.5 <0.1 0.9 <0.1 3.3 17.5 20.8 9.6 9.6 20.0
Chloroform (trichloromethane) 100.0 100.0Chromium (III) compounds 46.2 <0.1 <0.1 46.2 2.1 3.4 5.5 39.5 39.5 8.8Chromium (VI) compounds 82.0 <0.1 <0.1 82.0 0.4 0.6 1.4 2.4 7.1 7.1 8.5
Cobalt & compounds <0.1 <0.1 1.8 0.9 95.6 0.1 98.4 0.6 0.6 1.0Copper & compounds <0.1 <0.1 <0.1 0.6 91.3 91.9 4.5 4.5 3.5
Cumene (1-methylethylbenzene) 76.1 23.5 99.7 0.3Cyanide (inorganic) compounds 100.0 100.0
Cyclohexane 5.7 85.9 <0.1 <0.1 1.1 0.2 0.3 87.5 6.7 6.7 0.11,2-Dichloroethane 100.0 100.0
Dichloromethane 61.3 38.6 <0.1 100.0Ethanol 100.0 100.0
2-Ethoxyethanol acetate 100.0 100.0Ethyl acetate 100.0 100.0
Ethylbenzene 84.9 <0.1 1.0 0.1 1.1 0.2 0.3 12.8 0.3 0.5 <0.1 13.9 <0.1 0.1Ethylene glycol (1,2-ethanediol) 26.9 73.1 100.0
Ethylene oxide 100.0 100.0
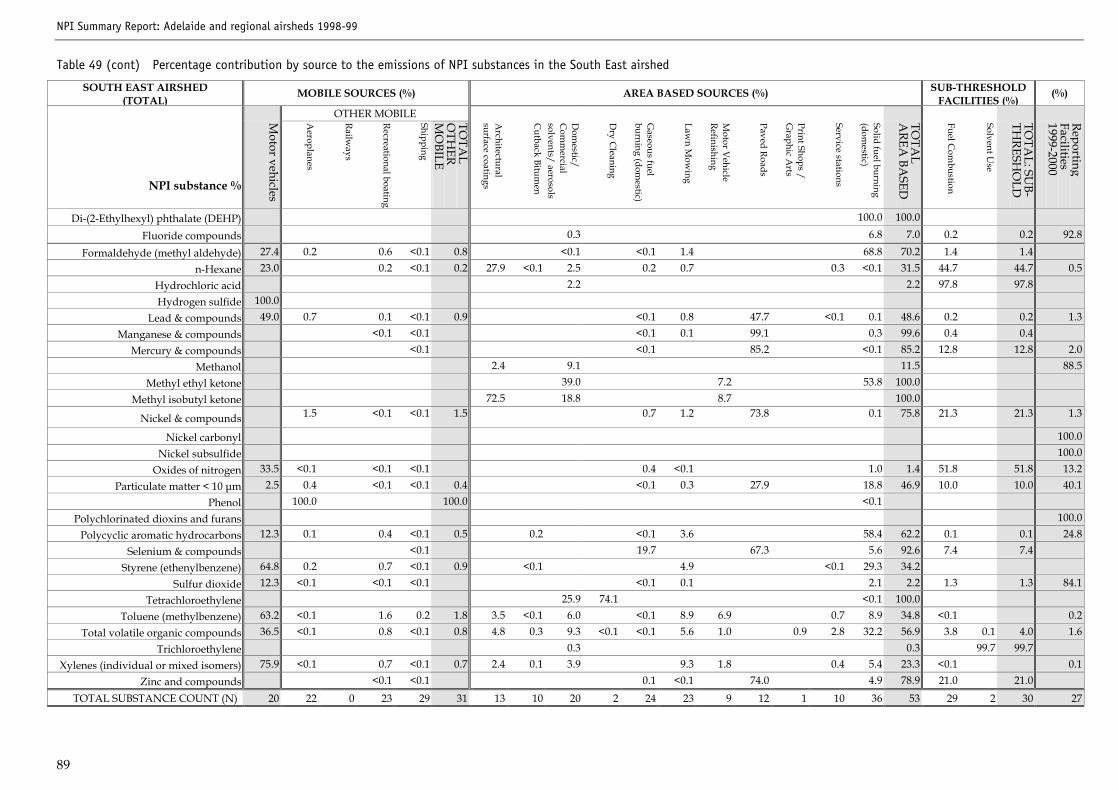
NPI Summary Report: Adelaide and regional airsheds 1998-99
89
Table 49 (cont) Percentage contribution by source to the emissions of NPI substances in the South East airshed
SOUTH EAST AIRSHED(TOTAL)
MOBILE SOURCES (%) AREA BASED SOURCES (%) SUB-THRESHOLDFACILITIES (%)
(%)
OTHER MOBILE
NPI substance %
Motor vehicles
Aeroplanes
Railways
Recreational boating
Shipping
TOTA
LO
THER
MO
BILE
Architectural
surface coatings
Cutback Bitum
en
Dom
estic/C
omm
ercialsolvents/ aerosols
Dry C
leaning
Gaseous fuel
burning (domestic)
Lawn M
owing
Motor V
ehicleRefinishing
Paved Roads
Print Shops /G
raphic Arts
Service stations
Solid fuel burning(dom
estic)
TOTA
LA
REA BA
SED
Fuel Com
bustion
Solvent Use
TOTA
L: SUB-
THRESH
OLD
ReportingFacilities1999-2000
Di-(2-Ethylhexyl) phthalate (DEHP) 100.0 100.0
Fluoride compounds 0.3 6.8 7.0 0.2 0.2 92.8
Formaldehyde (methyl aldehyde) 27.4 0.2 0.6 <0.1 0.8 <0.1 <0.1 1.4 68.8 70.2 1.4 1.4n-Hexane 23.0 0.2 <0.1 0.2 27.9 <0.1 2.5 0.2 0.7 0.3 <0.1 31.5 44.7 44.7 0.5
Hydrochloric acid 2.2 2.2 97.8 97.8Hydrogen sulfide 100.0
Lead & compounds 49.0 0.7 0.1 <0.1 0.9 <0.1 0.8 47.7 <0.1 0.1 48.6 0.2 0.2 1.3Manganese & compounds <0.1 <0.1 <0.1 0.1 99.1 0.3 99.6 0.4 0.4
Mercury & compounds <0.1 <0.1 85.2 <0.1 85.2 12.8 12.8 2.0Methanol 2.4 9.1 11.5 88.5
Methyl ethyl ketone 39.0 7.2 53.8 100.0Methyl isobutyl ketone 72.5 18.8 8.7 100.0
Nickel & compounds 1.5 <0.1 <0.1 1.5 0.7 1.2 73.8 0.1 75.8 21.3 21.3 1.3
Nickel carbonyl 100.0Nickel subsulfide 100.0
Oxides of nitrogen 33.5 <0.1 <0.1 <0.1 0.4 <0.1 1.0 1.4 51.8 51.8 13.2Particulate matter < 10 µm 2.5 0.4 <0.1 <0.1 0.4 <0.1 0.3 27.9 18.8 46.9 10.0 10.0 40.1
Phenol 100.0 100.0 <0.1Polychlorinated dioxins and furans 100.0
Polycyclic aromatic hydrocarbons 12.3 0.1 0.4 <0.1 0.5 0.2 <0.1 3.6 58.4 62.2 0.1 0.1 24.8Selenium & compounds <0.1 19.7 67.3 5.6 92.6 7.4 7.4
Styrene (ethenylbenzene) 64.8 0.2 0.7 <0.1 0.9 <0.1 4.9 <0.1 29.3 34.2Sulfur dioxide 12.3 <0.1 <0.1 <0.1 <0.1 0.1 2.1 2.2 1.3 1.3 84.1
Tetrachloroethylene 25.9 74.1 <0.1 100.0Toluene (methylbenzene) 63.2 <0.1 1.6 0.2 1.8 3.5 <0.1 6.0 <0.1 8.9 6.9 0.7 8.9 34.8 <0.1 0.2
Total volatile organic compounds 36.5 <0.1 0.8 <0.1 0.8 4.8 0.3 9.3 <0.1 <0.1 5.6 1.0 0.9 2.8 32.2 56.9 3.8 0.1 4.0 1.6Trichloroethylene 0.3 0.3 99.7 99.7
Xylenes (individual or mixed isomers) 75.9 <0.1 0.7 <0.1 0.7 2.4 0.1 3.9 9.3 1.8 0.4 5.4 23.3 <0.1 0.1Zinc and compounds <0.1 <0.1 0.1 <0.1 74.0 4.9 78.9 21.0 21.0
TOTAL SUBSTANCE COUNT (N) 20 22 0 23 29 31 13 10 20 2 24 23 9 12 1 10 36 53 29 2 30 27
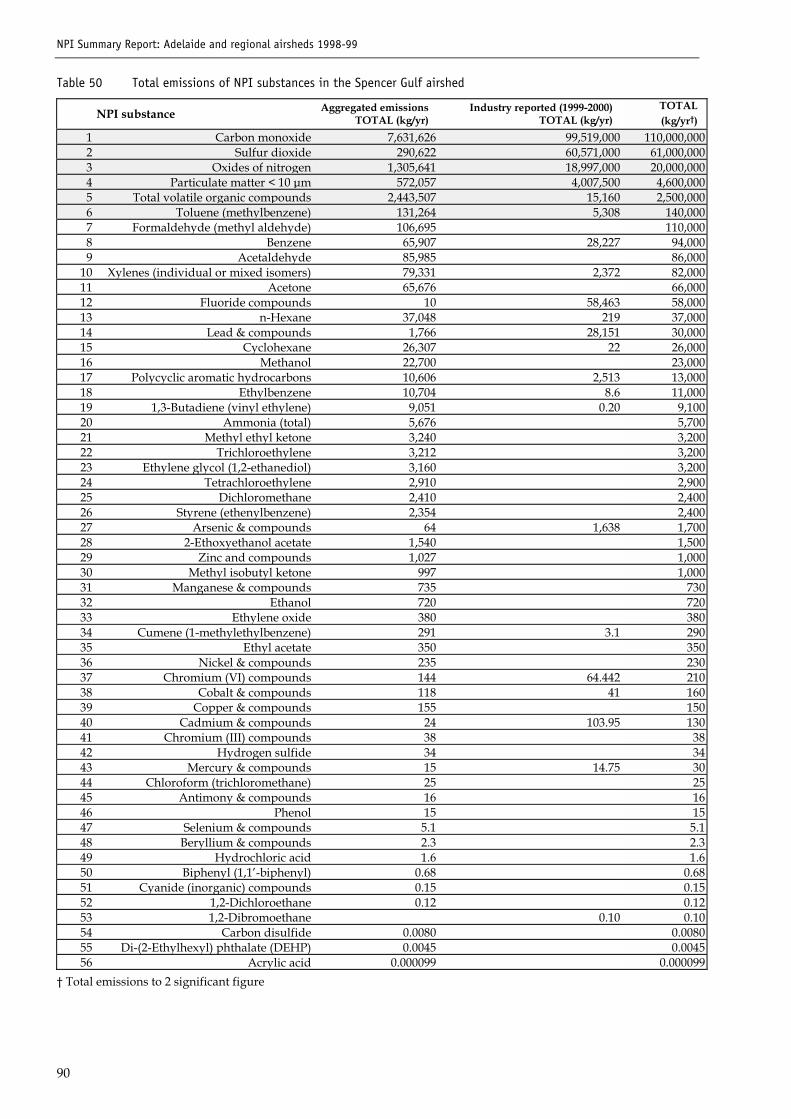
NPI Summary Report: Adelaide and regional airsheds 1998-99
90
Table 50 Total emissions of NPI substances in the Spencer Gulf airshed
NPI substance Aggregated emissionsTOTAL (kg/yr)
Industry reported (1999-2000)TOTAL (kg/yr)
TOTAL(kg/yr�)
1 Carbon monoxide 7,631,626 99,519,000 110,000,0002 Sulfur dioxide 290,622 60,571,000 61,000,0003 Oxides of nitrogen 1,305,641 18,997,000 20,000,0004 Particulate matter < 10 µm 572,057 4,007,500 4,600,0005 Total volatile organic compounds 2,443,507 15,160 2,500,0006 Toluene (methylbenzene) 131,264 5,308 140,0007 Formaldehyde (methyl aldehyde) 106,695 110,0008 Benzene 65,907 28,227 94,0009 Acetaldehyde 85,985 86,000
10 Xylenes (individual or mixed isomers) 79,331 2,372 82,00011 Acetone 65,676 66,00012 Fluoride compounds 10 58,463 58,00013 n-Hexane 37,048 219 37,00014 Lead & compounds 1,766 28,151 30,00015 Cyclohexane 26,307 22 26,00016 Methanol 22,700 23,00017 Polycyclic aromatic hydrocarbons 10,606 2,513 13,00018 Ethylbenzene 10,704 8.6 11,00019 1,3-Butadiene (vinyl ethylene) 9,051 0.20 9,10020 Ammonia (total) 5,676 5,70021 Methyl ethyl ketone 3,240 3,20022 Trichloroethylene 3,212 3,20023 Ethylene glycol (1,2-ethanediol) 3,160 3,20024 Tetrachloroethylene 2,910 2,90025 Dichloromethane 2,410 2,40026 Styrene (ethenylbenzene) 2,354 2,40027 Arsenic & compounds 64 1,638 1,70028 2-Ethoxyethanol acetate 1,540 1,50029 Zinc and compounds 1,027 1,00030 Methyl isobutyl ketone 997 1,00031 Manganese & compounds 735 73032 Ethanol 720 72033 Ethylene oxide 380 38034 Cumene (1-methylethylbenzene) 291 3.1 29035 Ethyl acetate 350 35036 Nickel & compounds 235 23037 Chromium (VI) compounds 144 64.442 21038 Cobalt & compounds 118 41 16039 Copper & compounds 155 15040 Cadmium & compounds 24 103.95 13041 Chromium (III) compounds 38 3842 Hydrogen sulfide 34 3443 Mercury & compounds 15 14.75 3044 Chloroform (trichloromethane) 25 2545 Antimony & compounds 16 1646 Phenol 15 1547 Selenium & compounds 5.1 5.148 Beryllium & compounds 2.3 2.349 Hydrochloric acid 1.6 1.650 Biphenyl (1,1�-biphenyl) 0.68 0.6851 Cyanide (inorganic) compounds 0.15 0.1552 1,2-Dichloroethane 0.12 0.1253 1,2-Dibromoethane 0.10 0.1054 Carbon disulfide 0.0080 0.008055 Di-(2-Ethylhexyl) phthalate (DEHP) 0.0045 0.004556 Acrylic acid 0.000099 0.000099
� Total emissions to 2 significant figure
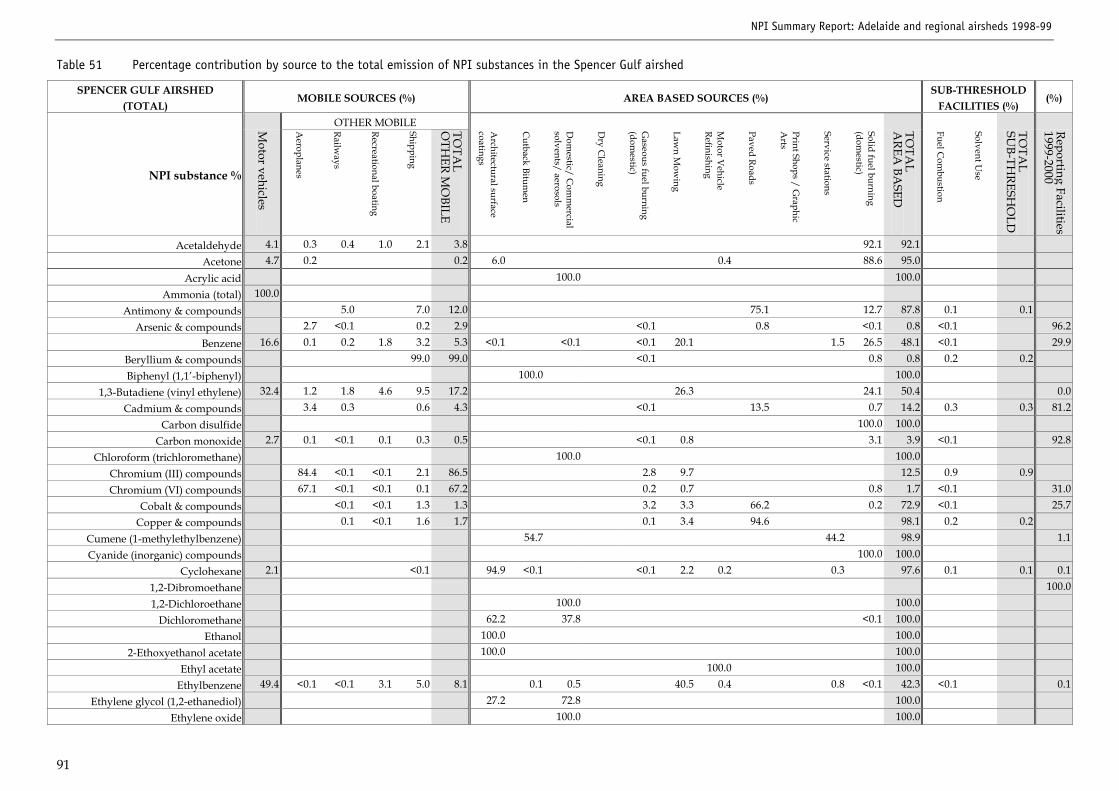
NPI Summary Report: Adelaide and regional airsheds 1998-99
91
Table 51 Percentage contribution by source to the total emission of NPI substances in the Spencer Gulf airshed
SPENCER GULF AIRSHED(TOTAL)
MOBILE SOURCES (%) AREA BASED SOURCES (%)SUB-THRESHOLD
FACILITIES (%)(%)
OTHER MOBILE
NPI substance %
Motor vehicles
Aeroplanes
Railways
Recreational boating
Shipping
TOTA
LO
THER M
OBILE
Architectural surface
coatings
Cutback Bitum
en
Dom
estic/ Com
mercial
solvents/ aerosols
Dry C
leaning
Gaseous fuel burning
(domestic)
Lawn M
owing
Motor V
ehicleRefinishing
Paved Roads
Print Shops / Graphic
Arts
Service stations
Solid fuel burning(dom
estic)
TOTA
LA
REA BA
SED
Fuel Com
bustion
Solvent Use
TOTA
LSU
B-THRESH
OLD
Reporting Facilities1999-2000
Acetaldehyde 4.1 0.3 0.4 1.0 2.1 3.8 92.1 92.1Acetone 4.7 0.2 0.2 6.0 0.4 88.6 95.0
Acrylic acid 100.0 100.0Ammonia (total) 100.0
Antimony & compounds 5.0 7.0 12.0 75.1 12.7 87.8 0.1 0.1Arsenic & compounds 2.7 <0.1 0.2 2.9 <0.1 0.8 <0.1 0.8 <0.1 96.2
Benzene 16.6 0.1 0.2 1.8 3.2 5.3 <0.1 <0.1 <0.1 20.1 1.5 26.5 48.1 <0.1 29.9Beryllium & compounds 99.0 99.0 <0.1 0.8 0.8 0.2 0.2Biphenyl (1,1�-biphenyl) 100.0 100.0
1,3-Butadiene (vinyl ethylene) 32.4 1.2 1.8 4.6 9.5 17.2 26.3 24.1 50.4 0.0Cadmium & compounds 3.4 0.3 0.6 4.3 <0.1 13.5 0.7 14.2 0.3 0.3 81.2
Carbon disulfide 100.0 100.0Carbon monoxide 2.7 0.1 <0.1 0.1 0.3 0.5 <0.1 0.8 3.1 3.9 <0.1 92.8
Chloroform (trichloromethane) 100.0 100.0Chromium (III) compounds 84.4 <0.1 <0.1 2.1 86.5 2.8 9.7 12.5 0.9 0.9Chromium (VI) compounds 67.1 <0.1 <0.1 0.1 67.2 0.2 0.7 0.8 1.7 <0.1 31.0
Cobalt & compounds <0.1 <0.1 1.3 1.3 3.2 3.3 66.2 0.2 72.9 <0.1 25.7Copper & compounds 0.1 <0.1 1.6 1.7 0.1 3.4 94.6 98.1 0.2 0.2
Cumene (1-methylethylbenzene) 54.7 44.2 98.9 1.1Cyanide (inorganic) compounds 100.0 100.0
Cyclohexane 2.1 <0.1 94.9 <0.1 <0.1 2.2 0.2 0.3 97.6 0.1 0.1 0.11,2-Dibromoethane 100.01,2-Dichloroethane 100.0 100.0
Dichloromethane 62.2 37.8 <0.1 100.0Ethanol 100.0 100.0
2-Ethoxyethanol acetate 100.0 100.0Ethyl acetate 100.0 100.0
Ethylbenzene 49.4 <0.1 <0.1 3.1 5.0 8.1 0.1 0.5 40.5 0.4 0.8 <0.1 42.3 <0.1 0.1Ethylene glycol (1,2-ethanediol) 27.2 72.8 100.0
Ethylene oxide 100.0 100.0
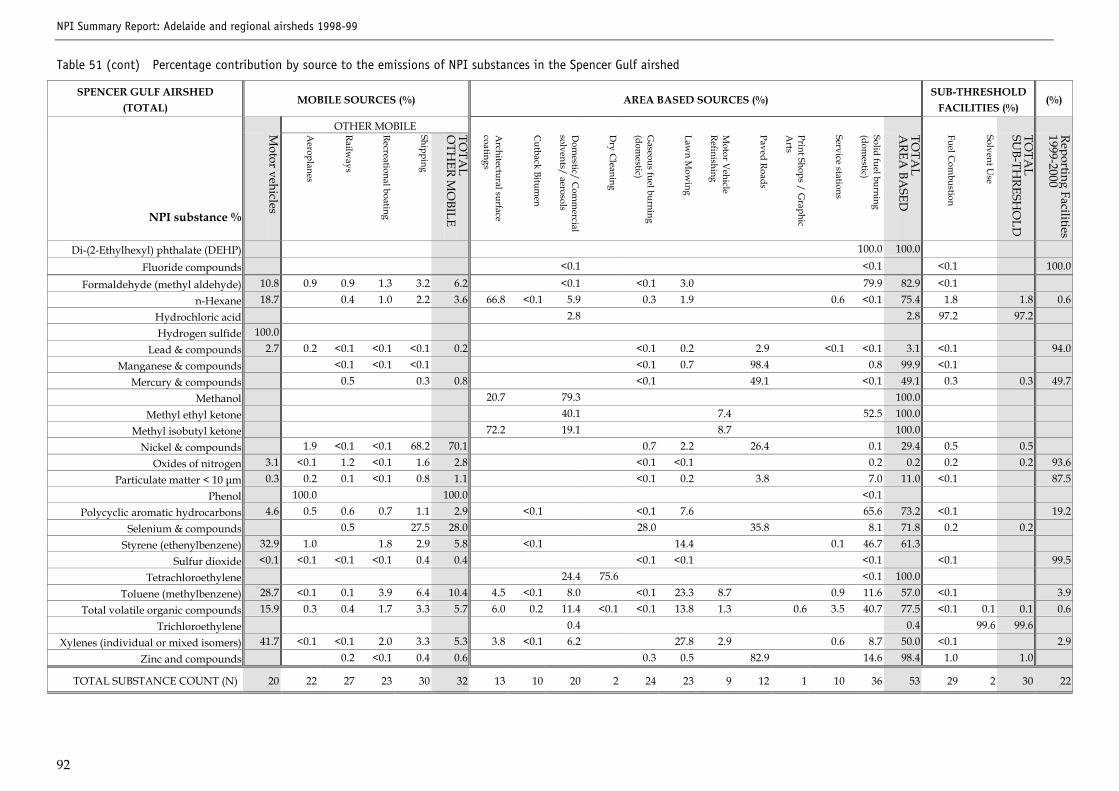
NPI Summary Report: Adelaide and regional airsheds 1998-99
92
Table 51 (cont) Percentage contribution by source to the emissions of NPI substances in the Spencer Gulf airshed
SPENCER GULF AIRSHED(TOTAL)
MOBILE SOURCES (%) AREA BASED SOURCES (%)SUB-THRESHOLD
FACILITIES (%)(%)
OTHER MOBILE
NPI substance %
Motor vehicles
Aeroplanes
Railways
Recreational boating
Shipping
TOTA
LO
THER M
OBILE
Architectural surface
coatings
Cutback Bitum
en
Dom
estic/ Com
mercial
solvents/ aerosols
Dry C
leaning
Gaseous fuel burning
(domestic)
Lawn M
owing
Motor V
ehicleRefinishing
Paved Roads
Print Shops / Graphic
Arts
Service stations
Solid fuel burning(dom
estic)
TOTA
LA
REA BA
SED
Fuel Com
bustion
Solvent Use
TOTA
LSU
B-THRESH
OLD
Reporting Facilities1999-2000
Di-(2-Ethylhexyl) phthalate (DEHP) 100.0 100.0
Fluoride compounds <0.1 <0.1 <0.1 100.0
Formaldehyde (methyl aldehyde) 10.8 0.9 0.9 1.3 3.2 6.2 <0.1 <0.1 3.0 79.9 82.9 <0.1n-Hexane 18.7 0.4 1.0 2.2 3.6 66.8 <0.1 5.9 0.3 1.9 0.6 <0.1 75.4 1.8 1.8 0.6
Hydrochloric acid 2.8 2.8 97.2 97.2Hydrogen sulfide 100.0
Lead & compounds 2.7 0.2 <0.1 <0.1 <0.1 0.2 <0.1 0.2 2.9 <0.1 <0.1 3.1 <0.1 94.0Manganese & compounds <0.1 <0.1 <0.1 <0.1 0.7 98.4 0.8 99.9 <0.1
Mercury & compounds 0.5 0.3 0.8 <0.1 49.1 <0.1 49.1 0.3 0.3 49.7Methanol 20.7 79.3 100.0
Methyl ethyl ketone 40.1 7.4 52.5 100.0Methyl isobutyl ketone 72.2 19.1 8.7 100.0
Nickel & compounds 1.9 <0.1 <0.1 68.2 70.1 0.7 2.2 26.4 0.1 29.4 0.5 0.5Oxides of nitrogen 3.1 <0.1 1.2 <0.1 1.6 2.8 <0.1 <0.1 0.2 0.2 0.2 0.2 93.6
Particulate matter < 10 µm 0.3 0.2 0.1 <0.1 0.8 1.1 <0.1 0.2 3.8 7.0 11.0 <0.1 87.5Phenol 100.0 100.0 <0.1
Polycyclic aromatic hydrocarbons 4.6 0.5 0.6 0.7 1.1 2.9 <0.1 <0.1 7.6 65.6 73.2 <0.1 19.2Selenium & compounds 0.5 27.5 28.0 28.0 35.8 8.1 71.8 0.2 0.2
Styrene (ethenylbenzene) 32.9 1.0 1.8 2.9 5.8 <0.1 14.4 0.1 46.7 61.3Sulfur dioxide <0.1 <0.1 <0.1 <0.1 0.4 0.4 <0.1 <0.1 <0.1 <0.1 99.5
Tetrachloroethylene 24.4 75.6 <0.1 100.0Toluene (methylbenzene) 28.7 <0.1 0.1 3.9 6.4 10.4 4.5 <0.1 8.0 <0.1 23.3 8.7 0.9 11.6 57.0 <0.1 3.9
Total volatile organic compounds 15.9 0.3 0.4 1.7 3.3 5.7 6.0 0.2 11.4 <0.1 <0.1 13.8 1.3 0.6 3.5 40.7 77.5 <0.1 0.1 0.1 0.6Trichloroethylene 0.4 0.4 99.6 99.6
Xylenes (individual or mixed isomers) 41.7 <0.1 <0.1 2.0 3.3 5.3 3.8 <0.1 6.2 27.8 2.9 0.6 8.7 50.0 <0.1 2.9Zinc and compounds 0.2 <0.1 0.4 0.6 0.3 0.5 82.9 14.6 98.4 1.0 1.0
TOTAL SUBSTANCE COUNT (N) 20 22 27 23 30 32 13 10 20 2 24 23 9 12 1 10 36 53 29 2 30 22
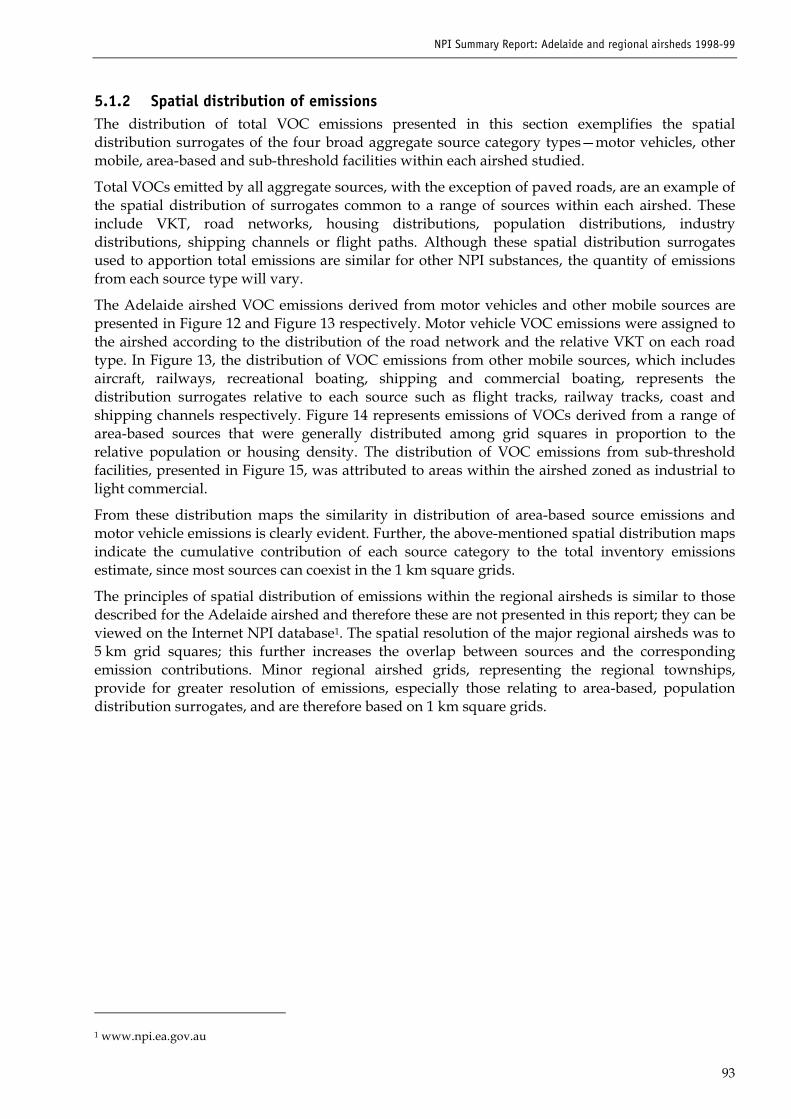
NPI Summary Report: Adelaide and regional airsheds 1998-99
93
5.1.2 Spatial distribution of emissionsThe distribution of total VOC emissions presented in this section exemplifies the spatialdistribution surrogates of the four broad aggregate source category types�motor vehicles, othermobile, area-based and sub-threshold facilities within each airshed studied.
Total VOCs emitted by all aggregate sources, with the exception of paved roads, are an example ofthe spatial distribution of surrogates common to a range of sources within each airshed. Theseinclude VKT, road networks, housing distributions, population distributions, industrydistributions, shipping channels or flight paths. Although these spatial distribution surrogatesused to apportion total emissions are similar for other NPI substances, the quantity of emissionsfrom each source type will vary.
The Adelaide airshed VOC emissions derived from motor vehicles and other mobile sources arepresented in Figure 12 and Figure 13 respectively. Motor vehicle VOC emissions were assigned tothe airshed according to the distribution of the road network and the relative VKT on each roadtype. In Figure 13, the distribution of VOC emissions from other mobile sources, which includesaircraft, railways, recreational boating, shipping and commercial boating, represents thedistribution surrogates relative to each source such as flight tracks, railway tracks, coast andshipping channels respectively. Figure 14 represents emissions of VOCs derived from a range ofarea-based sources that were generally distributed among grid squares in proportion to therelative population or housing density. The distribution of VOC emissions from sub-thresholdfacilities, presented in Figure 15, was attributed to areas within the airshed zoned as industrial tolight commercial.
From these distribution maps the similarity in distribution of area-based source emissions andmotor vehicle emissions is clearly evident. Further, the above-mentioned spatial distribution mapsindicate the cumulative contribution of each source category to the total inventory emissionsestimate, since most sources can coexist in the 1 km square grids.
The principles of spatial distribution of emissions within the regional airsheds is similar to thosedescribed for the Adelaide airshed and therefore these are not presented in this report; they can beviewed on the Internet NPI database1. The spatial resolution of the major regional airsheds was to5 km grid squares; this further increases the overlap between sources and the correspondingemission contributions. Minor regional airshed grids, representing the regional townships,provide for greater resolution of emissions, especially those relating to area-based, populationdistribution surrogates, and are therefore based on 1 km square grids.
1 www.npi.ea.gov.au
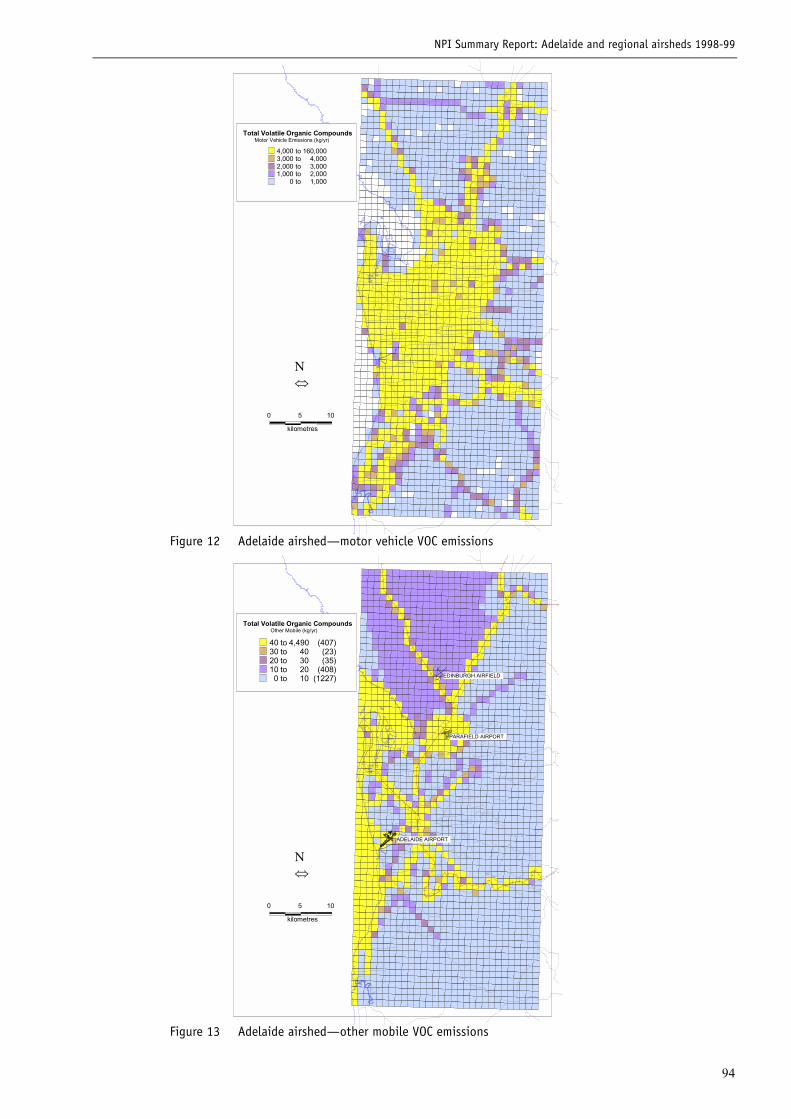
NPI Summary Report: Adelaide and regional airsheds 1998-99
94
10
kilometres
�
�
50
Total Volatile Organic CompoundsMotor Vehicle Emissions (kg/yr)
4,000 to 160,0003,000 to 4,0002,000 to 3,0001,000 to 2,000
0 to 1,000
Figure 12 Adelaide airshed�motor vehicle VOC emissions
10
kilometres
�
�
50
ADELAIDE AIRPORT
PARAFIELD AIRPORT
EDINBURGH AIRFIELD
Total Volatile Organic CompoundsOther Mobile (kg/yr)
40 to 4,490 (407)30 to 40 (23)20 to 30 (35)10 to 20 (408)0 to 10 (1227)
Figure 13 Adelaide airshed�other mobile VOC emissions
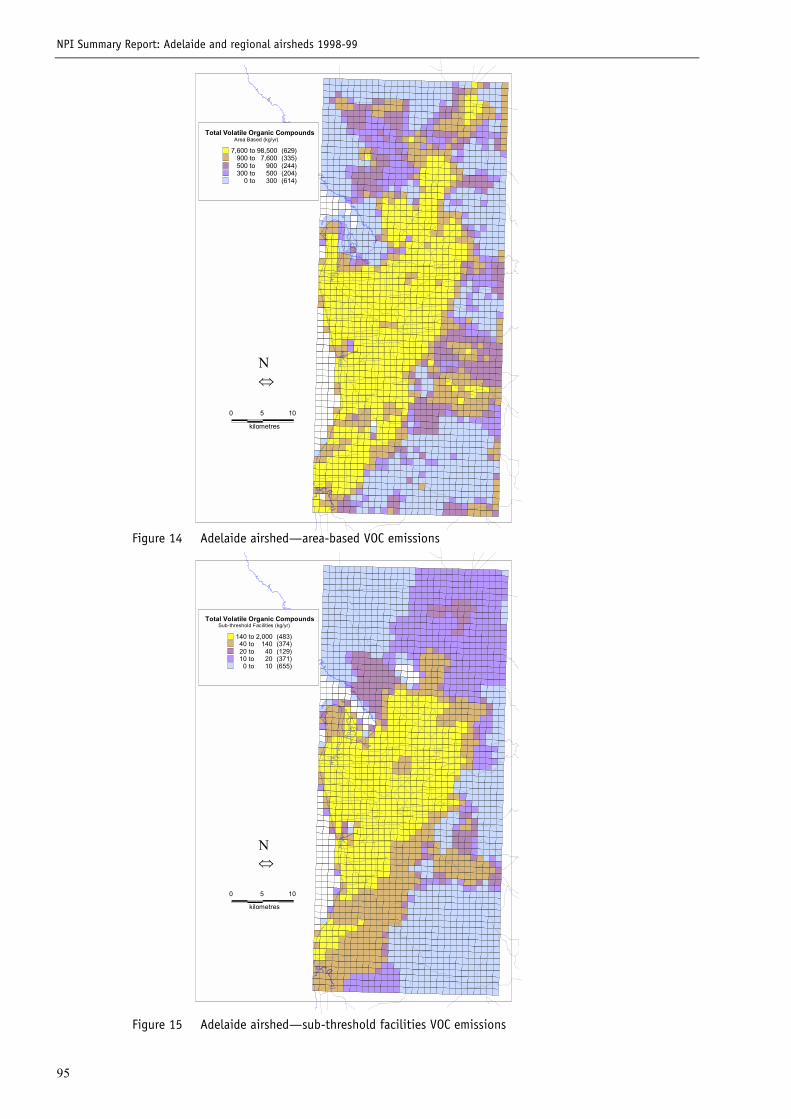
NPI Summary Report: Adelaide and regional airsheds 1998-99
95
10
kilometres
N�
50
Total Volatile Organic CompoundsArea Based (kg/yr)
7,600 to 98,500 (629)900 to 7,600 (335)500 to 900 (244)300 to 500 (204)
0 to 300 (614)
Figure 14 Adelaide airshed�area-based VOC emissions
10
kilometres
N�
50
Total Volatile Organic CompoundsSub-threshold Facilities (kg/yr)
140 to 2,000 (483)40 to 140 (374)20 to 40 (129)10 to 20 (371)
0 to 10 (655)
Figure 15 Adelaide airshed�sub-threshold facilities VOC emissions
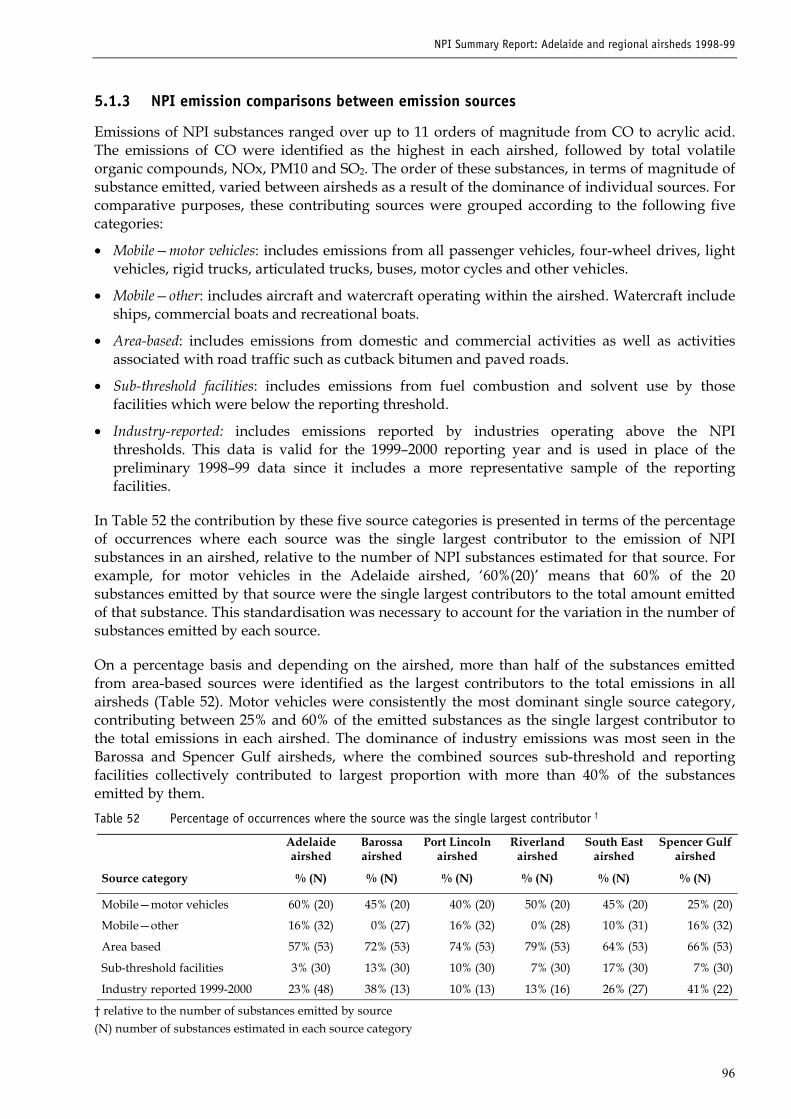
NPI Summary Report: Adelaide and regional airsheds 1998-99
96
5.1.3 NPI emission comparisons between emission sources
Emissions of NPI substances ranged over up to 11 orders of magnitude from CO to acrylic acid.The emissions of CO were identified as the highest in each airshed, followed by total volatileorganic compounds, NOx, PM10 and SO2. The order of these substances, in terms of magnitude ofsubstance emitted, varied between airsheds as a result of the dominance of individual sources. Forcomparative purposes, these contributing sources were grouped according to the following fivecategories:
� Mobile�motor vehicles: includes emissions from all passenger vehicles, four-wheel drives, lightvehicles, rigid trucks, articulated trucks, buses, motor cycles and other vehicles.
� Mobile�other: includes aircraft and watercraft operating within the airshed. Watercraft includeships, commercial boats and recreational boats.
� Area-based: includes emissions from domestic and commercial activities as well as activitiesassociated with road traffic such as cutback bitumen and paved roads.
� Sub-threshold facilities: includes emissions from fuel combustion and solvent use by thosefacilities which were below the reporting threshold.
� Industry-reported: includes emissions reported by industries operating above the NPIthresholds. This data is valid for the 1999�2000 reporting year and is used in place of thepreliminary 1998�99 data since it includes a more representative sample of the reportingfacilities.
In Table 52 the contribution by these five source categories is presented in terms of the percentageof occurrences where each source was the single largest contributor to the emission of NPIsubstances in an airshed, relative to the number of NPI substances estimated for that source. Forexample, for motor vehicles in the Adelaide airshed, �60%(20)� means that 60% of the 20substances emitted by that source were the single largest contributors to the total amount emittedof that substance. This standardisation was necessary to account for the variation in the number ofsubstances emitted by each source.
On a percentage basis and depending on the airshed, more than half of the substances emittedfrom area-based sources were identified as the largest contributors to the total emissions in allairsheds (Table 52). Motor vehicles were consistently the most dominant single source category,contributing between 25% and 60% of the emitted substances as the single largest contributor tothe total emissions in each airshed. The dominance of industry emissions was most seen in theBarossa and Spencer Gulf airsheds, where the combined sources sub-threshold and reportingfacilities collectively contributed to largest proportion with more than 40% of the substancesemitted by them.Table 52 Percentage of occurrences where the source was the single largest contributor �
Source category
Adelaideairshed
% (N)
Barossaairshed
% (N)
Port Lincolnairshed
% (N)
Riverlandairshed
% (N)
South Eastairshed
% (N)
Spencer Gulfairshed
% (N)
Mobile�motor vehicles 60% (20) 45% (20) 40% (20) 50% (20) 45% (20) 25% (20)
Mobile�other 16% (32) 0% (27) 16% (32) 0% (28) 10% (31) 16% (32)
Area based 57% (53) 72% (53) 74% (53) 79% (53) 64% (53) 66% (53)
Sub-threshold facilities 3% (30) 13% (30) 10% (30) 7% (30) 17% (30) 7% (30)
Industry reported 1999-2000 23% (48) 38% (13) 10% (13) 13% (16) 26% (27) 41% (22)
� relative to the number of substances emitted by source(N) number of substances estimated in each source category
NPI Summary Report: Adelaide and regional airsheds 1998-99
97
The contribution by each source type identified in Table 52 is further compared by airshed inFigure 16, which again demonstrates the dominance of motor vehicle emissions in the Adelaideairshed and area-based emissions in each of the regional airsheds. Within motor vehicles,passenger vehicles were responsible for over 50% of the total emissions estimated. However, anumber of substances were dominated by contributions from the diesel fuelled vehicle fleet7. Forthose substances where the area-based source was identified as the largest contributor, thecontribution by the subcategory sources is examined in Figure 17. The dominance of the singlesubcategory source type �paved roads� was identified in each airshed. While solvent emissionsfrom architectural surface coatings, domestic and commercial solvents and dry cleaning facilities,collectively make up between 43% and 52% of the contributions in each airshed.
Selected substances emitted by the three main source types, mobile, area-based and industrysources, were compared. The area-based source was unchanged from that described previously.However, the sources mobile and industry were constructed by combining mobile�motorvehicles with mobile�other, and sub-threshold with reporting facilities respectively. NPIsubstances selected for these comparisons include CO, NOx, PM10, SO2, total VOCs, benzene-toluene-ethylbenzene-xylene (BTEX) compounds and metallic compounds. These substancescategorise the complete NPI substance list, as well as individually being significant air pollutantsthat are monitored by air programs such as the Air NEPM or the Air Toxics Program. BTEXcompounds are one group of substances currently being investigated by the Living Cities AirToxics program. NPI substances included in the group metallic compounds include all those withmetalloid properties.
The comparison of percentages of substances emitted within each source shown in Figure 18indicates a similar profile for mobile and area-based sources in the Adelaide and combinedregional airsheds. Industry emissions show the greatest variations in substances emitted in thetwo airsheds. CO was the dominant substance emitted from all sources except industry in theAdelaide airshed, where NOx was dominant. SO2 was a major industry emission in both airsheds.
Further comparison between the three sources and their relative contribution to the total emissionof each of the selected substances (Figure 19) indicates the difference in contribution between theAdelaide and combined regional airsheds (Figure 20). Comparisons for the five major regionalairsheds�Barossa, Port Lincoln, Riverland, South East and Spencer Gulf�are presented in Figure21 to Figure 25. The profiles of the relative contributions presented in the combined regionalairshed closely reflect those identified in Figure 25 of the Spencer Gulf airshed. This indicates thesignificant contribution of this airshed to the total regional emissions and in particular thedominance of industry emissions of CO, NOx, PM10, SO2 and metallic compounds on the overallregional totals.
The largest emitters of CO, NOx and BTEX compounds in the Adelaide airshed and some of theregional airsheds were mobile sources. Industry emissions of the selected substances were foundto vary between airsheds, with the most dominant sources located in the Adelaide, Barossa, SouthEast and Spencer Gulf airsheds. Emissions of SO2 in the Adelaide airshed were mostly due toindustry and mobile sources; however, the relative contributions of these two sources in theregional airsheds varied significantly, with industry contributions significantly outweighingmobile in the Spencer Gulf airshed. Area-based sources were still the largest source of PM10, VOCand metallic compounds in all airsheds except the Barossa and Spencer Gulf.
In summary, mobile sources were the dominant source of NPI substance emissions in theAdelaide airshed, particularly for CO, NOx and BTEX. Area-based sources were the dominantsource of PM10, VOC and metallic compound emissions in the Adelaide and regional airsheds.The contribution from industry in the Adelaide airshed was significantly less than identified in theregional airsheds. Mobile and area-based sources were the dominant source of NPI substances in
NPI Summary Report: Adelaide and regional airsheds 1998-99
98
the Port Lincoln and Riverland airsheds. The contribution from industry in the emission of NOxand PM10 substances was high in the Barossa airshed and SO2 in South East airsheds. However,the highest contribution by industrial facilities was identified in the Spencer Gulf airsheds, for thetotal emission estimates of CO, NOx, PM10, SO2 and metallic compounds.
5.1.4 NPI emission comparisons between airsheds
NPI air emissions for the South Australian airsheds have not been compared with those of otherjurisdictions in this report. Early comparisons with the Perth NPI Emissions Study2 showed Perthemissions to be within the range of emissions estimated for the six South Australian airsheds,including the Adelaide airshed, although variations of the annual emissions loads were found tobe relatively large. The authors identified the need to standardise estimation methodologies,recommending the use of standard methodologies such as the NPI Aggregate EET manualsproduced by Environment Australia. This move would eliminate some variation and allowemission differentials due to local data and the level of activity to be analysed. However, smallvariations in emissions will also be due to the assumptions made in deriving local data, whichremains a limiting factor for some aggregate emission sources even with the use of the NPI EETmanuals. A comparison of the assumptions made by jurisdictions may help identify thesignificance of this limitation.
This section graphically compares total emissions estimated for selected substances in theAdelaide and the regional airsheds (Figure 26). Bars, on a logarithmic scale, represent totalemissions in each airshed on a per-capita basis to standardise for differences in population relatedactivities. Emissions per capita for the Adelaide, Port Lincoln, Riverland and South East airshedswere of similar magnitude. However, estimates identified for the Barossa and Spencer Gulfairsheds were significantly higher than other airsheds. Similarity between the Adelaide and allregional airsheds was most evident for VOC, BTEX and metallic compounds that were mostlyrelated to area-based and mobile-motor vehicle sources. The observed differences in emissionestimates for some airsheds indicate the dominance of industry sources. In the absence of industrydominance, there is a close agreement in the per-capita emissions between the regional airshedsand the Adelaide airshed, suggesting the possibility of transposing data to other regions of theState on a population basis. However, inventory estimates must be validated against actualmonitoring data to confirm these findings.
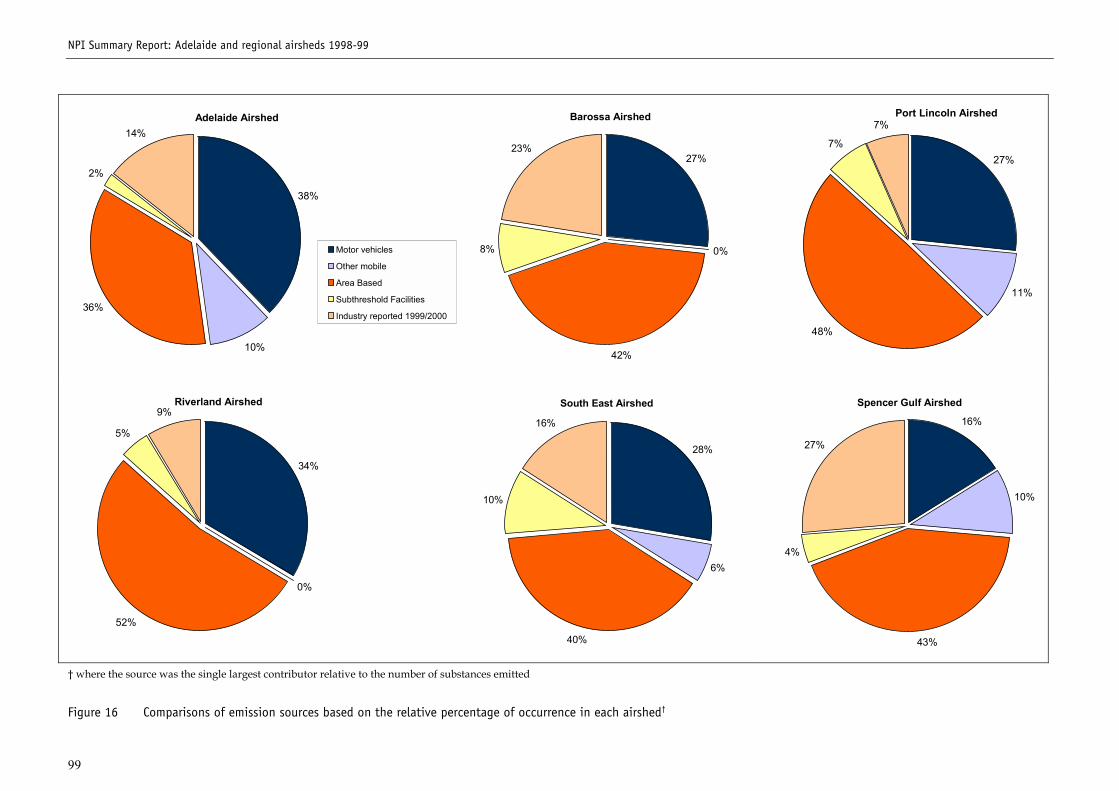
NPI Summary Report: Adelaide and regional airsheds 1998-99
99
Adelaide Airshed
38%
10%
36%
2%
14%
Motor vehicles
Other mobile
Area Based
Subthreshold Facilities
Industry reported 1999/2000
Barossa Airshed
27%
42%
8%
23%
0%
Port Lincoln Airshed
27%
11%
48%
7%
7%
Riverland Airshed
34%
52%
5%
9%
0%
South East Airshed
28%
6%
40%
10%
16%
Spencer Gulf Airshed
16%
10%
43%
4%
27%
� where the source was the single largest contributor relative to the number of substances emitted
Figure 16 Comparisons of emission sources based on the relative percentage of occurrence in each airshed�
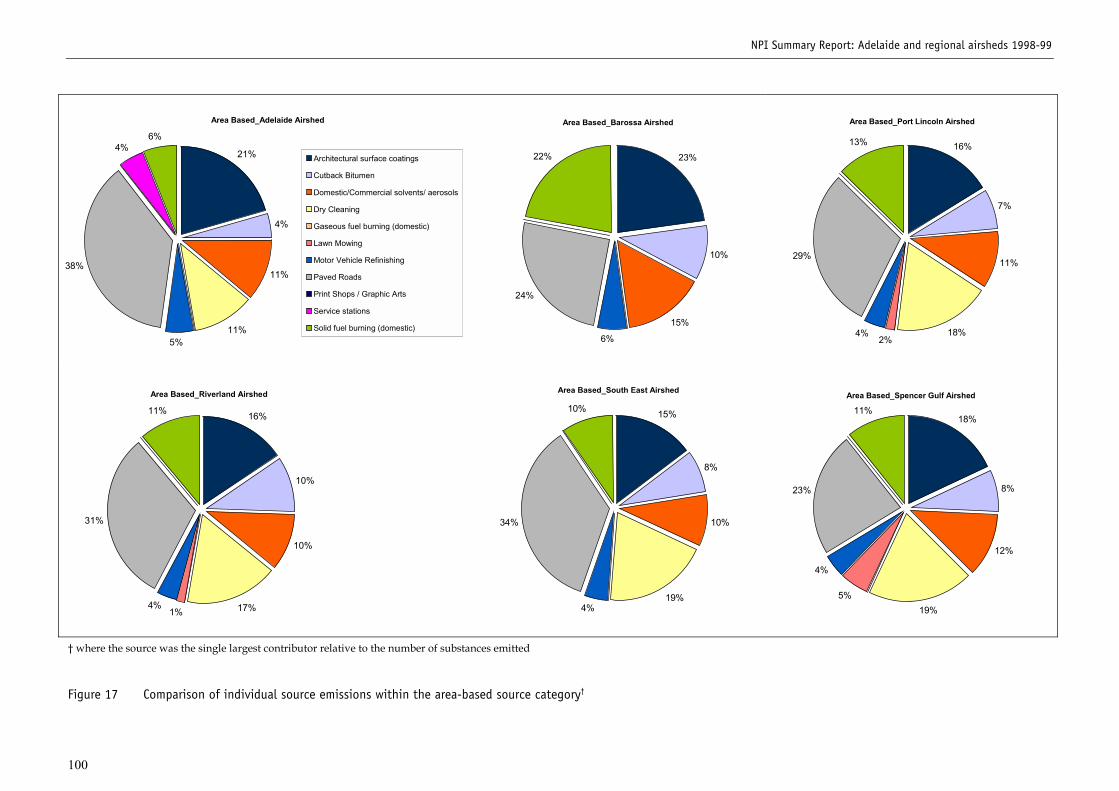
NPI Summary Report: Adelaide and regional airsheds 1998-99
100
Area Based_Adelaide Airshed
21%
4%
11%38%
6%4%
5%11%
Architectural surface coatings
Cutback Bitumen
Domestic/Commercial solvents/ aerosols
Dry Cleaning
Gaseous fuel burning (domestic)
Lawn Mowing
Motor Vehicle Refinishing
Paved Roads
Print Shops / Graphic Arts
Service stations
Solid fuel burning (domestic)
Area Based_Barossa Airshed
23%
10%
15%
24%
22%
6%
Area Based_Port Lincoln Airshed
16%
7%
11%29%
13%
4%2%
18%
Area Based_Riverland Airshed
16%
10%
10%
31%
11%
4%1% 17%
Area Based_South East Airshed
15%
8%
10%34%
10%
4%19%
Area Based_Spencer Gulf Airshed
18%
8%
12%
23%
11%
4%
5%19%
� where the source was the single largest contributor relative to the number of substances emitted
Figure 17 Comparison of individual source emissions within the area-based source category�
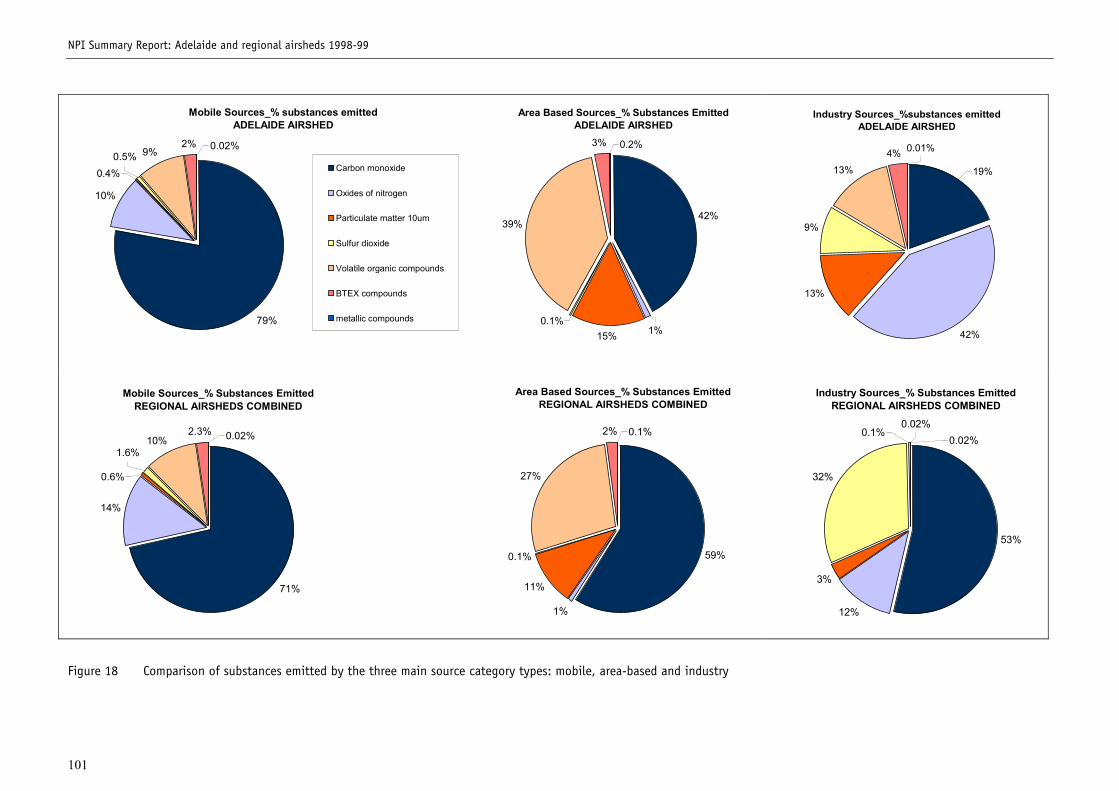
NPI Summary Report: Adelaide and regional airsheds 1998-99
101
Mobile Sources_% substances emittedADELAIDE AIRSHED
79%
10%
9%2% 0.02%
0.4%0.5%
Carbon monoxide
Oxides of nitrogen
Particulate matter 10um
Sulfur dioxide
Volatile organic compounds
BTEX compounds
metallic compounds
Area Based Sources_% Substances EmittedADELAIDE AIRSHED
42%
15%
39%
3%
0.1%
0.2%
1%
Industry Sources_%substances emittedADELAIDE AIRSHED
42%
13%
9%
13%4% 0.01%
19%
Mobile Sources_% Substances EmittedREGIONAL AIRSHEDS COMBINED
71%
14%
10%2.3%
0.6%
1.6%0.02%
Area Based Sources_% Substances EmittedREGIONAL AIRSHEDS COMBINED
59%
1%
11%
27%
2%
0.1%
0.1%
Industry Sources_% Substances EmittedREGIONAL AIRSHEDS COMBINED
53%
12%
3%
32%
0.02%0.1%
0.02%
Figure 18 Comparison of substances emitted by the three main source category types: mobile, area-based and industry
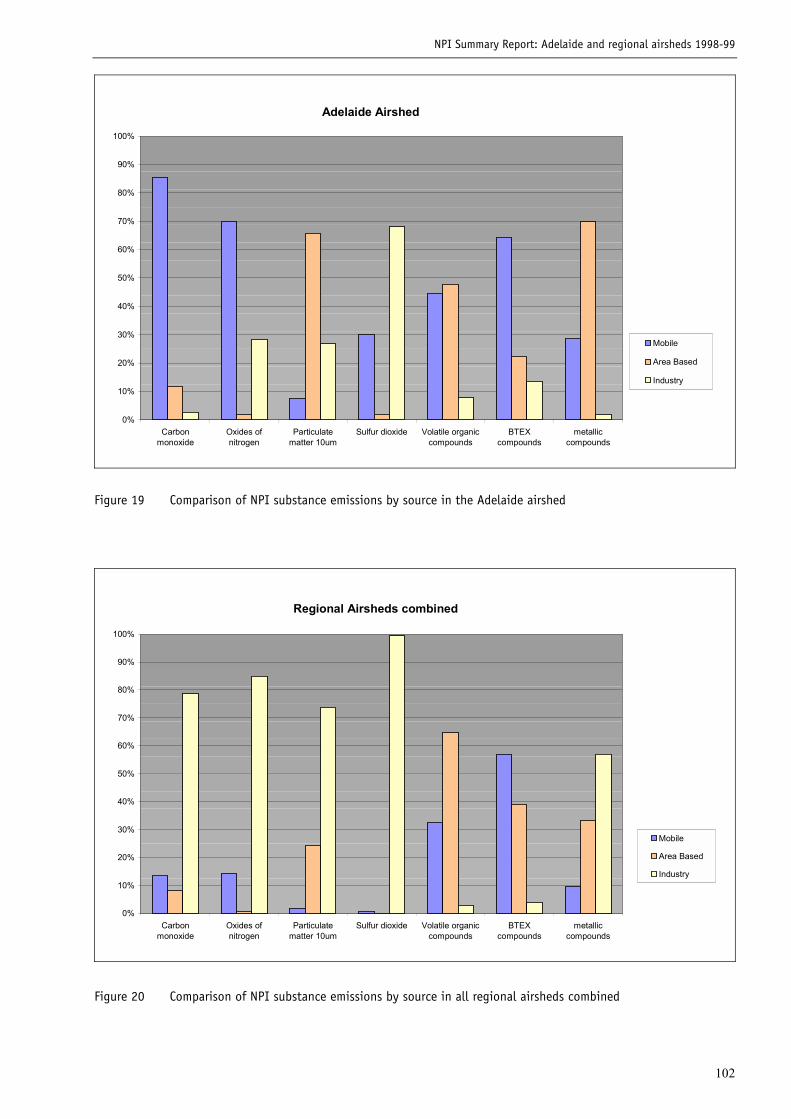
NPI Summary Report: Adelaide and regional airsheds 1998-99
102
Adelaide Airshed
0%
10%
20%
30%
40%
50%
60%
70%
80%
90%
100%
Carbonmonoxide
Oxides ofnitrogen
Particulatematter 10um
Sulfur dioxide Volatile organiccompounds
BTEXcompounds
metalliccompounds
Mobile
Area Based
Industry
Figure 19 Comparison of NPI substance emissions by source in the Adelaide airshed
Regional Airsheds combined
0%
10%
20%
30%
40%
50%
60%
70%
80%
90%
100%
Carbonmonoxide
Oxides ofnitrogen
Particulatematter 10um
Sulfur dioxide Volatile organiccompounds
BTEXcompounds
metalliccompounds
Mobile
Area Based
Industry
Figure 20 Comparison of NPI substance emissions by source in all regional airsheds combined
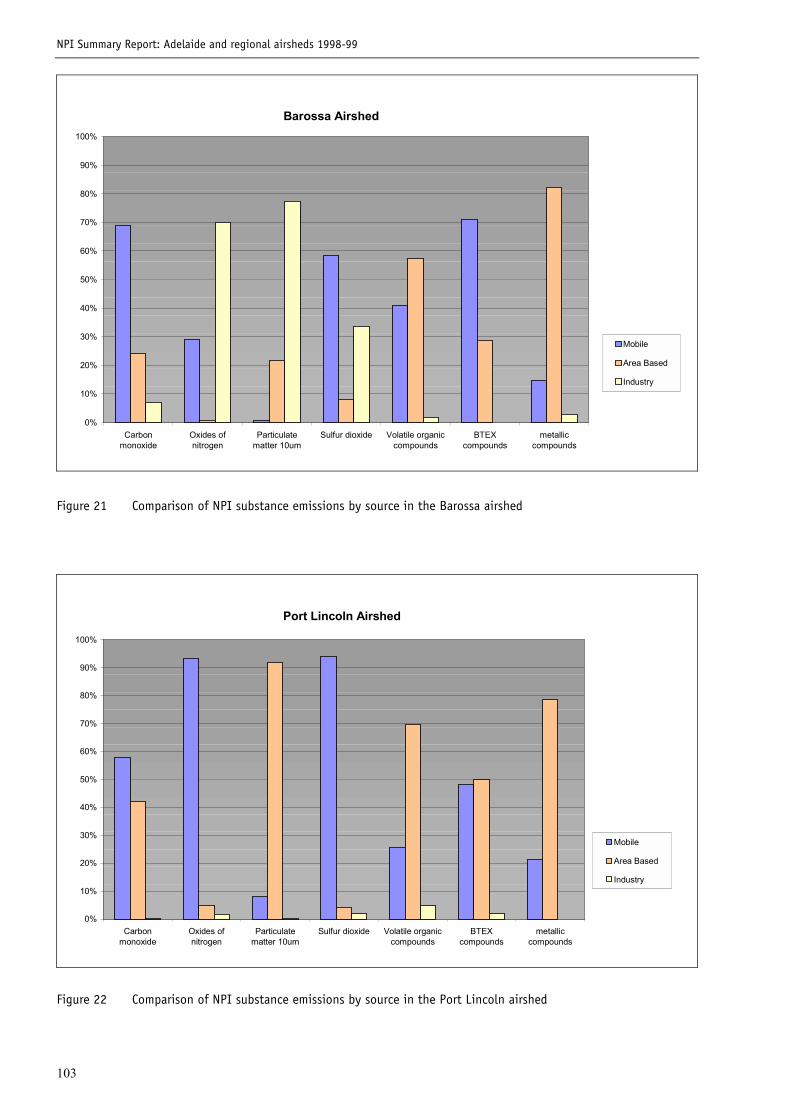
NPI Summary Report: Adelaide and regional airsheds 1998-99
103
Barossa Airshed
0%
10%
20%
30%
40%
50%
60%
70%
80%
90%
100%
Carbonmonoxide
Oxides ofnitrogen
Particulatematter 10um
Sulfur dioxide Volatile organiccompounds
BTEXcompounds
metalliccompounds
Mobile
Area Based
Industry
Figure 21 Comparison of NPI substance emissions by source in the Barossa airshed
Port Lincoln Airshed
0%
10%
20%
30%
40%
50%
60%
70%
80%
90%
100%
Carbonmonoxide
Oxides ofnitrogen
Particulatematter 10um
Sulfur dioxide Volatile organiccompounds
BTEXcompounds
metalliccompounds
Mobile
Area Based
Industry
Figure 22 Comparison of NPI substance emissions by source in the Port Lincoln airshed
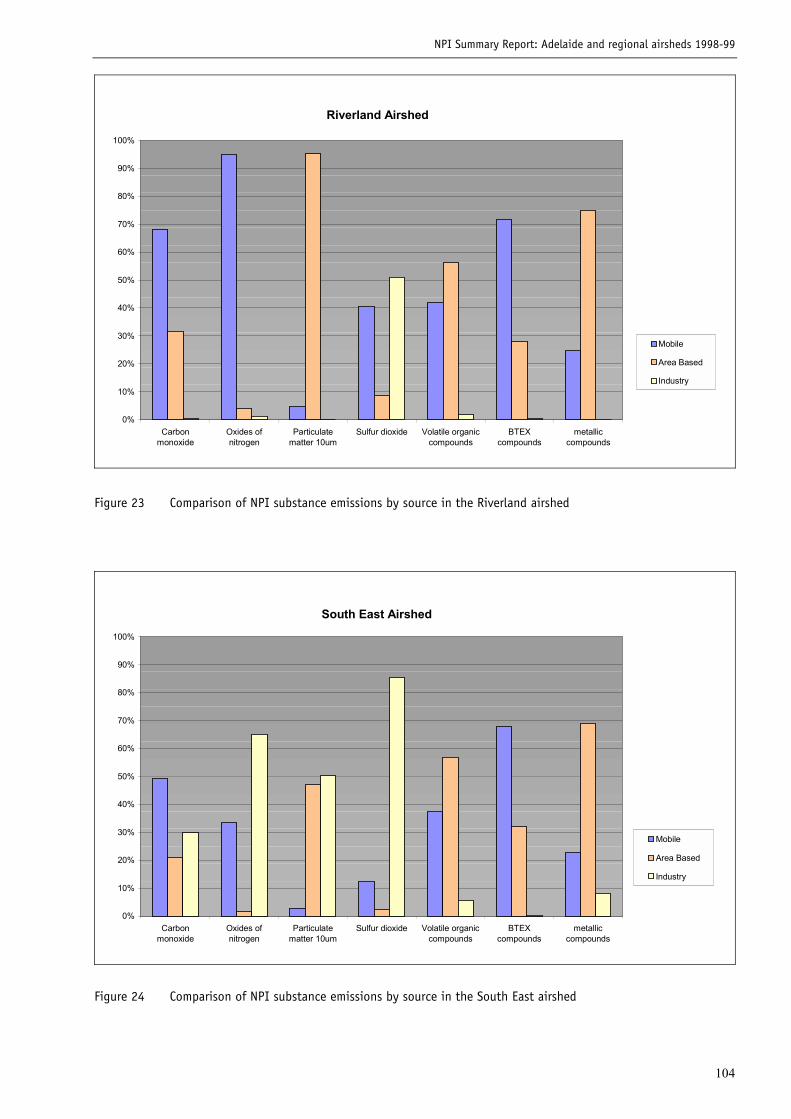
NPI Summary Report: Adelaide and regional airsheds 1998-99
104
Riverland Airshed
0%
10%
20%
30%
40%
50%
60%
70%
80%
90%
100%
Carbonmonoxide
Oxides ofnitrogen
Particulatematter 10um
Sulfur dioxide Volatile organiccompounds
BTEXcompounds
metalliccompounds
Mobile
Area Based
Industry
Figure 23 Comparison of NPI substance emissions by source in the Riverland airshed
South East Airshed
0%
10%
20%
30%
40%
50%
60%
70%
80%
90%
100%
Carbonmonoxide
Oxides ofnitrogen
Particulatematter 10um
Sulfur dioxide Volatile organiccompounds
BTEXcompounds
metalliccompounds
Mobile
Area Based
Industry
Figure 24 Comparison of NPI substance emissions by source in the South East airshed
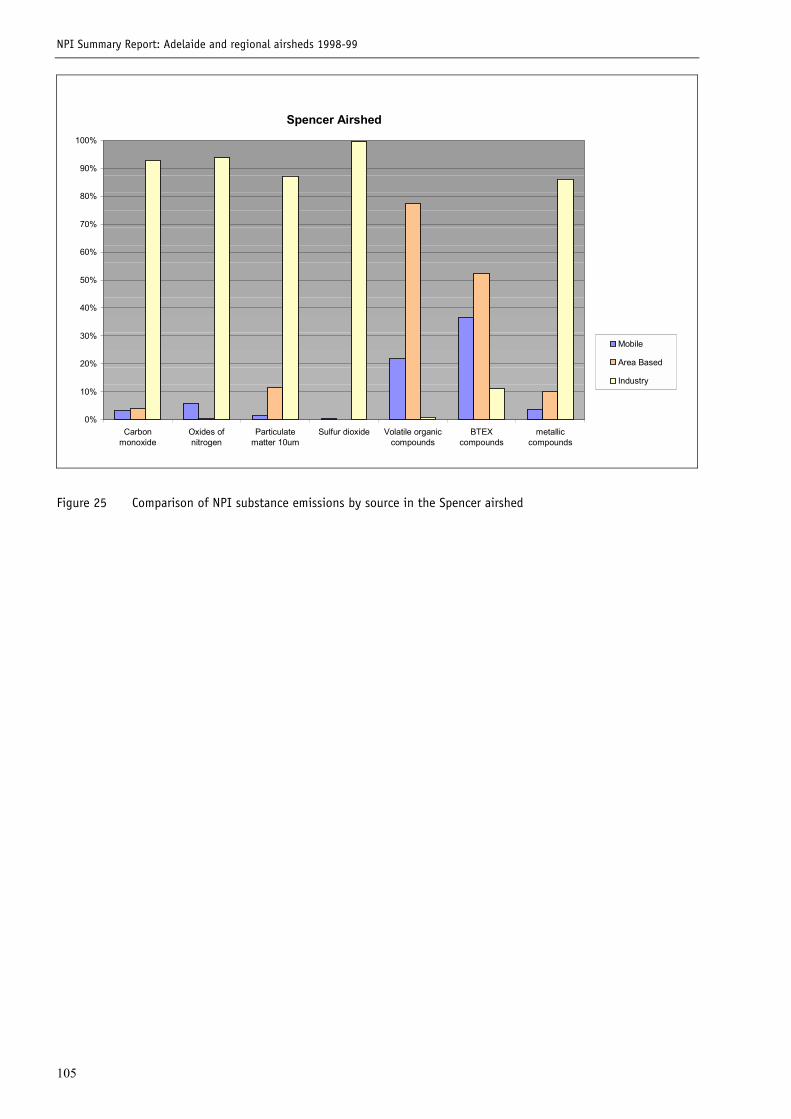
NPI Summary Report: Adelaide and regional airsheds 1998-99
105
Spencer Airshed
0%
10%
20%
30%
40%
50%
60%
70%
80%
90%
100%
Carbonmonoxide
Oxides ofnitrogen
Particulatematter 10um
Sulfur dioxide Volatile organiccompounds
BTEXcompounds
metalliccompounds
Mobile
Area Based
Industry
Figure 25 Comparison of NPI substance emissions by source in the Spencer airshed
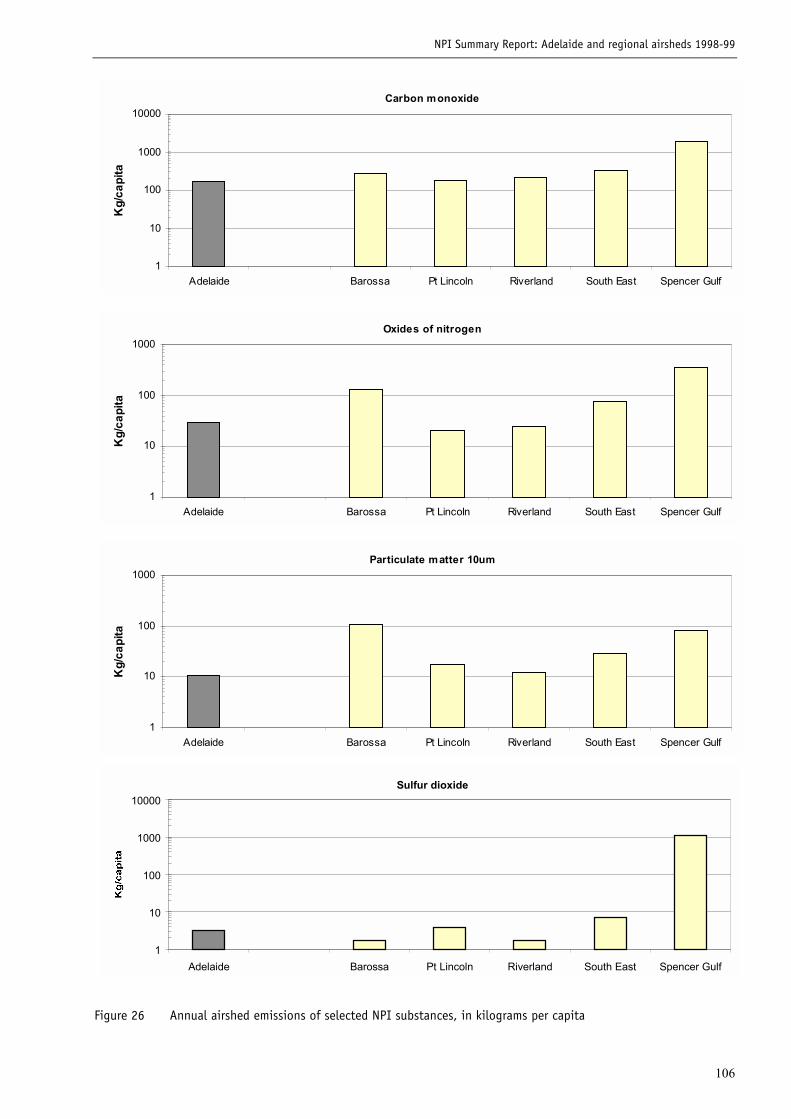
NPI Summary Report: Adelaide and regional airsheds 1998-99
106
Carbon monoxide
1
10
100
1000
10000
Adelaide Barossa Pt Lincoln Riverland South East Spencer Gulf
Kg/
capi
ta
Oxides of nitrogen
1
10
100
1000
Adelaide Barossa Pt Lincoln Riverland South East Spencer Gulf
Kg/
capi
ta
Particulate matter 10um
1
10
100
1000
Adelaide Barossa Pt Lincoln Riverland South East Spencer Gulf
Kg/
capi
ta
Sulfur dioxide
1
10
100
1000
10000
Adelaide Barossa Pt Lincoln Riverland South East Spencer Gulf
Figure 26 Annual airshed emissions of selected NPI substances, in kilograms per capita
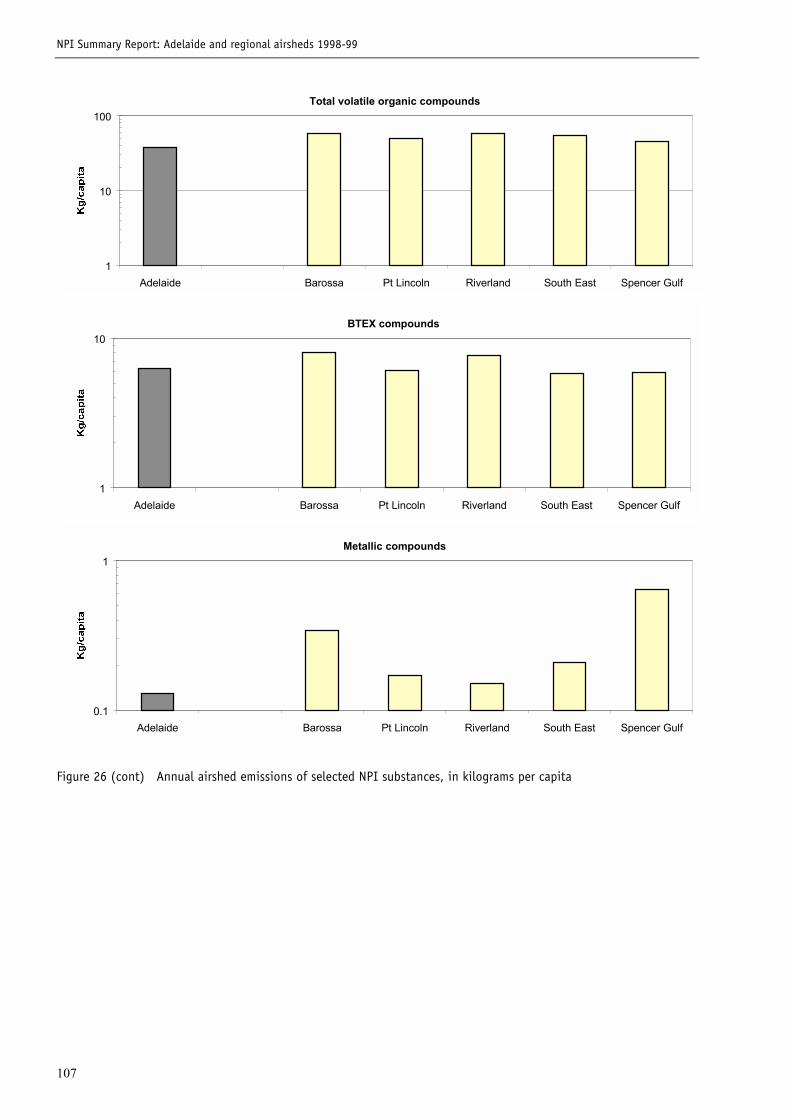
NPI Summary Report: Adelaide and regional airsheds 1998-99
107
Total volatile organic compounds
1
10
100
Adelaide Barossa Pt Lincoln Riverland South East Spencer Gulf
BTEX compounds
1
10
Adelaide Barossa Pt Lincoln Riverland South East Spencer Gulf
Metallic compounds
0.1
1
Adelaide Barossa Pt Lincoln Riverland South East Spencer Gulf
Figure 26 (cont) Annual airshed emissions of selected NPI substances, in kilograms per capita
NPI Summary Report: Adelaide and regional airsheds 1998-99
108
References
1. NEPC. 1998. National Environment Protection Measure (NEPM) for the NPI. National EnvironmentProtection Council, Australia.
2. WADEP. 2000. Western Australian Department of Environment Protection, National Pollutant Inventory: PerthAirshed Emissions Study 1998/1999. Perth, WA.
3. Clark, NJ. 2001. Comparisons of three emissions inventory methods for the Adelaide Airshed, September 2001.Flinders Consulting Pty Ltd, Adelaide.
4. Environment Australia. 1999. NPI Emissions Estimation Technique Manual for Aggregated Emissions fromCommercial Ships/Boats and Recreational Boats, November 1999. Environment Australia, Canberra.
5. Environment Australia. 2000. NPI Emission Estimation Technique Manual for Airports, version 1.0.Environment Australia, Canberra.
6. Environment Australia. 2000. NPI Emissions Estimation Technique Manual for Aggregated Emissions fromAircraft, August 2000. Environment Australia, Canberra.
7. Tilley, K. 2001. Adelaide Motor Vehicle Emissions Study. Report to Environment Protection Agency,South Australia. In: L Ciuk (ed), NPI Adelaide airshed study 1998/1999: Motor Vehicle Emissions ConsultantReport with Corrigendum to Consultant Report. South Australian Environment Protection Agency,Adelaide.
8. Environment Australia. 2000. NPI Emissions Estimation Technique Manual for Aggregated Emissions fromMotor Vehicles, August 2000. Environment Australia, Canberra.
9. Environment Australia. 1996. Technical Report on the Air Emissions Trials for the National PollutantInventory - Volume 2. Environment Australia, Canberra.
10. Green, G. 2000. National Rail Corporation, personal communication
11. Environment Australia. 1999. NPI Emissions Estimation Technique Manual for Aggregated Emissions fromRailways, November 1999. Environment Australia, Canberra.
12. Environment Australia. 2001. NPI Emission Estimation Technique Manual for Maritime Operations, version1.1. Environment Australia, Canberra.
13. Wright, B. 2000. Transport SA. Department for Transport, Urban Planning and the Arts, personalcommunication
14. Shipp, PF. 2000. Ports Corp South Australia, personal communication
15. Martland, C. 2000. Transport SA. Department for Transport, Urban Planning and the Arts, personalcommunication
16. ABARE. 1999. Energy consumption by industry and fuel type in South Australia: 1973-74 to 2014-15.Australian Bureau of Agricultural and Resource Economics, Canberra.
17. Environment Australia. 1999. NPI Emissions Estimation Technique Manual for Aggregated Emissions fromArchitectural Surface Coatings, September 1999. Environment Australia, Canberra.
18. APMF. 1999. Australian quarterly paint production statistics 1998/1999. Australian Paint ManufacturingFederation, Sydney.
19. Environment Australia. 1999. NPI Emissions Estimation Technique Manual for Aggregated Emissions fromCutback Bitumen, November 1999. Environment Australia, Canberra.
20. Nobes, S. 2000. Boral Ashpalt Bitumax Pty Ltd, personal communication
21. Brendo, D. 2000. CSR Emoleum Road Services, personal communication
22. Strikis, J. 2000. Pioneer Road Services, personal communication
23. USEPA. 1995. Compilation of Air Pollutant Emission Factors, vol I, Stationary Point and Area Sources, AP-42,5th ed. Research Triangle Park, North Carolina, USA.
NPI Summary Report: Adelaide and regional airsheds 1998-99
109
24. Environment Australia. 1999. NPI Emissions Estimation Technique Manual for Aggregated Emissions fromDomestic/Commercial Solvent and Aerosol Use, September 1999. Environment Australia, Canberra.
25. USEPA. 1998. Compilation of Air Pollution Emission Factors, vol I, Stationary Point and Area Sources, AP-42,5th ed., Suppl. D., Chapter 1.4: Natural Gas Combustion, North Carolina, USA.
26. USEPA. 1996. Compilation of Air Pollution Emission Factors, vol I, Stationary Point and Area Sources, AP-42,5th ed., Suppl. B., Chapter 1.5: Liquefied Petroleum Gas Combustion. Triangle Research Park, NorthCarolina, USA.
27. Kolednik, R. 1999. The Australian Gas Association, personal communication
28. Environment Australia. 1999. NPI Emissions Estimation Technique Manual for Aggregated Emissions fromDomestic Gaseous Fuel Burning, November 1999. Environment Australia, Canberra.
29. Godfrey, W. 2000. Origin Energy, personal communication
30. Environment Australia. 1999. NPI Emissions Estimation Technique Manual for Aggregated Emissions fromDry Cleaning, September 1999. Environment Australia, Canberra.
31. Chehade, K. 1999. President of the Dry Cleaning Association of SA, personal communication
32. Environment Australia. 1999. NPI Emissions Estimation Technique Manual for Aggregated Emissions fromDomestic Lawn Mowing, November 1999. Environment Australia, Canberra.
33. Heiken, JG, Pollack, AK and Ruhl, E. 1997. Guidance for Estimating Lawn and Garden Equipment ActivityLevels, EIIP Document Series, III. United States Environment Protection Agency, Research Triangle Park,North Carolina, USA.
34. Environment Australia. 1999. NPI Emissions Estimation Technique Manual for Aggregated Emissions fromMotor Vehicle Refinishing, November 1999. Environment Australia, Canberra.
35. USEPA. 1997. Compilation of Air Pollution Emission Factors, vol I, Stationary Point and Area Sources, AP-42,5th ed., Suppl. D., Section 13.2.1: Paved Roads. Research Triangle Park, North Carolina, USA.
36. Environment Australia. 1999. NPI Emissions Estimation Technique Manual for Aggregated Emissions fromPaved and Unpaved Roads, November 1999. Environment Australia, Canberra.
37. Aggregate Air Emissions Workshop, February 16-18, 2000. Hobart, Tasmania
38. Environment Australia. 1999. NPI Emissions Estimation Technique Manual for Aggregated Emissions fromPrinting and Graphic Arts, September 1999. Environment Australia, Canberra.
39. Environment Australia. 1999. NPI Emissions Estimation Technique Manual for Aggregated Emissions fromService Stations, November 1999. Environment Australia, Canberra.
40. Challenger, B. 1999. Australian Institute of Petroleum, personal communication
41. Davis, GA. 1999. Mobil, personal communication
42. Nelson, PF, Quigley, SM and Smith, M. 1983. Sources of atmospheric hydrocarbons in Sydney: Aquantitative determination using a source reconciliation technique. Atmos. Environ., 17: 439-449.
43. Environment Australia. 1999. NPI Emissions Estimation Technique Manual for Aggregated Emissions fromDomestic Solid Fuel Burning, September 1999. Environment Australia, Canberra.
44. Environment Australia. 1999. NPI Emissions Estimation Technique Manual for Aggregated Emissions fromFuel Combustion (Sub-Threshold), November 1999. Environment Australia, Canberra.
45. Seltsikas, P. 2000. Origin Energy, personal communication
46. Environment Australia. 1999. NPI Emissions Estimation Technique Manual for Combustion in Boilers v1.01,September 1999. Environment Australia, Canberra.
47. Environment Australia. 1999. NPI Emissions Estimation Technique Manual for Aggregated Emissions fromUse of Industrial Solvents (Sub-Threshold), November 1999. Environment Australia, Canberra.
48. Arnold, BG. 2000. Orica Australia Pty Ltd, personal communication
49. Huglin, C. 2000. Consolidated Chemical Company, personal communication