south carolina alternate assessments - sc-alt.portal ... · 2017 technical report . south carolina...
TRANSCRIPT
2017 TECHNICAL REPORT
South Carolina Alternate Assessments
South Carolina National Center and State Collaborative (SC-NCSC) for ELA and Mathematics
Grades 3–8 and 11
South Carolina Alternate Assessment (SC-Alt) for Science, Grade Bands 4–5, 6–8, and 11
Social Studies, Grade Bands 4–5 and 6–8
SC-Alt Online Assessment (SC-Alt1) Independent Field Tests (IFT) for ELA and Mathematics, Grades 3–8 and 11
Science and Social Studies, Grades 4–8 and 11
Submitted to: South Carolina Department of Education
Submitted by: American Institutes for Research
1000 Thomas Jefferson Street, NW, Suite 200 Washington, DC 20007
November 7, 2017

South Carolina Alternate Assessments—Spring 2017
i American Institutes for Research
TABLE OF CONTENTS
1. Introduction ........................................................................................................................4
1.1 THE STATE-DEVELOPED ALTERNATE ASSESSMENT ...................................................... 4 1.2 SC-NCSC FOR ELA AND MATHEMATICS ...................................................................... 8 1.3 NEW SC-ALT ONLINE ASSESSMENT .............................................................................. 9 1.4 2017 ADMINISTRATION .................................................................................................. 9
2. Test Development .............................................................................................................10
2.1 CONTENT STANDARDS FOR SC-ALT SCIENCE/BIOLOGY AND SOCIAL STUDIES ........... 10 2.2 CONTENT STANDARDS FOR SC-ALT1 IFT ................................................................... 11 2.3 2017 TESTS .................................................................................................................. 12
3. Item Development ............................................................................................................12
3.1 ITEM SPECIFICATION .................................................................................................... 13 3.2 ITEM REVIEW PROCESS ................................................................................................ 14 3.3 ITEM TYPES AND SCORING RUBRICS ............................................................................ 15 3.4 FIELD TESTING ............................................................................................................. 17 3.5 SC-ALT1 ITEM ANALYSES ........................................................................................... 17 3.6 ITEMS FLAGGED IN 2017 .............................................................................................. 24 3.7 ITEM DATA REVIEW ..................................................................................................... 25
4. Test Administration .........................................................................................................28
4.1 TEST ADMINISTRATOR TRAINING ................................................................................ 28 4.2 ADMINISTRATION MANUAL ......................................................................................... 29
5. Standard Setting...............................................................................................................36
5.1 SC-NCSC PERFORMANCE STANDARDS ....................................................................... 36 5.2 SC-ALT PERFORMANCE STANDARDS ........................................................................... 37
6. Test Equating, Scaling, and Scoring ..............................................................................38
6.1 SC-NCSC FOR ELA AND MATHEMATICS .................................................................... 38 6.2 SC-ALT SCIENCE/BIOLOGY AND SOCIAL STUDIES ....................................................... 41
7. 2017 State Summary ........................................................................................................44
7.1 STUDENT PARTICIPATION ............................................................................................ 44 7.2 SCALE SCORE SUMMARY ............................................................................................. 52 7.3 PERFORMANCE LEVEL SUMMARY ................................................................................ 53
8. Reporting ..........................................................................................................................55
8.1 ONLINE REPORTING SYSTEMM (ORS) ......................................................................... 55 8.2 SUBGROUP REPORT ...................................................................................................... 56 8.3 PAPER REPORT ............................................................................................................. 58
9. Technical Quality .............................................................................................................65
9.1 TEST RELIABILITY ....................................................................................................... 65 9.2 CLASSIFICATION ACCURACY AND CONSISTENCY ........................................................ 66 9.3 SECOND-RATER ANALYSIS .......................................................................................... 69

South Carolina Alternate Assessments—Spring 2017
ii American Institutes for Research
10. Validity ..............................................................................................................................72
10.1 CONTENT VALIDITY ..................................................................................................... 72 10.2 START-STOP ANALYSIS ............................................................................................... 74
Appendix A: Classical Statistics
Appendix B: IRT Statistics Appendix C: Conversion Tables for SC-NCSC Appendix D: Scale Score Summary by Subgroup Appendix E: Scale Score Distribution Appendix F: Marginal Reliability by Subgroup Appendix G: Content Standards
LIST OF TABLES
TABLE 1. SUMMARY OF 2017 ADMINISTRATIONS ...................................................................... 10 TABLE 2. NUMBER OF ITEMS ...................................................................................................... 12 TABLE 3. SCORING RUBRIC FOR ENGAGEMENT ITEMS ............................................................... 16 TABLE 4. DIF CLASSIFICATION CONVENTION ............................................................................ 22 TABLE 5. DIF SUMMARY ........................................................................................................... 22 TABLE 6. ITEM FLAGGING CRITERIA .......................................................................................... 24 TABLE 7. FLAGGED FIELD-TEST ITEMS IN 2017 ......................................................................... 25 TABLE 8. NUMBER OF ITEMS REJECTED IN 2017 ITEM DATA REVIEW ....................................... 26 TABLE 9. 2017 FIELD-TEST SUMMARY ...................................................................................... 27 TABLE 10. 2017 TESTS............................................................................................................... 28 TABLE 11. NCSC PERFORMANCE STANDARDS FOR ELA AND MATHEMATICS .......................... 36 TABLE 12. PERFORMANCE STANDARDS FOR SCIENCE AND SOCIAL STUDIES ............................. 37 TABLE 13. SCALE SCORE SLOPE AND INTERCEPT ...................................................................... 38 TABLE 14. TRANSFORMATION CONSTANTS FOR SCIENCE AND SOCIAL STUDIES ....................... 42 TABLE 15. PARTICIPATION BY SUBGROUP FOR ELA .................................................................. 45 TABLE 16. PARTICIPATION BY SUBGROUP FOR MATHEMATICS .................................................. 46 TABLE 17. PARTICIPATION BY SUBGROUP FOR SCIENCE AND SOCIAL STUDIES ......................... 48 TABLE 18. 2017 IFT TEST PARTICIPATION ................................................................................ 51 TABLE 19. SCALE SCORE SUMMARY BY GRADE ........................................................................ 52 TABLE 20. TYPES OF ONLINE SCORE REPORTS BY AGGREGATION ............................................. 56 TABLE 21. TYPES OF SUBGROUPS .............................................................................................. 56 TABLE 22. MARGINAL RELIABILITY AND MARGINAL SEM ....................................................... 66 TABLE 23. CLASSIFICATION ACCURACY BY GRADE/GRADE BAND ........................................... 68 TABLE 24. CLASSIFICATION CONSISTENCY BY GRADE/GRADE BAND ....................................... 69 TABLE 25. TOTAL AND SECOND-RATED NUMBERS OF TEACHERS AND STUDENTS .................... 70 TABLE 26. 2017 SECOND-RATER ANALYSIS RESULTS FOR SCIENCE ......................................... 71 TABLE 27. INTER-RATER KAPPA COEFFICIENT .......................................................................... 72 TABLE 28. NUMBER OF TASKS ADMINISTERED BY STARTING TASK—SCIENCE/BIOLOGY ........ 76 TABLE 29. NUMBER OF TASKS ADMINISTERED BY STARTING TASK—SOCIAL STUDIES ............ 77 TABLE 30. ACHIEVEMENT LEVEL BY TASK START POINT, FORM LEVEL, AND CONTENT AREA 79

South Carolina Alternate Assessments—Spring 2017
iii American Institutes for Research
List of Figures FIGURE 1. PARTIAL CREDIT ITEM RESPONSE MODEL WITH Δ = (0, –2, 0, 2) .............................. 20 FIGURE 2. PERCENTAGE OF STUDENTS IN EACH PERFORMANCE LEVEL – ELA ......................... 53 FIGURE 3. PERCENTAGE OF STUDENTS IN EACH PERFORMANCE LEVEL—MATHEMATICS ......... 54 FIGURE 4. PERCENTAGE OF STUDENTS IN EACH PERFORMANCE LEVEL—SCIENCE ................... 54 FIGURE 5. PERCENTAGE OF STUDENTS IN EACH PERFORMANCE LEVEL—SOCIAL STUDIES ...... 55 FIGURE 6. MOCK-UP FOR FAMILY REPORT ELEMENTARY AND MIDDLE SCHOOLS .................... 59 FIGURE 7. MOCK-UP FOR FAMILY REPORT HIGH SCHOOL ......................................................... 62
Spring 2017 Technical Report
South Carolina Alternate Assessment 4 American Institutes for Research
1. Introduction The primary purpose of the South Carolina Alternate Assessments is to ensure that the students with significant cognitive disabilities have the opportunity to participate in a challenging standards-based curriculum that encourages high academic expectations. These assessments are measures of student achievements in comparison with the state content standards and facilitate the goal of having these students participate in the state’s educational accountability system, as required by the federal government. The assessments are intended to help improve the instructions for these students by promoting appropriately high expectations.
1.1 The State-Developed Alternate Assessment
The 1997 amendments to the Individuals with Disabilities Education Act (IDEA 1997) mandated that all students participate in the state assessment. Further, IDEA 1997 included a requirement for states to develop alternate assessments and guidelines for participation in alternate assessments for the small percentage of students whose disabilities preclude them from participation in the general assessments, even with accommodations. IDEA 2004 established additional expectations. Section 612 (d)(1)(A)(vi)(bb)(AA)-(BB) of IDEA 2004 requires that each individualized education program (IEP) include a “statement of why the child cannot participate in the regular assessment, and the particular assessment selected is appropriate for the child”.
The 2002 amendments to the ESEA require the participation of all students in the state academic assessment system. The 2003 ESEA regulations related to alternate assessments clarify that an alternate assessment must
be aligned with the state’s content standards;
yield results in English language arts and mathematics;
be designed and implemented in a manner that supports use of the results as an indicator of Adequate Yearly Progress (AYP); and
exercise the same technical rigor as other state assessments.
Again, the 2015 reauthorization of the Every Student Succeeds Act (ESSA) regulations specifies that an alternate assessment may be based on alternate achievement standards and the number of students participating in the alternate assessment may not exceed one percent of those of all students in the grade tested at the state and district levels.
The vision for the South Carolina alternate assessment system was initiated in early 1998 in response to the IDEA 1997 regulations. This vision has driven the development and revision of the alternate assessments in South Carolina. A core team of staff from the South Carolina Department of Education (SCDE) Offices of Special Education Services, Assessment, Research, and Curriculum and Standards met in March 1998 to develop a plan for designing an alternate assessment to meet the IDEA 1997 mandate and to be included in the state assessment system. The team’s first steps were to convene a steering committee and seek technical assistance from the Mid-South Regional Resource Center (MSRRC) to explore strategies for designing an alternate assessment.
Spring 2017 Technical Report
South Carolina Alternate Assessment 5 American Institutes for Research
The Alternate Assessment Steering Committee convened May 12, 1998, to assist SCDE in determining how to include students with significant cognitive disabilities in statewide assessments. The committee was made up of parents, special education and general education teachers, administrators, and representatives from other agencies. Dr. Ken Olsen of MSRRC provided the committee with technical assistance, including information on IDEA 1997 requirements, examples of options that some states were using or considering, and research available on alternate assessment. He facilitated a process that allowed the steering committee to reach shared foundational beliefs, address eligibility criteria, discuss the content and performance standards, and outline development plans.
To ensure that all students with significant cognitive disabilities were included in the testing and accountability systems and had appropriate access to instruction in the South Carolina academic standards, the steering committee determined that the alternate assessment would be based on the following principles:
All children can learn, be expected to meet, and be challenged to meet high standards.
Special education is an extension and adaptation of the general education program and curriculum, rather than an alternate or separate system.
The South Carolina State Board-approved standards are the foundation for the alternate assessment.
The alternate assessment must be defensible in terms of feasibility, validity, reliability, and comparability.
Results of the alternate assessment must be used to improve planning, instruction, and learning.
An alternate assessment is appropriate for the students for whom the state assessment is not appropriate, even with accommodations.
The alternate assessment is designed for a diverse group of students and should be flexible enough to address their individual needs.
The committee articulated these goals for the alternate assessment:
Provide evidence that the student has acquired the skills and knowledge necessary to become as independent as possible
Document the student’s performance and the performance of the programs serving the student
Merge instructional best practice, instruction in state standards and assessment activities
Provide information in the development of curriculum that is responsive to the student’s needs
The steering committee created the following participation guidelines to guide IEP team decisions regarding students who should participate in the alternate assessment:
Spring 2017 Technical Report
South Carolina Alternate Assessment 6 American Institutes for Research
• The student demonstrates significant cognitive disabilities, which result in performance that is substantially below grade-level achievement expectations even with the use of accommodations and modifications.
• The student accesses the state-approved curriculum standards at less complex levels and with extensively modified instruction.
• The student has current adaptive skills requiring extensive direct instruction and practice in multiple settings to accomplish the application and transfer of skills necessary for application in school, work, home, and community environments.
• The student is unable to apply or use academic skills across natural settings when instructed solely or primarily through classroom instruction.
• The student’s inability to achieve the state grade-level achievement expectations is not the result of excessive or extended absences or social, cultural, or economic differences.
NOTE: after the reauthorization of the ESEA, known as the No Child Left Behind Act (NCLB) in 2002, the South Carolina Alternate Assessment Advisory Committee added the term “significant cognitive disabilities” to the criteria for the alternate assessment in 2003.
1.1.1 PACT-Alt
The steering committee recommended that the state develop a portfolio collection of evidence of student progress toward the South Carolina academic standards similar in design to the Kentucky Portfolio Alternate Assessment. The committee also recommended that SCDE prepare a request for proposal (RFP) for a contractor to develop the alternate assessment. Advanced Systems in Measurement and Evaluation Inc. (ASME), which later became Measured Progress, was awarded the contract. This company, along with the Inclusive Large Scale Standards and Assessment (ILSSA) project at the University of Kentucky, began work with SCDE on the design of the Palmetto Achievement Challenges Test-Alternate (PACT-Alt).
A work group was convened to define the domain for instruction and assessment. To ensure that the South Carolina curriculum standards were the foundation for all students, including students with unique needs and abilities, the work group developed adaptations of the curriculum standards. The work group was made up of special education teachers, regular education teachers, parents, administrators, higher education personnel, representatives from community agencies, and SCDE personnel.
The work group affirmed that special education services must operate as an extension of the general education program and curriculum rather than as an alternate or separate system. The standards in this initial document were identified as concepts that every student, including students with moderate to severe disabilities, should know or be able to perform. These selected standards, which focused on skills that were deemed essential and attainable for every student, were directed toward the following goals:
Enhancing the quality of students’ communication skills
Spring 2017 Technical Report
South Carolina Alternate Assessment 7 American Institutes for Research
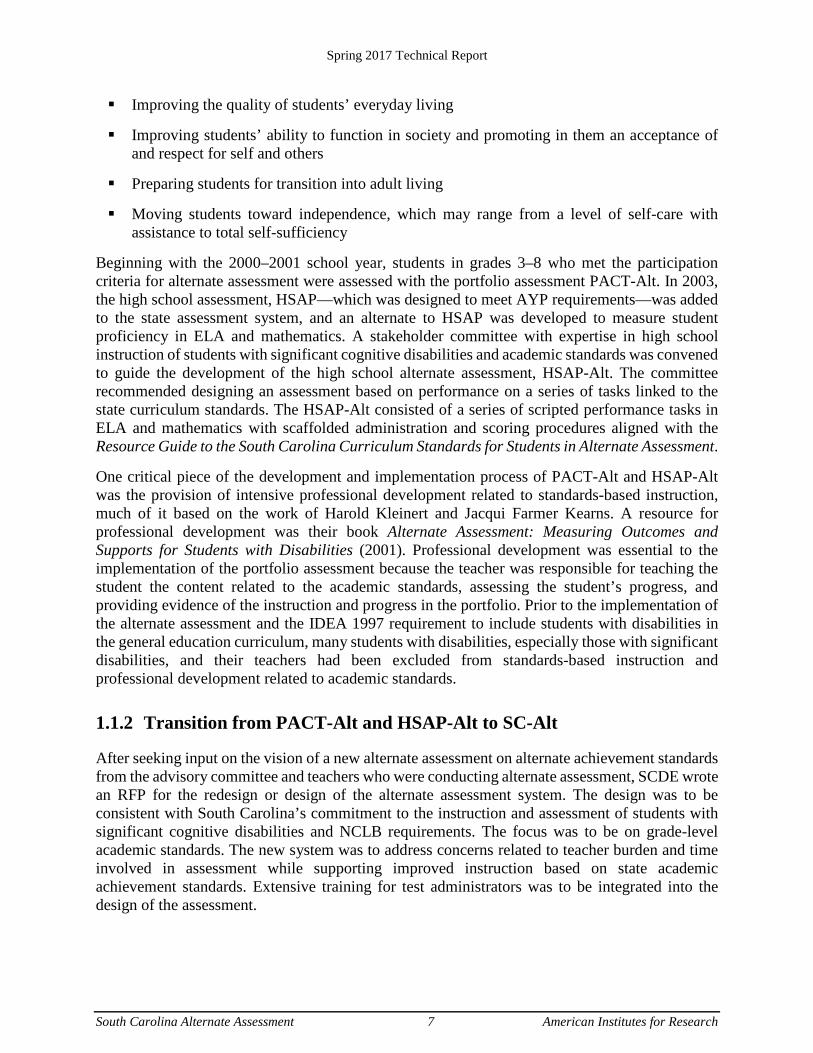
Improving the quality of students’ everyday living
Improving students’ ability to function in society and promoting in them an acceptance of and respect for self and others
Preparing students for transition into adult living
Moving students toward independence, which may range from a level of self-care with assistance to total self-sufficiency
Beginning with the 2000–2001 school year, students in grades 3–8 who met the participation criteria for alternate assessment were assessed with the portfolio assessment PACT-Alt. In 2003, the high school assessment, HSAP—which was designed to meet AYP requirements—was added to the state assessment system, and an alternate to HSAP was developed to measure student proficiency in ELA and mathematics. A stakeholder committee with expertise in high school instruction of students with significant cognitive disabilities and academic standards was convened to guide the development of the high school alternate assessment, HSAP-Alt. The committee recommended designing an assessment based on performance on a series of tasks linked to the state curriculum standards. The HSAP-Alt consisted of a series of scripted performance tasks in ELA and mathematics with scaffolded administration and scoring procedures aligned with the Resource Guide to the South Carolina Curriculum Standards for Students in Alternate Assessment.
One critical piece of the development and implementation process of PACT-Alt and HSAP-Alt was the provision of intensive professional development related to standards-based instruction, much of it based on the work of Harold Kleinert and Jacqui Farmer Kearns. A resource for professional development was their book Alternate Assessment: Measuring Outcomes and Supports for Students with Disabilities (2001). Professional development was essential to the implementation of the portfolio assessment because the teacher was responsible for teaching the student the content related to the academic standards, assessing the student’s progress, and providing evidence of the instruction and progress in the portfolio. Prior to the implementation of the alternate assessment and the IDEA 1997 requirement to include students with disabilities in the general education curriculum, many students with disabilities, especially those with significant disabilities, and their teachers had been excluded from standards-based instruction and professional development related to academic standards.
1.1.2 Transition from PACT-Alt and HSAP-Alt to SC-Alt
After seeking input on the vision of a new alternate assessment on alternate achievement standards from the advisory committee and teachers who were conducting alternate assessment, SCDE wrote an RFP for the redesign or design of the alternate assessment system. The design was to be consistent with South Carolina’s commitment to the instruction and assessment of students with significant cognitive disabilities and NCLB requirements. The focus was to be on grade-level academic standards. The new system was to address concerns related to teacher burden and time involved in assessment while supporting improved instruction based on state academic achievement standards. Extensive training for test administrators was to be integrated into the design of the assessment.

Spring 2017 Technical Report
South Carolina Alternate Assessment 8 American Institutes for Research
In September 2004, a contract was awarded to American Institutes for Research (AIR) to assist the state in revising the alternate assessment. AIR managed the administration and analyses of the PACT-Alt and HSAP-Alt assessments during the 2004–2005 and 2005–2006 school years while developing the new alternate assessment, the South Carolina Alternate Assessment (SC-Alt), with SCDE.
The SC-Alt is aligned to the South Carolina’s Extended Content Standards. The extended standards are linked explicitly to the South Carolina academic standards for grades 3–8 and high school, although at a less complex or prerequisite level. In 2010, high school science was changed to biology.
Each subject of SC-Alt has three forms designed for elementary, middle, and high school students. Assignment to forms is based on the student’s age on September 1 of the tested year; 9- and 10-year-olds take the elementary form, 11- to 13-year-olds take the middle school form, and 16-year-olds take the high school form.
The SC-Alt consists of a series of performance tasks. It is stage adaptive. To minimize the test administrator (TA) and student testing burden, TAs only administered the tasks that are well-suited to the student’s ability. Item scoring is scaffolded for students to earn partial scores.
The IEP team for each student decided whether that student was eligible to take the SC-Alt.
Student participation of the SC-Alt has been included in the federal participation calculations for ELA and mathematics from 2007 to 2014 and for science and social studies from 2008 to 2017.
1.2 SC-NCSC for ELA and Mathematics
From 2015 to 2017, SCDE adopted South Carolina’s National Center and State Collaborative (SC-NCSC) assessment for ELA and mathematics. In 2018, SCDE will continue to administer SC-NCSC for students in grades 3–8.
Since 2015, South Carolina has been a member of NCSC, a collaborative of 24 states and five organizations. The collaborative was funded by a General Supervision Enhancement Grant (GSEG) from the U.S. Department of Education’s Office of Special Education Services (OSES) to develop an NCSC assessment. NCSC is an alternate assessment based on alternate achievement standards (AA-AAS) for students with significant cognitive disabilities.
The SC-NCSC assessment is a state-specific version of the NCSC assessment and is developed to ensure that all students with significant cognitive disabilities can participate in an assessment that is a measure of what they know and can do in relation to the grade-level South Carolina College- and Career-Ready Standards (SCCCRS). The SC-NCSC assessment is administered to students who meet the participation guidelines for alternate assessment and who are between the ages of 8 and 13 or are age 16 on September 1 of the assessment year. (These are typically the ages of students who are in grades 3–8 and 11.) Unlike the SC-Alt, the SC-NCSC assessment is grade-specific. Students in each grade are assessed in both ELA and mathematics.

Spring 2017 Technical Report
South Carolina Alternate Assessment 9 American Institutes for Research
1.3 New SC-Alt Online Assessment
In 2016, SCDE decided to transform the current SC-Alt that is by grade band and administered on paper to grade-level tests that will be administered online in all subject tests. Starting in 2018, the new SC-Alt Online Assessment, referred to as SC-Alt1, will be administered for students in grades 3–8 and 11 in ELA and mathematics; grades 4, 6, 8, and 11 in science; and grades 5, 7, and 11 in social studies.
For this purpose, for ELA and mathematics, the NCSC Core Content Connectors were adopted. The connectors that NCSC developed associate the core content of ELA and mathematics standards with numerous resources to support instruction and assessment. The NCSC Core Content Connectors can be found at https://wiki.ncscpartners.org/index.php/Main_Page. In addition, SCDE also conducted a crosswalk between the SCCCRS and NCSC Core Content Connectors for each test. In item development, item writers ensured the accurate linkage of the NCSC Core Content Connectors to the SCCCRS.
For science, social studies (grades 3–8), and U.S. history (high school), the prioritized standards based on the existing grade-level content standards were developed. The prioritized standards can be found at http://ed.sc.gov/tests/assessment-information/testing-swd/sc-alt/sc-alt-social-studies-instructional-and-assessment-guides.
The existing science and social studies items were re-aligned to these standards and crosswalks. The newly developed items in all subjects were written to these standards and crosswalks. The newly developed SC-Alt1 items were field tested in spring 2017 as independent field tests (IFT) in ELA, mathematics, science, social studies, and U.S. History and the Constitution (U.S. History).
1.4 2017 Administration
The 2017 administration is summarized in Table 1. One of the four forms of each NCSC test was administered for each grade and subject in ELA and mathematics. Students in grades 3–8 and 11 took the test designed for that grade. The SC-Alt was administered for science and social studies. The tests were by grade band. While high school students were not tested operationally in social studies, they were required to take the U.S. History SC-Alt1 IFT.Similarly, all students were required to take the SC-Alt1 IFTs. More information on the SC-Alt1 field test plan can be found in Section 4.2.4. The SC-NCSC and SC-Alt Science/Biology and Social Studies are used for reporting and AYP purposes. The purpose of SC-Alt1 IFTs is to enlarge item banks for the future grade-level online tests. This technical report summarizes test development, item development, standard setting result, test equating, scaling, and scoring process, and 2017 test administrations, results, and test quality for SC-Alt Science/Biology and Social Studies and SC-Alt1 IFT, respectively. It provides comprehensive and detailed evidence in support of the validity of the assessments for its intended use.
Spring 2017 Technical Report
South Carolina Alternate Assessment 10 American Institutes for Research
For SC-NCSC, the test development, item development, standard setting process, test equating and scaling procedure, and additional validity evidence can be found in NCSC 2015 technical report.
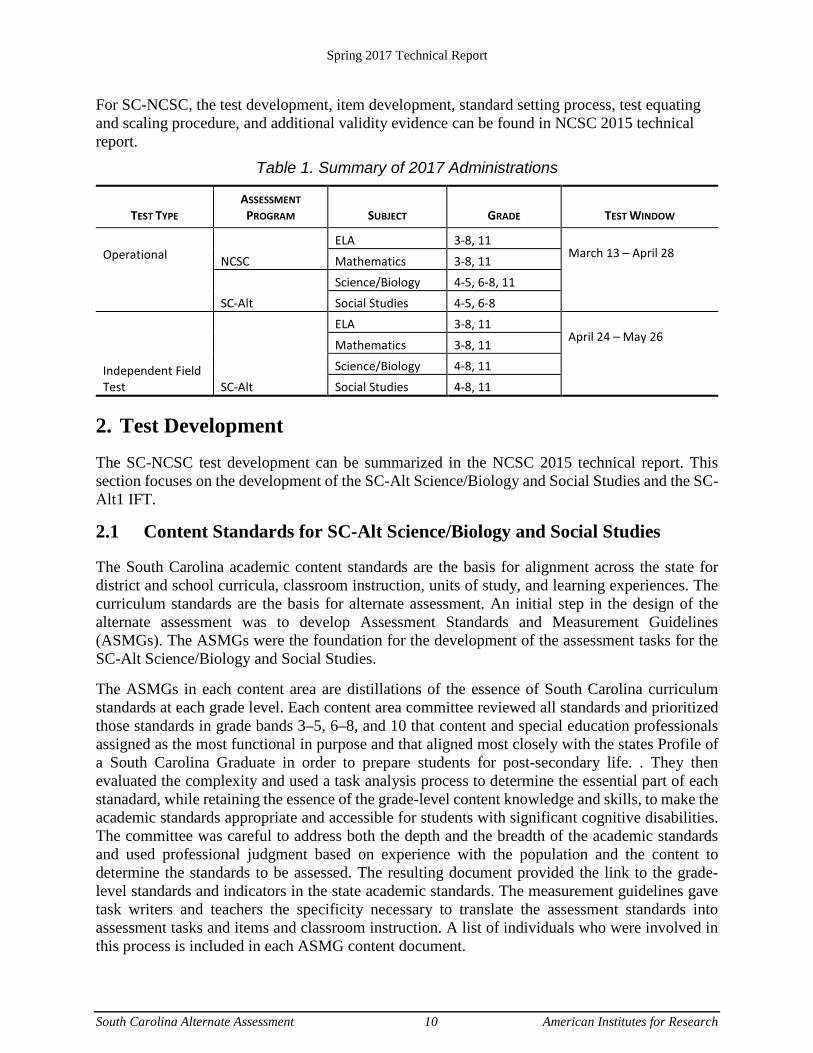
Table 1. Summary of 2017 Administrations
TEST TYPE ASSESSMENT PROGRAM SUBJECT GRADE TEST WINDOW
Operational
NCSC
ELA 3-8, 11 March 13 – April 28
Mathematics 3-8, 11
SC-Alt Science/Biology 4-5, 6-8, 11 Social Studies 4-5, 6-8
Independent Field Test SC-Alt
ELA 3-8, 11 April 24 – May 26
Mathematics 3-8, 11 Science/Biology 4-8, 11 Social Studies 4-8, 11
2. Test Development The SC-NCSC test development can be summarized in the NCSC 2015 technical report. This section focuses on the development of the SC-Alt Science/Biology and Social Studies and the SC-Alt1 IFT.
2.1 Content Standards for SC-Alt Science/Biology and Social Studies
The South Carolina academic content standards are the basis for alignment across the state for district and school curricula, classroom instruction, units of study, and learning experiences. The curriculum standards are the basis for alternate assessment. An initial step in the design of the alternate assessment was to develop Assessment Standards and Measurement Guidelines (ASMGs). The ASMGs were the foundation for the development of the assessment tasks for the SC-Alt Science/Biology and Social Studies.
The ASMGs in each content area are distillations of the essence of South Carolina curriculum standards at each grade level. Each content area committee reviewed all standards and prioritized those standards in grade bands 3–5, 6–8, and 10 that content and special education professionals assigned as the most functional in purpose and that aligned most closely with the states Profile of a South Carolina Graduate in order to prepare students for post-secondary life. . They then evaluated the complexity and used a task analysis process to determine the essential part of each stanadard, while retaining the essence of the grade-level content knowledge and skills, to make the academic standards appropriate and accessible for students with significant cognitive disabilities. The committee was careful to address both the depth and the breadth of the academic standards and used professional judgment based on experience with the population and the content to determine the standards to be assessed. The resulting document provided the link to the grade-level standards and indicators in the state academic standards. The measurement guidelines gave task writers and teachers the specificity necessary to translate the assessment standards into assessment tasks and items and classroom instruction. A list of individuals who were involved in this process is included in each ASMG content document.
Spring 2017 Technical Report
South Carolina Alternate Assessment 11 American Institutes for Research
To ensure the validity of the overall assessment process, a great deal of time and effort was spent obtaining input from various sources, including the State Alternate Assessment Advisory Committee, classroom teachers, parents, and other agency personnel. The State Alternate Assessment Advisory Committee meets to provide oversight to the SC-Alt Science/Biology and Social Studies. Their input has been taken into consideration to improve SC-Alt Science/Biology and Social Studies at each step of its development and maintainess.
The South Carolina State Board of Education adopted the revised ELA and mathematics academic standards in August 2007 and May 2008. The South Carolina State Board of Education required the replacement and eventually replaced the high school physical science end-of-course assessment with a biology end-of-course assessment.
To provide specificities for instructions and assessments, during the 2007 and 2008 school years, committees of special educators and general educators met to extend the revised ELA, mathematics, science, and biology academic standards, including those for non-tested grades. These documents, referred to as the extended standards, replaced the ASMGs.
In 2009, the content standards for social studies were developed.
2.2 Content Standards for SC-Alt1 IFT
The NCSC content standards were adopted for the ELA and mathematics tests for the SC-Alt Online Assessment IFTs. The content standards for science IFTs were newly developed. The existing content standards for social studies remained unchanged as the IFT standards. The strands that NCSC assessed, the core concepts for science, and the content standards for social studies are included in Appendix G. For each core concept for science tests, an essense statement clearly specifies what the students need to know and able to do. By the essense statement, the content standards are established at three complex levels: the leaset complex, the middle level of complexity, and the most complex. The standards for middle level complexity was first developed for instructional purpose. Then activity adaptations were made for less complexity and more complexity. Each content standard for social studies, essential concepts were developed to narrow down the scope of content for instruction to be based on. Then the literacy skills were addressed to prioritize the literacy skill. Finally, the application of the literacy skills at the concrete communication level specifies the examples demonstratint the relationship of the skill to the essential concepts. Three communication levels are considered:
• Abstract symbolic – students can typically use a vocabulary of picueres, picture symbol, and words to communicate.
• Concreate symbolic – students begin to use pictures or other symbols to communicate.
• Pre-Symbolic – students may not yet have a sonsistent system of communication.
Spring 2017 Technical Report
South Carolina Alternate Assessment 12 American Institutes for Research
2.3 2017 Tests
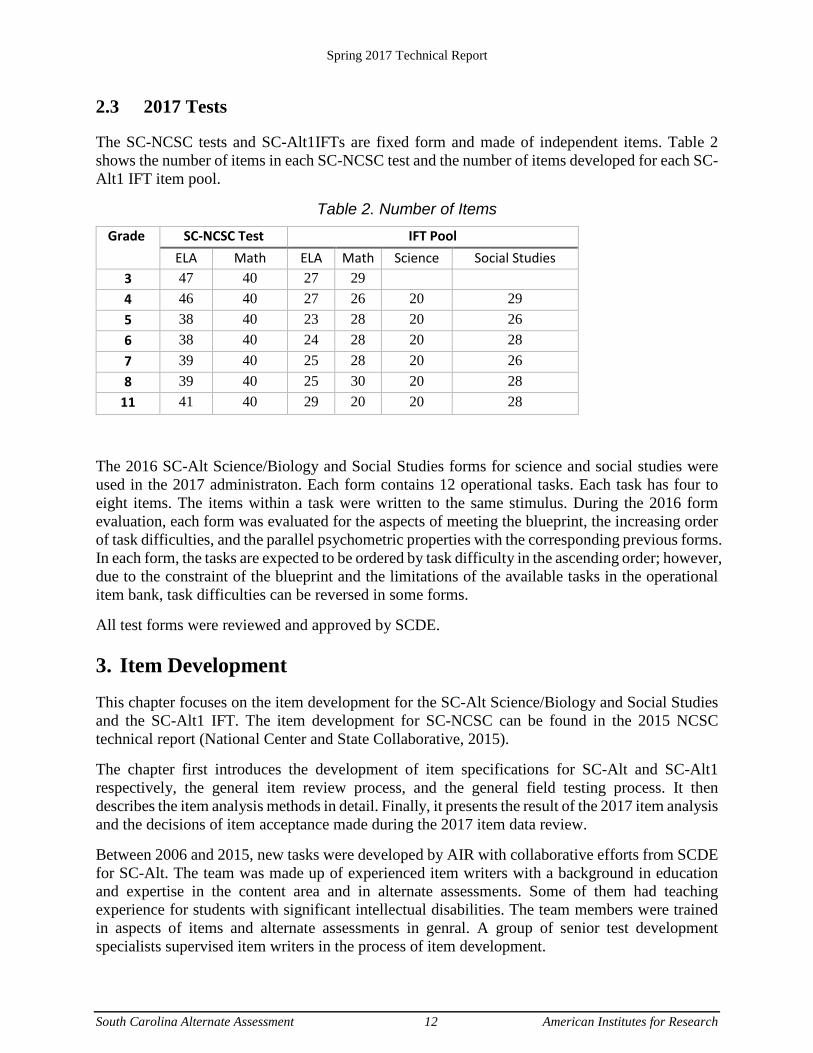
The SC-NCSC tests and SC-Alt1IFTs are fixed form and made of independent items. Table 2 shows the number of items in each SC-NCSC test and the number of items developed for each SC-Alt1 IFT item pool.
Table 2. Number of Items Grade SC-NCSC Test IFT Pool
ELA Math ELA Math Science Social Studies 3 47 40 27 29 4 46 40 27 26 20 29 5 38 40 23 28 20 26 6 38 40 24 28 20 28 7 39 40 25 28 20 26 8 39 40 25 30 20 28
11 41 40 29 20 20 28
The 2016 SC-Alt Science/Biology and Social Studies forms for science and social studies were used in the 2017 administraton. Each form contains 12 operational tasks. Each task has four to eight items. The items within a task were written to the same stimulus. During the 2016 form evaluation, each form was evaluated for the aspects of meeting the blueprint, the increasing order of task difficulties, and the parallel psychometric properties with the corresponding previous forms. In each form, the tasks are expected to be ordered by task difficulty in the ascending order; however, due to the constraint of the blueprint and the limitations of the available tasks in the operational item bank, task difficulties can be reversed in some forms.
All test forms were reviewed and approved by SCDE. 3. Item Development This chapter focuses on the item development for the SC-Alt Science/Biology and Social Studies and the SC-Alt1 IFT. The item development for SC-NCSC can be found in the 2015 NCSC technical report (National Center and State Collaborative, 2015).
The chapter first introduces the development of item specifications for SC-Alt and SC-Alt1 respectively, the general item review process, and the general field testing process. It then describes the item analysis methods in detail. Finally, it presents the result of the 2017 item analysis and the decisions of item acceptance made during the 2017 item data review.
Between 2006 and 2015, new tasks were developed by AIR with collaborative efforts from SCDE for SC-Alt. The team was made up of experienced item writers with a background in education and expertise in the content area and in alternate assessments. Some of them had teaching experience for students with significant intellectual disabilities. The team members were trained in aspects of items and alternate assessments in genral. A group of senior test development specialists supervised item writers in the process of item development.

Spring 2017 Technical Report
South Carolina Alternate Assessment 13 American Institutes for Research
In fall 2016, the items for SC-Alt1 IFTs were developed in order to enlarge the item pools for future grade-level assessment. Only these items went through the process of item reviews, field testing, item analysis, and item data review.
3.1 Item Specification
For SC-Alt Science/Biology and Social Studies, at the beginning of item development, as recommended by the Advisory Committee, AIR item writers visited classrooms in South Carolina during January and February 2005 to observe teaching strategies and materials that were in use. They also reviewed PACT-Alt portfolios for examples of evidence that teachers used to demonstrate progress toward proficiency on grade-level standards and examined the characteristics of the HSAP-Alt performance event to build on the existing system.
Teacher focus groups convened during January 2005 obtained feedback from teachers on the types of tasks they believed were appropriate, the protocol format they preferred, and the materials they recommended for inclusion in the assessment.
Consideration of universal design, which takes into account of the following factors, was a focus throughout the development process.
o inclusive assessment population,
o precisely defined constructs,
o accessibility, non-biased across subgroups,
o amenability to accommodations,
o simple, clear, and intuitive instructions and procedures
o maximum readability and comprehensibility
o maximum eligibility
Items, including passages and response options, were developed to use objects, pictures, picture symbols, words, and numbers. Several tasks in all four content areas and at different levels of complexity were piloted with South Carolina teachers and students in March and May 2005. AIR staff then interviewed the pilot teachers to determine the item characteristics and parameters that teachers believed worked well or did not work. AIR then developed items that were field tested in 2006.
Based on the information collected, SC-Alt Science/Biology and Social Studies Style Guide were developed. The style guide serves as the specifications for item development, which facilitated each item development cycle between 2005 and 2015. The style guide specified format, type, and boilerplate language in item writing, standardaized manipulatives in item administration, and rubrics in item scoring. It set the ways for punctuaton, calitalization, contractions, abbreviations, and the converiosns to present numbers and dates and times. In additiona, it addressed the specific concerns in item development in each subject, such as units of measure in mathematics and terminologies in social studies.

Spring 2017 Technical Report
South Carolina Alternate Assessment 14 American Institutes for Research
For the SC-Alt1, a new Style Guide for Item Development was created and approved by SCDE before item development started in 2016. The new style guide specifies the item types, on computer screens. As the old guide, the new guide specifies item types, regulates the language for the items, specifies the ways to punctuation, calitalization, contractions, abbreviations, and conventions in numbers and dates and times, the lists special concerns in item writing for mathematics and social studies. In addition, for the online item presentation, the new guide spedifies the the stimulus and item layouts, and testing icons, such as the stop sign indicating the end of test, and the font size and image dimensions for options.
3.2 Item Review Process
Draft items are reviewed at several stages by various groups or committees, such as South Carolina teachers in special education and in general education, SCDE assessment staff, the Bias and Sensitivity Committee, psychometricians, editors, and other specialists in alternate assessment and instruction. Items that passed content reviews are field-tested in the following administration year.
The process of task and item development begins with the creation of a task kernel by AIR. Upon approval, items and stimulus are fully developed. Then, each stimulus and associated items go through the following stages of review:
Group Review: The group review is led by content leads. The group is made up of members with various background and expertise. At this stage, tasks and items are examined for their grade or grade-band appropriateness, content accuracy, best-meet content extensions, best-meet AIR internal style guidelines for item development, and clarity expectations.
Special Education Review: At this stage, newly developed tasks and items are reviewed by an internal special education expert to make sure that these tasks and items not only align to the content extensions but are also accessible for students across a wide spectrum of intellectual and physical disabilities. When applicable, the reviewer designated tasks or items as “Access Limited.” This means that a task was inaccessible to students with a specific disability, e.g., blindness. To determine if an item is “Access Limited” (AL), the following process is followed:
o Item writers recommend items to be considered as AL items.
o The recommended items are reviewed during group review and special education review within AIR.
o SCDE reviews the items identified by AIR.
o The content and fairness review committee finally decide if the items are AL items.
• Editor Review: At this stage, each task is reviewed by a content editor to make sure that language in the task conformed to standard editorial and style conventions outlined in theSC-Alt style guide.
Senior Content Review: At this stage, each task and item is reviewed by the South Carolina Alternate Assessment item development manager, a senior content specialist for the project. Tasks and items are vetted to ensure that they align to the content extensions to which they

Spring 2017 Technical Report
South Carolina Alternate Assessment 15 American Institutes for Research
are written, are free of typographical or technical errors, and are ready for the review by the SCDE.
SCDE Review: At this stage, each task or item is reviewed by the staff at SCDE with the following options:
– Accept all individual items associated with a task as they are submitted (“Accept as Appears”)
– Request specific revisions in the content of individual item(s) associated with a task due to the alignment of the content extensions (“Accept as Revised”)
– Request AIR for substantial changes of individual items associated with a task and submit the task for a second SCDE review (“Revise and Resubmit”)
– Reject the task and the associated items entirely (e.g., for failure to meet content extensions, inappropriate for target grade-band, general lack of clarity)
Bias and Content Committee Review: Following SCDE approval, the Bias and Content Committee, made up of educators from general education and special education, reviewed newly developed tasks according to the following criteria and the principle of universal design. The committee also made suggestions if they felt the need to make changes to some of the items.
- Content accuracy
- Alignment to the South Carolina Content Standards of the assessment
- Correct answer key for each item
- Appropriate item format to item content
- Avoiding item ambiguity
- Good readability
- Accuracy of tables and graphics
- Accuracy of formula, figures, and graphics
3.3 Item Types and Scoring Rubrics
3.3.1 SC-NCSC Items
SC-NCSC items are multiple-choice items. If the key is selected, students earn one point.
3.3.2 SC-Alt Science/Biology and Social Studies Items
The SC-Alt Science/Biology and Social Studies has three item types: two-option multiple-choice items, three-option multiple-choice items, and engagement items.
Spring 2017 Technical Report
South Carolina Alternate Assessment 16 American Institutes for Research
Two-option and three-option multiple-choice items measure students’ academic achievements. For two-option multiple-choice items, if a student answers an item correctly, he or she receives one point; otherwise, the student receives zero points. For three-option multiple-choice items, if a student answers an item successfully on the first attempt, he or she receives two points. If the student’s first attempt fails, the option associated with the incorrect response is removed, making the item a two-option multiple-choice item. The student is then asked the question again. If the student is successful on the second attempt, he or she receives one point; otherwise, the student receives zero points. Items are grouped into tasks. Items that are associated with a theme belong to the same task. A theme is the stimulus of a task. The items within the task were written around the theme. There are four to six operational items in an operational task.
Engagement items are meant to measure student engagement or involvement at the beginning of an administration for students with severe cognitive disabilities. They are only included in tasks 1 and/or 2. In scoring, engagement items differ from the other types of items in that they are not scored as correct or incorrect. Rather, they are scored based on the test administrator’s judgment about how involved the student is during an activity. Student involvement is classified in four levels from the least engagement (level 1) to the most engagement (level 4). During a test administration, when an engagement item was presented to a student, test administrators observed and determined the level of student involvement based on the predetermined criteria. The administration of engagement items is a way to help students, especially those who have presymbolic understanding or other disability challenges, to be involved in testing so that they can demonstrate what they know and can do.
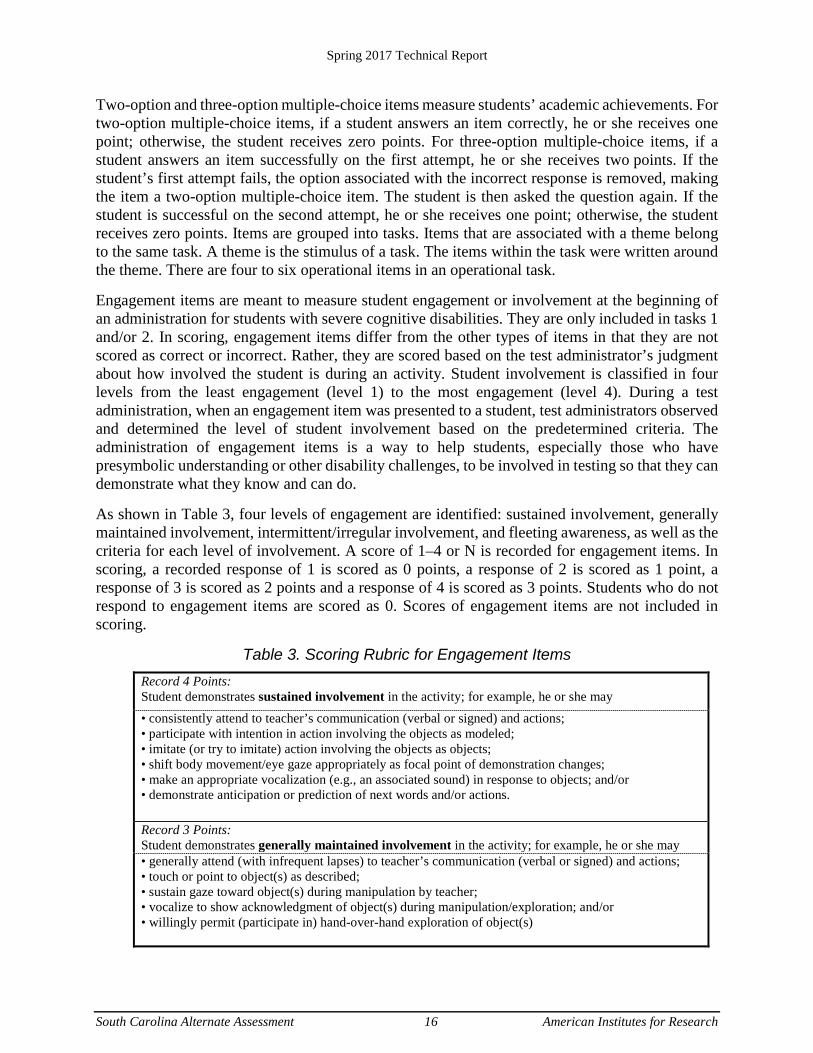
As shown in Table 3, four levels of engagement are identified: sustained involvement, generally maintained involvement, intermittent/irregular involvement, and fleeting awareness, as well as the criteria for each level of involvement. A score of 1–4 or N is recorded for engagement items. In scoring, a recorded response of 1 is scored as 0 points, a response of 2 is scored as 1 point, a response of 3 is scored as 2 points and a response of 4 is scored as 3 points. Students who do not respond to engagement items are scored as 0. Scores of engagement items are not included in scoring.
Table 3. Scoring Rubric for Engagement Items Record 4 Points: Student demonstrates sustained involvement in the activity; for example, he or she may • consistently attend to teacher’s communication (verbal or signed) and actions; • participate with intention in action involving the objects as modeled; • imitate (or try to imitate) action involving the objects as objects; • shift body movement/eye gaze appropriately as focal point of demonstration changes; • make an appropriate vocalization (e.g., an associated sound) in response to objects; and/or • demonstrate anticipation or prediction of next words and/or actions.
Record 3 Points: Student demonstrates generally maintained involvement in the activity; for example, he or she may • generally attend (with infrequent lapses) to teacher’s communication (verbal or signed) and actions; • touch or point to object(s) as described; • sustain gaze toward object(s) during manipulation by teacher; • vocalize to show acknowledgment of object(s) during manipulation/exploration; and/or • willingly permit (participate in) hand-over-hand exploration of object(s)
Spring 2017 Technical Report
South Carolina Alternate Assessment 17 American Institutes for Research
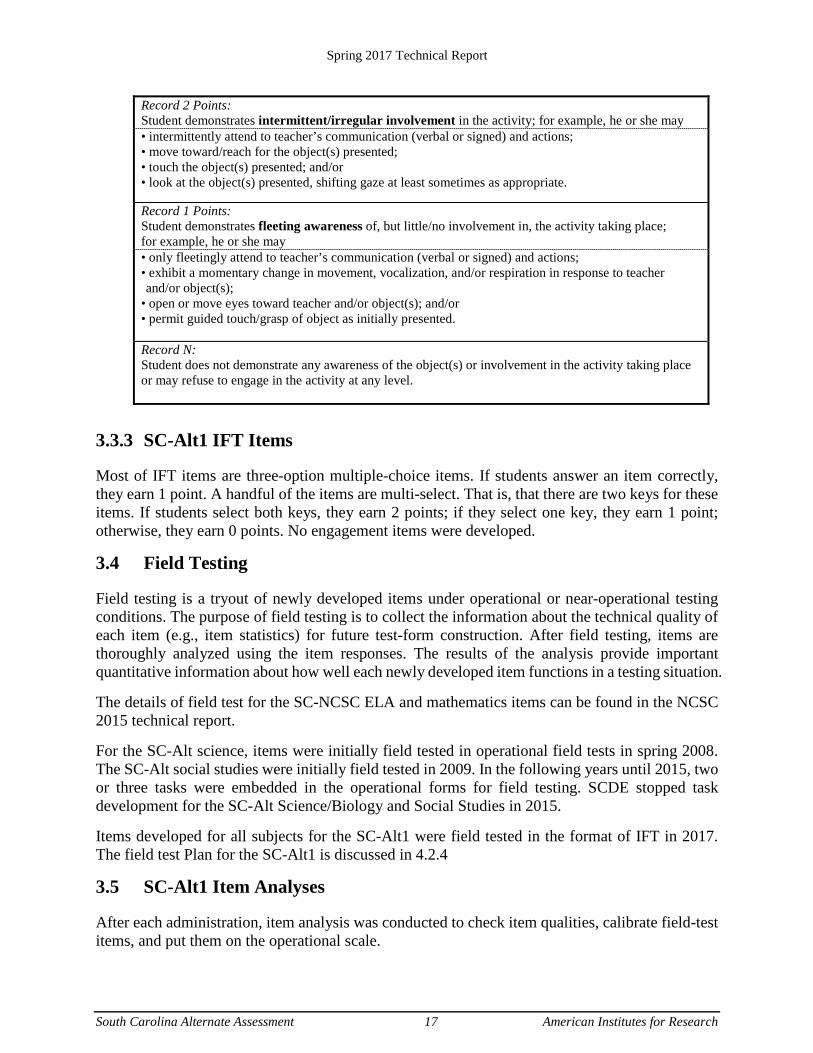
Record 2 Points: Student demonstrates intermittent/irregular involvement in the activity; for example, he or she may • intermittently attend to teacher’s communication (verbal or signed) and actions; • move toward/reach for the object(s) presented; • touch the object(s) presented; and/or • look at the object(s) presented, shifting gaze at least sometimes as appropriate.
Record 1 Points: Student demonstrates fleeting awareness of, but little/no involvement in, the activity taking place; for example, he or she may • only fleetingly attend to teacher’s communication (verbal or signed) and actions; • exhibit a momentary change in movement, vocalization, and/or respiration in response to teacher and/or object(s);
• open or move eyes toward teacher and/or object(s); and/or • permit guided touch/grasp of object as initially presented.
Record N: Student does not demonstrate any awareness of the object(s) or involvement in the activity taking place or may refuse to engage in the activity at any level.
3.3.3 SC-Alt1 IFT Items
Most of IFT items are three-option multiple-choice items. If students answer an item correctly, they earn 1 point. A handful of the items are multi-select. That is, that there are two keys for these items. If students select both keys, they earn 2 points; if they select one key, they earn 1 point; otherwise, they earn 0 points. No engagement items were developed.
3.4 Field Testing
Field testing is a tryout of newly developed items under operational or near-operational testing conditions. The purpose of field testing is to collect the information about the technical quality of each item (e.g., item statistics) for future test-form construction. After field testing, items are thoroughly analyzed using the item responses. The results of the analysis provide important quantitative information about how well each newly developed item functions in a testing situation.
The details of field test for the SC-NCSC ELA and mathematics items can be found in the NCSC 2015 technical report.
For the SC-Alt science, items were initially field tested in operational field tests in spring 2008. The SC-Alt social studies were initially field tested in 2009. In the following years until 2015, two or three tasks were embedded in the operational forms for field testing. SCDE stopped task development for the SC-Alt Science/Biology and Social Studies in 2015.
Items developed for all subjects for the SC-Alt1 were field tested in the format of IFT in 2017. The field test Plan for the SC-Alt1 is discussed in 4.2.4
3.5 SC-Alt1 Item Analyses
After each administration, item analysis was conducted to check item qualities, calibrate field-test items, and put them on the operational scale.
Spring 2017 Technical Report
South Carolina Alternate Assessment 18 American Institutes for Research
In 2017, as no field-test items were embedded in the operational forms, no item analysis was performed for SC-NCSCa and SC-Alt. Analysis was only conducted for items in the IFTs. The purpose of the item analysis is preliminary examination of how the item performs in operational seetings. The following sections describe the analysis methods, statistics use, evaluation criteria, 2017 analysis results, item data review, and the decision from the item data review meeting.
3.5.1 Data Preparation and Quality Check
As a strict rule for data processing, the data were carefully examined to verify the accuracy of the values. The frequency distributions of item responses were examined to identify potential scoring problems, such as out-of-range values.
After the accuracy of the data file was verified, item analysis was conducted. Several quality control procedures were undertaken to ensure the accuracy of these analyses. As an essential step, two psychometricians independently analyzed the data. Results of the parallel analyses were compared for consistency. These steps were highly effective in detecting any issues that might have influenced the interpretation of the item analysis results.
3.5.2 Item Analysis Overview
Item analysis includes classical item analysis, IRT analyses, and analysis of differential item functioning (DIF). All classical item analysis calculations and DIF statistics were performed with the AM software (American Institutes for Research & Cohen, 2003), which takes sampling variance into consideration. Because of the nature of classical item analysis, the analysis is conducted by form. IRT analyses were performed using Winsteps software. The following statistics were computed and evaluated:
Percentage of students in each score category
Average score of students in each score category
Adjusted polyserial correlation between item score and student raw score
Proportion of correctness
Fairness or DIF statistics
Proportion of students with omitted responses
Proportion of students with access limitation
Total number of students administered
Item infit and outfit
Rasch step parameters and RP50 values
Average Rasch step value
Spring 2017 Technical Report
South Carolina Alternate Assessment 19 American Institutes for Research
Winsteps produced item infit and outfit, Rasch difficulty, and RP50. The remaining statistics were generated by form through the AM software.
3.5.2.1 Classical Item Analysis
Classical item analysis procedures were employed to ensure that items functioned as intended with respect to the underlying scales. Computations were performed with the AM software. Key statistics that were computed and examined. The result can be found in Appendix A, Classical Item Statistics.
3.5.2.2 Item Discrimination
The item discrimination statistics indicate the extent to which each item differentiates between those examinees who possess the skills being measured and those who do not. In general, the higher the value, the more discriminating the item is. The discrimination index is calculated as the adjusted polyserial correlation between the item score and the raw score. For the purpose of the item analysis, omitted items were treated as not presented. In addition, the average score of examinees (proportion raw score to the form maximum score) at each item score point was estimated.
3.5.2.3 Item Difficulty
Field-test items that were either extremely difficult or extremely easy underwent review but were not necessarily deleted if they aligned with the test specifications.
The proportion of students at each score point category was determined, with the item difficulty index being calculated both as the item’s mean score and the average proportion correct. (This is analogous to p-value and indicates the ratio of the item’s mean score divided by the number of points possible.)
3.5.3 IRT Parameter Estimation and Equating
This section introduces the IRT model and item parameter estimation that were used for SC-Alt.
3.5.3.1 IRT Model
The SC-Alt employs Masters’ (1982) partial credit model (PCM) for polytomous items. Under the partial credit model, the probability of a student responding with an item score, given the student’s ability parameter θ, is
𝑃𝑃(𝑥𝑥𝑖𝑖|𝜃𝜃)=exp∑ (θ-δki)
xik=1
1+∑ exp∑ (θ-δki)jk=1
mij=1
(1)
Spring 2017 Technical Report
South Carolina Alternate Assessment 20 American Institutes for Research
where
i is an index over items, so with R items, 𝑖𝑖 = 1, … ,𝑅𝑅;
𝑚𝑚𝑖𝑖 is the number of response categories (minus 1) for item I;
𝑥𝑥𝑖𝑖 is the observed response to the item; and
𝛿𝛿𝑘𝑘𝑖𝑖 is the kth step for item i with 𝑚𝑚𝑖𝑖 total categories.
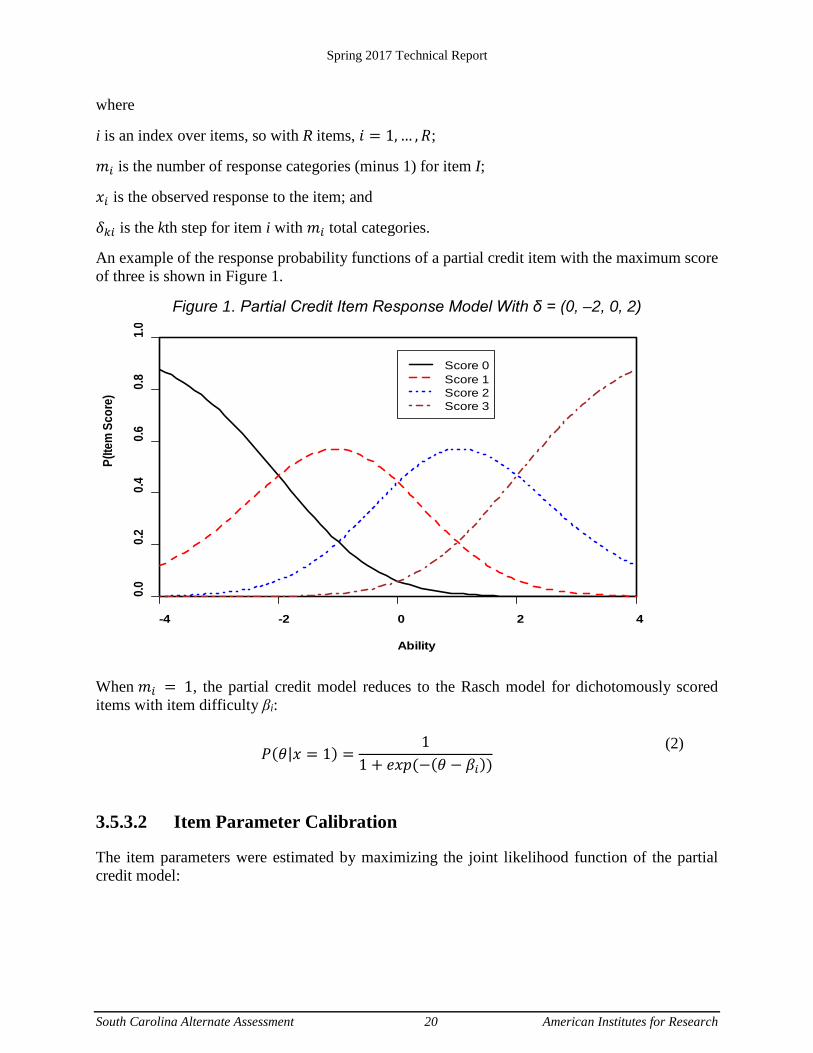
An example of the response probability functions of a partial credit item with the maximum score of three is shown in Figure 1.
Figure 1. Partial Credit Item Response Model With δ = (0, –2, 0, 2)
When 𝑚𝑚𝑖𝑖 = 1, the partial credit model reduces to the Rasch model for dichotomously scored items with item difficulty βi:
𝑃𝑃(𝜃𝜃|𝑥𝑥 = 1) =1
1 + 𝑒𝑒𝑥𝑥𝑒𝑒 (−(𝜃𝜃 − 𝛽𝛽𝑖𝑖))
(2)
3.5.3.2 Item Parameter Calibration
The item parameters were estimated by maximizing the joint likelihood function of the partial credit model:
-4 -2 0 2 4
0.0
0.2
0.4
0.6
0.8
1.0
Ability
P(Ite
m S
core
)
Score 0Score 1Score 2Score 3
Spring 2017 Technical Report
South Carolina Alternate Assessment 21 American Institutes for Research
arg max 𝛿𝛿 𝐿𝐿(𝛿𝛿) = ��exp∑ (𝜃𝜃𝑠𝑠-δki)
xik=1
1+∑ exp∑ (𝜃𝜃𝑠𝑠-δki)jk=1
mij=1
𝑁𝑁
𝑠𝑠=1
𝑅𝑅
𝑖𝑖=1
(1)
where R indexes the total number of items, N indexes the total number of students, 𝜃𝜃𝑠𝑠 is the person measure for the student s, and 𝛿𝛿𝑘𝑘𝑖𝑖 is the step value for step k on item i. Each step parameter is located at the point where the likelihood function for that step is maximized along the ability scale.
The joint maximum likelihood method yields estimates of item parameters and examinee abilities simultaneously. The item parameters were centered at their mean. No further constraints were used. The estimation was conducted using Winsteps version 3.73.0 (Linacre, 2011).
Item fit was evaluated using the infit and outfit statistics, both chi-square-based, in Winsteps output. The outfit statistic is sensitive to the unexpected observations at locations away from the item difficulty parameters. The infit statistic, under which the observations are weighted by the model variance, is more sensitive to discrepant observations close to the item difficulty values. Both statistics have an expected value of 1.0. Values greater than 1.0 indicate noise and unmodeled variance in the data. Values less than 1.0 indicate that the data fit the measurement model better than expected for the sample size, which could, for instance, indicate some degree of local dependence among items. For the South Carolina item data review, fit in range of 0.7 to 1.3 was adopted as the acceptable range for a measurement. When either statistic is out of this range, the item is flagged. For the potential establishment of vertical scales, items were freely calibrared by subject in 2017.
The IRT calibration results including item parameters and the infit and outfit indices are listed in Appendix B. IRT Statistics. If only the b1 parameter field is populated for an item, this is an indication that the item has a maximum score of 1 and is dichotomously scored. An item with a maximum score of 2 shows estimates for parameters b1 and b2.
3.5.4 Differential Item Functioning Analysis
Differential item functioning refers to items that appear to function differently across identifiable groups, typically across different demographic groups. Identifying DIF is important. It provides another chance to review items to make sure that they do not contain a cultural or other bias. Not all items that exhibit DIF are biased. Characteristics of the educational system may also lead to DIF. For example, if schools in low-income areas are less likely to offer geometry classes, students at those schools may perform more poorly on geometry items than would be expected, given their proficiency on other types of items. In this example, the curriculum, not the item, exhibits bias. However, DIF can indicate bias. Therefore, DIF is investigated and items are flagged items that appear to exhibit DIF for further review.
DIF was evaluated using a generalized Mantel-Haenszel procedure ( ; Zwick & Thayer, 1996; Zwick, Donoghue, & Grima, 1993) and by the standardized mean difference (SMD; Dorans & Kulick, 1986). The generalizations include (1) adaptation to polytomous items and (2) improved
2MH χ−
Spring 2017 Technical Report
South Carolina Alternate Assessment 22 American Institutes for Research
variance estimators to render the test statistics valid under complex sample designs. With and SMD estimates in hand, items were classified into one of three categories, as described in Table 4. Items in the “C” DIF category, indicating evidence of DIF on the items, were flagged for review. Items showing “C” DIF were dropped if the review committee found content evidence of item bias.
For the 2017 SC-Alt IFT items, the following DIF comparisons were conducted:
Female vs. Male African American vs. White
The DIF analysis was performed using the AM software. The application employs the Mantel-Haenszel (MH) procedure that (1) is generalized to polytomously scored items and (2) improves the variance estimation to render the test statistics valid under complex sample designs. The student ability estimates on the test, either on the scale score scale or the theta scale, were used as the ability-matching variable. Those estimates were divided into five intervals in order to obtain the MH chi-square DIF statistics. In addition, the application also computed the log-odds ratio, the standard error of the log-odds ratio, the MH-delta (δ) for the dichotomously scored items, and the SMD and standard error of SMD for the polytomously scored items. The purification method described by Holland and Thayer (1988) is also implemented in the application.
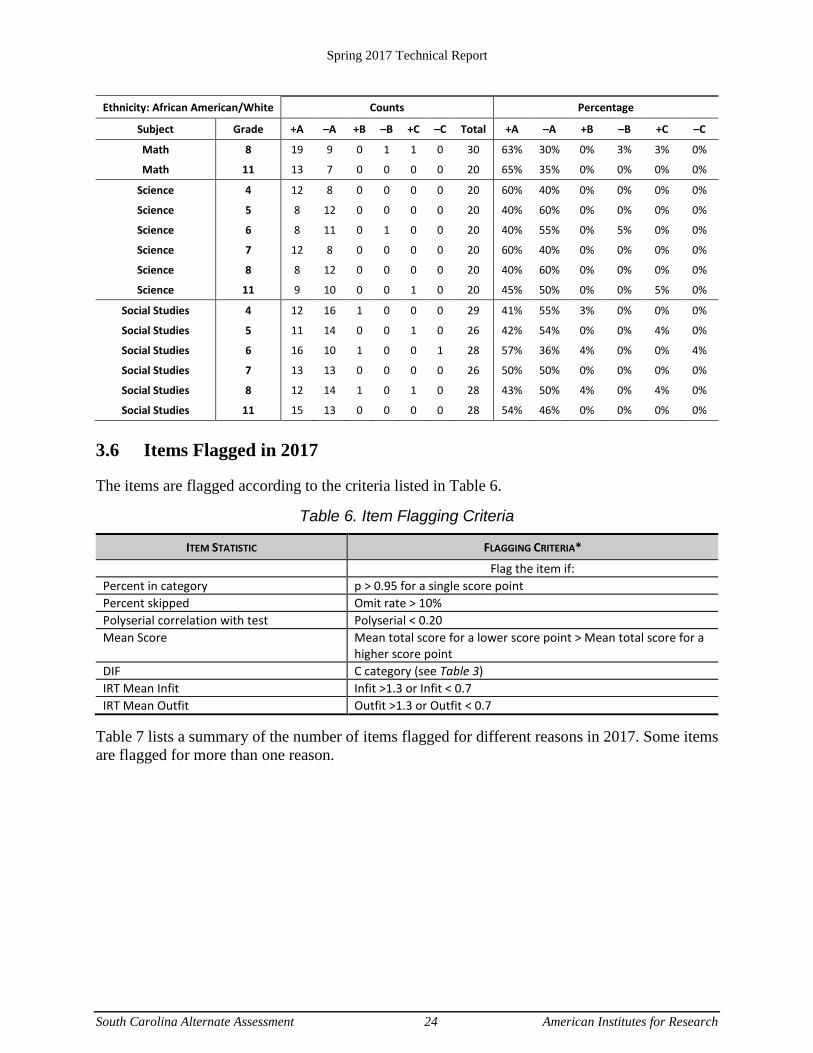
Items were classified into three categories (A, B, or C) ranging from no DIF to mild DIF to severe DIF, according to the DIF classification convention listed in Table 4. Items were also categorized as positive DIF (i.e., +A, +B, or +C), signifying that the item favored the focal group (female and African American), or negative DIF (i.e., –A, –B, or –C), signifying that the item favored the reference group (male, White, or non-economically disadvantaged). DIF results can be found in the DIF Analysis section in Appendix A. and summarized in Table 5.
A DIF statistic is taken as reliable when there are at least 50 students in each of the focal and reference groups. Items flagged as DIF items are subjected to additional review to ensure adherence to fairness and sensitivity guidelines.
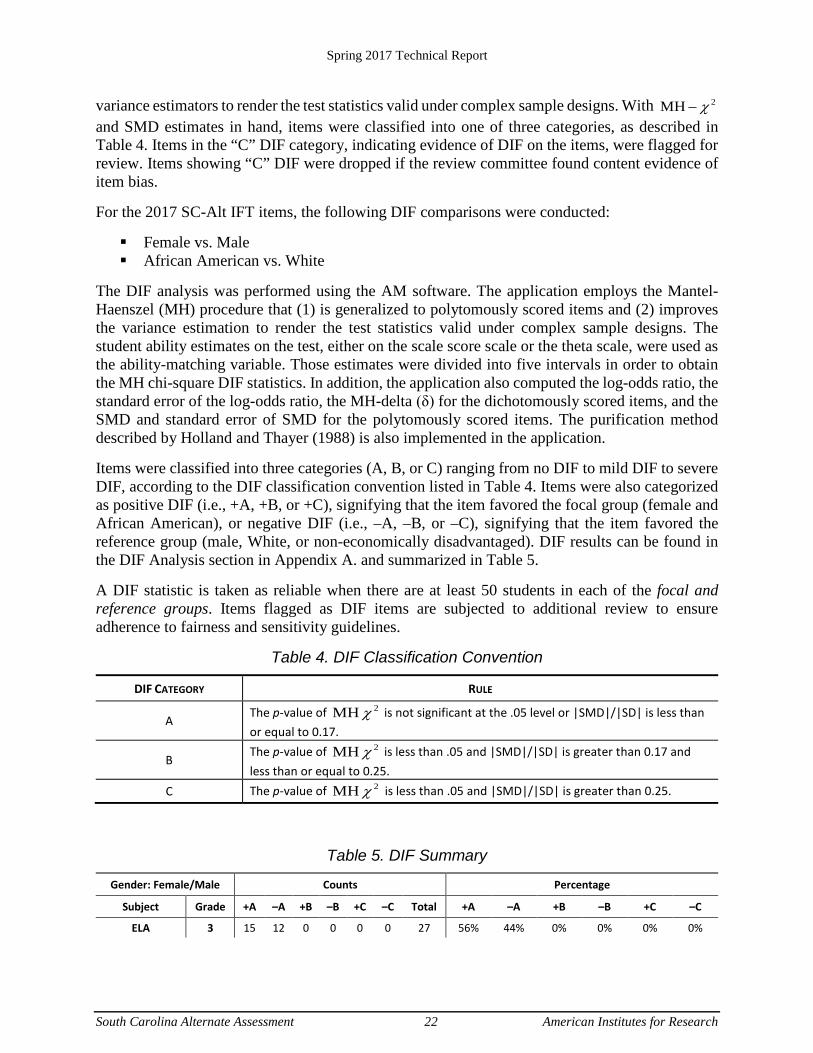
Table 4. DIF Classification Convention
DIF CATEGORY RULE
A The p-value of is not significant at the .05 level or |SMD|/|SD| is less than or equal to 0.17.
B The p-value of is less than .05 and |SMD|/|SD| is greater than 0.17 and less than or equal to 0.25.
C The p-value of is less than .05 and |SMD|/|SD| is greater than 0.25.
Table 5. DIF Summary
Gender: Female/Male Counts Percentage
Subject Grade +A –A +B –B +C –C Total +A –A +B –B +C –C
ELA 3 15 12 0 0 0 0 27 56% 44% 0% 0% 0% 0%
2MH χ−
2MH χ
2MH χ
2MH χ
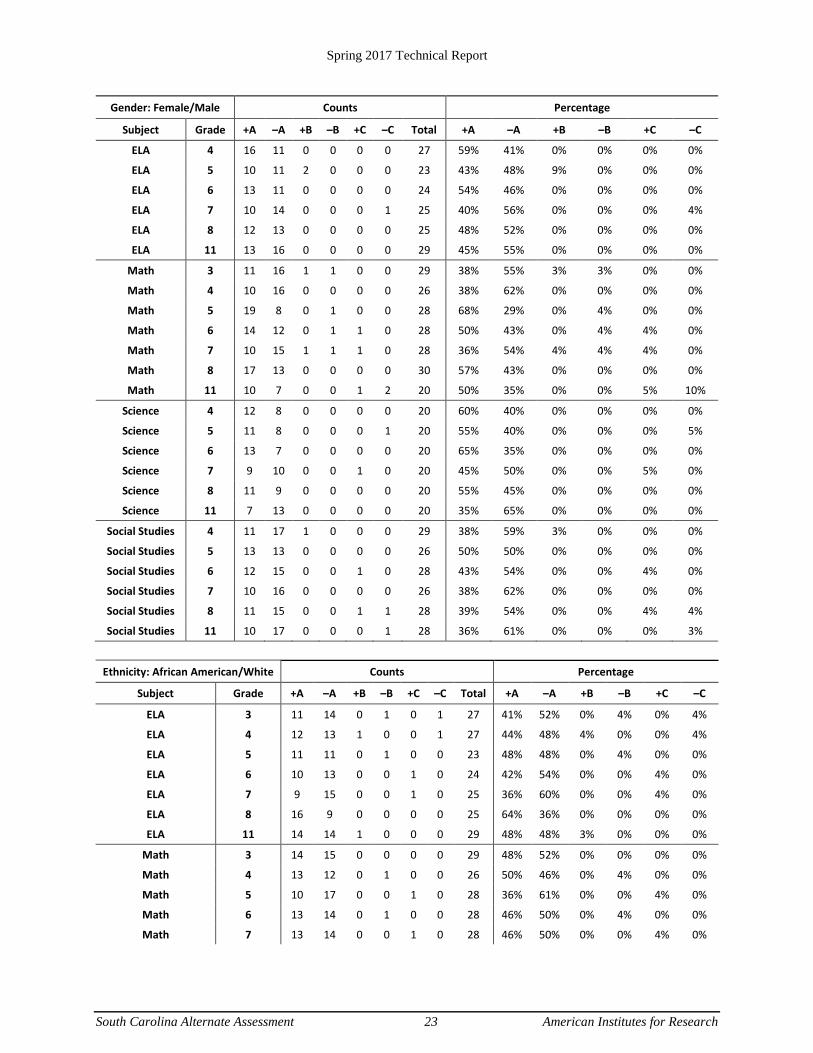
Spring 2017 Technical Report
South Carolina Alternate Assessment 23 American Institutes for Research
Gender: Female/Male Counts Percentage
Subject Grade +A –A +B –B +C –C Total +A –A +B –B +C –C
ELA 4 16 11 0 0 0 0 27 59% 41% 0% 0% 0% 0%
ELA 5 10 11 2 0 0 0 23 43% 48% 9% 0% 0% 0%
ELA 6 13 11 0 0 0 0 24 54% 46% 0% 0% 0% 0%
ELA 7 10 14 0 0 0 1 25 40% 56% 0% 0% 0% 4%
ELA 8 12 13 0 0 0 0 25 48% 52% 0% 0% 0% 0%
ELA 11 13 16 0 0 0 0 29 45% 55% 0% 0% 0% 0%
Math 3 11 16 1 1 0 0 29 38% 55% 3% 3% 0% 0%
Math 4 10 16 0 0 0 0 26 38% 62% 0% 0% 0% 0%
Math 5 19 8 0 1 0 0 28 68% 29% 0% 4% 0% 0%
Math 6 14 12 0 1 1 0 28 50% 43% 0% 4% 4% 0%
Math 7 10 15 1 1 1 0 28 36% 54% 4% 4% 4% 0%
Math 8 17 13 0 0 0 0 30 57% 43% 0% 0% 0% 0%
Math 11 10 7 0 0 1 2 20 50% 35% 0% 0% 5% 10%
Science 4 12 8 0 0 0 0 20 60% 40% 0% 0% 0% 0%
Science 5 11 8 0 0 0 1 20 55% 40% 0% 0% 0% 5%
Science 6 13 7 0 0 0 0 20 65% 35% 0% 0% 0% 0%
Science 7 9 10 0 0 1 0 20 45% 50% 0% 0% 5% 0%
Science 8 11 9 0 0 0 0 20 55% 45% 0% 0% 0% 0%
Science 11 7 13 0 0 0 0 20 35% 65% 0% 0% 0% 0%
Social Studies 4 11 17 1 0 0 0 29 38% 59% 3% 0% 0% 0%
Social Studies 5 13 13 0 0 0 0 26 50% 50% 0% 0% 0% 0%
Social Studies 6 12 15 0 0 1 0 28 43% 54% 0% 0% 4% 0%
Social Studies 7 10 16 0 0 0 0 26 38% 62% 0% 0% 0% 0%
Social Studies 8 11 15 0 0 1 1 28 39% 54% 0% 0% 4% 4%
Social Studies 11 10 17 0 0 0 1 28 36% 61% 0% 0% 0% 3%
Ethnicity: African American/White Counts Percentage
Subject Grade +A –A +B –B +C –C Total +A –A +B –B +C –C
ELA 3 11 14 0 1 0 1 27 41% 52% 0% 4% 0% 4%
ELA 4 12 13 1 0 0 1 27 44% 48% 4% 0% 0% 4%
ELA 5 11 11 0 1 0 0 23 48% 48% 0% 4% 0% 0%
ELA 6 10 13 0 0 1 0 24 42% 54% 0% 0% 4% 0%
ELA 7 9 15 0 0 1 0 25 36% 60% 0% 0% 4% 0%
ELA 8 16 9 0 0 0 0 25 64% 36% 0% 0% 0% 0%
ELA 11 14 14 1 0 0 0 29 48% 48% 3% 0% 0% 0%
Math 3 14 15 0 0 0 0 29 48% 52% 0% 0% 0% 0%
Math 4 13 12 0 1 0 0 26 50% 46% 0% 4% 0% 0%
Math 5 10 17 0 0 1 0 28 36% 61% 0% 0% 4% 0%
Math 6 13 14 0 1 0 0 28 46% 50% 0% 4% 0% 0%
Math 7 13 14 0 0 1 0 28 46% 50% 0% 0% 4% 0%
Spring 2017 Technical Report
South Carolina Alternate Assessment 24 American Institutes for Research
Ethnicity: African American/White Counts Percentage
Subject Grade +A –A +B –B +C –C Total +A –A +B –B +C –C
Math 8 19 9 0 1 1 0 30 63% 30% 0% 3% 3% 0%
Math 11 13 7 0 0 0 0 20 65% 35% 0% 0% 0% 0%
Science 4 12 8 0 0 0 0 20 60% 40% 0% 0% 0% 0%
Science 5 8 12 0 0 0 0 20 40% 60% 0% 0% 0% 0%
Science 6 8 11 0 1 0 0 20 40% 55% 0% 5% 0% 0%
Science 7 12 8 0 0 0 0 20 60% 40% 0% 0% 0% 0%
Science 8 8 12 0 0 0 0 20 40% 60% 0% 0% 0% 0%
Science 11 9 10 0 0 1 0 20 45% 50% 0% 0% 5% 0%
Social Studies 4 12 16 1 0 0 0 29 41% 55% 3% 0% 0% 0%
Social Studies 5 11 14 0 0 1 0 26 42% 54% 0% 0% 4% 0%
Social Studies 6 16 10 1 0 0 1 28 57% 36% 4% 0% 0% 4%
Social Studies 7 13 13 0 0 0 0 26 50% 50% 0% 0% 0% 0%
Social Studies 8 12 14 1 0 1 0 28 43% 50% 4% 0% 4% 0%
Social Studies 11 15 13 0 0 0 0 28 54% 46% 0% 0% 0% 0%
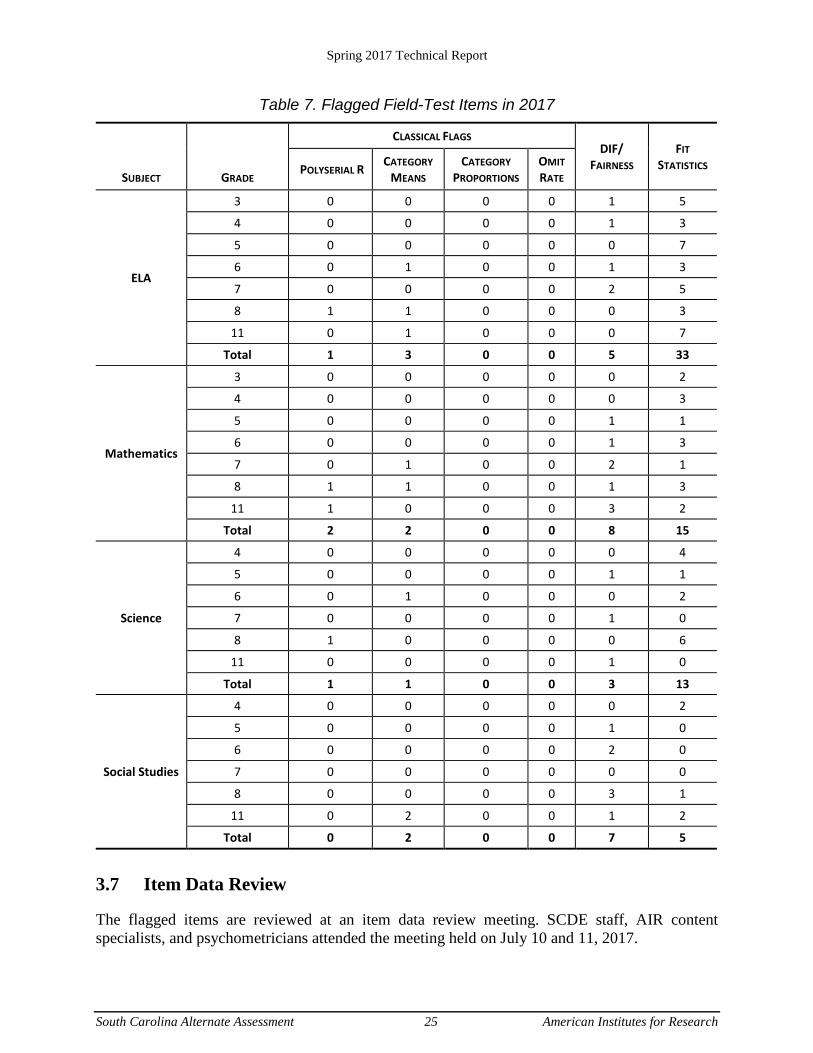
3.6 Items Flagged in 2017
The items are flagged according to the criteria listed in Table 6.
Table 6. Item Flagging Criteria
ITEM STATISTIC FLAGGING CRITERIA*
Flag the item if: Percent in category p > 0.95 for a single score point Percent skipped Omit rate > 10% Polyserial correlation with test Polyserial < 0.20 Mean Score Mean total score for a lower score point > Mean total score for a
higher score point DIF C category (see Table 3) IRT Mean Infit Infit >1.3 or Infit < 0.7 IRT Mean Outfit Outfit >1.3 or Outfit < 0.7
Table 7 lists a summary of the number of items flagged for different reasons in 2017. Some items are flagged for more than one reason.
Spring 2017 Technical Report
South Carolina Alternate Assessment 25 American Institutes for Research
Table 7. Flagged Field-Test Items in 2017
SUBJECT GRADE
CLASSICAL FLAGS DIF/
FAIRNESS FIT
STATISTICS POLYSERIAL R CATEGORY MEANS
CATEGORY PROPORTIONS
OMIT RATE
ELA
3 0 0 0 0 1 5
4 0 0 0 0 1 3
5 0 0 0 0 0 7
6 0 1 0 0 1 3
7 0 0 0 0 2 5
8 1 1 0 0 0 3
11 0 1 0 0 0 7
Total 1 3 0 0 5 33
Mathematics
3 0 0 0 0 0 2
4 0 0 0 0 0 3
5 0 0 0 0 1 1
6 0 0 0 0 1 3
7 0 1 0 0 2 1
8 1 1 0 0 1 3
11 1 0 0 0 3 2
Total 2 2 0 0 8 15
Science
4 0 0 0 0 0 4
5 0 0 0 0 1 1
6 0 1 0 0 0 2
7 0 0 0 0 1 0
8 1 0 0 0 0 6
11 0 0 0 0 1 0
Total 1 1 0 0 3 13
Social Studies
4 0 0 0 0 0 2
5 0 0 0 0 1 0
6 0 0 0 0 2 0
7 0 0 0 0 0 0
8 0 0 0 0 3 1
11 0 2 0 0 1 2
Total 0 2 0 0 7 5
3.7 Item Data Review
The flagged items are reviewed at an item data review meeting. SCDE staff, AIR content specialists, and psychometricians attended the meeting held on July 10 and 11, 2017.
Spring 2017 Technical Report
South Carolina Alternate Assessment 26 American Institutes for Research
Prior to the item data review meeting, AIR psychometricians reviewed all flagged items to ensure that (1) the data were accurate and properly analyzed, (2) the response keys were correct, and (3) there were no other obvious problems with the items.
During the meeting, the committee members reviewed the items that are statistically flagged and the comments provided from content and fairness review. The reviewers took the comments into consideration when they made decisions about the items. To determine whether to retain an item for operational use, the item review team considered the following additional factors:
Item content designations
Appropriate wording
Whether the item was necessary to preserve the rest of the task
Hypotheses about what may have given rise to the statistical flag
Whether the item statistics are on the borderline or significantly away from the predetermined criteria
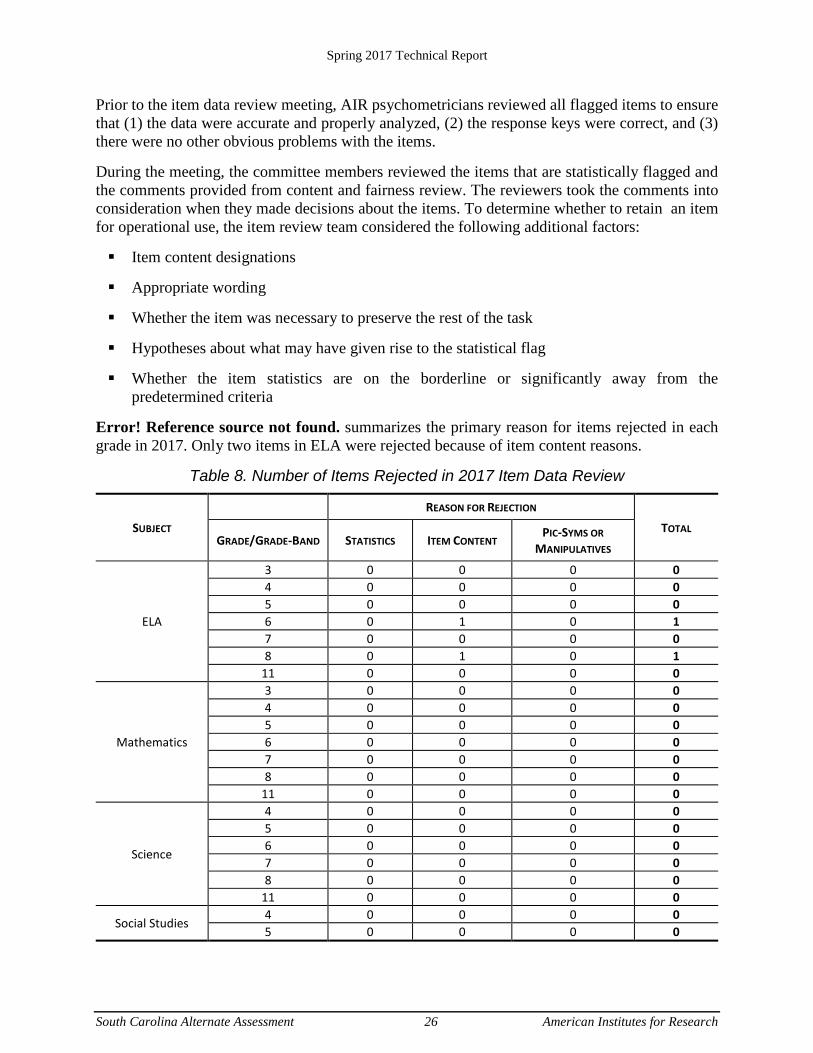
Error! Reference source not found. summarizes the primary reason for items rejected in each grade in 2017. Only two items in ELA were rejected because of item content reasons.
Table 8. Number of Items Rejected in 2017 Item Data Review
SUBJECT REASON FOR REJECTION
TOTAL GRADE/GRADE-BAND STATISTICS ITEM CONTENT PIC-SYMS OR
MANIPULATIVES
ELA
3 0 0 0 0 4 0 0 0 0 5 0 0 0 0 6 0 1 0 1 7 0 0 0 0 8 0 1 0 1
11 0 0 0 0
Mathematics
3 0 0 0 0 4 0 0 0 0 5 0 0 0 0 6 0 0 0 0 7 0 0 0 0 8 0 0 0 0
11 0 0 0 0
Science
4 0 0 0 0 5 0 0 0 0 6 0 0 0 0 7 0 0 0 0 8 0 0 0 0
11 0 0 0 0
Social Studies 4 0 0 0 0 5 0 0 0 0
Spring 2017 Technical Report
South Carolina Alternate Assessment 27 American Institutes for Research
SUBJECT REASON FOR REJECTION
TOTAL GRADE/GRADE-BAND STATISTICS ITEM CONTENT PIC-SYMS OR
MANIPULATIVES
6 0 0 0 0 7 0 0 0 0 8 0 0 0 0
11 0 0 0 0
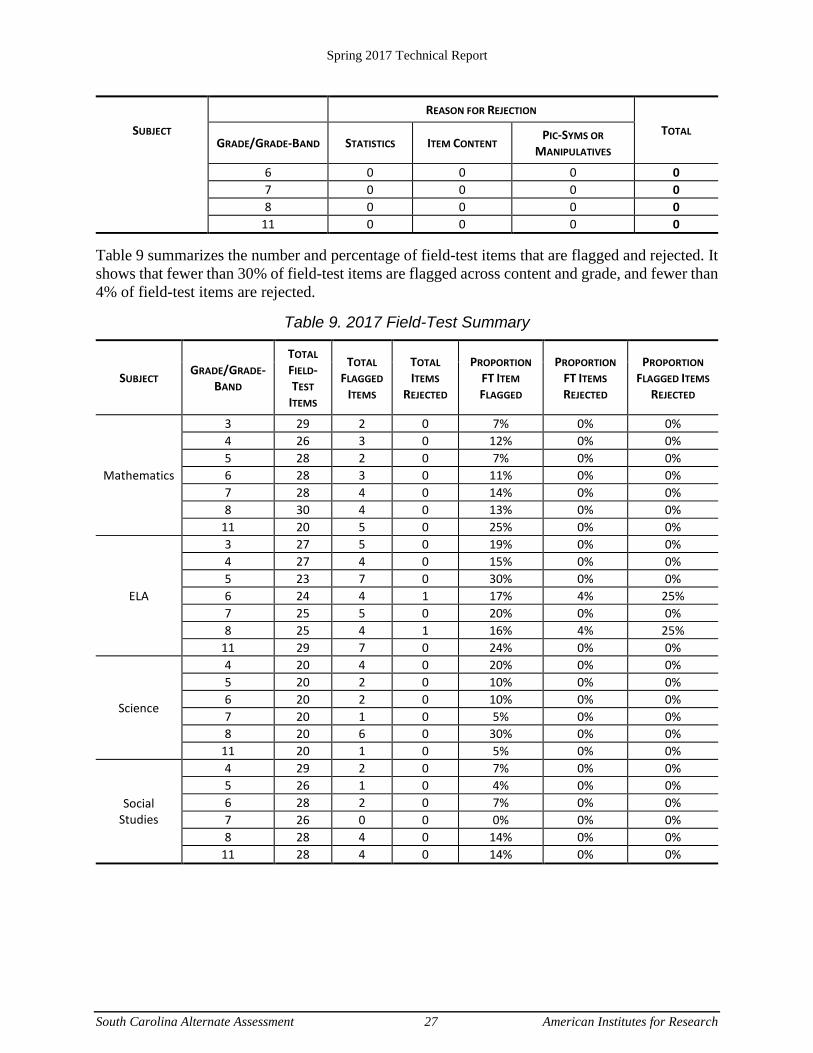
Table 9 summarizes the number and percentage of field-test items that are flagged and rejected. It shows that fewer than 30% of field-test items are flagged across content and grade, and fewer than 4% of field-test items are rejected.
Table 9. 2017 Field-Test Summary
SUBJECT GRADE/GRADE-BAND
TOTAL FIELD-TEST
ITEMS
TOTAL FLAGGED
ITEMS
TOTAL ITEMS
REJECTED
PROPORTION FT ITEM FLAGGED
PROPORTION FT ITEMS REJECTED
PROPORTION FLAGGED ITEMS
REJECTED
Mathematics
3 29 2 0 7% 0% 0% 4 26 3 0 12% 0% 0% 5 28 2 0 7% 0% 0% 6 28 3 0 11% 0% 0% 7 28 4 0 14% 0% 0% 8 30 4 0 13% 0% 0%
11 20 5 0 25% 0% 0%
ELA
3 27 5 0 19% 0% 0% 4 27 4 0 15% 0% 0% 5 23 7 0 30% 0% 0% 6 24 4 1 17% 4% 25% 7 25 5 0 20% 0% 0% 8 25 4 1 16% 4% 25%
11 29 7 0 24% 0% 0%
Science
4 20 4 0 20% 0% 0% 5 20 2 0 10% 0% 0% 6 20 2 0 10% 0% 0% 7 20 1 0 5% 0% 0% 8 20 6 0 30% 0% 0%
11 20 1 0 5% 0% 0%
Social Studies
4 29 2 0 7% 0% 0% 5 26 1 0 4% 0% 0% 6 28 2 0 7% 0% 0% 7 26 0 0 0% 0% 0% 8 28 4 0 14% 0% 0%
11 28 4 0 14% 0% 0%
Spring 2017 Technical Report
South Carolina Alternate Assessment 28 American Institutes for Research
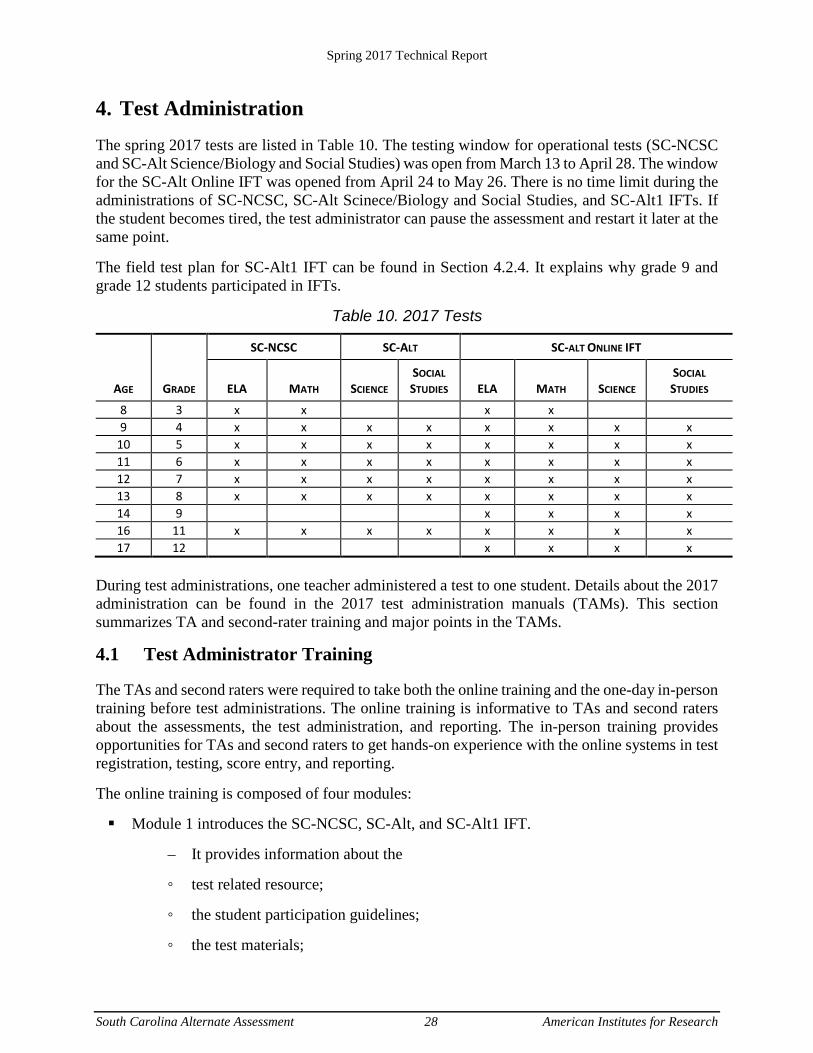
4. Test Administration The spring 2017 tests are listed in Table 10. The testing window for operational tests (SC-NCSC and SC-Alt Science/Biology and Social Studies) was open from March 13 to April 28. The window for the SC-Alt Online IFT was opened from April 24 to May 26. There is no time limit during the administrations of SC-NCSC, SC-Alt Scinece/Biology and Social Studies, and SC-Alt1 IFTs. If the student becomes tired, the test administrator can pause the assessment and restart it later at the same point.
The field test plan for SC-Alt1 IFT can be found in Section 4.2.4. It explains why grade 9 and grade 12 students participated in IFTs.
Table 10. 2017 Tests
AGE GRADE
SC-NCSC SC-ALT SC-ALT ONLINE IFT
ELA MATH SCIENCE SOCIAL STUDIES ELA MATH SCIENCE
SOCIAL STUDIES
8 3 x x x x 9 4 x x x x x x x x
10 5 x x x x x x x x 11 6 x x x x x x x x 12 7 x x x x x x x x 13 8 x x x x x x x x 14 9 x x x x 16 11 x x x x x x x x 17 12 x x x x
During test administrations, one teacher administered a test to one student. Details about the 2017 administration can be found in the 2017 test administration manuals (TAMs). This section summarizes TA and second-rater training and major points in the TAMs.
4.1 Test Administrator Training
The TAs and second raters were required to take both the online training and the one-day in-person training before test administrations. The online training is informative to TAs and second raters about the assessments, the test administration, and reporting. The in-person training provides opportunities for TAs and second raters to get hands-on experience with the online systems in test registration, testing, score entry, and reporting.
The online training is composed of four modules:
Module 1 introduces the SC-NCSC, SC-Alt, and SC-Alt1 IFT.
– It provides information about the
◦ test related resource;
◦ the student participation guidelines;
◦ the test materials;
Spring 2017 Technical Report
South Carolina Alternate Assessment 29 American Institutes for Research
◦ test windows; and
◦ security affidavits.
– Online systems include the
◦ Test Information Distribution Engine (TIDE), Data Entry Interface (DEI), test administration site, and secure browser;
◦ roles and responsibilities; and
◦ second raters and score fidelity.
Module 2 describes details about the SC-NCSC and the SC-Alt. For the SC-Alt, it includes items, scoring rubrics, administration rules, and a Student Placement Questionnaire (SPQ). For the SC-Alt, it includes examples of items and item scoring and tips in test administrations. For both tests, it introduces the DEI and immediate scoring.
Module 3 presents the details about the online IFTs. It introduces
– the test design and format;
– how to start of a test session;
– how to move to the next item;
– how to monitor student progress;
– how to pause or stop a test; and
– how to exit a test.
Module 4 introduces score reporting that includes paper reports and online reports. In the paper report section, it delineates the four performance levels and the paper report mockups. In the online report section, it introduces the Online Reporting System (ORS), the functionality of ORS, and how to use it.
After the TAs or second raters finished the online training, they are required to take the one-day in-person training. During the training sessions, the trainers answer questions of all kinds. In addition, TAs and second raters received more hands-on experience with the online systems.
4.2 Administration Manual
The TAM provides the detailed guidelines for test administrators to administer each assessment. The main points are summarized in the following sections.
4.2.1 Student Participation Guidelines
The decision about a student’s participation in required state assessments is made by the student’s IEP team and documented in the IEP. To document that the alternate assessment is appropriate for an individual student, the IEP team should review all important information about the student over
Spring 2017 Technical Report
South Carolina Alternate Assessment 30 American Institutes for Research
multiple school years and multiple instructional settings and determine that the student meets all of the following criteria:.
The student demonstrates a significant cognitive disability and adaptive skills that result in performance that is substantially below grade-level achievement expectations even with the use of accommodations and modifications.
The student accesses the state-approved curriculum standards at less complex levels and with extensively modified instruction.
The student has current adaptive skills requiring extensive direct instruction and practice in multiple settings to accomplish the application and transfer of skills necessary for application in school, work, home, and community environments.
The student is unable to apply or use academic skills across natural settings when instructed solely or primarily through classroom instruction.
The student’s inability to achieve the state grade-level achievement expectations is not the result of excessive or extended absences or social, cultural, or economic differences.
The South Carolina Alternate Assessments should be administered to students who are determined by their IEP teams to meet all of the participation criteria for alternate assessment and meet the age requirements listed in Table 10.
Students identified as requiring alternate assessment who are receiving instruction outside of the school setting must also be assessed with the South Carolina Alternate Assessments. These situations include students who have been placed in medical homebound or home-based instruction. The district must administer the assessment to a student who is sick and homebound if the student is physically and/or mentally able to take the test during the test administration window. English as a Second Language (ESL) students who meet the criteria for alternate assessment on alternate achievement standards are required to take the South Carolina Alternate Assessments.
4.2.2 Roles and Responsibilities
AIR, in Washington, DC, is the contract agency working with South Carolina Alternate Assessment. AIR is responsible for printing, distributing, and collecting the test materials. AIR is also responsible for scoring and reporting.
District Test Coordinator (DTC) Responsibilities
The DTC is the main contact for AIR. Their responsibilities include:
Identify all students residing in the district who are participating in the SC-Alt and ensure that they registered in the Test Information Distribution Engine (TIDE).
Ensure that TAs and second raters have access to students’ state identification numbers (SSIDs).
Serve as the contact person between the school district and AIR.
Spring 2017 Technical Report
South Carolina Alternate Assessment 31 American Institutes for Research
Order and distribute test materials to schools and ensure that all materials were returned to AIR.
Assist school administrators in communicating information about the SC-Alt.
Be familiar with all information in the TAM and the DTC‐Alt Supplement Manual.
Ensure test administrations of the SC-Alt the SC-NCSC and have scores entered in the DEI.
Ensure that all students completed the Online IFT.
Ensure training for all TAs and second raters.
Ensure that all TAs, monitors, and principals (or designee) understand how to validate the Test Administrator Security Affidavit in TIDE.
Distribute test results to TAs.
Ensure the line of communication between the district of residence and the district of service (or service agency) when students are served by a facility that is outside of the student’s district of residence.
School Test Coordinator (STC) Responsibilities
The STC is responsible for coordinating the administration of the SC-Alt at the school site and for verifying receipt of the school’s test materials. The STC must
serve as the liaison between the school and the DTC;
ensure that the test materials match the test materials listed on the School Packing List;
disseminate test materials to personnel who will be administering the test;
ensure test administrations and score entrance of TAs and second raters;
ensure that all students completed the Online IFT;
ensure that all TAs, monitors, and principals (or designees) understand how to validate the Test
Administrator Security Affidavit in TIDE and validate test scores; and
pack test materials listed in the School Packing List and return them to DTC.
Test Administrator (TA) Responsibilities
TAs major responsibilities include the following:
Play a key role in implementing the student’s IEP
Offer guidance to the IEP team regarding the student’s current abilities, skills, and social integration as related to the decision-making process for selecting the appropriate assessment
Receive training to administer and score the South Carolina Alternate Assessments
Spring 2017 Technical Report
South Carolina Alternate Assessment 32 American Institutes for Research
Be knowledgeable about test administration procedures and test security policies
Administer tests and enter score into DEI
Validate the Test Administrator Security Affidavit
Before test administrations, TAs and second raterse are required to watch the online training modules.
4.2.3 Paper-Based Test Administration
The SCDE made the decision to administer the SC-NCSC on paper instead of on the computer for the 2017 administration. The decision was made to reduce the amount of scrolling required by the Test Administrator or student. However, the SCDE found that paper administration did not reduce the burden on the Test Administrator.
For paper-based tests, administration is on one to one bases. That is, one TA administeres a test to one student. The TAM describes the background and the purpose of each test, the test design, item/task types, test materials and test set up, and general guidelines for each of SC-NCSC and SC-Alt. it requires TAs and second raters needs to
attend online and in-person training;
review the TAM and other resources on the portal that were designed to assist test administration;
reserve testing space with careful consideration;
identify an assessment monitor;
determine student accommodations and starting tasks;
prepare and become familiar with test materials;
practice administrating each test; and
enter item responses into the DEI.
It also requires that test monitors attend training designed for test monitors.
SC-NCSC Administration
Specifically, SC-NCSC is fixed-form. There were about 40 items in each test. Students were required to take all items in a test. An exception is that students can stop early if they demonstrated no mode if conmmunication and therefore have no responses to the first four items. Items in SC-NCSC tests are one-point multiple-choice items. If a student answers the question correctly, he or she earns one point; otherwise, he or she earns zero points.
SC-Alt Administration
The SC-Alt Science/Biology and Social Studies is stage-adaptive. There are 12 tasks in a test. Each task has four to eight items. The tasks are ordered from the easiest to the hardest.
Spring 2017 Technical Report
South Carolina Alternate Assessment 33 American Institutes for Research
Students with different abilities would take different ranges of the test. Students with low abilitities are required to take tasks 1–6, students with medium abilities are required to take tasks 3–9, and students with high abilities are required to take tasks 6–12. Students’ initial abilities were estimated using the SPQ, a survey completed by TAs to identify starting tasks. According to the total raw score of the SPQ, TAs start the test at the appropriate task.
To reduce the effect of the imprecise prediction of student abilities, the tasks a student actually took were governed by the starting point rule and the stopping rule of test administration.
The starting point rule requires, if a student started at task 3 or task 6 but did not do as well (that is, the student earned fewer than three raw score points), that he or she be moved back to the previous starting tasks—task 1 or task 3, respectively. A student starting at task 6 could be moved back twice: from task 6 to task 3 and then from task 3 to task 1.
The stopping rule requires teachers to administer the next task if a student earned six or more raw score points or the maximum number of score points of a task, if the maximum number of points is less than six, at or after the last task in the required range.
The starting and stopping rules make the required ranges flexible to students whose actual abilities were differenct from the predictions so that they could take easier or more difficult tasks.
Each SC-Alt test consists of engagement items and non-engagement items. Engagement items are scored on a rubric from 1 to 4 points based on the extent of student engagement. Non-engagement items are typical multiple-choice items with two or three options. For two-option items, a student is given a score of 1 if he or she answers the item successfully; otherwise, the student receives a score of 0. Students have two opportunities for the three-option items. If a student answers the item successfully on the first attempt, the student receives a score of 2. If the student’s first attempt fails, this option is removed, making the item a two-option item. If the student is successful on the second attempt, a score of 1 is awarded. Otherwise, a score of 0 is given. If a student does not respond to an item administered, the item is coded as “N,” which means “No Response.” A response of “N” is scored as 0. If a student is access limited to take an item, the item is coded as “A,” which means “Access Limited” A response of “A” is not included in scoring.
Score Entry
When TAs or second raters logged into DEI to enter item responses, they are required to
enter and verify student information; answer questions listed in the South Carolina Learning Charateristic Inventory (LCI); enter item responses; submit the record; review student scores; and confirm submission.
4.2.4 Online Test Administration
The IFT was administered online. With a TA’s assistance in navigating the online interface when needed, students provided their responses to each item.
Spring 2017 Technical Report
South Carolina Alternate Assessment 34 American Institutes for Research
The IFT plan was to have each students taking 10 on grade items and 10 items from the immediate lower grade, with the exception that grade 3 students only took 10 grade 3 items; grade 9 students only took 10 grade 8 items, and grade 12 students only took 10 grade 11 items. As shown in Table 11, students who were eligible for the SC-NCSC and/or the SC-Alt were required to take the IFT. Students in grade 9 and grade 12 were also required to take the IFT. The reason to have grade 9 and grade 12 students to take lower grade items was to increase the sample size.
The purpose to have students take off-grade items was to establish a vertical scale in each subject. In this way, the performances of the same group of students to the on-grade and off-grade items can be obtained by will reveal relative item difficutlies of those time, and therefore, help to establish the vertical scale.
As the requirement for paper-based tests and more for online tests, to administer IFT, TAs were required to
attend training, read the TAM, and review materials on the portal; reserve a testing space with careful consideration; identify and train a test monitor; determine student accommodations and test eligibility; and become familiar with the South Carolina online test administration system, which includes
– the online assessment format; – scaffolded response opportunities – help for students to skip items if they did not respond to these items; and – familiarization with the embedded online accommodations.
4.2.5 Accommodations
For SC-NCSC ELA and Mathematics, the following accommodations are available: Building Background Knowledge Using Alternative Text Using Tactile Symbols and Tactile Graphics Replacing Text with Objects Other Strategies for Student Responses Four function calculator Assistive technology
For SC-Alt Science/Biology and Social Studies, the accommodations include:
Substitutions of objects or representations of objects for response cards Available Braille materials and tactile graphics Possible special arrangements, such as special lightning or furniture Sign language Larger prints
Spring 2017 Technical Report
South Carolina Alternate Assessment 35 American Institutes for Research
Students with special disability, such as blind students, do not need to take items identified as “Access Limited”
For SC-Alt1 IFT, the online embedded accomodations include the following:
Color constrast Magnification Mark for review Masking that enables students to cover or block content that is not of immediate need or that
may be distracting
Since the entire SC-Alt1 is designed to be read to the student, Text to Speech (TTS) was required for the administration of the IFTs.
4.2.6 Test Security
South Carolina Alternate Assessments are subject to provisions of the state test security legislation, South Carolina Code of Laws, Section 50-445, and the regulations of the State Board of Education. Interfering with student responses or fabricating data is a violation of the security legislation. The responses submitted in the online DEI must reflect authentic student work and responses. Any breach of test security must be reported to the SCDE in accordance with the Test Security Legislation and State Board of Education regulations.
All school and district personnel who may have access to South Carolina Alternate Assessment materials or to the location in which the materials are securely stored must sign the Agreement to Maintain Test Security and Confidentiality for Test Administrators, Monitors, and Second Raters form before accessing the materials. At the end of the administration, all secure materials, including any adapted materials are required to be returned to AIR.
TAs, monitors, and principals (or designees) are required to sign digital signatures that are used as validations of the Test Administrator Security Affidavit for each subject in which the student is assessed in order to confirm that all security procedures were followed during the assessment. Failure to complete the validation will result in scores not being reported for the student in the subject.
Teachers may not use any portion of the scripted task, item, or related materials for practice with the student prior to conducting the actual assessment. TAs may rehearse administering the assessment tasks and items prior to administering them, either alone or with another TA who is trained to administer the SC-Alt Science/Biology and Social Studies and SC-NCSC ELA and Mathematics. The content of the SC-Alt tasks and SC-NCSC items may not be shared with other teachers or staff except as part of rehearsing the task administration.
When test irrergularities occured, the District Test Coordinator for Alternate Assessment submitted test irregularity requests on behalf of test administrators (TAs) and second raters in their school district to the SCDE through TIDE. The DTC-Alt could submit one of the following test irregularity requests: Invalidate a Test, Reset a Test, Re-Open a Test, and Revert a Test That’s Been Reset.

Spring 2017 Technical Report
South Carolina Alternate Assessment 36 American Institutes for Research
DTCs-Alt requested “Reset a Test” when TAs needed to restart data entry in the Data Entry Interface or students needed to restart a test. If this request was approved, the responses in the test were removed so that the user or student could start over. If a DTC-Alt accidentally requested “Reset a Test,” he or she would send a request to “Revert a Test That’s Been Reset” in order to go back to undo the test reset. In several cases, TAs accidentally submitted a test when the student was not finished testing. In order to allow students to finish testing, the DTC-Alt submitted a request to “Re-Open a Test.” Once the SCDE approved these requests, the TA, second rater, or student would be able to continue testing.
DTCs-Alt also had the opportunity to request a test invalidation through TIDE when a testing security validation occurred that would affect the validity of a student’s test score. Similarly, Per SCDE policy for the spring 2017 administration, the TA, test monitor and principal needed to validate the Test Administrator Security Affidavit for all operational tests in order to demonstrate that test security procedures were followed. As a result, AIR submitted a request to invalidate all student tests where the TA, test monitor, and principal did not confirm that all testing procedures were followed during testing by validating the affidavit. Once the SCDE approved these test invalidation requests in TIDE, the tests were invalidated and the student did not receive a score.
5. Standard Setting NCSC conducted a standard setting workshop in 2015. Details about the NCSC standard setting workshop can be found in Chapter 7 of the 2015 technical report (National Center and State Collaborative, 2015).
The standard setting workshops were conducted for SC-Alt in 2007 for ELA, mathematics, and science and 2010 for biology and social studies. Detailed reports of the SC-Alt standard settings can be found in the SC-Alt Spring 2007 Standard Setting Technical Report (American Institutes for Research, 2007) and South Carolina Alternate Assessment 2010 Standard Setting: Setting Standards in High School Biology Technical Report (American Institutes for Research and South Carolina Department of Education, 2010b).
5.1 SC-NCSC Performance Standards
There are four performance levels, Level 1 to Level 4, in NCSC tests. Table 11 lists the cut scores for performance level 2 to performance level 4.
Table 11. NCSC Performance Standards for ELA and Mathematics
PERFORMANCE LEVEL GRADE 3 GRADE 4 GRADE 5 GRADE 6 GRADE 7 GRADE 8 GRADE 11
English Language Arts Level 4 1251 1258 1256 1253 1255 1250 1255 Level 3 1240 1240 1240 1240 1240 1240 1240 Level 2 1234 1234 1232 1231 1236 1230 1236
Mathematics Level 4 1254 1251 1255 1249 1254 1249 1249

Spring 2017 Technical Report
South Carolina Alternate Assessment 37 American Institutes for Research
Level 3 1240 1240 1240 1240 1240 1240 1240 Level 2 1236 1233 1231 1234 1232 1234 1234
5.2 SC-Alt Performance Standards
AIR, under the contract with the SCDE, held two standard setting workshops to set performance standards for SC-Alt. Four performance levels are established: Level 1 to Level 4.
The first standard setting workshop was held in June 2007. Performance standards were set for ELA, mathematics, science, and social studies in grade bands 3–5, 6–8, and 10. The 105 panelists participated in the workshop. Since the high school was changed to biology in September 2010, a second standard setting workshop was held to set the four level performance standards for biology.
In both workshops, the ID Matching procedure was used. Detailed reports of the SC-Alt standard settings can be found in the SC-Alt Spring 2007 Standard Setting Technical Report (American Institutes for Research, 2007) and South Carolina Alternate Assessment 2010 Standard Setting: Setting Standards in High School Biology Technical Report (American Institutes for Research and South Carolina Department of Education, 2010b). Readers interested in the SC-Alt standard setting procedures are referred to these sources. Table 12 lists the cut scores for science, high school biology, and social studies.
Table 12. Performance Standards for Science and Social Studies
PERFORMANCE LEVEL SCIENCE/BIOLOGY SOCIAL STUDIES
Grades 4–5
Level 2 430 423
Level 3 469 492
Level 4 496 549
Grades 6–8
Level 2 447 439
Level 3 489 503
Level 4 514 560
High School
Level 2 408 (bio) Level 3 484 (bio) Level 4 519 (bio)
In 2015, the decision was made that grade 11 students take the high school tests instead of grade 10 students. No changes related to the cut standards were made because of the change. The same performance standards had been applied until the state adopted SC-NCSC in ELA and mathematics. The same standards have been used for science and social studies.
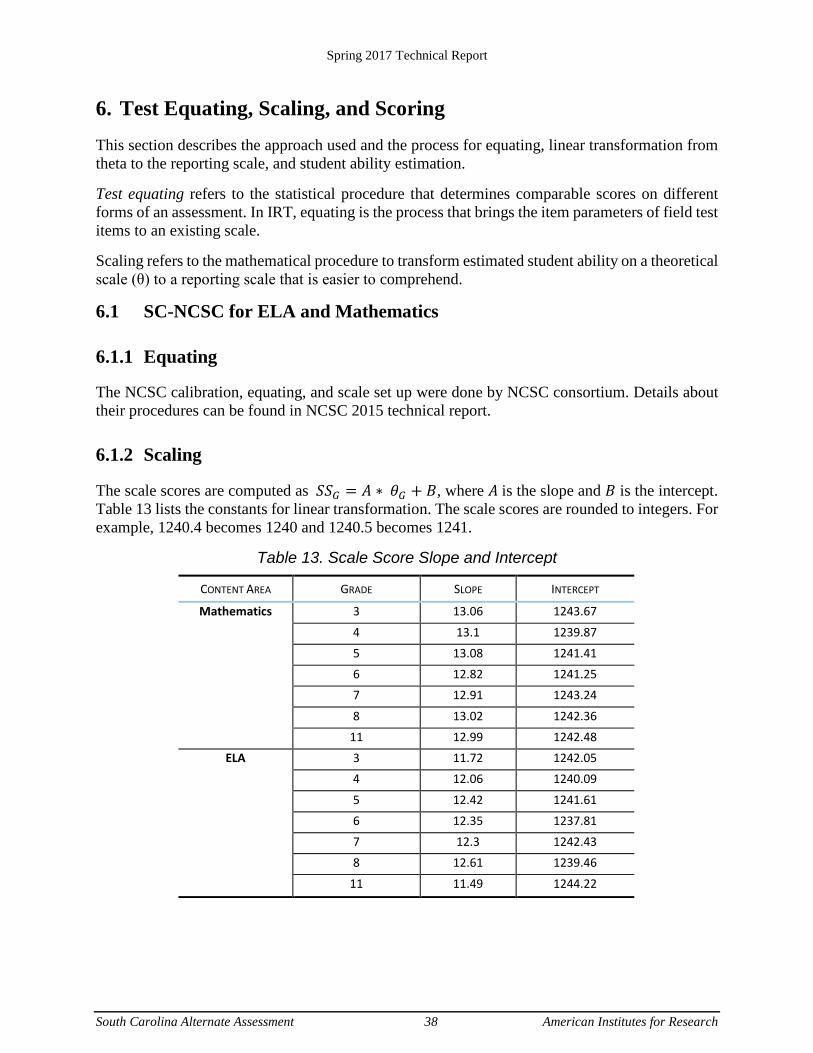
Spring 2017 Technical Report
South Carolina Alternate Assessment 38 American Institutes for Research
6. Test Equating, Scaling, and Scoring This section describes the approach used and the process for equating, linear transformation from theta to the reporting scale, and student ability estimation.
Test equating refers to the statistical procedure that determines comparable scores on different forms of an assessment. In IRT, equating is the process that brings the item parameters of field test items to an existing scale.
Scaling refers to the mathematical procedure to transform estimated student ability on a theoretical scale (θ) to a reporting scale that is easier to comprehend.
6.1 SC-NCSC for ELA and Mathematics
6.1.1 Equating
The NCSC calibration, equating, and scale set up were done by NCSC consortium. Details about their procedures can be found in NCSC 2015 technical report.
6.1.2 Scaling
The scale scores are computed as 𝑆𝑆𝑆𝑆𝐺𝐺 = 𝐴𝐴 ∗ 𝜃𝜃𝐺𝐺 + 𝐵𝐵, where 𝐴𝐴 is the slope and 𝐵𝐵 is the intercept. Table 13 lists the constants for linear transformation. The scale scores are rounded to integers. For example, 1240.4 becomes 1240 and 1240.5 becomes 1241.
Table 13. Scale Score Slope and Intercept
CONTENT AREA GRADE SLOPE INTERCEPT
Mathematics 3 13.06 1243.67
4 13.1 1239.87 5 13.08 1241.41 6 12.82 1241.25 7 12.91 1243.24
8 13.02 1242.36 11 12.99 1242.48
ELA 3 11.72 1242.05 4 12.06 1240.09
5 12.42 1241.61 6 12.35 1237.81 7 12.3 1242.43 8 12.61 1239.46
11 11.49 1244.22
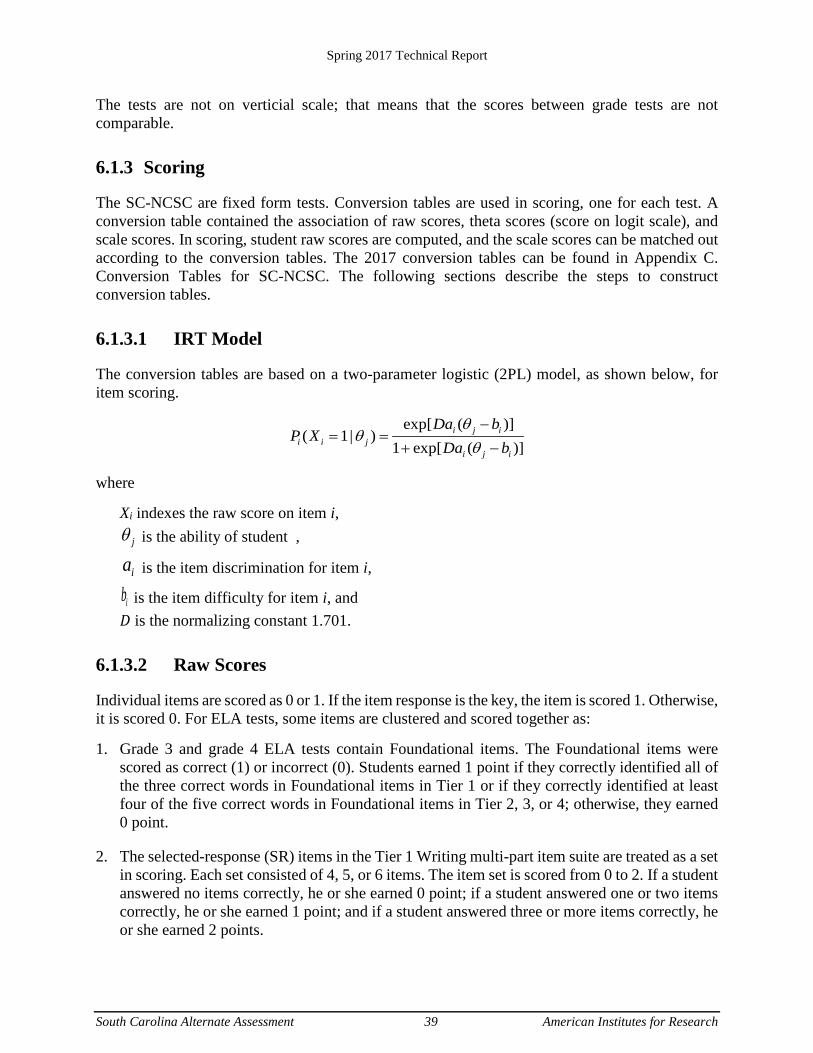
Spring 2017 Technical Report
South Carolina Alternate Assessment 39 American Institutes for Research
The tests are not on verticial scale; that means that the scores between grade tests are not comparable.
6.1.3 Scoring
The SC-NCSC are fixed form tests. Conversion tables are used in scoring, one for each test. A conversion table contained the association of raw scores, theta scores (score on logit scale), and scale scores. In scoring, student raw scores are computed, and the scale scores can be matched out according to the conversion tables. The 2017 conversion tables can be found in Appendix C. Conversion Tables for SC-NCSC. The following sections describe the steps to construct conversion tables.
6.1.3.1 IRT Model
The conversion tables are based on a two-parameter logistic (2PL) model, as shown below, for item scoring.
exp[ ( )]
( 1| )1 exp[ ( )]
i j ii i j
i j i
Da bP X
Da bθ
θθ−
= =+ −
where
Xi indexes the raw score on item i,
jθ is the ability of student ,
ia is the item discrimination for item i,
ib is the item difficulty for item i, and 𝐷𝐷 is the normalizing constant 1.701.
6.1.3.2 Raw Scores
Individual items are scored as 0 or 1. If the item response is the key, the item is scored 1. Otherwise, it is scored 0. For ELA tests, some items are clustered and scored together as:
1. Grade 3 and grade 4 ELA tests contain Foundational items. The Foundational items were scored as correct (1) or incorrect (0). Students earned 1 point if they correctly identified all of the three correct words in Foundational items in Tier 1 or if they correctly identified at least four of the five correct words in Foundational items in Tier 2, 3, or 4; otherwise, they earned 0 point.
2. The selected-response (SR) items in the Tier 1 Writing multi-part item suite are treated as a set in scoring. Each set consisted of 4, 5, or 6 items. The item set is scored from 0 to 2. If a student answered no items correctly, he or she earned 0 point; if a student answered one or two items correctly, he or she earned 1 point; and if a student answered three or more items correctly, he or she earned 2 points.
Spring 2017 Technical Report
South Carolina Alternate Assessment 40 American Institutes for Research
Raw scores are computed by summing up the item scores after taking item cluster scoring into account.
6.1.3.3 Test Characteristic Curve (TCC)
TCC is based on the 2PL model. The x-axis is on the theta scale. The y-axis can be seen on the raw score scale.
TCC is computed by summing the expected score on each of the items that are independently scored and the item sets that are scored by cluster. The expected raw score at a given jθ is
1
( | ) ( | )n
j i ji
E X E Xθ θ=
=∑
where
( | )jE X θ is the expected raw score for student j with ability jθ , θ ϵ [-4, 4],
Xi indexes the observed raw score on item i or item set i.
For dichotomous items, ( | )i jE X θ = ( 1| )i i jP X θ=
For the Foundational item sets in Tier 1, the expected score in a three item set is ( | )jE X θ = 1 1 2 2 3 3( 1| ) ( 1| ) ( 1| )j j jP X P X P Xθ θ θ= = =
For Foundational item sets in Tier 2, 3, or 4, the expected score in a five item set is E(X|θ) = P(X=1|θ) = P1(θ) P2(θ) P3(θ) P4(θ) P5(θ) + Q1(θ) P2(θ) P3(θ) P4(θ) P5(θ) +
P1(θ) Q2(θ) P3(θ) P4(θ) P5(θ) + P1(θ) P2(θ) Q3(θ) P4(θ) P5(θ) + P1(θ) P2(θ) P3(θ) Q4(θ) P5(θ) + P1(θ) P2(θ) P3(θ) P4(θ) Q5(θ)
where Pi(θ) is a short term for ( 1| )i i jP X θ= , i = 1, 2, 3, 4, 5.
Tier 1 Writing SR item sets contain four to six independently scored items. A score of “0” is assigned if a student got no items correct; a score of “1” is assigned if a student got 1 or 2 items correct; and a score of “2” is assigned if a student got 3 or more items correct in a set. The expected score is
E(X|θ) = 1 x P(X=1|θ) + 2 x P(X=2|θ)
For a four item set,
P(X=1|θ) = P1(θ) Q2(θ) Q3(θ) Q4(θ) + Q1(θ) P2(θ) Q3(θ) Q4(θ) + Q1(θ) Q2(θ) P3(θ) Q4(θ) + Q1(θ) Q2(θ) Q3(θ) P4(θ) + P1(θ) P2(θ) Q3(θ) Q4(θ) + P1(θ) Q2(θ) P3(θ) Q4(θ) + P1(θ) Q2(θ) Q3(θ) P4(θ) + Q1(θ) P2(θ) P3(θ) Q4(θ) + Q1(θ) P2(θ) Q3(θ) P4(θ) + Q1(θ) Q2(θ) P3(θ) P4(θ)
Spring 2017 Technical Report
South Carolina Alternate Assessment 41 American Institutes for Research
P(X=2|θ) = P1(θ) P2(θ) P3(θ) Q4(θ) + P1(θ) P2(θ) Q3(θ) P4(θ) + P1(θ) Q2(θ) P3(θ) P4(θ) + Q1(θ) P2(θ) P3(θ) P4(θ) + P1(θ) P2(θ) P3(θ) P4(θ)
6.1.3.4 Raw to Theta Conversion
For each raw score on the y-axis on the TCC plot, find the theta point that corresponds to the raw score to create the raw to theta conversion. The final conversion tables used in scoring are presented in Appendix C.
6.1.3.5 Theta Score to Scale Score conversion
The scale scores are computed as 𝑆𝑆𝑆𝑆𝐺𝐺 = 𝐴𝐴 ∗ 𝜃𝜃𝐺𝐺 + 𝐵𝐵, where 𝐴𝐴 is the slope and 𝐵𝐵 is the intercept, which can be found in Table 13.
6.1.3.6 Extreme Case Handling during Theta Estimation
The consortium set the scale score range from 1200 (LOSS) to 1290 (HOSS). The computed scale scores lower than 1200 are set to 1200; the scale scores higher than 1290 are set to 1290.
6.1.3.7 Standard Errors of Measurement
For each theta score, the conditional standard of measurement (CSEM) is estimated as the inverse of the square root of the sum of item or item set information function:
𝑠𝑠𝑒𝑒(𝜃𝜃𝑠𝑠) = 1
�𝛴𝛴𝛴𝛴(𝜃𝜃𝑠𝑠)
The CSEM of a scale score is the multiplication of 𝑠𝑠𝑒𝑒(𝜃𝜃𝑠𝑠) and the slope for the test.
6.2 SC-Alt Science/Biology and Social Studies
Masters’s partial credit model is used in calibration and scoring:
exp[ ( )]
( 1| )1 exp[ ( )]
j ii i j
j i
D bP X
D bθ
θθ−
= =+ −
where Xi indexes the raw score on item i,
jθ is the ability of student 𝑗𝑗 ,
ib is the item difficulty for item i, and 𝐷𝐷 is the normalizing constant 1.701.
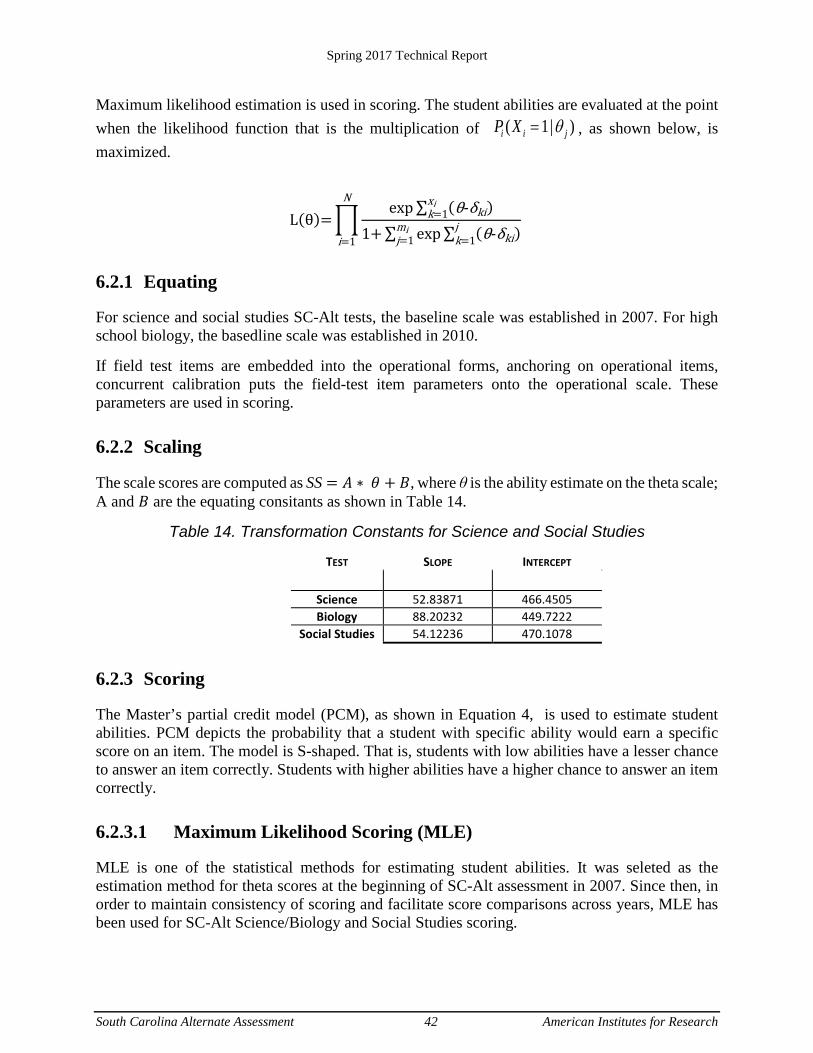
Spring 2017 Technical Report
South Carolina Alternate Assessment 42 American Institutes for Research
Maximum likelihood estimation is used in scoring. The student abilities are evaluated at the point when the likelihood function that is the multiplication of ( 1| )i i jP X θ= , as shown below, is maximized.
L(θ)=�exp∑ (θ-δki)
xik=1
1+∑ exp∑ (θ-δki)jk=1
mij=1
N
i=1
6.2.1 Equating
For science and social studies SC-Alt tests, the baseline scale was established in 2007. For high school biology, the basedline scale was established in 2010.
If field test items are embedded into the operational forms, anchoring on operational items, concurrent calibration puts the field-test item parameters onto the operational scale. These parameters are used in scoring.
6.2.2 Scaling
The scale scores are computed as SS = 𝐴𝐴 ∗ 𝜃𝜃 + 𝐵𝐵, where θ is the ability estimate on the theta scale; A and 𝐵𝐵 are the equating consitants as shown in Table 14.
Table 14. Transformation Constants for Science and Social Studies
TEST SLOPE INTERCEPT
Science 52.83871 466.4505 Biology 88.20232 449.7222
Social Studies 54.12236 470.1078
6.2.3 Scoring
The Master’s partial credit model (PCM), as shown in Equation 4, is used to estimate student abilities. PCM depicts the probability that a student with specific ability would earn a specific score on an item. The model is S-shaped. That is, students with low abilities have a lesser chance to answer an item correctly. Students with higher abilities have a higher chance to answer an item correctly.
6.2.3.1 Maximum Likelihood Scoring (MLE)
MLE is one of the statistical methods for estimating student abilities. It was seleted as the estimation method for theta scores at the beginning of SC-Alt assessment in 2007. Since then, in order to maintain consistency of scoring and facilitate score comparisons across years, MLE has been used for SC-Alt Science/Biology and Social Studies scoring.
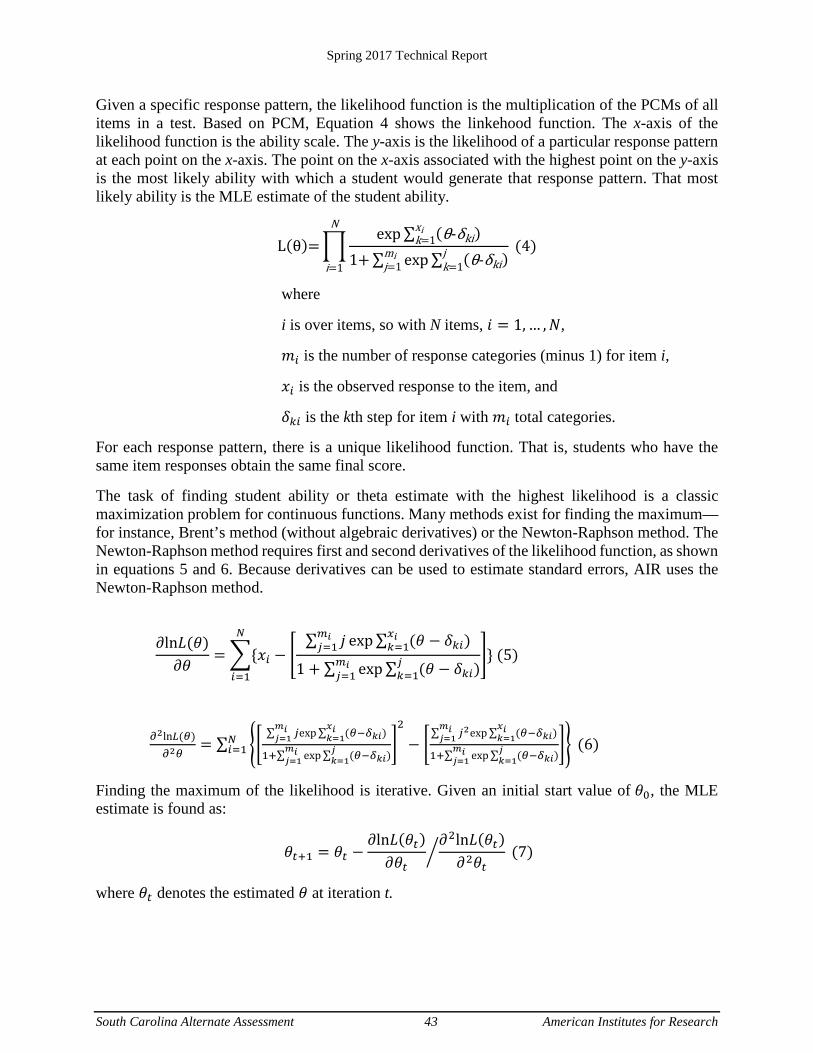
Spring 2017 Technical Report
South Carolina Alternate Assessment 43 American Institutes for Research
Given a specific response pattern, the likelihood function is the multiplication of the PCMs of all items in a test. Based on PCM, Equation 4 shows the linkehood function. The x-axis of the likelihood function is the ability scale. The y-axis is the likelihood of a particular response pattern at each point on the x-axis. The point on the x-axis associated with the highest point on the y-axis is the most likely ability with which a student would generate that response pattern. That most likely ability is the MLE estimate of the student ability.
L(θ)=�exp∑ (θ-δki)
xik=1
1+∑ exp∑ (θ-δki)jk=1
mij=1
(4)N
i=1
where
i is over items, so with N items, 𝑖𝑖 = 1, … ,𝑁𝑁,
𝑚𝑚𝑖𝑖 is the number of response categories (minus 1) for item i,
𝑥𝑥𝑖𝑖 is the observed response to the item, and
𝛿𝛿𝑘𝑘𝑖𝑖 is the kth step for item i with 𝑚𝑚𝑖𝑖 total categories.
For each response pattern, there is a unique likelihood function. That is, students who have the same item responses obtain the same final score.
The task of finding student ability or theta estimate with the highest likelihood is a classic maximization problem for continuous functions. Many methods exist for finding the maximum—for instance, Brent’s method (without algebraic derivatives) or the Newton-Raphson method. The Newton-Raphson method requires first and second derivatives of the likelihood function, as shown in equations 5 and 6. Because derivatives can be used to estimate standard errors, AIR uses the Newton-Raphson method.
𝜕𝜕ln𝐿𝐿(𝜃𝜃)𝜕𝜕𝜃𝜃
= �{𝑥𝑥𝑖𝑖 − �∑ 𝑗𝑗𝑚𝑚𝑖𝑖𝑗𝑗=1 exp∑ (𝜃𝜃 − 𝛿𝛿𝑘𝑘𝑖𝑖)
𝑥𝑥𝑖𝑖𝑘𝑘=1
1 + ∑ exp∑ (𝜃𝜃 − 𝛿𝛿𝑘𝑘𝑖𝑖)𝑗𝑗𝑘𝑘=1
𝑚𝑚𝑖𝑖𝑗𝑗=1
�𝑁𝑁
𝑖𝑖=1
} (5)
𝜕𝜕2ln𝐿𝐿(𝜃𝜃)𝜕𝜕2𝜃𝜃
= ∑ ��∑ 𝑗𝑗𝑚𝑚𝑖𝑖𝑗𝑗=1 exp∑ (𝜃𝜃−𝛿𝛿𝑘𝑘𝑖𝑖)
𝑥𝑥𝑖𝑖𝑘𝑘=1
1+∑ exp∑ (𝜃𝜃−𝛿𝛿𝑘𝑘𝑖𝑖)𝑗𝑗𝑘𝑘=1
𝑚𝑚𝑖𝑖𝑗𝑗=1
�2
− �∑ 𝑗𝑗2𝑚𝑚𝑖𝑖𝑗𝑗=1 exp∑ (𝜃𝜃−𝛿𝛿𝑘𝑘𝑖𝑖)
𝑥𝑥𝑖𝑖𝑘𝑘=1
1+∑ exp∑ (𝜃𝜃−𝛿𝛿𝑘𝑘𝑖𝑖)𝑗𝑗𝑘𝑘=1
𝑚𝑚𝑖𝑖𝑗𝑗=1
�� (6)𝑁𝑁𝑖𝑖=1
Finding the maximum of the likelihood is iterative. Given an initial start value of 𝜃𝜃0, the MLE estimate is found as:
𝜃𝜃𝑡𝑡+1 = 𝜃𝜃𝑡𝑡 −𝜕𝜕ln𝐿𝐿(𝜃𝜃𝑡𝑡)𝜕𝜕𝜃𝜃𝑡𝑡
𝜕𝜕2ln𝐿𝐿(𝜃𝜃𝑡𝑡)𝜕𝜕2𝜃𝜃𝑡𝑡
� (7)
where 𝜃𝜃𝑡𝑡 denotes the estimated 𝜃𝜃 at iteration t.
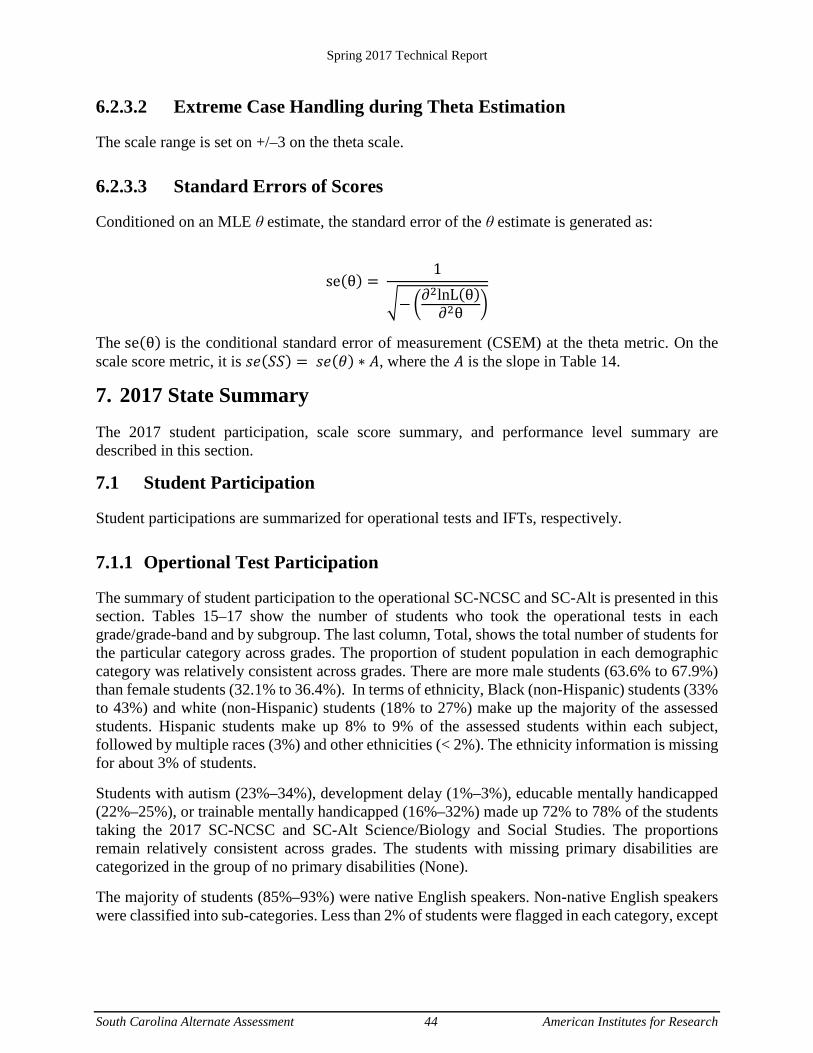
Spring 2017 Technical Report
South Carolina Alternate Assessment 44 American Institutes for Research
6.2.3.2 Extreme Case Handling during Theta Estimation
The scale range is set on +/–3 on the theta scale.
6.2.3.3 Standard Errors of Scores
Conditioned on an MLE θ estimate, the standard error of the θ estimate is generated as:
se(θ) = 1
�−�∂2lnL(θ)∂2θ �
The se(θ) is the conditional standard error of measurement (CSEM) at the theta metric. On the scale score metric, it is 𝑠𝑠𝑒𝑒(𝑆𝑆𝑆𝑆) = 𝑠𝑠𝑒𝑒(𝜃𝜃) ∗ 𝐴𝐴, where the 𝐴𝐴 is the slope in Table 14.
7. 2017 State Summary The 2017 student participation, scale score summary, and performance level summary are described in this section.
7.1 Student Participation
Student participations are summarized for operational tests and IFTs, respectively.
7.1.1 Opertional Test Participation
The summary of student participation to the operational SC-NCSC and SC-Alt is presented in this section. Tables 15–17 show the number of students who took the operational tests in each grade/grade-band and by subgroup. The last column, Total, shows the total number of students for the particular category across grades. The proportion of student population in each demographic category was relatively consistent across grades. There are more male students (63.6% to 67.9%) than female students (32.1% to 36.4%). In terms of ethnicity, Black (non-Hispanic) students (33% to 43%) and white (non-Hispanic) students (18% to 27%) make up the majority of the assessed students. Hispanic students make up 8% to 9% of the assessed students within each subject, followed by multiple races (3%) and other ethnicities (< 2%). The ethnicity information is missing for about 3% of students.
Students with autism (23%–34%), development delay (1%–3%), educable mentally handicapped (22%–25%), or trainable mentally handicapped (16%–32%) made up 72% to 78% of the students taking the 2017 SC-NCSC and SC-Alt Science/Biology and Social Studies. The proportions remain relatively consistent across grades. The students with missing primary disabilities are categorized in the group of no primary disabilities (None).
The majority of students (85%–93%) were native English speakers. Non-native English speakers were classified into sub-categories. Less than 2% of students were flagged in each category, except
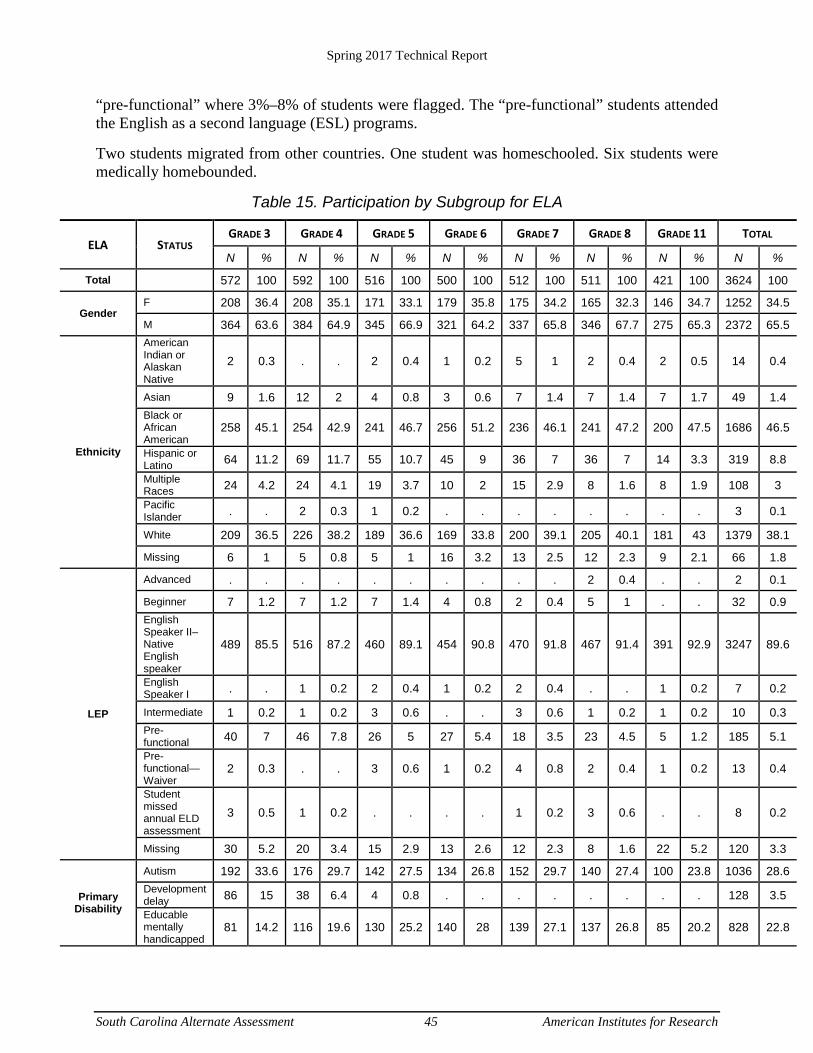
Spring 2017 Technical Report
South Carolina Alternate Assessment 45 American Institutes for Research
“pre-functional” where 3%–8% of students were flagged. The “pre-functional” students attended the English as a second language (ESL) programs.
Two students migrated from other countries. One student was homeschooled. Six students were medically homebounded.
Table 15. Participation by Subgroup for ELA
ELA STATUS GRADE 3 GRADE 4 GRADE 5 GRADE 6 GRADE 7 GRADE 8 GRADE 11 TOTAL
N % N % N % N % N % N % N % N %
Total 572 100 592 100 516 100 500 100 512 100 511 100 421 100 3624 100
Gender F 208 36.4 208 35.1 171 33.1 179 35.8 175 34.2 165 32.3 146 34.7 1252 34.5
M 364 63.6 384 64.9 345 66.9 321 64.2 337 65.8 346 67.7 275 65.3 2372 65.5
Ethnicity
American Indian or Alaskan Native
2 0.3 . . 2 0.4 1 0.2 5 1 2 0.4 2 0.5 14 0.4
Asian 9 1.6 12 2 4 0.8 3 0.6 7 1.4 7 1.4 7 1.7 49 1.4 Black or African American
258 45.1 254 42.9 241 46.7 256 51.2 236 46.1 241 47.2 200 47.5 1686 46.5
Hispanic or Latino 64 11.2 69 11.7 55 10.7 45 9 36 7 36 7 14 3.3 319 8.8
Multiple Races 24 4.2 24 4.1 19 3.7 10 2 15 2.9 8 1.6 8 1.9 108 3
Pacific Islander . . 2 0.3 1 0.2 . . . . . . . . 3 0.1
White 209 36.5 226 38.2 189 36.6 169 33.8 200 39.1 205 40.1 181 43 1379 38.1
Missing 6 1 5 0.8 5 1 16 3.2 13 2.5 12 2.3 9 2.1 66 1.8
LEP
Advanced . . . . . . . . . . 2 0.4 . . 2 0.1
Beginner 7 1.2 7 1.2 7 1.4 4 0.8 2 0.4 5 1 . . 32 0.9 English Speaker II–Native English speaker
489 85.5 516 87.2 460 89.1 454 90.8 470 91.8 467 91.4 391 92.9 3247 89.6
English Speaker I . . 1 0.2 2 0.4 1 0.2 2 0.4 . . 1 0.2 7 0.2
Intermediate 1 0.2 1 0.2 3 0.6 . . 3 0.6 1 0.2 1 0.2 10 0.3 Pre-functional 40 7 46 7.8 26 5 27 5.4 18 3.5 23 4.5 5 1.2 185 5.1
Pre-functional—Waiver
2 0.3 . . 3 0.6 1 0.2 4 0.8 2 0.4 1 0.2 13 0.4
Student missed annual ELD assessment
3 0.5 1 0.2 . . . . 1 0.2 3 0.6 . . 8 0.2
Missing 30 5.2 20 3.4 15 2.9 13 2.6 12 2.3 8 1.6 22 5.2 120 3.3
Primary Disability
Autism 192 33.6 176 29.7 142 27.5 134 26.8 152 29.7 140 27.4 100 23.8 1036 28.6 Development delay 86 15 38 6.4 4 0.8 . . . . . . . . 128 3.5
Educable mentally handicapped
81 14.2 116 19.6 130 25.2 140 28 139 27.1 137 26.8 85 20.2 828 22.8
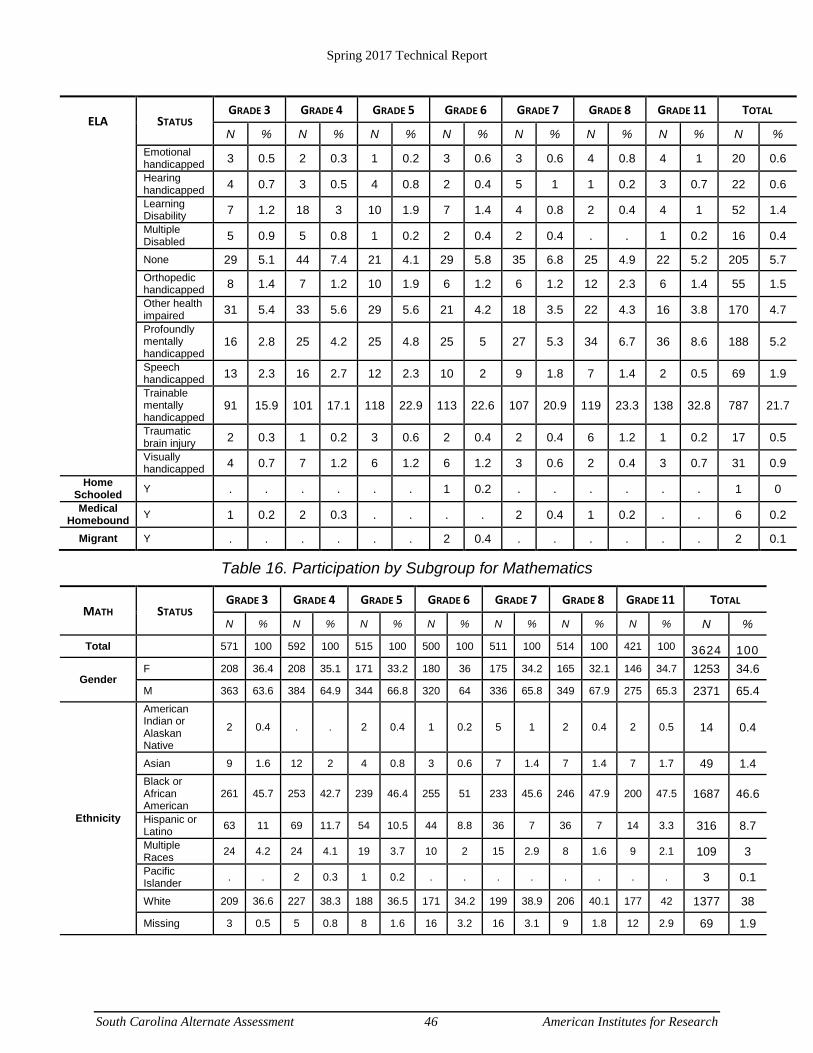
Spring 2017 Technical Report
South Carolina Alternate Assessment 46 American Institutes for Research
ELA STATUS GRADE 3 GRADE 4 GRADE 5 GRADE 6 GRADE 7 GRADE 8 GRADE 11 TOTAL
N % N % N % N % N % N % N % N % Emotional handicapped 3 0.5 2 0.3 1 0.2 3 0.6 3 0.6 4 0.8 4 1 20 0.6
Hearing handicapped 4 0.7 3 0.5 4 0.8 2 0.4 5 1 1 0.2 3 0.7 22 0.6
Learning Disability 7 1.2 18 3 10 1.9 7 1.4 4 0.8 2 0.4 4 1 52 1.4
Multiple Disabled 5 0.9 5 0.8 1 0.2 2 0.4 2 0.4 . . 1 0.2 16 0.4
None 29 5.1 44 7.4 21 4.1 29 5.8 35 6.8 25 4.9 22 5.2 205 5.7 Orthopedic handicapped 8 1.4 7 1.2 10 1.9 6 1.2 6 1.2 12 2.3 6 1.4 55 1.5
Other health impaired 31 5.4 33 5.6 29 5.6 21 4.2 18 3.5 22 4.3 16 3.8 170 4.7
Profoundly mentally handicapped
16 2.8 25 4.2 25 4.8 25 5 27 5.3 34 6.7 36 8.6 188 5.2
Speech handicapped 13 2.3 16 2.7 12 2.3 10 2 9 1.8 7 1.4 2 0.5 69 1.9
Trainable mentally handicapped
91 15.9 101 17.1 118 22.9 113 22.6 107 20.9 119 23.3 138 32.8 787 21.7
Traumatic brain injury 2 0.3 1 0.2 3 0.6 2 0.4 2 0.4 6 1.2 1 0.2 17 0.5
Visually handicapped 4 0.7 7 1.2 6 1.2 6 1.2 3 0.6 2 0.4 3 0.7 31 0.9
Home Schooled Y . . . . . . 1 0.2 . . . . . . 1 0
Medical Homebound Y 1 0.2 2 0.3 . . . . 2 0.4 1 0.2 . . 6 0.2
Migrant Y . . . . . . 2 0.4 . . . . . . 2 0.1
Table 16. Participation by Subgroup for Mathematics
MATH STATUS GRADE 3 GRADE 4 GRADE 5 GRADE 6 GRADE 7 GRADE 8 GRADE 11 TOTAL
N % N % N % N % N % N % N % N %
Total 571 100 592 100 515 100 500 100 511 100 514 100 421 100 3624 100
Gender F 208 36.4 208 35.1 171 33.2 180 36 175 34.2 165 32.1 146 34.7 1253 34.6
M 363 63.6 384 64.9 344 66.8 320 64 336 65.8 349 67.9 275 65.3 2371 65.4
Ethnicity
American Indian or Alaskan Native
2 0.4 . . 2 0.4 1 0.2 5 1 2 0.4 2 0.5 14 0.4
Asian 9 1.6 12 2 4 0.8 3 0.6 7 1.4 7 1.4 7 1.7 49 1.4 Black or African American
261 45.7 253 42.7 239 46.4 255 51 233 45.6 246 47.9 200 47.5 1687 46.6
Hispanic or Latino 63 11 69 11.7 54 10.5 44 8.8 36 7 36 7 14 3.3 316 8.7
Multiple Races 24 4.2 24 4.1 19 3.7 10 2 15 2.9 8 1.6 9 2.1 109 3
Pacific Islander . . 2 0.3 1 0.2 . . . . . . . . 3 0.1
White 209 36.6 227 38.3 188 36.5 171 34.2 199 38.9 206 40.1 177 42 1377 38
Missing 3 0.5 5 0.8 8 1.6 16 3.2 16 3.1 9 1.8 12 2.9 69 1.9
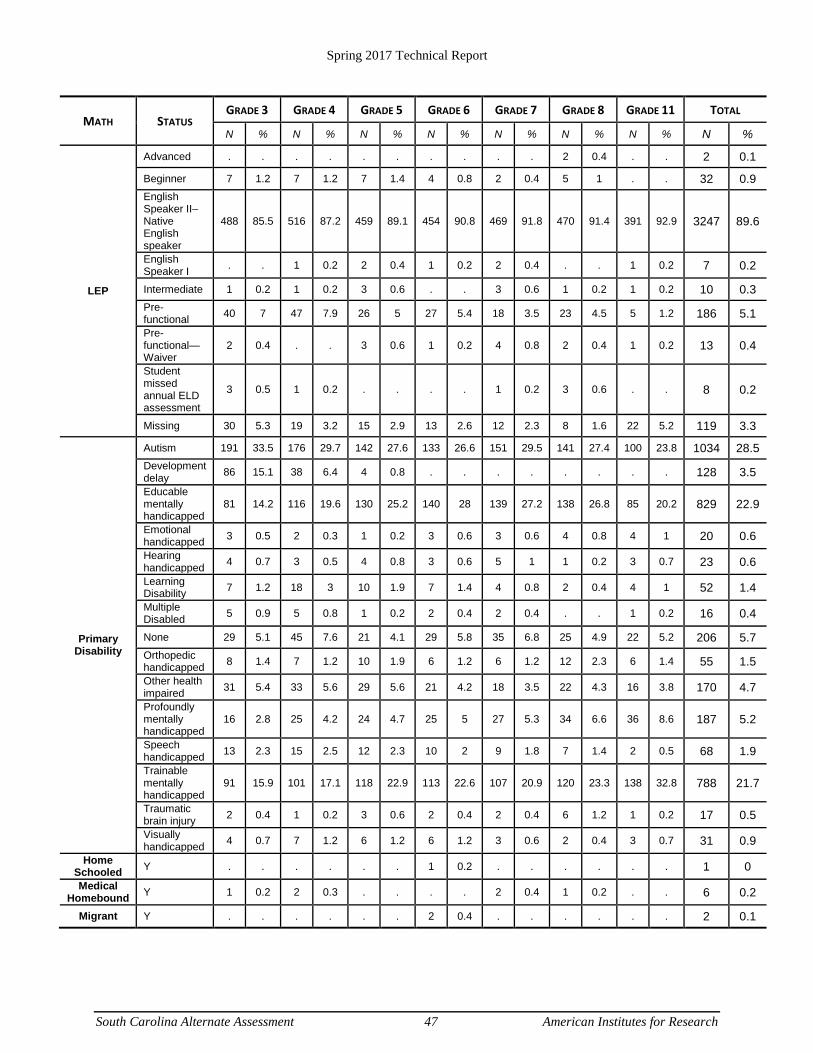
Spring 2017 Technical Report
South Carolina Alternate Assessment 47 American Institutes for Research
MATH STATUS GRADE 3 GRADE 4 GRADE 5 GRADE 6 GRADE 7 GRADE 8 GRADE 11 TOTAL
N % N % N % N % N % N % N % N %
LEP
Advanced . . . . . . . . . . 2 0.4 . . 2 0.1
Beginner 7 1.2 7 1.2 7 1.4 4 0.8 2 0.4 5 1 . . 32 0.9 English Speaker II–Native English speaker
488 85.5 516 87.2 459 89.1 454 90.8 469 91.8 470 91.4 391 92.9 3247 89.6
English Speaker I . . 1 0.2 2 0.4 1 0.2 2 0.4 . . 1 0.2 7 0.2
Intermediate 1 0.2 1 0.2 3 0.6 . . 3 0.6 1 0.2 1 0.2 10 0.3 Pre-functional 40 7 47 7.9 26 5 27 5.4 18 3.5 23 4.5 5 1.2 186 5.1
Pre-functional—Waiver
2 0.4 . . 3 0.6 1 0.2 4 0.8 2 0.4 1 0.2 13 0.4
Student missed annual ELD assessment
3 0.5 1 0.2 . . . . 1 0.2 3 0.6 . . 8 0.2
Missing 30 5.3 19 3.2 15 2.9 13 2.6 12 2.3 8 1.6 22 5.2 119 3.3
Primary Disability
Autism 191 33.5 176 29.7 142 27.6 133 26.6 151 29.5 141 27.4 100 23.8 1034 28.5 Development delay 86 15.1 38 6.4 4 0.8 . . . . . . . . 128 3.5
Educable mentally handicapped
81 14.2 116 19.6 130 25.2 140 28 139 27.2 138 26.8 85 20.2 829 22.9
Emotional handicapped 3 0.5 2 0.3 1 0.2 3 0.6 3 0.6 4 0.8 4 1 20 0.6
Hearing handicapped 4 0.7 3 0.5 4 0.8 3 0.6 5 1 1 0.2 3 0.7 23 0.6
Learning Disability 7 1.2 18 3 10 1.9 7 1.4 4 0.8 2 0.4 4 1 52 1.4
Multiple Disabled 5 0.9 5 0.8 1 0.2 2 0.4 2 0.4 . . 1 0.2 16 0.4
None 29 5.1 45 7.6 21 4.1 29 5.8 35 6.8 25 4.9 22 5.2 206 5.7 Orthopedic handicapped 8 1.4 7 1.2 10 1.9 6 1.2 6 1.2 12 2.3 6 1.4 55 1.5
Other health impaired 31 5.4 33 5.6 29 5.6 21 4.2 18 3.5 22 4.3 16 3.8 170 4.7
Profoundly mentally handicapped
16 2.8 25 4.2 24 4.7 25 5 27 5.3 34 6.6 36 8.6 187 5.2
Speech handicapped 13 2.3 15 2.5 12 2.3 10 2 9 1.8 7 1.4 2 0.5 68 1.9
Trainable mentally handicapped
91 15.9 101 17.1 118 22.9 113 22.6 107 20.9 120 23.3 138 32.8 788 21.7
Traumatic brain injury 2 0.4 1 0.2 3 0.6 2 0.4 2 0.4 6 1.2 1 0.2 17 0.5
Visually handicapped 4 0.7 7 1.2 6 1.2 6 1.2 3 0.6 2 0.4 3 0.7 31 0.9
Home Schooled Y . . . . . . 1 0.2 . . . . . . 1 0
Medical Homebound Y 1 0.2 2 0.3 . . . . 2 0.4 1 0.2 . . 6 0.2
Migrant Y . . . . . . 2 0.4 . . . . . . 2 0.1
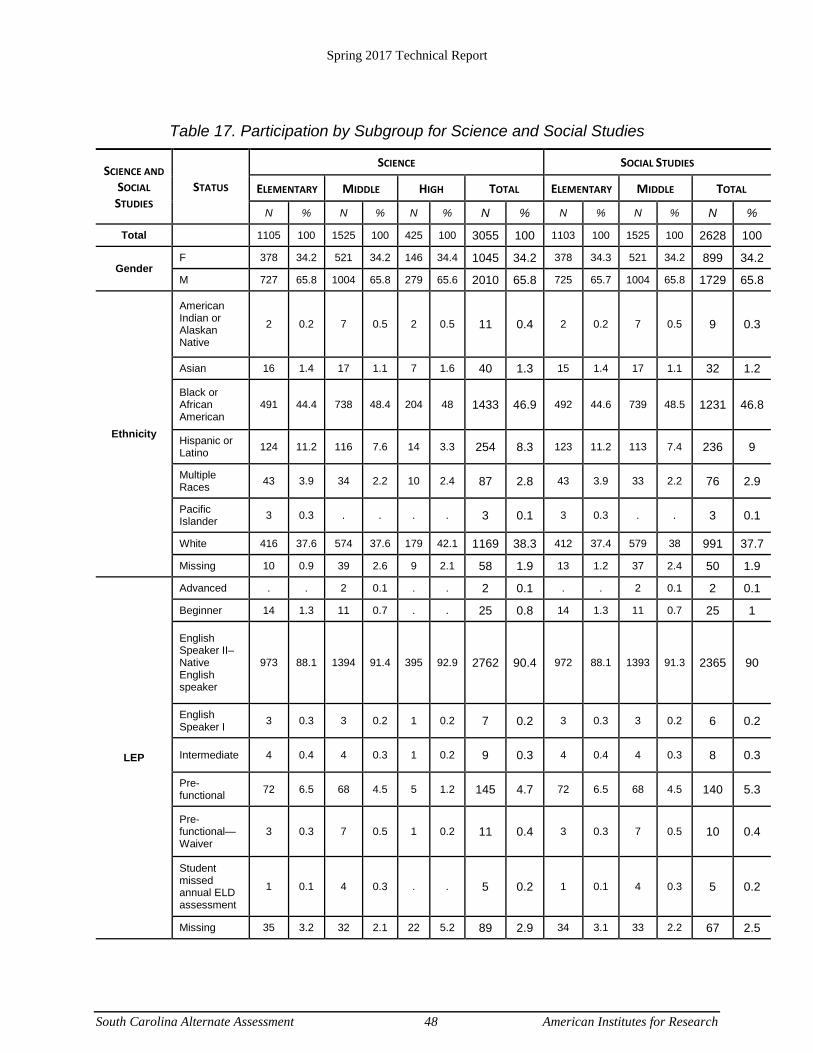
Spring 2017 Technical Report
South Carolina Alternate Assessment 48 American Institutes for Research
Table 17. Participation by Subgroup for Science and Social Studies
SCIENCE AND SOCIAL STUDIES
STATUS
SCIENCE SOCIAL STUDIES
ELEMENTARY MIDDLE HIGH TOTAL ELEMENTARY MIDDLE TOTAL
N % N % N % N % N % N % N %
Total 1105 100 1525 100 425 100 3055 100 1103 100 1525 100 2628 100
Gender F 378 34.2 521 34.2 146 34.4 1045 34.2 378 34.3 521 34.2 899 34.2
M 727 65.8 1004 65.8 279 65.6 2010 65.8 725 65.7 1004 65.8 1729 65.8
Ethnicity
American Indian or Alaskan Native
2 0.2 7 0.5 2 0.5 11 0.4 2 0.2 7 0.5 9 0.3
Asian 16 1.4 17 1.1 7 1.6 40 1.3 15 1.4 17 1.1 32 1.2
Black or African American
491 44.4 738 48.4 204 48 1433 46.9 492 44.6 739 48.5 1231 46.8
Hispanic or Latino 124 11.2 116 7.6 14 3.3 254 8.3 123 11.2 113 7.4 236 9
Multiple Races 43 3.9 34 2.2 10 2.4 87 2.8 43 3.9 33 2.2 76 2.9
Pacific Islander 3 0.3 . . . . 3 0.1 3 0.3 . . 3 0.1
White 416 37.6 574 37.6 179 42.1 1169 38.3 412 37.4 579 38 991 37.7
Missing 10 0.9 39 2.6 9 2.1 58 1.9 13 1.2 37 2.4 50 1.9
LEP
Advanced . . 2 0.1 . . 2 0.1 . . 2 0.1 2 0.1
Beginner 14 1.3 11 0.7 . . 25 0.8 14 1.3 11 0.7 25 1
English Speaker II–Native English speaker
973 88.1 1394 91.4 395 92.9 2762 90.4 972 88.1 1393 91.3 2365 90
English Speaker I 3 0.3 3 0.2 1 0.2 7 0.2 3 0.3 3 0.2 6 0.2
Intermediate 4 0.4 4 0.3 1 0.2 9 0.3 4 0.4 4 0.3 8 0.3
Pre-functional 72 6.5 68 4.5 5 1.2 145 4.7 72 6.5 68 4.5 140 5.3
Pre-functional—Waiver
3 0.3 7 0.5 1 0.2 11 0.4 3 0.3 7 0.5 10 0.4
Student missed annual ELD assessment
1 0.1 4 0.3 . . 5 0.2 1 0.1 4 0.3 5 0.2
Missing 35 3.2 32 2.1 22 5.2 89 2.9 34 3.1 33 2.2 67 2.5
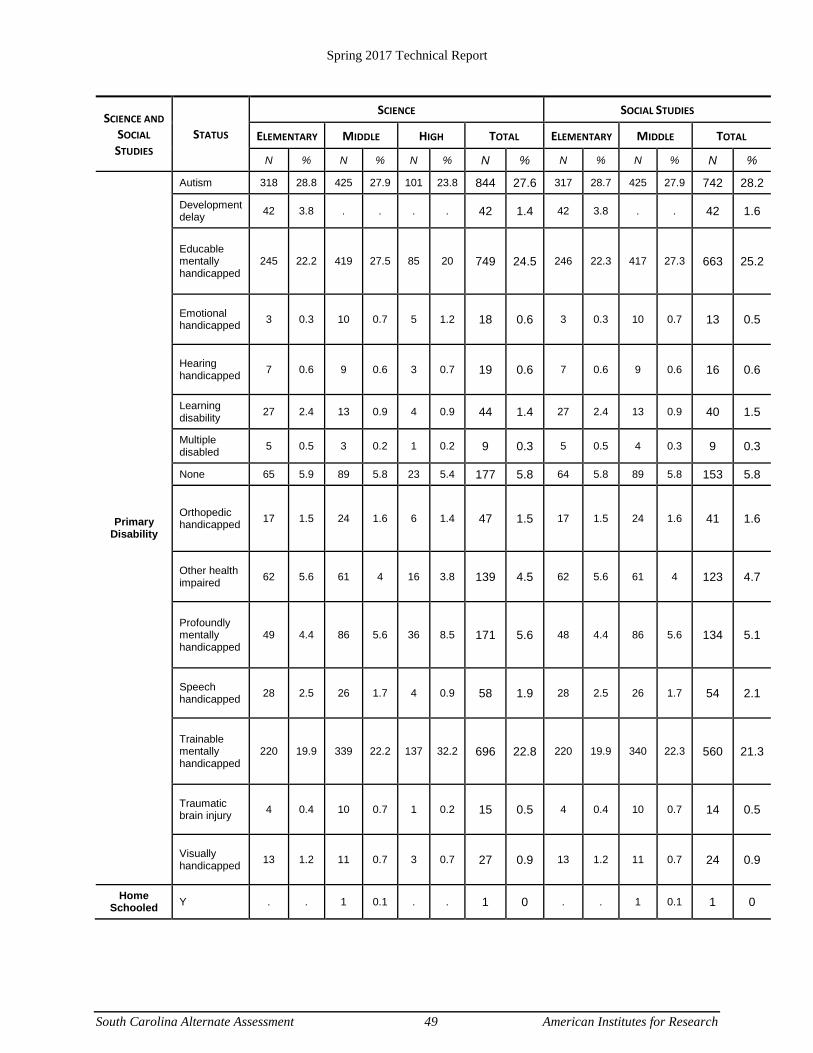
Spring 2017 Technical Report
South Carolina Alternate Assessment 49 American Institutes for Research
SCIENCE AND SOCIAL STUDIES
STATUS
SCIENCE SOCIAL STUDIES
ELEMENTARY MIDDLE HIGH TOTAL ELEMENTARY MIDDLE TOTAL
N % N % N % N % N % N % N %
Primary Disability
Autism 318 28.8 425 27.9 101 23.8 844 27.6 317 28.7 425 27.9 742 28.2
Development delay 42 3.8 . . . . 42 1.4 42 3.8 . . 42 1.6
Educable mentally handicapped
245 22.2 419 27.5 85 20 749 24.5 246 22.3 417 27.3 663 25.2
Emotional handicapped 3 0.3 10 0.7 5 1.2 18 0.6 3 0.3 10 0.7 13 0.5
Hearing handicapped 7 0.6 9 0.6 3 0.7 19 0.6 7 0.6 9 0.6 16 0.6
Learning disability 27 2.4 13 0.9 4 0.9 44 1.4 27 2.4 13 0.9 40 1.5
Multiple disabled 5 0.5 3 0.2 1 0.2 9 0.3 5 0.5 4 0.3 9 0.3
None 65 5.9 89 5.8 23 5.4 177 5.8 64 5.8 89 5.8 153 5.8
Orthopedic handicapped 17 1.5 24 1.6 6 1.4 47 1.5 17 1.5 24 1.6 41 1.6
Other health impaired 62 5.6 61 4 16 3.8 139 4.5 62 5.6 61 4 123 4.7
Profoundly mentally handicapped
49 4.4 86 5.6 36 8.5 171 5.6 48 4.4 86 5.6 134 5.1
Speech handicapped 28 2.5 26 1.7 4 0.9 58 1.9 28 2.5 26 1.7 54 2.1
Trainable mentally handicapped
220 19.9 339 22.2 137 32.2 696 22.8 220 19.9 340 22.3 560 21.3
Traumatic brain injury 4 0.4 10 0.7 1 0.2 15 0.5 4 0.4 10 0.7 14 0.5
Visually handicapped 13 1.2 11 0.7 3 0.7 27 0.9 13 1.2 11 0.7 24 0.9
Home Schooled Y . . 1 0.1 . . 1 0 . . 1 0.1 1 0
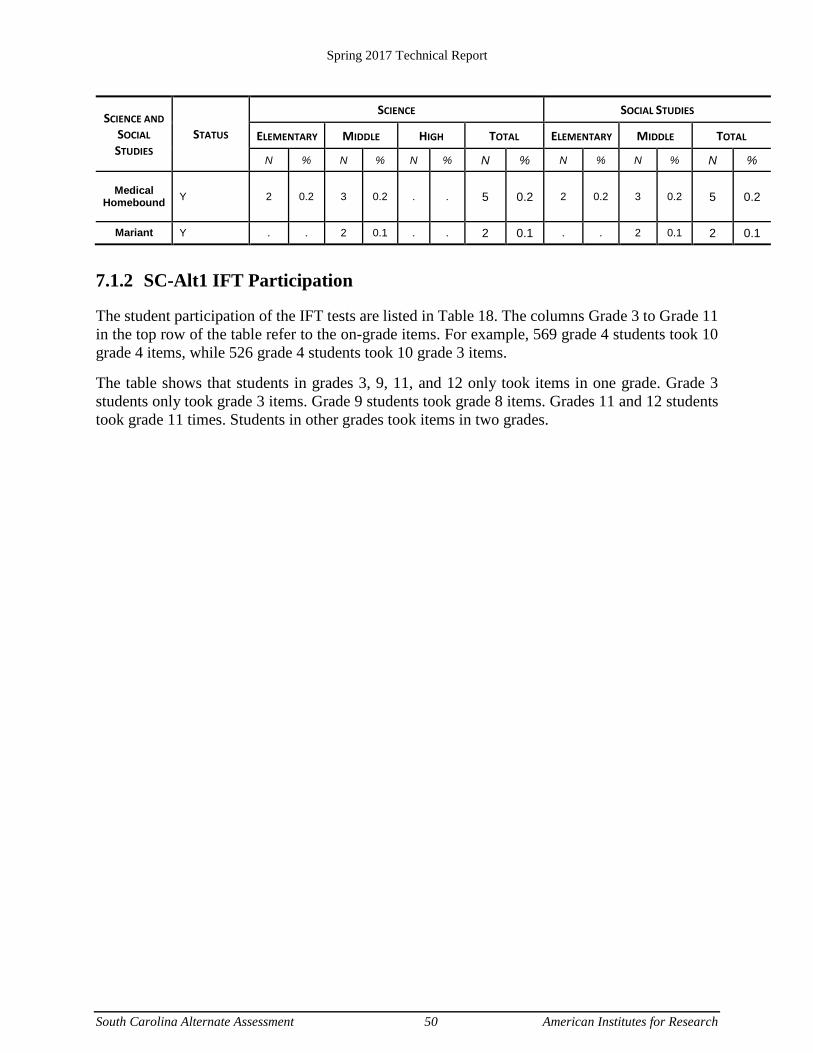
Spring 2017 Technical Report
South Carolina Alternate Assessment 50 American Institutes for Research
SCIENCE AND SOCIAL STUDIES
STATUS
SCIENCE SOCIAL STUDIES
ELEMENTARY MIDDLE HIGH TOTAL ELEMENTARY MIDDLE TOTAL
N % N % N % N % N % N % N %
Medical Homebound Y 2 0.2 3 0.2 . . 5 0.2 2 0.2 3 0.2 5 0.2
Mariant Y . . 2 0.1 . . 2 0.1 . . 2 0.1 2 0.1
7.1.2 SC-Alt1 IFT Participation
The student participation of the IFT tests are listed in Table 18. The columns Grade 3 to Grade 11 in the top row of the table refer to the on-grade items. For example, 569 grade 4 students took 10 grade 4 items, while 526 grade 4 students took 10 grade 3 items.
The table shows that students in grades 3, 9, 11, and 12 only took items in one grade. Grade 3 students only took grade 3 items. Grade 9 students took grade 8 items. Grades 11 and 12 students took grade 11 times. Students in other grades took items in two grades.
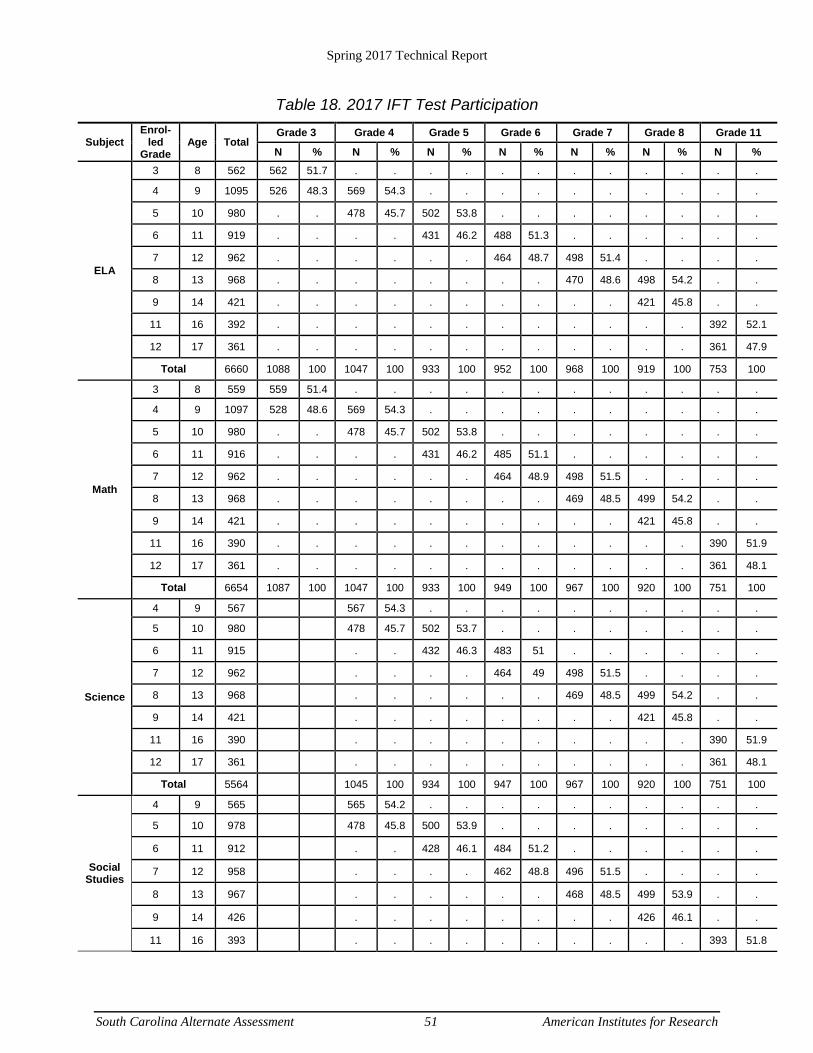
Spring 2017 Technical Report
South Carolina Alternate Assessment 51 American Institutes for Research
Table 18. 2017 IFT Test Participation
Subject Enrol-
led Grade
Age Total Grade 3 Grade 4 Grade 5 Grade 6 Grade 7 Grade 8 Grade 11
N % N % N % N % N % N % N %
ELA
3 8 562 562 51.7 . . . . . . . . . . . .
4 9 1095 526 48.3 569 54.3 . . . . . . . . . .
5 10 980 . . 478 45.7 502 53.8 . . . . . . . .
6 11 919 . . . . 431 46.2 488 51.3 . . . . . .
7 12 962 . . . . . . 464 48.7 498 51.4 . . . .
8 13 968 . . . . . . . . 470 48.6 498 54.2 . .
9 14 421 . . . . . . . . . . 421 45.8 . .
11 16 392 . . . . . . . . . . . . 392 52.1
12 17 361 . . . . . . . . . . . . 361 47.9
Total 6660 1088 100 1047 100 933 100 952 100 968 100 919 100 753 100
Math
3 8 559 559 51.4 . . . . . . . . . . . .
4 9 1097 528 48.6 569 54.3 . . . . . . . . . .
5 10 980 . . 478 45.7 502 53.8 . . . . . . . .
6 11 916 . . . . 431 46.2 485 51.1 . . . . . .
7 12 962 . . . . . . 464 48.9 498 51.5 . . . .
8 13 968 . . . . . . . . 469 48.5 499 54.2 . .
9 14 421 . . . . . . . . . . 421 45.8 . .
11 16 390 . . . . . . . . . . . . 390 51.9
12 17 361 . . . . . . . . . . . . 361 48.1
Total 6654 1087 100 1047 100 933 100 949 100 967 100 920 100 751 100
Science
4 9 567 567 54.3 . . . . . . . . . .
5 10 980 478 45.7 502 53.7 . . . . . . . .
6 11 915 . . 432 46.3 483 51 . . . . . .
7 12 962 . . . . 464 49 498 51.5 . . . .
8 13 968 . . . . . . 469 48.5 499 54.2 . .
9 14 421 . . . . . . . . 421 45.8 . .
11 16 390 . . . . . . . . . . 390 51.9
12 17 361 . . . . . . . . . . 361 48.1
Total 5564 1045 100 934 100 947 100 967 100 920 100 751 100
Social Studies
4 9 565 565 54.2 . . . . . . . . . .
5 10 978 478 45.8 500 53.9 . . . . . . . .
6 11 912 . . 428 46.1 484 51.2 . . . . . .
7 12 958 . . . . 462 48.8 496 51.5 . . . .
8 13 967 . . . . . . 468 48.5 499 53.9 . .
9 14 426 . . . . . . . . 426 46.1 . .
11 16 393 . . . . . . . . . . 393 51.8
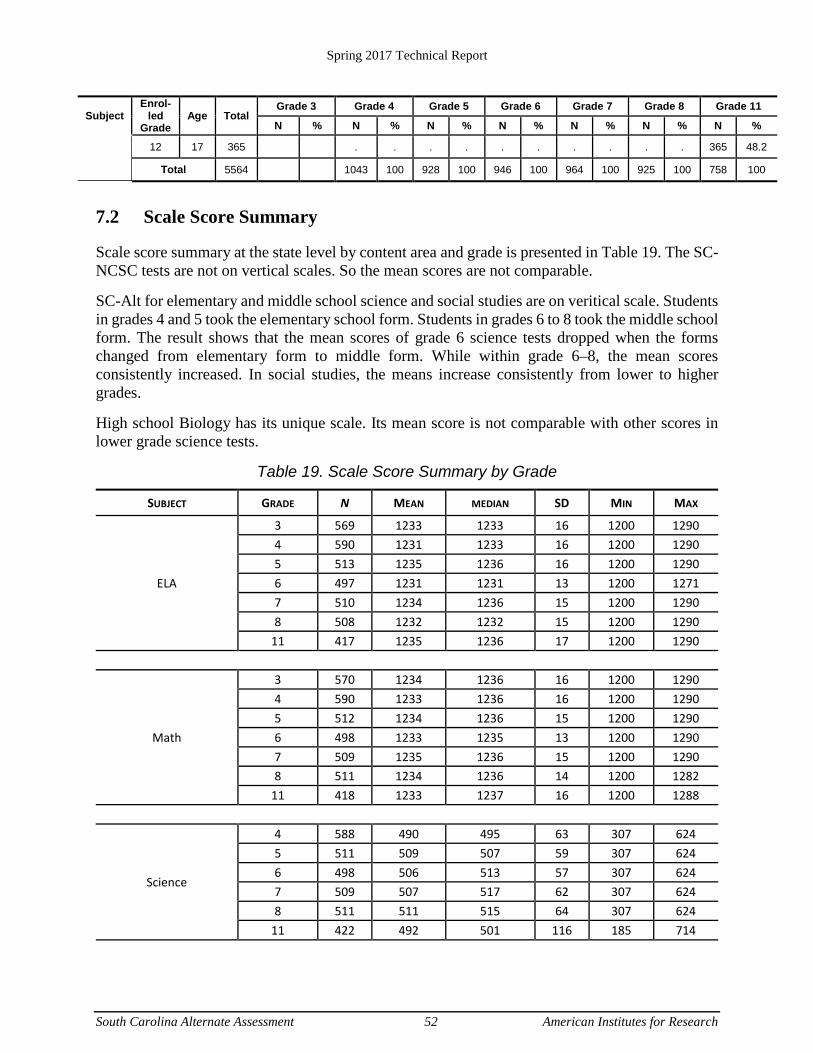
Spring 2017 Technical Report
South Carolina Alternate Assessment 52 American Institutes for Research
Subject Enrol-
led Grade
Age Total Grade 3 Grade 4 Grade 5 Grade 6 Grade 7 Grade 8 Grade 11
N % N % N % N % N % N % N %
12 17 365 . . . . . . . . . . 365 48.2
Total 5564 1043 100 928 100 946 100 964 100 925 100 758 100
7.2 Scale Score Summary
Scale score summary at the state level by content area and grade is presented in Table 19. The SC-NCSC tests are not on vertical scales. So the mean scores are not comparable.
SC-Alt for elementary and middle school science and social studies are on veritical scale. Students in grades 4 and 5 took the elementary school form. Students in grades 6 to 8 took the middle school form. The result shows that the mean scores of grade 6 science tests dropped when the forms changed from elementary form to middle form. While within grade 6–8, the mean scores consistently increased. In social studies, the means increase consistently from lower to higher grades.
High school Biology has its unique scale. Its mean score is not comparable with other scores in lower grade science tests.
Table 19. Scale Score Summary by Grade
SUBJECT GRADE N MEAN MEDIAN SD MIN MAX
ELA
3 569 1233 1233 16 1200 1290 4 590 1231 1233 16 1200 1290 5 513 1235 1236 16 1200 1290 6 497 1231 1231 13 1200 1271 7 510 1234 1236 15 1200 1290 8 508 1232 1232 15 1200 1290
11 417 1235 1236 17 1200 1290
Math
3 570 1234 1236 16 1200 1290 4 590 1233 1236 16 1200 1290 5 512 1234 1236 15 1200 1290 6 498 1233 1235 13 1200 1290 7 509 1235 1236 15 1200 1290 8 511 1234 1236 14 1200 1282
11 418 1233 1237 16 1200 1288
Science
4 588 490 495 63 307 624 5 511 509 507 59 307 624 6 498 506 513 57 307 624 7 509 507 517 62 307 624 8 511 511 515 64 307 624
11 422 492 501 116 185 714
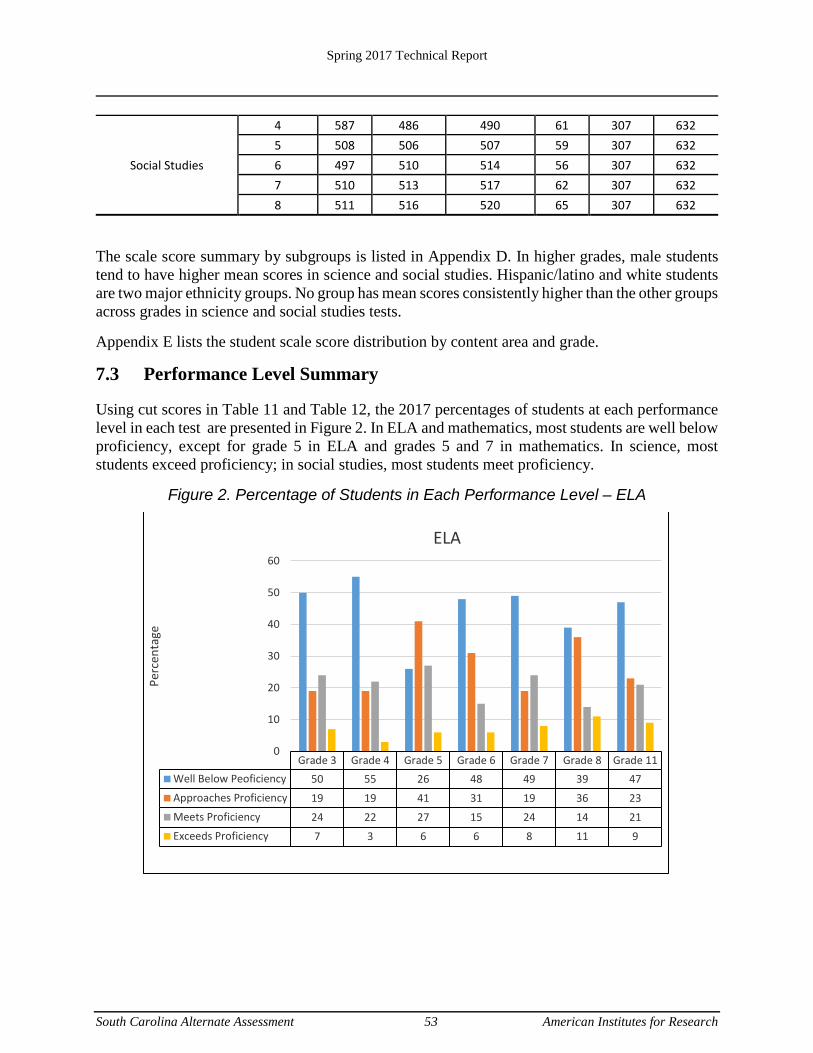
Spring 2017 Technical Report
South Carolina Alternate Assessment 53 American Institutes for Research
Social Studies
4 587 486 490 61 307 632 5 508 506 507 59 307 632 6 497 510 514 56 307 632 7 510 513 517 62 307 632 8 511 516 520 65 307 632
The scale score summary by subgroups is listed in Appendix D. In higher grades, male students tend to have higher mean scores in science and social studies. Hispanic/latino and white students are two major ethnicity groups. No group has mean scores consistently higher than the other groups across grades in science and social studies tests.
Appendix E lists the student scale score distribution by content area and grade.
7.3 Performance Level Summary
Using cut scores in Table 11 and Table 12, the 2017 percentages of students at each performance level in each test are presented in Figure 2. In ELA and mathematics, most students are well below proficiency, except for grade 5 in ELA and grades 5 and 7 in mathematics. In science, most students exceed proficiency; in social studies, most students meet proficiency.
Figure 2. Percentage of Students in Each Performance Level – ELA
Grade 3 Grade 4 Grade 5 Grade 6 Grade 7 Grade 8 Grade 11Well Below Peoficiency 50 55 26 48 49 39 47Approaches Proficiency 19 19 41 31 19 36 23Meets Proficiency 24 22 27 15 24 14 21Exceeds Proficiency 7 3 6 6 8 11 9
0
10
20
30
40
50
60
Perc
enta
ge
ELA
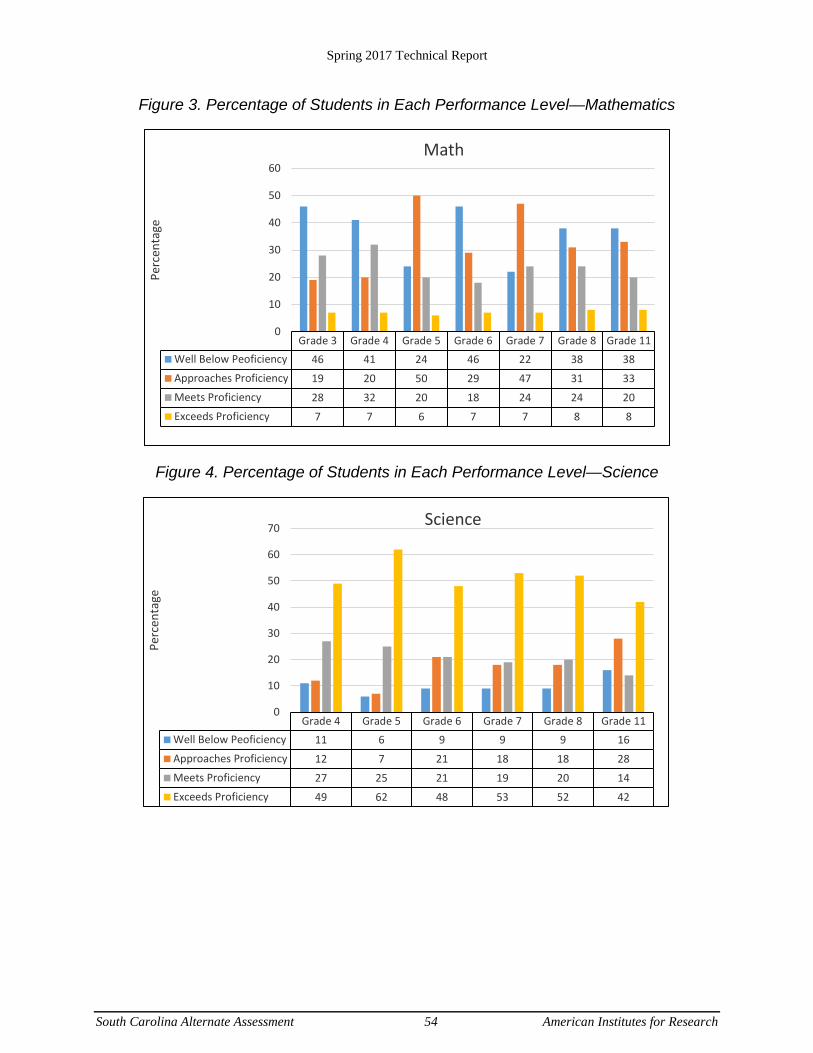
Spring 2017 Technical Report
South Carolina Alternate Assessment 54 American Institutes for Research
Figure 3. Percentage of Students in Each Performance Level—Mathematics
Figure 4. Percentage of Students in Each Performance Level—Science
Grade 3 Grade 4 Grade 5 Grade 6 Grade 7 Grade 8 Grade 11Well Below Peoficiency 46 41 24 46 22 38 38Approaches Proficiency 19 20 50 29 47 31 33Meets Proficiency 28 32 20 18 24 24 20Exceeds Proficiency 7 7 6 7 7 8 8
0
10
20
30
40
50
60Pe
rcen
tage
Math
Grade 4 Grade 5 Grade 6 Grade 7 Grade 8 Grade 11Well Below Peoficiency 11 6 9 9 9 16Approaches Proficiency 12 7 21 18 18 28Meets Proficiency 27 25 21 19 20 14Exceeds Proficiency 49 62 48 53 52 42
0
10
20
30
40
50
60
70
Perc
enta
ge
Science

Spring 2017 Technical Report
South Carolina Alternate Assessment 55 American Institutes for Research
Figure 5. Percentage of Students in Each Performance Level—Social Studies
8. Reporting The purpose of the SC-NCSC and the SC-Alt Science/Biology and Social Studies is to provide families, teachers, and other educators with information on the achievement and academic proficiency of students with significant cognitive disabilities. The results were provided in two mediums: the Online Reporting System (ORS) and paper family reports.
8.1 Online Reporting Systemm (ORS)
The ORS provides reliable score reports for authorized users. The ORS also produces aggregated score reports for teachers, schools, districts, and states. All online reports are updated each time a student completes a test. Additionally, the ORS provides participation data that help monitor the student participation rate during the testing window.
The ORS is designed with great consideration for stakeholders who are not technical measurement experts (e.g., teachers, parents, students). It ensures that test results are easily readable. Simple language is used so that users can quickly understand assessment results and make valid inferences about student achievement. In addition, the ORS is designed to present student performance in a uniform format. For example, similar colors are used for groups of similar elements, such as achievement levels, throughout the design. This design strategy allows users to compare similar elements and to avoid comparing dissimilar elements.
Once authorized users log in to the ORS and select Score Reports, the online score reports are presented hierarchically. Each aggregate report contains the summary results for the selected aggregate unit, as well as all aggregate units above the selected aggregate. For example, if a school
Grade 4 Grade 5 Grade 6 Grade 7 Grade 8Well Below Peoficiency 11 6 6 8 8Approaches Proficiency 41 31 32 25 26Meets Proficiency 37 41 47 48 44Exceeds Proficiency 11 22 15 19 22
0
10
20
30
40
50
60
Perc
enta
geSocial Studies

Spring 2017 Technical Report
South Carolina Alternate Assessment 56 American Institutes for Research
is selected, the summary results of the district to which the school belongs and the summary results of the state are also provided such that the school performance can be compared with district and state performance. If a teacher is selected, the summary results for the school, the district, and the state are also provided for comparison purposes. Table 20 lists the types of online reports and the levels at which they can be viewed (student, roster, teacher, school, and district).
Table 20. Types of Online Score Reports by Aggregation
LEVEL OF AGGREGATION TYPES OF ONLINE SCORE REPORTS
State District School Teacher Roster
Number of students tested Percent at level 3 or above (overall and by subgroup) Average scale score (overall and by subgroup) Percentage of students at each performance level (overall and by subgroup) On-demand student roster report
Student Overall Scale Score Performance level
8.2 Subgroup Report
The aggregate score reports at a selected aggregate level are provided for all the students and by subgroups. Users can see student assessment results by any subgroup specified by the user. Table 21 presents the types of subgroups and subgroup categories provided in the ORS.
Table 21. Types of Subgroups
BREAKDOWN BY CATEGORY DISPLAYED CATEGORY
Enrolled Grade 1
Enrolled Grade 2
Enrolled Grade 3
Enrolled Grade 4
Enrolled Grade 5
Enrolled Grade 6
Enrolled Grade 7
Enrolled Grade 8
Enrolled Grade 9
Enrolled Grade 10
Enrolled Grade 11
Enrolled Grade 12
Gender Male
Gender Female
Hispanic or Latino Yes
Hispanic or Latino No
Hispanic or Latino No
Spring 2017 Technical Report
South Carolina Alternate Assessment 57 American Institutes for Research
BREAKDOWN BY CATEGORY DISPLAYED CATEGORY
Medically Homebound Yes
Medically Homebound No
Home Schooled Yes
Home Schooled No
EFA Code Autism
EFA Code Emotional Handicapped
EFA Code Educable Mentally Handicapped
EFA Code Hearing Handicapped
EFA Code Learning Disability
EFA Code Orthopedic Handicapped
EFA Code Speech Handicapped
EFA Code Trainable Mentally Handicapped
EFA Code Visually Handicapped
EFA Code Other Health Impaired
EFA Code Traumatic Brain Injury
EFA Code Profoundly Mentally Handicapped
EFA Code Development Delay
EFA Code None
LEP Code Pre-Functional
LEP Code Beginner
LEP Code Intermediate
LEP Code Advanced
LEP Code Initially English Proficient
LEP Code Title III First Year Exited
LEP Code Title III Second + Year Exited
LEP Code English Speaker I
LEP Code English Speaker
LEP Code Native English speaker
LEP Code Student missed annual ELD assessment
LEP Code Pre-functional—Waiver
LEP Code Beginner—Waiver
LEP Code Intermediate—Waiver
LEP Code Advanced—Waiver
LEP Code Fluent—Waiver
Migrant Status Not migrant student
Migrant Status Migrant student

Spring 2017 Technical Report
South Carolina Alternate Assessment 58 American Institutes for Research
BREAKDOWN BY CATEGORY DISPLAYED CATEGORY
Race Multiracial
Race American Indian or Alaska Native
Race Asian
Race Hispanic
Race Black or African American
Race White
Race Native Hawaiian or Other Pacific Islander
8.3 Paper Report
The ORS provides the functionality for users to print out reports described above on paper. The ORS also allows users to print out the family report for each student. Figure 6 and Figure 7 show two mock-ups for the family reports, one for middle school students and the other for high school students. Note that high school students participated in the SC-Alt Biology assessment, but did not participate in a Social Studies assessment for the spring 2017 administration. High school students will participation in both the SC-Alt Online Assessments for Biology and US History and the Constitution during the spring 2018 administration.
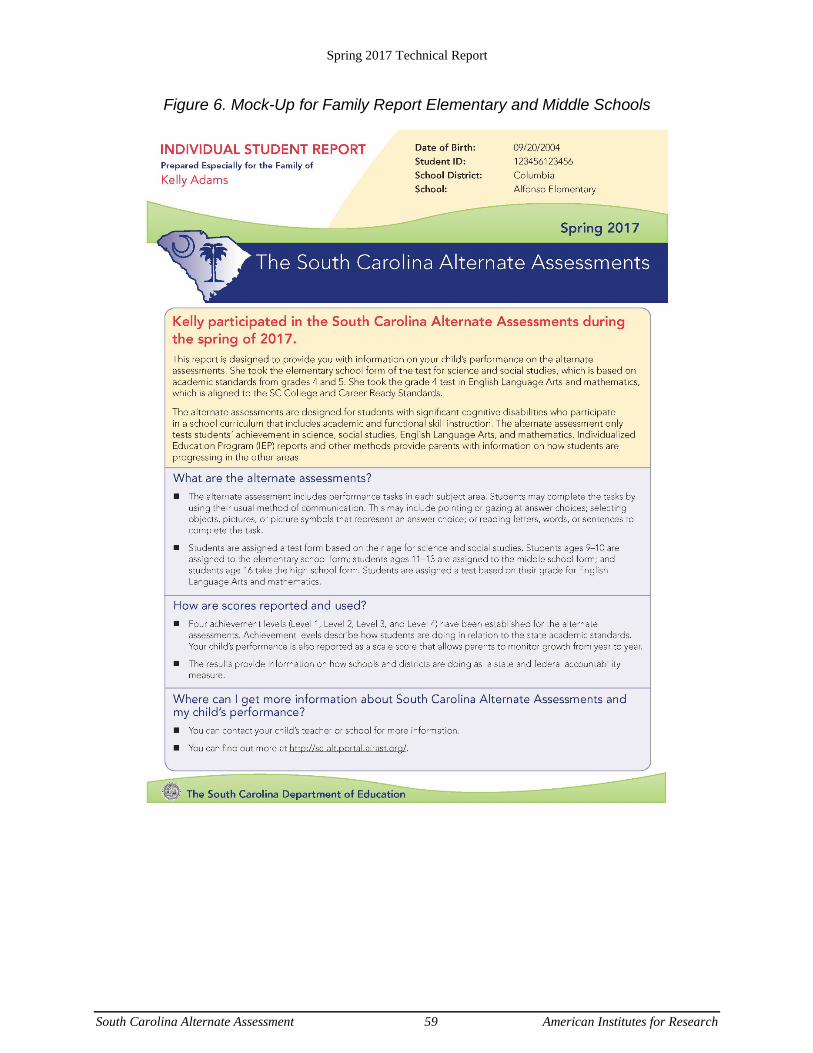
Spring 2017 Technical Report
South Carolina Alternate Assessment 59 American Institutes for Research
Figure 6. Mock-Up for Family Report Elementary and Middle Schools
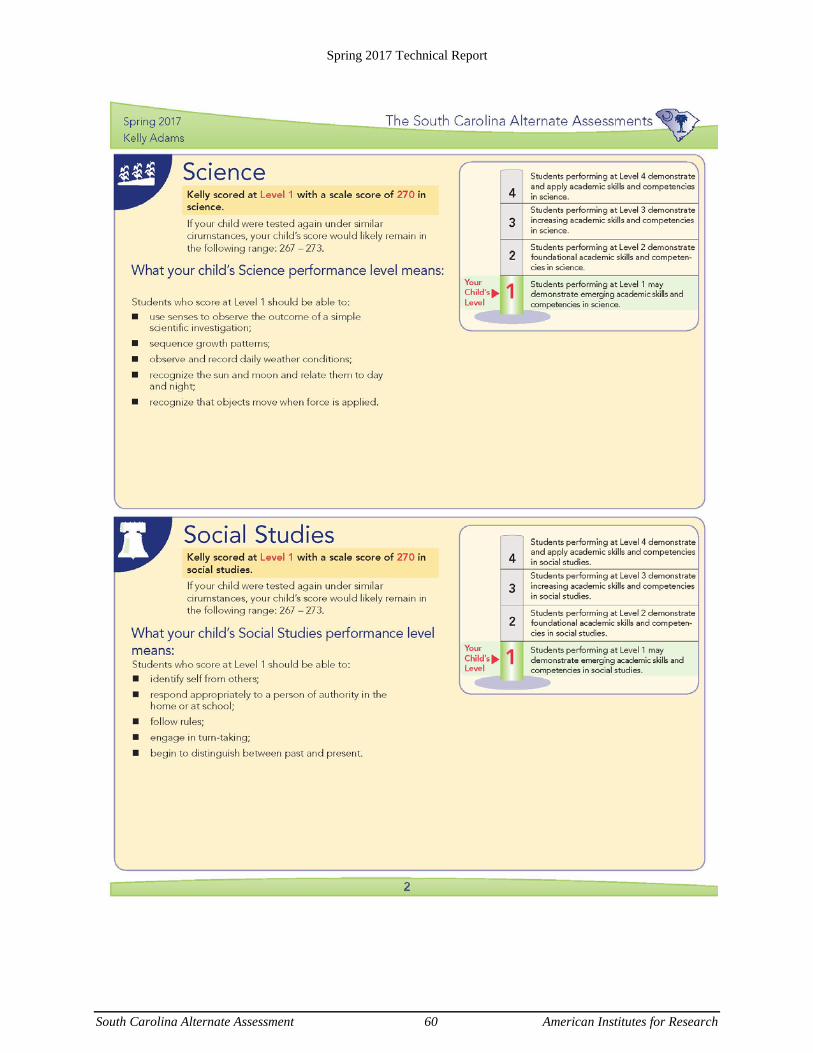
Spring 2017 Technical Report
South Carolina Alternate Assessment 60 American Institutes for Research
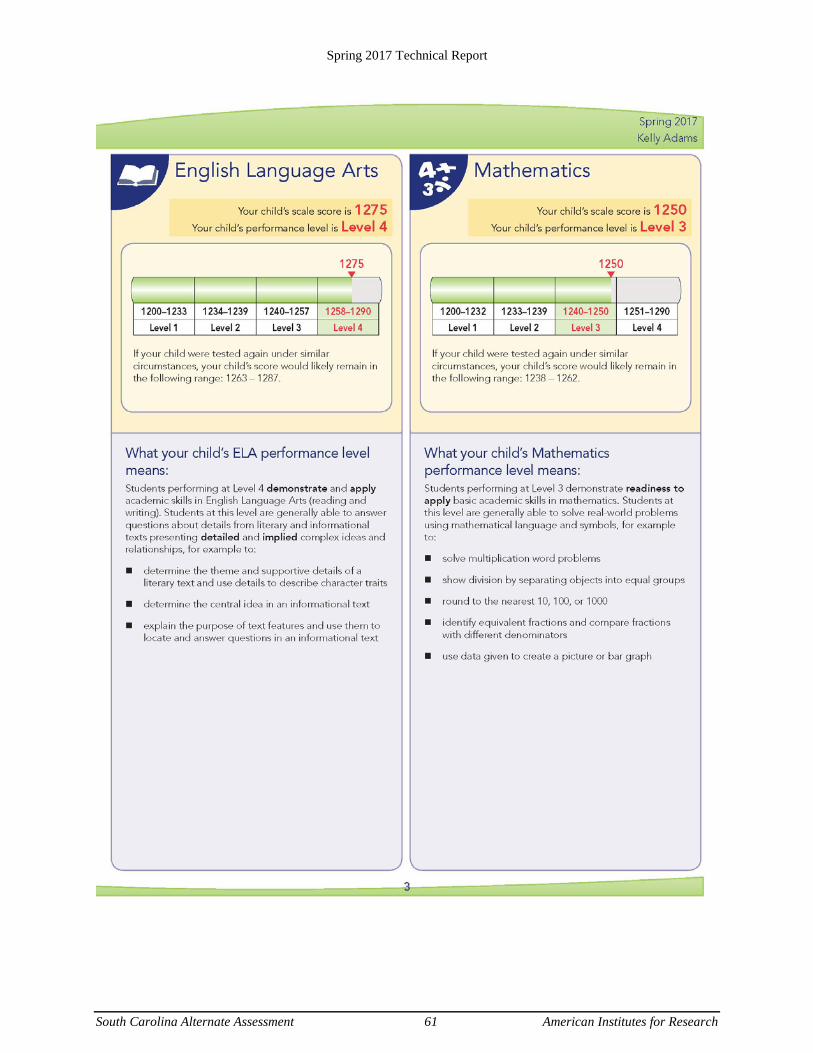
Spring 2017 Technical Report
South Carolina Alternate Assessment 61 American Institutes for Research
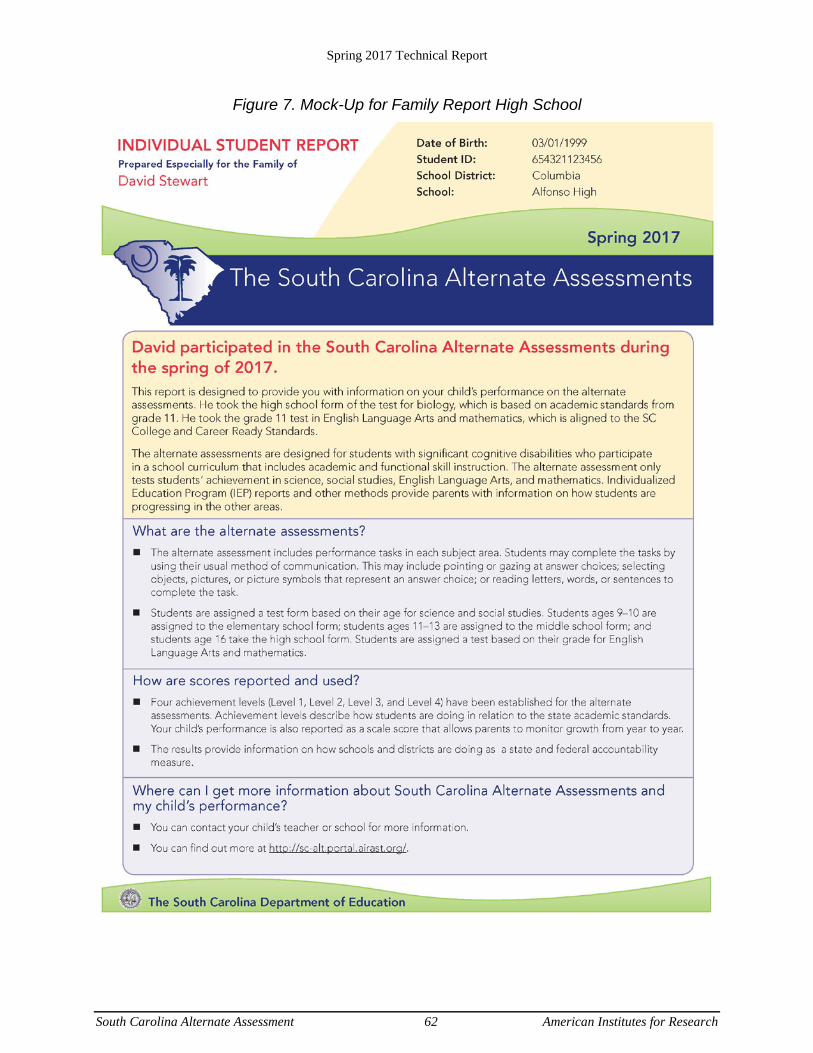
Spring 2017 Technical Report
South Carolina Alternate Assessment 62 American Institutes for Research
Figure 7. Mock-Up for Family Report High School
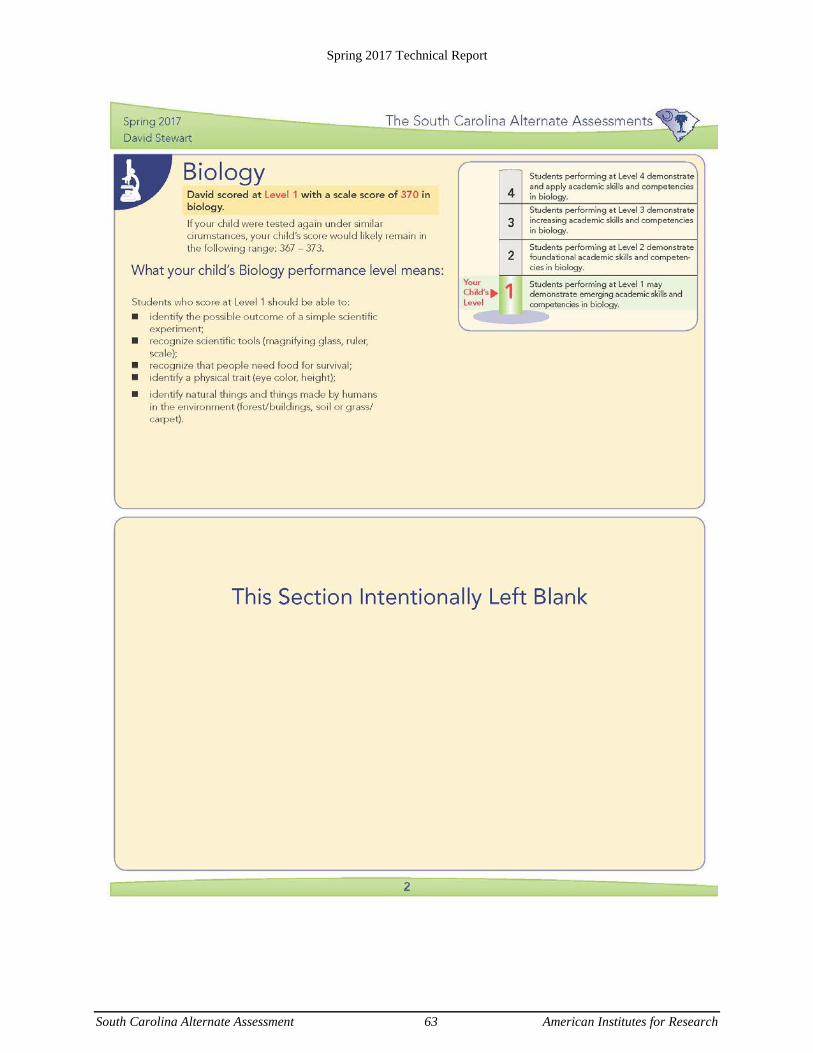
Spring 2017 Technical Report
South Carolina Alternate Assessment 63 American Institutes for Research
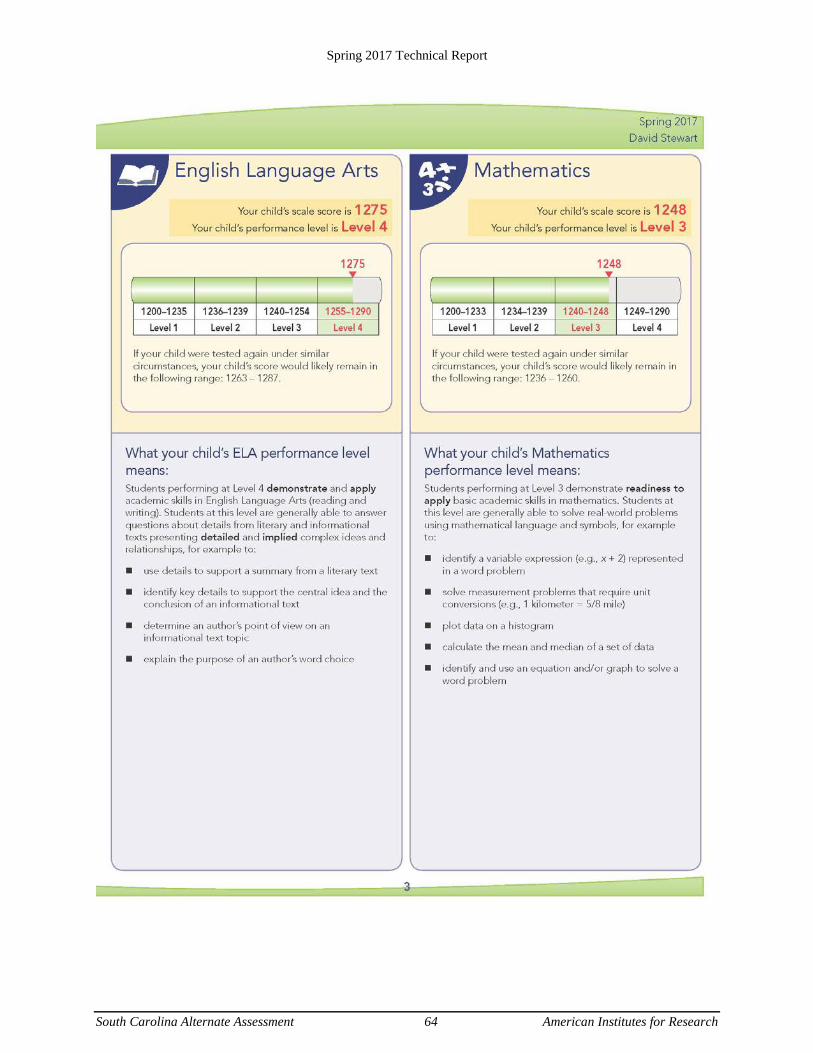
Spring 2017 Technical Report
South Carolina Alternate Assessment 64 American Institutes for Research
Spring 2017 Technical Report
South Carolina Alternate Assessment 65 American Institutes for Research
9. Technical Quality To examine the quality of the 2017 operational SC-NCSC and SC-Alt tests, the following analysis was conducted: test reliability, classification accuracy and consistency, and second rater analysis.
9.1 Test Reliability
Marginal reliability (Sireci, Thissen, & Wainer, 1991) and marginal standard error of measurement (MSEM) are computed to examine test form reliability.
To compute marginal reliability, first, we determine the marginal measurement error variance as
(2)
where is the square of the standard error of student ability estimate, . Thus, the marginal
measurement error variance can be estimated as the average of squared standard errors of estimates across students. Then, we estimate the marginal reliability as
(3)
where is the variance of the observedθ estimates.
In order to compare with the standard deviation (SD) of scale scores, MSEM can be estimated as the average of squared standard errors of scale scores.
Table 22 lists the marginal reliability indices, marginal SEM, and standard deviation of scale scores by test and grade. For ELA and Math, extreme scores (i.e., 1200 and 1290) were removed for calculating marginal reliability. The table shows that the marginal reliability coefficients range from 0.77 to 0.84 in ELA, 0.68 to 0.77 in mathematics, and 0.93 to 0.95 in Science and Social Studies. The reason that ELA tests are more reliable than mathematics tests is because ELA tests better suit student abilities. The mathematics tests are harder compared with students’ abilities. Usually, the standard error of measurement (SEM) for each score estimate is higher when the test difficulty does not suit student abilities (see SEM in Appendix C. Conversion Table for SC-NCSC), which lowers marginal reliabilities. The major reason that the SC-Alt has higher reliabilities than SC-NCSC is because most items in SC-Alt tests are 2-point items, while all items in SC-NCSC are 1-point items. Although both assessments have similar number of items, SC-Alt has significantly more score points in each test, which increased the reliabilities of the tests. To improve marginal reliabilities, we would like to have the test that include items to cover the entire range of students’ abilities and have enough items or score points to better reflect student abilities.
Accordingly, in ELA and mathematics, the marginal standard error of measurement (MSEM) is about half of the standard deviation of scale scores. While in science and social studies, the MSEM
*2e
σ
∫ ∑==N
dp eee
222 *
** )(σ
θθσσ
*2e
σ θ̂
θ̂
( ) 2ˆ
22ˆ * θθ
σσσρ e−=
2θ̂
σ
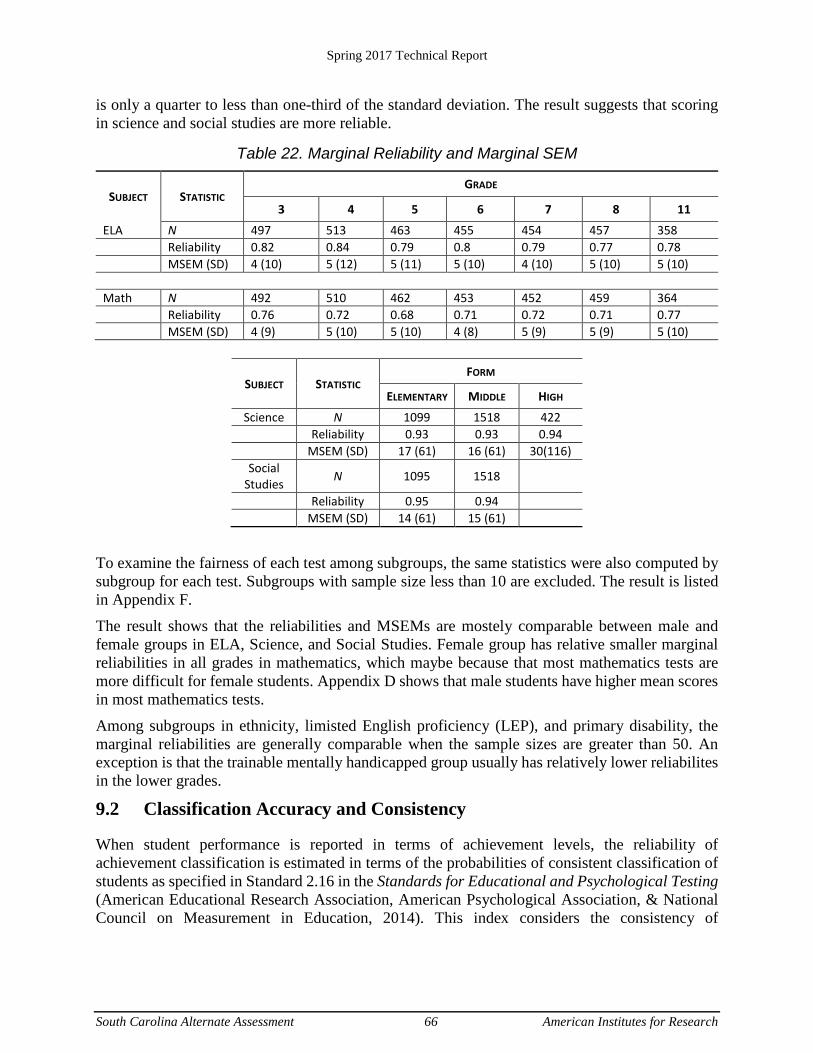
Spring 2017 Technical Report
South Carolina Alternate Assessment 66 American Institutes for Research
is only a quarter to less than one-third of the standard deviation. The result suggests that scoring in science and social studies are more reliable.
Table 22. Marginal Reliability and Marginal SEM
SUBJECT STATISTIC GRADE
3 4 5 6 7 8 11 ELA N 497 513 463 455 454 457 358 Reliability 0.82 0.84 0.79 0.8 0.79 0.77 0.78 MSEM (SD) 4 (10) 5 (12) 5 (11) 5 (10) 4 (10) 5 (10) 5 (10) Math N 492 510 462 453 452 459 364 Reliability 0.76 0.72 0.68 0.71 0.72 0.71 0.77 MSEM (SD) 4 (9) 5 (10) 5 (10) 4 (8) 5 (9) 5 (9) 5 (10)
SUBJECT STATISTIC FORM
ELEMENTARY MIDDLE HIGH Science N 1099 1518 422
Reliability 0.93 0.93 0.94 MSEM (SD) 17 (61) 16 (61) 30(116)
Social Studies N 1095 1518
Reliability 0.95 0.94 MSEM (SD) 14 (61) 15 (61)
To examine the fairness of each test among subgroups, the same statistics were also computed by subgroup for each test. Subgroups with sample size less than 10 are excluded. The result is listed in Appendix F.
The result shows that the reliabilities and MSEMs are mostely comparable between male and female groups in ELA, Science, and Social Studies. Female group has relative smaller marginal reliabilities in all grades in mathematics, which maybe because that most mathematics tests are more difficult for female students. Appendix D shows that male students have higher mean scores in most mathematics tests.
Among subgroups in ethnicity, limisted English proficiency (LEP), and primary disability, the marginal reliabilities are generally comparable when the sample sizes are greater than 50. An exception is that the trainable mentally handicapped group usually has relatively lower reliabilites in the lower grades.
9.2 Classification Accuracy and Consistency
When student performance is reported in terms of achievement levels, the reliability of achievement classification is estimated in terms of the probabilities of consistent classification of students as specified in Standard 2.16 in the Standards for Educational and Psychological Testing (American Educational Research Association, American Psychological Association, & National Council on Measurement in Education, 2014). This index considers the consistency of
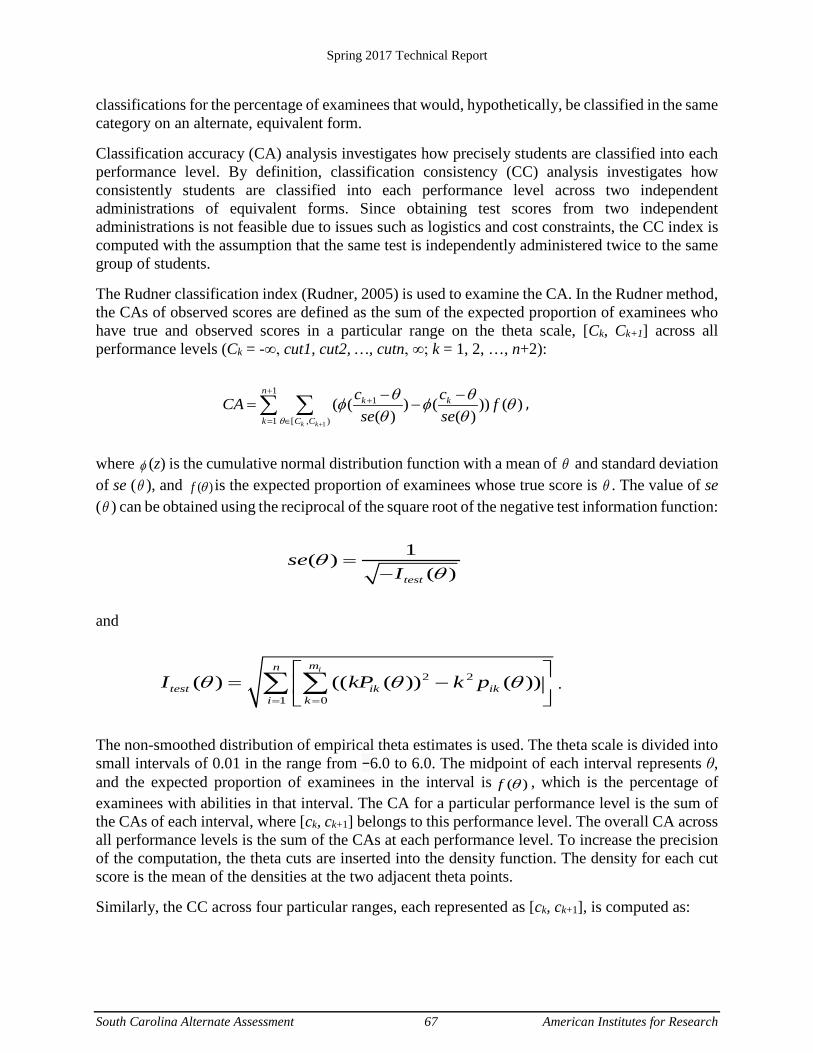
Spring 2017 Technical Report
South Carolina Alternate Assessment 67 American Institutes for Research
classifications for the percentage of examinees that would, hypothetically, be classified in the same category on an alternate, equivalent form.
Classification accuracy (CA) analysis investigates how precisely students are classified into each performance level. By definition, classification consistency (CC) analysis investigates how consistently students are classified into each performance level across two independent administrations of equivalent forms. Since obtaining test scores from two independent administrations is not feasible due to issues such as logistics and cost constraints, the CC index is computed with the assumption that the same test is independently administered twice to the same group of students.
The Rudner classification index (Rudner, 2005) is used to examine the CA. In the Rudner method, the CAs of observed scores are defined as the sum of the expected proportion of examinees who have true and observed scores in a particular range on the theta scale, [Ck, Ck+1] across all performance levels (Ck = -∞, cut1, cut2, …, cutn, ∞; k = 1, 2, …, n+2):
1
11
1 [ , )( ( ) ( )) ( )
( ) ( )k k
nk k
k C C
c cCA fse seθ
θ θφ φ θθ θ
+
++
= ∈
− −= −∑ ∑ ,
where φ (z) is the cumulative normal distribution function with a mean of θ and standard deviation of se (θ ), and ( )f θ is the expected proportion of examinees whose true score is θ . The value of se (θ ) can be obtained using the reciprocal of the square root of the negative test information function:
1( )( )test
seI
θθ
=−
and
2 2
1 0( ) (( ( )) ( ))
imn
test ik iki k
I kP k pθ θ θ= =
= −
∑ ∑ .
The non-smoothed distribution of empirical theta estimates is used. The theta scale is divided into small intervals of 0.01 in the range from −6.0 to 6.0. The midpoint of each interval represents θ, and the expected proportion of examinees in the interval is )(θf , which is the percentage of examinees with abilities in that interval. The CA for a particular performance level is the sum of the CAs of each interval, where [ck, ck+1] belongs to this performance level. The overall CA across all performance levels is the sum of the CAs at each performance level. To increase the precision of the computation, the theta cuts are inserted into the density function. The density for each cut score is the mean of the densities at the two adjacent theta points.
Similarly, the CC across four particular ranges, each represented as [ck, ck+1], is computed as:

Spring 2017 Technical Report
South Carolina Alternate Assessment 68 American Institutes for Research
1
11
1 [ , )( ( ) ( )) ^ 2 ( ))
( ) ( )k k
nk k
k C C
C CCC fse seθ
θ θϕ ϕ θθ θ
+
++
= ∈
− −= − ⋅∑ ∑ .
The CA and CC indices are affected by the interaction of the magnitude of se (θ ), the distance between adjacent cuts, the location of the cuts on the ability scale, and the proportion of students around a cut point. The larger the se (θ ), the closer the two adjacent cuts, and the greater the proportion of students around a cut point, the lower the CC index.
Error! Reference source not found. and 24 list the classification accuracy and consistency by content areas and grade for ELA and Math or grade-band for Science and Social Studies at each achievement level and overall test level. The result shows that at each performance level, the classification accuracies range from 0.83 to 0.99; most of them are above 0.85. The consistencies range from 0.77 to 0.98; most of them are above 0.8. At the test level, the overall classification accuracies range from 0.59 to 0.82 in ELA and Math, and 0.83 to 0.86 in Science and Social Studies. The overall classification consistencies range from 0.59 to 0.76 in ELA and Math, and 0.75 to 0.80 in Science and Social Studies. Classification accuracy and consistency are affected by the standard error of measurement at each score point, which is the standard error of meansurement conditioned (CSEM) on a score point. For SC-NCSC, the CSEM is shown in column SEM Scale Score in each conversion table included in Appendix C. The lower CSEM the lower the classification accuracy and consistency. Since ELA tests generally have lower CSEMS than mathematics tests do, the classification accuracy and consistency for ELA are lower than those for mathematics tests. For the same reason, the classification consistency indices for social studies tests are lower than those for science tests. Within a test, when CSEMs are lower, the MSEM is lower. As indicated in Table 22, social studies have lower MSEMs than science tests, and therefore, the classification accuracy and consistency are lower for social studies tests.
Table 23. Classification Accuracy by Grade/Grade Band
SUBJECT ACHIEVEMENT LEVEL GRADE 3 GRADE 4 GRADE 5 GRADE 6 GRADE 7 GRADE 8 GRADE 11
ELA
Level 2 0.89 0.91 0.88 0.88 0.89 0.88 0.88 Level 3 0.92 0.93 0.88 0.93 0.91 0.91 0.92 Level 4 0.96 0.98 0.97 0.97 0.96 0.95 0.96 Overall 0.78 0.82 0.74 0.78 0.77 0.74 0.77
Math
Level 2 0.86 0.88 0.87 0.83 0.88 0.86 0.87 Level 3 0.88 0.86 0.83 0.89 0.85 0.87 0.85 Level 4 0.97 0.95 0.97 0.96 0.97 0.94 0.94 Overall 0.65 0.61 0.59 0.59 0.6 0.59 0.59
Elementary Middle High
Science
Level 2 0.99 0.97 0.95 Level 3 0.94 0.93 0.93 Level 4 0.9 0.92 0.93 Overall 0.83 0.82 0.81 Level 2 0.99 0.99
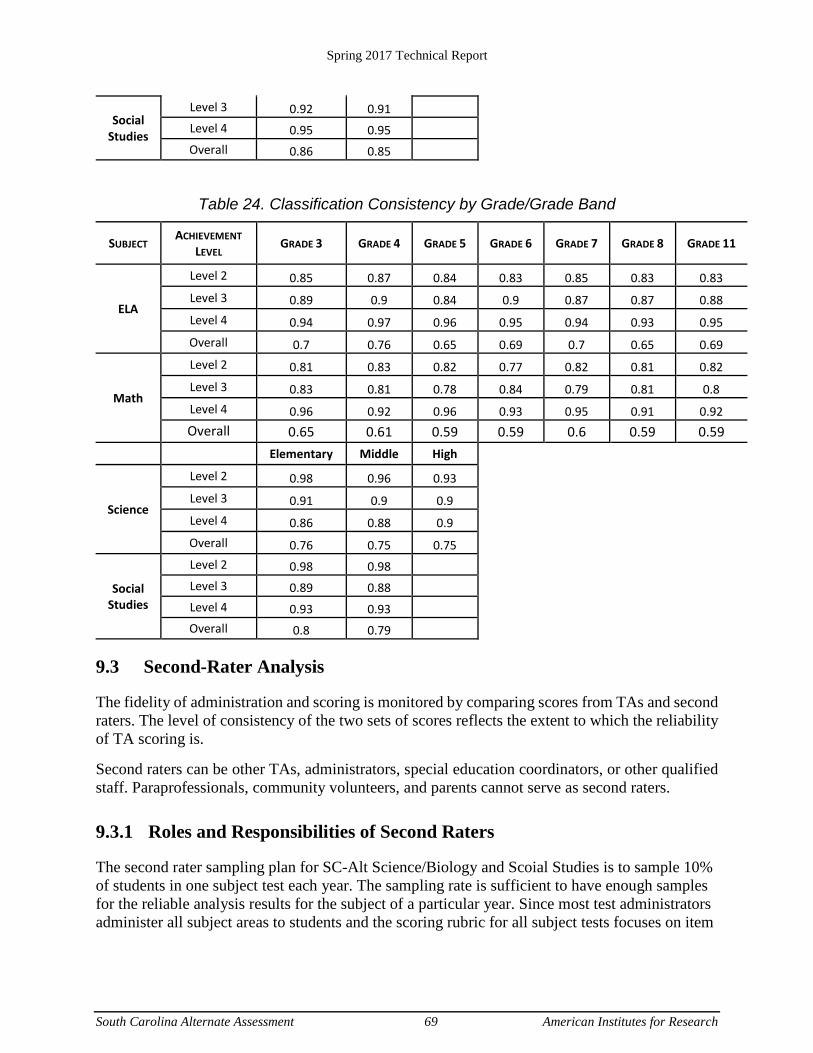
Spring 2017 Technical Report
South Carolina Alternate Assessment 69 American Institutes for Research
Social Studies
Level 3 0.92 0.91 Level 4 0.95 0.95 Overall 0.86 0.85
Table 24. Classification Consistency by Grade/Grade Band
SUBJECT ACHIEVEMENT LEVEL GRADE 3 GRADE 4 GRADE 5 GRADE 6 GRADE 7 GRADE 8 GRADE 11
ELA
Level 2 0.85 0.87 0.84 0.83 0.85 0.83 0.83 Level 3 0.89 0.9 0.84 0.9 0.87 0.87 0.88 Level 4 0.94 0.97 0.96 0.95 0.94 0.93 0.95 Overall 0.7 0.76 0.65 0.69 0.7 0.65 0.69
Math
Level 2 0.81 0.83 0.82 0.77 0.82 0.81 0.82 Level 3 0.83 0.81 0.78 0.84 0.79 0.81 0.8 Level 4 0.96 0.92 0.96 0.93 0.95 0.91 0.92 Overall 0.65 0.61 0.59 0.59 0.6 0.59 0.59
Elementary Middle High
Science
Level 2 0.98 0.96 0.93
Level 3 0.91 0.9 0.9
Level 4 0.86 0.88 0.9
Overall 0.76 0.75 0.75
Social Studies
Level 2 0.98 0.98 Level 3 0.89 0.88 Level 4 0.93 0.93 Overall 0.8 0.79
9.3 Second-Rater Analysis
The fidelity of administration and scoring is monitored by comparing scores from TAs and second raters. The level of consistency of the two sets of scores reflects the extent to which the reliability of TA scoring is.
Second raters can be other TAs, administrators, special education coordinators, or other qualified staff. Paraprofessionals, community volunteers, and parents cannot serve as second raters.
9.3.1 Roles and Responsibilities of Second Raters
The second rater sampling plan for SC-Alt Science/Biology and Scoial Studies is to sample 10% of students in one subject test each year. The sampling rate is sufficient to have enough samples for the reliable analysis results for the subject of a particular year. Since most test administrators administer all subject areas to students and the scoring rubric for all subject tests focuses on item
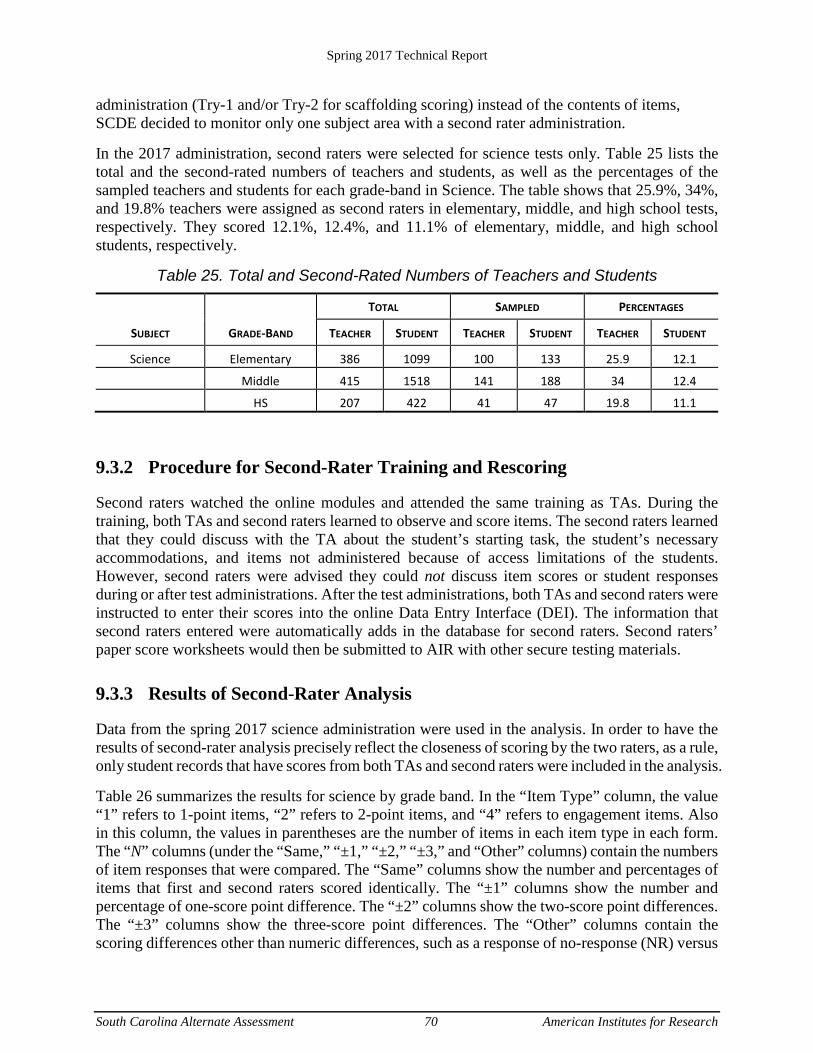
Spring 2017 Technical Report
South Carolina Alternate Assessment 70 American Institutes for Research
administration (Try-1 and/or Try-2 for scaffolding scoring) instead of the contents of items, SCDE decided to monitor only one subject area with a second rater administration.
In the 2017 administration, second raters were selected for science tests only. Table 25 lists the total and the second-rated numbers of teachers and students, as well as the percentages of the sampled teachers and students for each grade-band in Science. The table shows that 25.9%, 34%, and 19.8% teachers were assigned as second raters in elementary, middle, and high school tests, respectively. They scored 12.1%, 12.4%, and 11.1% of elementary, middle, and high school students, respectively.
Table 25. Total and Second-Rated Numbers of Teachers and Students
SUBJECT GRADE-BAND
TOTAL SAMPLED PERCENTAGES
TEACHER STUDENT TEACHER STUDENT TEACHER STUDENT
Science Elementary 386 1099 100 133 25.9 12.1
Middle 415 1518 141 188 34 12.4
HS 207 422 41 47 19.8 11.1
9.3.2 Procedure for Second-Rater Training and Rescoring
Second raters watched the online modules and attended the same training as TAs. During the training, both TAs and second raters learned to observe and score items. The second raters learned that they could discuss with the TA about the student’s starting task, the student’s necessary accommodations, and items not administered because of access limitations of the students. However, second raters were advised they could not discuss item scores or student responses during or after test administrations. After the test administrations, both TAs and second raters were instructed to enter their scores into the online Data Entry Interface (DEI). The information that second raters entered were automatically adds in the database for second raters. Second raters’ paper score worksheets would then be submitted to AIR with other secure testing materials.
9.3.3 Results of Second-Rater Analysis
Data from the spring 2017 science administration were used in the analysis. In order to have the results of second-rater analysis precisely reflect the closeness of scoring by the two raters, as a rule, only student records that have scores from both TAs and second raters were included in the analysis.
Table 26 summarizes the results for science by grade band. In the “Item Type” column, the value “1” refers to 1-point items, “2” refers to 2-point items, and “4” refers to engagement items. Also in this column, the values in parentheses are the number of items in each item type in each form. The “N” columns (under the “Same,” “±1,” “±2,” “±3,” and “Other” columns) contain the numbers of item responses that were compared. The “Same” columns show the number and percentages of items that first and second raters scored identically. The “±1” columns show the number and percentage of one-score point difference. The “±2” columns show the two-score point differences. The “±3” columns show the three-score point differences. The “Other” columns contain the scoring differences other than numeric differences, such as a response of no-response (NR) versus
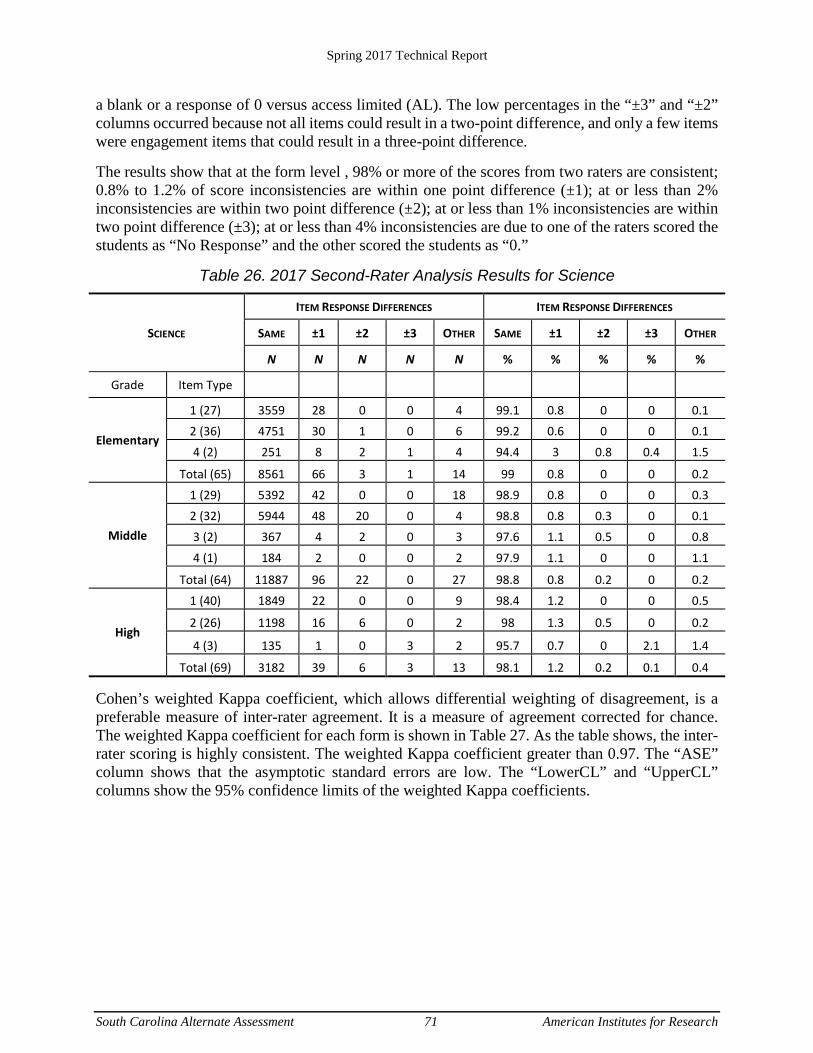
Spring 2017 Technical Report
South Carolina Alternate Assessment 71 American Institutes for Research
a blank or a response of 0 versus access limited (AL). The low percentages in the “±3” and “±2” columns occurred because not all items could result in a two-point difference, and only a few items were engagement items that could result in a three-point difference.
The results show that at the form level , 98% or more of the scores from two raters are consistent; 0.8% to 1.2% of score inconsistencies are within one point difference (±1); at or less than 2% inconsistencies are within two point difference (±2); at or less than 1% inconsistencies are within two point difference (±3); at or less than 4% inconsistencies are due to one of the raters scored the students as “No Response” and the other scored the students as “0.”
Table 26. 2017 Second-Rater Analysis Results for Science
SCIENCE
ITEM RESPONSE DIFFERENCES ITEM RESPONSE DIFFERENCES
SAME ±1 ±2 ±3 OTHER SAME ±1 ±2 ±3 OTHER
N N N N N % % % % %
Grade Item Type
Elementary
1 (27) 3559 28 0 0 4 99.1 0.8 0 0 0.1 2 (36) 4751 30 1 0 6 99.2 0.6 0 0 0.1 4 (2) 251 8 2 1 4 94.4 3 0.8 0.4 1.5
Total (65) 8561 66 3 1 14 99 0.8 0 0 0.2
Middle
1 (29) 5392 42 0 0 18 98.9 0.8 0 0 0.3 2 (32) 5944 48 20 0 4 98.8 0.8 0.3 0 0.1 3 (2) 367 4 2 0 3 97.6 1.1 0.5 0 0.8
4 (1) 184 2 0 0 2 97.9 1.1 0 0 1.1
Total (64) 11887 96 22 0 27 98.8 0.8 0.2 0 0.2
High
1 (40) 1849 22 0 0 9 98.4 1.2 0 0 0.5
2 (26) 1198 16 6 0 2 98 1.3 0.5 0 0.2
4 (3) 135 1 0 3 2 95.7 0.7 0 2.1 1.4
Total (69) 3182 39 6 3 13 98.1 1.2 0.2 0.1 0.4
Cohen’s weighted Kappa coefficient, which allows differential weighting of disagreement, is a preferable measure of inter-rater agreement. It is a measure of agreement corrected for chance. The weighted Kappa coefficient for each form is shown in Table 27. As the table shows, the inter-rater scoring is highly consistent. The weighted Kappa coefficient greater than 0.97. The “ASE” column shows that the asymptotic standard errors are low. The “LowerCL” and “UpperCL” columns show the 95% confidence limits of the weighted Kappa coefficients.
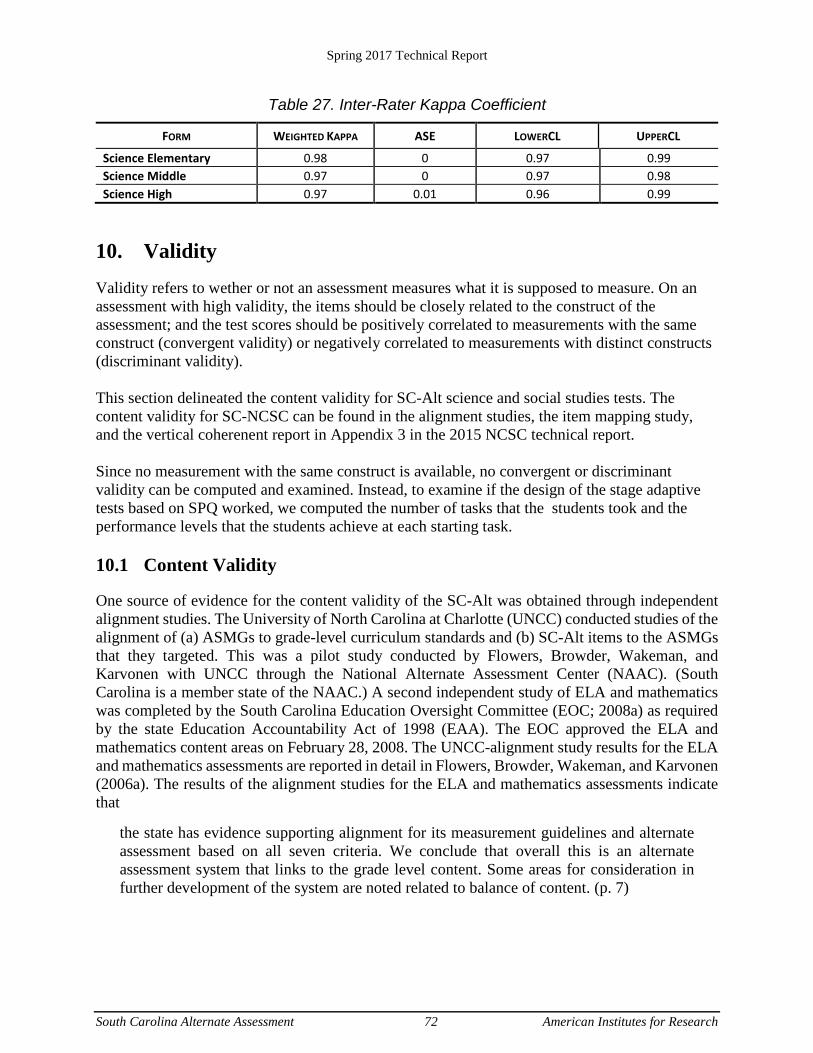
Spring 2017 Technical Report
South Carolina Alternate Assessment 72 American Institutes for Research
Table 27. Inter-Rater Kappa Coefficient
FORM WEIGHTED KAPPA ASE LOWERCL UPPERCL
Science Elementary 0.98 0 0.97 0.99 Science Middle 0.97 0 0.97 0.98 Science High 0.97 0.01 0.96 0.99
10. Validity Validity refers to wether or not an assessment measures what it is supposed to measure. On an assessment with high validity, the items should be closely related to the construct of the assessment; and the test scores should be positively correlated to measurements with the same construct (convergent validity) or negatively correlated to measurements with distinct constructs (discriminant validity). This section delineated the content validity for SC-Alt science and social studies tests. The content validity for SC-NCSC can be found in the alignment studies, the item mapping study, and the vertical coherenent report in Appendix 3 in the 2015 NCSC technical report. Since no measurement with the same construct is available, no convergent or discriminant validity can be computed and examined. Instead, to examine if the design of the stage adaptive tests based on SPQ worked, we computed the number of tasks that the students took and the performance levels that the students achieve at each starting task. 10.1 Content Validity
One source of evidence for the content validity of the SC-Alt was obtained through independent alignment studies. The University of North Carolina at Charlotte (UNCC) conducted studies of the alignment of (a) ASMGs to grade-level curriculum standards and (b) SC-Alt items to the ASMGs that they targeted. This was a pilot study conducted by Flowers, Browder, Wakeman, and Karvonen with UNCC through the National Alternate Assessment Center (NAAC). (South Carolina is a member state of the NAAC.) A second independent study of ELA and mathematics was completed by the South Carolina Education Oversight Committee (EOC; 2008a) as required by the state Education Accountability Act of 1998 (EAA). The EOC approved the ELA and mathematics content areas on February 28, 2008. The UNCC-alignment study results for the ELA and mathematics assessments are reported in detail in Flowers, Browder, Wakeman, and Karvonen (2006a). The results of the alignment studies for the ELA and mathematics assessments indicate that
the state has evidence supporting alignment for its measurement guidelines and alternate assessment based on all seven criteria. We conclude that overall this is an alternate assessment system that links to the grade level content. Some areas for consideration in further development of the system are noted related to balance of content. (p. 7)
Spring 2017 Technical Report
South Carolina Alternate Assessment 73 American Institutes for Research
The alignment study results for the science assessment are reported in detail in Flowers, Browder, Wakeman, and Karvonen (2006b) and in an addendum dated December 21, 2007. The results of the alignment study for the science assessment indicate that
the strength of the South Carolina science Alternate Assessment was that nearly all of the content was academic science content (98%). This is especially notable given that the alternate assessment tasks included items accessible to students at all symbolic levels.
SCDE reviewed the initial science alignment study and determined that one source of some misalignment had resulted from the linking of some items to multiple standards and indicators in the alignment document provided by SCDE. During the Science Content Review Committee meeting, some members recommended adding additional indicators to align to some items. The intent of these recommendations focused more on instruction and demonstrating that instruction could include multiple standards and indicators. However, the alignment study team considered only the first two standards aligned to each item. In some cases, the first two standards were not necessarily the most appropriate. SCDE prioritized the standards and indicators and resubmitted the documentation for an additional study. From this review, completed December 21, 2007 (Flowers, Browder, Wakeman, & Karvonen, 2007), 163 of 173 items were rated as academic. Of the 10 items listed as nonacademic, 6 were rated as foundational (p. 1). SCDE is currently addressing the items that were rated as having no content centrality by developing replacement items for new forms.
The design of the SC-Alt was envisioned as a single assessment across grade levels. This design changed to a grade-band assessment following the study; however, the information provided from the alignment study was used to identify items with alignment difficulty, and these items were omitted from the operational grade-band test forms. Information from the review along with teacher comments was also used during item data review as part of the decision-making process regarding inclusion of items in the assessment.
A second independent review of the alignment of the science assessment was conducted by the Education Oversight Committee (EOC; 2008b). The EOC approved the elementary and middle school science alternate assessment on August 12, 2008. The EOC alignment findings were based on the review of two sets of studies of the SC-Alt:
• Studies of the alignment between the SC-Alt science assessment and the state academic standards conducted by University of North Carolina-Charlotte and Western Carolina University professors of curriculum and special education, in cooperation with the South Carolina State Department of Education (SCDE) and the National Alternate Assessment Center (Flowers, Browder, Wakeman, & Karvonen, 2006a, 2006b, 2007)
• A technical review of the task and item data from the 2007 test administration conducted by a professor of educational research and assessment at the University of South Carolina
Copies of the reports of the EOC reviews and findings are available in their entirety from the SCDE. Based on this review, the EOC identified a number of strengths of the SC-Alt science assessment that were noted in the final report:

Spring 2017 Technical Report
South Carolina Alternate Assessment 74 American Institutes for Research
• The assessment provides accountability and information for instructional improvement for students with significant cognitive disabilities who would not otherwise be assessed in the state testing programs, even with test accommodations and modifications.
• The assessment is intended to be aligned with the same grade-level academic standards as for all students, although at levels of complexity appropriate for the diversity of cognitive functioning observed among students with significant cognitive disabilities.
• The assessment format allows each student to respond to the items using the communication modes the student uses during instruction, such as oral response, pointing, eye gaze, a response card, sign language, or an augmentative communication device.
• The procedures for placing the student at the appropriate level for beginning each assessment reduces student fatigue and maximizes the student’s opportunities to show his or her highest performance;
• The items in the assessment have a wide range of difficulty, and the test is moderately able to discriminate between high and low levels of performance.
The EOC report noted that while 96% of the items were found to be aligned to science inquiry standard indicators, the alignment of the items to content standards was 78%, falling short of an expectation for successful alignment of 90% set by the original evaluators. The EOC recommended that the SCDE review the alignment of the SC-Alt science items to the grade-level standards and identify items needing revision or replacement.
The SCDE and its contractor, AIR, reviewed the alignment and the ASMGs and established priorities for development of tasks to fill identified gaps. During 2008, SCDE and AIR developed five new tasks consisting of 32 items to be used to replace poorly aligned items and improve content coverage in science. Three tasks were developed for the elementary science form, and two tasks were developed for the middle school form based on the findings of the alignment study. The high school physical science test was replaced by a high school biology assessment in spring 2010.
An independent review of the alignment of the new items by the Center for Research on Education (2009a) found that 98% of the new items were aligned to grade-level content standard indicators. Copies of the report of the alignment reviews and findings are available in their entirety from the SCDE.
A follow-up alignment study of biology field-test items was conducted by the Center for Research on Education in October 2009, using the same procedures that were used for the elementary and middle school alignment studies in December 2006 and January 2007. Almost all (94% to 96%) of the items were rated as academic. This percentage exceeds the value typically found in alternate assessments (90%) according to the reviewers. The alignment study results are reported in detail in High School Alternate Assessment Alignment Report to the South Carolina State Department of Education (Center for Research on Education, 2009b).
10.2 Start-Stop Analysis
Data from the 2017 SC-Alt science and social studies were analyzed to address two questions concerning SC-Alt administration procedures and student performance:
Spring 2017 Technical Report
South Carolina Alternate Assessment 75 American Institutes for Research
1. How many tasks and items were administered to students who were started in the assessment at each of the three start points?
2. What was the achievement level performance of students who were started in the assessment at each of the three start points?
To address these questions, the task start point was identified for each student assessed by the 2017 administration of the SC-Alt for all content areas and grade-band forms. According to each task start point, the number of tasks administered and the achievement-level distribution were calculated and summarized.
10.2.1 Number of Tasks Administered by Starting Task
For SC-Alt science/biology, and social studies, the minimum number of overall tasks to be administered is six tasks. The actual number of tasks administered to students are presented in Table 28 and Table 29.
In general, most students were administered at least the minimum number of tasks; the distribution of actual tasks administered often exceeded the minimum required when students were started at Task 1 or Task 3. Across forms, 31%-54% of students were administered seven or more tasks when started at Task 1 when the requirement was six tasks; 23%-86% of students were administered eight or more tasks when started at Task 3 when the requirement was seven tasks. Generally, fewer than 1% of students across forms and subjects were not administered the minimum number of tasks required.
Students who started at Task 1 were administered between 7.1 and 8.0 tasks on average, and their median number of administered tasks ranged between 6 and 7; students who started at Task 3 were administered between 7.6 and 8.2 tasks on average, with a median number of administered tasks between 8 and 10. These data indicate that, for both these groups of students, the tendency was to administer more than the minimum number of tasks needed. Students who started at Task 6 were administered all seven tasks available at the high-complexity level.
These results show that a large majority of the students assessed during the 2017 spring SC-Alt science and social studies administration were administered at least the minimum number of tasks, and in many instances the test administrators exposed the students to additional, more complex, and more difficult tasks beyond the minimal administration requirements.
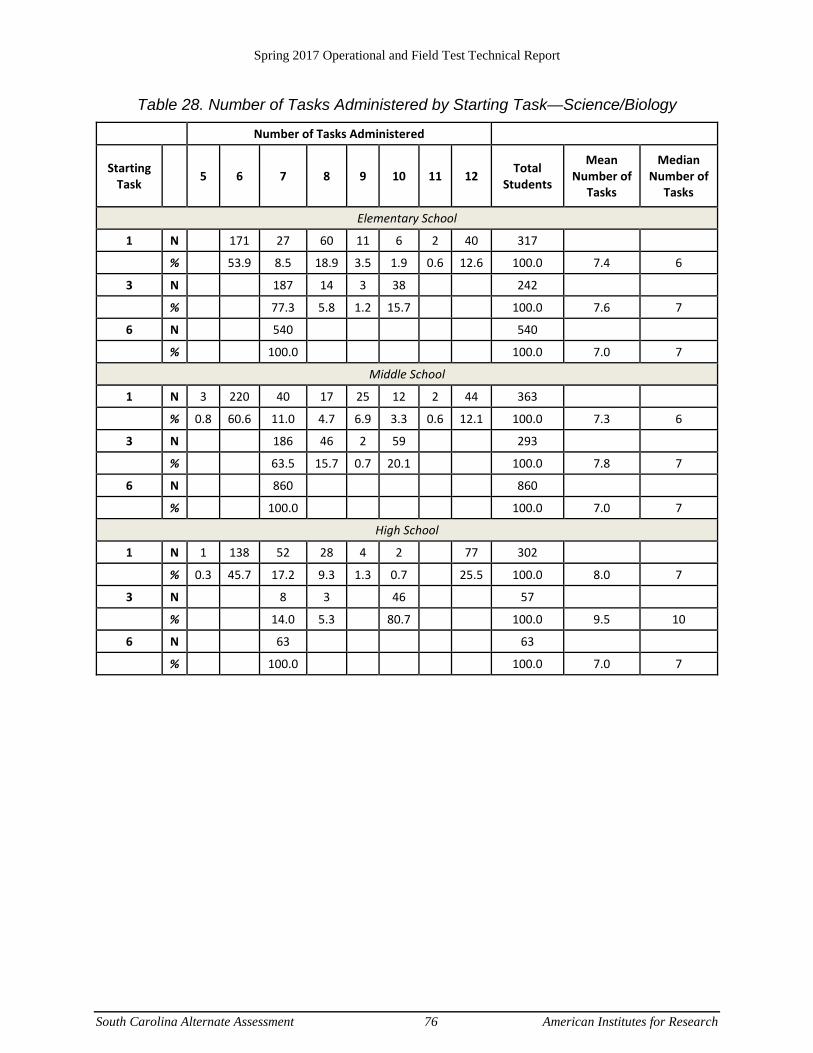
Spring 2017 Operational and Field Test Technical Report
South Carolina Alternate Assessment 76 American Institutes for Research
Table 28. Number of Tasks Administered by Starting Task—Science/Biology
Number of Tasks Administered
Starting Task 5 6 7 8 9 10 11 12 Total
Students
Mean Number of
Tasks
Median Number of
Tasks
Elementary School
1 N 171 27 60 11 6 2 40 317 % 53.9 8.5 18.9 3.5 1.9 0.6 12.6 100.0 7.4 6
3 N 187 14 3 38 242 % 77.3 5.8 1.2 15.7 100.0 7.6 7
6 N 540 540 % 100.0 100.0 7.0 7
Middle School
1 N 3 220 40 17 25 12 2 44 363 % 0.8 60.6 11.0 4.7 6.9 3.3 0.6 12.1 100.0 7.3 6
3 N 186 46 2 59 293 % 63.5 15.7 0.7 20.1 100.0 7.8 7
6 N 860 860 % 100.0 100.0 7.0 7
High School
1 N 1 138 52 28 4 2 77 302 % 0.3 45.7 17.2 9.3 1.3 0.7 25.5 100.0 8.0 7
3 N 8 3 46 57 % 14.0 5.3 80.7 100.0 9.5 10
6 N 63 63 % 100.0 100.0 7.0 7
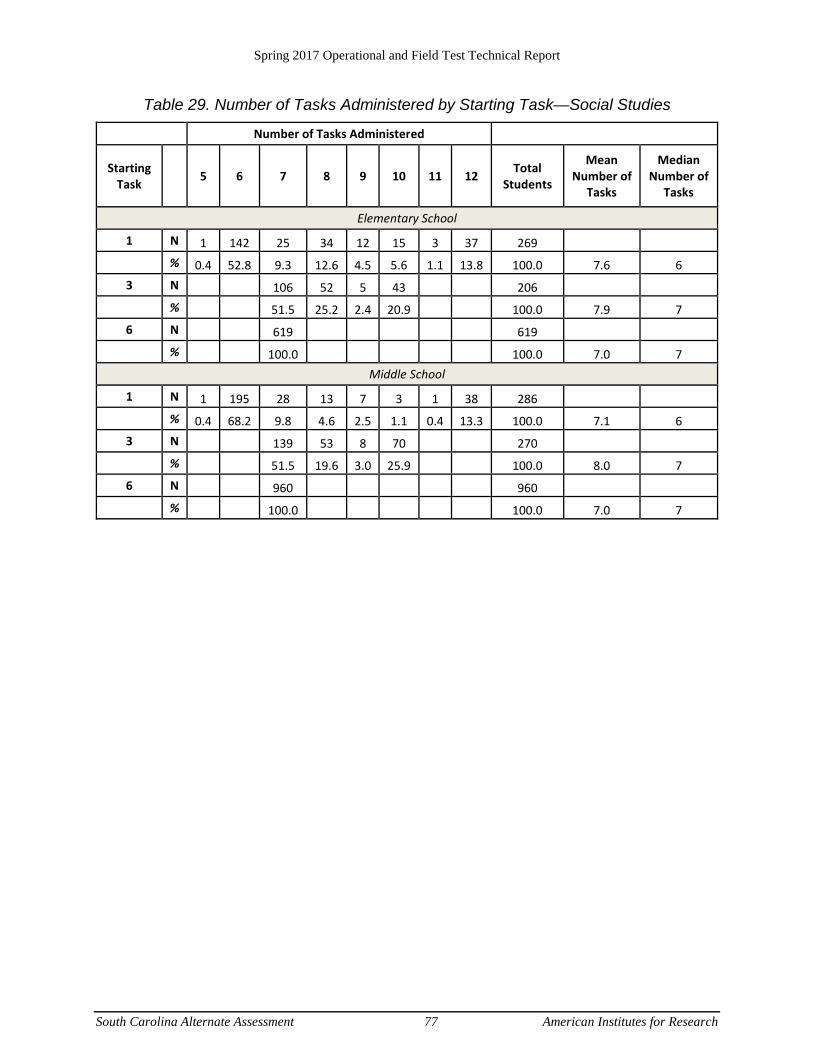
Spring 2017 Operational and Field Test Technical Report
South Carolina Alternate Assessment 77 American Institutes for Research
Table 29. Number of Tasks Administered by Starting Task—Social Studies
Number of Tasks Administered
Starting Task 5 6 7 8 9 10 11 12 Total
Students
Mean Number of
Tasks
Median Number of
Tasks
Elementary School
1 N 1 142 25 34 12 15 3 37 269 % 0.4 52.8 9.3 12.6 4.5 5.6 1.1 13.8 100.0 7.6 6
3 N 106 52 5 43 206 % 51.5 25.2 2.4 20.9 100.0 7.9 7
6 N 619 619 % 100.0 100.0 7.0 7
Middle School
1 N 1 195 28 13 7 3 1 38 286 % 0.4 68.2 9.8 4.6 2.5 1.1 0.4 13.3 100.0 7.1 6
3 N 139 53 8 70 270 % 51.5 19.6 3.0 25.9 100.0 8.0 7
6 N 960 960 % 100.0 100.0 7.0 7
Spring 2017 Operational and Field Test Technical Report
South Carolina Alternate Assessment 78 American Institutes for Research
10.2.2 Achievement Level of Students by Starting Task
Although tasks in SC-Alt are ordered on the form based on student communication levels and average content complexity, items of both lower and higher complexity may appear in each task. This configuration presents items and tasks across the entire assessment providing students with opportunities to demonstrate proficiency. Each student’s proficiency and resulting achievement level are determined by the student’s performance on the specific group of tasks or items the student was administered. The distribution of achievement levels for students according to start task, form level, and content area is presented in Table 30.
The table entries demonstrate interesting operational aspects of the leveled structure of the SC-Alt. Across content areas, students beginning the assessment at Task 1 are categorized as proficient (achievement Levels 3 and 4) at rates between 9% and 45%, with the lowest and highest percentage in elementary school (9%–45%), and the less varied in middle school (14%–22%) and high school 42%). For students starting at Task 3, 36% to 89% of students across content areas are categorized as proficient; unlike students beginning with Task 1, large variation in proficiency rates is found among students starting at Task 3: 36%–89% proficient in elementary school, 39%–60% in middle school and 86% in high school. Finally, 82% to 99% of students starting at Task 6 tested as proficient. The result shows that the proficient rates increased when the starting task goes from 1 to 3, which indicates that the stage adaptive worked.
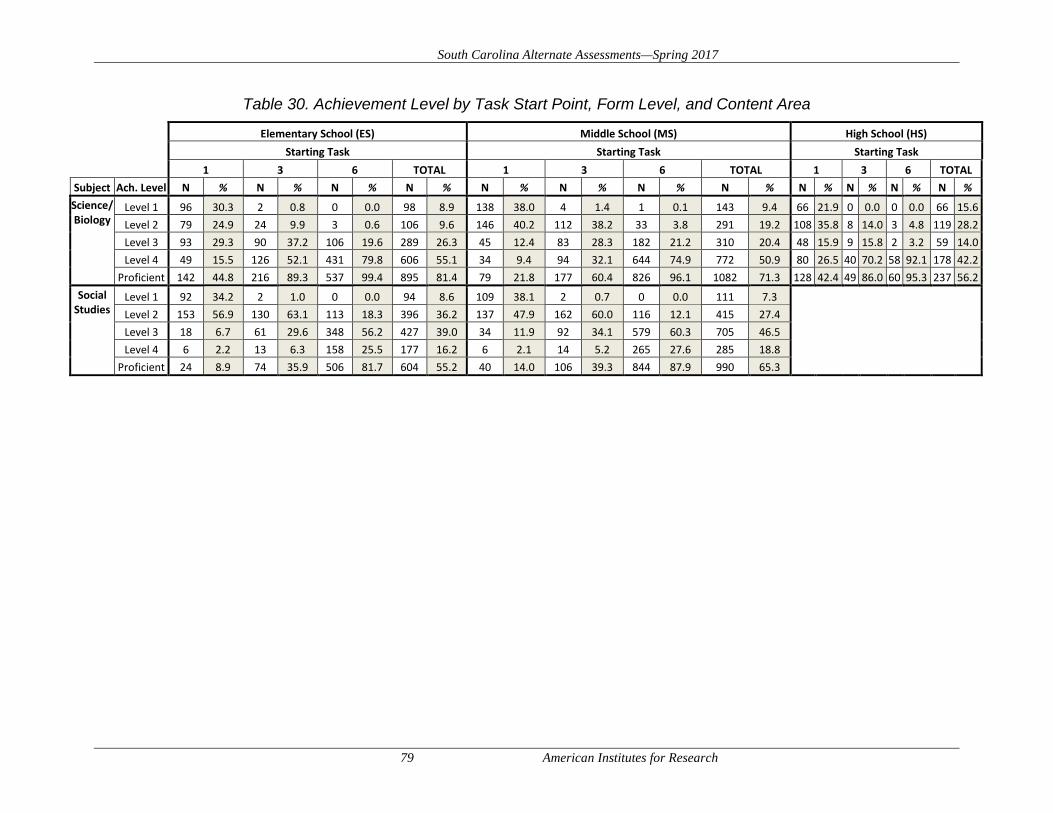
South Carolina Alternate Assessments—Spring 2017
79 American Institutes for Research
Table 30. Achievement Level by Task Start Point, Form Level, and Content Area
Elementary School (ES) Middle School (MS) High School (HS)
Starting Task Starting Task Starting Task 1 3 6 TOTAL 1 3 6 TOTAL 1 3 6 TOTAL
Subject Ach. Level N % N % N % N % N % N % N % N % N % N % N % N % Science/ Biology
Level 1 96 30.3 2 0.8 0 0.0 98 8.9 138 38.0 4 1.4 1 0.1 143 9.4 66 21.9 0 0.0 0 0.0 66 15.6 Level 2 79 24.9 24 9.9 3 0.6 106 9.6 146 40.2 112 38.2 33 3.8 291 19.2 108 35.8 8 14.0 3 4.8 119 28.2 Level 3 93 29.3 90 37.2 106 19.6 289 26.3 45 12.4 83 28.3 182 21.2 310 20.4 48 15.9 9 15.8 2 3.2 59 14.0 Level 4 49 15.5 126 52.1 431 79.8 606 55.1 34 9.4 94 32.1 644 74.9 772 50.9 80 26.5 40 70.2 58 92.1 178 42.2
Proficient 142 44.8 216 89.3 537 99.4 895 81.4 79 21.8 177 60.4 826 96.1 1082 71.3 128 42.4 49 86.0 60 95.3 237 56.2 Social
Studies Level 1 92 34.2 2 1.0 0 0.0 94 8.6 109 38.1 2 0.7 0 0.0 111 7.3
Level 2 153 56.9 130 63.1 113 18.3 396 36.2 137 47.9 162 60.0 116 12.1 415 27.4
Level 3 18 6.7 61 29.6 348 56.2 427 39.0 34 11.9 92 34.1 579 60.3 705 46.5
Level 4 6 2.2 13 6.3 158 25.5 177 16.2 6 2.1 14 5.2 265 27.6 285 18.8
Proficient 24 8.9 74 35.9 506 81.7 604 55.2 40 14.0 106 39.3 844 87.9 990 65.3
South Carolina Alternate Assessments—Spring 2017
80 American Institutes for Research
REFERENCES
American Educational Research Association (2014). Standards for Educational and Psychological Testing. Washington, DC: Author.
American Institutes for Research. (2007). South Carolina Alterntae Assessment Spring 2007 Standard Technical Report for ELA, Mathematics, Science, and Social Studies. Washington, DC: Author.
American Institutes for Research. (2010). South Carolina Alterntae Assessment Spring 2007 Standard Technical Report for Biology. Washington, DC: Author.
American Institutes for Research, & Cohen, J. (2003). AM statistical software. Washington, DC: Author.
Annotated Assessments Peer Review Guidance (2015). U.S. Department of Education
Browder, D. M., Wakeman, S.Y., Flowers, C., Rickelman, R., Pugalee, D., Karvonen, M. (2007). Creating access to the general curriculum with links to grade level content for students with significant cognitive disabilities: An explication of the concept. The Journal of Special Education, 41, 2–16.
Cox, N. R. (1974) Estimation of the correlation between a continuous and a discrete variable. Biometrics, 30, 171-178.
Dorans, N., & Kulick, E. (1986). Demonstrating the utility of the standardization approach to assessing unexpected differential item performance on the Scholastic Aptitude Test. Journal of Educational Measurement, 23, 355–368.
Holland, P. W., & Thayer, D. T. (1988). Differential item performance and the Mantel-Haenszel Procedure. In H. Wainer & H. I. Braun (Eds.), Test validity. Hillsdale, NJ: Lawrence Erlbaum.
Holmes, S. E. (1982). Unidimensionality and vertical equating with the Rasch model. Journal of Educational Measurement, 19(2), 139–147.
Jodoin, M. G., Keller, L. A., & Swaminathan, H. (2003). A comparison of linear, fixed common item, and concurrent parameter estimation equating procedures in capturing academic growth. Journal of Experimental Psychology, 71(3), 229.
Karkee, T., Lewis, D. M., Hoskens, M., Yao, L., & Haug, C. (2003). Separate versus concurrent calibration methods in vertical scaling. Paper presented at the annual meeting of the National Council on Measurement in Education, Chicago, IL.
Kolen, M. J., & Brennan, R. L. (1995). Test equating: Methods and practices. New York: Springer.
Linacre, J. M. (2010). A user’s guide to WINSTEPS. Chicago: Author.
Masters, G. N. (1982). A Rasch model for partial credit scoring. Psychometrika, 47(2), 149–173.

South Carolina Alternate Assessments—Spring 2017
81 American Institutes for Research
Mitzel, H. C., Lewis, D. M., Patz, R. J., & Green, D. R. (2001). The Bookmark procedure: Psychological perspectives. In G. Cizek (Ed.), Setting performance standards (pp. 249–282). Mahwah, NJ: Lawrence Erlbaum.
National Center and State Collaborative (NCSC). NCSC 2015 Technical Report. http://www.ncscpartners.org/Media/Default/PDFs/Resources/NCSC15_NCSC_TechnicalManualNarrative.pdf.
Petersen, N. S., Kolen, M. J., & Hoover, H. D. (1989). Scaling, norming and equating. In R. L. Linn (Ed.), Educational measurement (3rd ed., pp. 221–262). New York: American Council on Education and Macmillan.
Reynolds, C. and Fletcher-Janzen, E. (2007). Encyclopedia of Special Education (Volume 3): A Reference for the Education of Children, Adolescents, and Adults with Disabilities and other Exceptional Individuals. Hoboken, New Jersey: John Wiley & Sons, Inc.
Rudner, L. M. (2005). Expected Classification Accuracy. Practical Assessment Research & Evaluation, 10(13).
Sireci, S. G., Thissen, D., & Wainer, H. (1991). On the reliability of testlet-based tests. Journal of Educational Measurement, 28(3), 234–247.
U.S. Department of Education (2004). Standards and assessments peer review guidance. Retrieved from http://www2.ed.gov/policy/elsec/guid/saaprguidance.pdf
WINSTEPS Manual. Online at http://www.winsteps.com/winman/index.htm?diagnosingmisfit.htm.
Zwick, R., Donoghue, J. R., & Grima, A. (1993). Assessment of differential item functioning for performance tasks. Journal of Educational Measurement, 30(3), 233–251.
Zwick, R., & Thayer, D. T. (1996). Evaluating the magnitude of differential item functioning in polytomous items. Journal of Educational and Behavioral Statistics, 21(3), 187–201.