south carolina unemployment insurance trust … | p a g e south carolina unemployment insurance...
TRANSCRIPT

1 | P a g e
South Carolina Unemployment Insurance
Trust Fund Annual Assessment FY2013
Executive Summary
For each fiscal year, the South Carolina Department of Employment and Workforce is required
to submit, by October 1st, a report to the General Assembly, the Review Committee, and to the
Governor indicating the amount in the unemployment trust fund and making an assessment of
its funding level in accordance with Section 41-33-45 of the South Carolina Code of Laws.
Current Status
The Trust Fund became insolvent in December 2008 (FY2009). Unemployment benefit outlays
for FY2013 totaled $258,801,120. Revenues generated to fund the unemployment insurance
programs totaled $411,039,535.
As of June 30, 2013 the Unemployment Compensation Trust Fund had a positive adjusted
balance of $328,787,7401 but only with a federal loan of $531,557,413. The trust fund balance
excluding federal advances would be -$202,769,674. The health of the trust fund has improved
dramatically over the past fiscal year. Since April 2011, the state has not had to borrow any
funds from the federal government to make benefit payments. Tax revenues have been
sufficient to allow the state to continue repaying outstanding federal loan and benefit payments
to unemployed individuals as the economy continues to recover.
Future Outlook
Based on current economic conditions, it is projected that approximately $304.6 million in state
UI benefits will be paid in FY2014. Legislative changes made in May 2010 raised the taxable
wage base for CY2011 to the first $10,000 of wages, up from the first $7,000 in CY2010. The
taxable wage base increased to $12,000 for CY2012. The taxable wage base will next increase
in January 2015. The changes to the unemployment insurance tax system also restructured the
method used to determine contributions due. The projection for contributions to be raised in
FY2014 is $494.9 million, which more closely matches the anticipated revenue needs of the
system.
1 Trust fund balance includes cash deposited in the state’s unemployment trust fund, clearing and benefit
payment accounts, advances from the federal government, amounts due and payable as a payment in lieu of contributions by a non-profit organization, and any contributions and interest received by July 31
st,
per SC State Code 41-31-80.

2 | P a g e
Table of Contents
Executive Summary ................................................................................................................... 1
Current Status ............................................................................................................................ 1
Future Outlook ........................................................................................................................... 1
Full Report ................................................................................................................................. 3
Current Unemployment Compensation Fund Status .................................................................. 3
Recent Unemployment Compensation Fund History .................................................................. 3
Overview of Advances ............................................................................................................ 4
Solvency Standards ................................................................................................................... 5
Transparency of Funding (Proviso 83.5) .................................................................................... 7
Tax Collections by Tax Class ..................................................................................................... 7
Unemployment Benefits Paid ..................................................................................................... 9
Unemployment Insurance Improper Payments..........................................................................10
UI Loan Payments ....................................................................................................................11
Trust Fund Balance ...................................................................................................................12
3 | P a g e
South Carolina Unemployment Insurance
Trust Fund Annual Assessment FY2013
Full Report
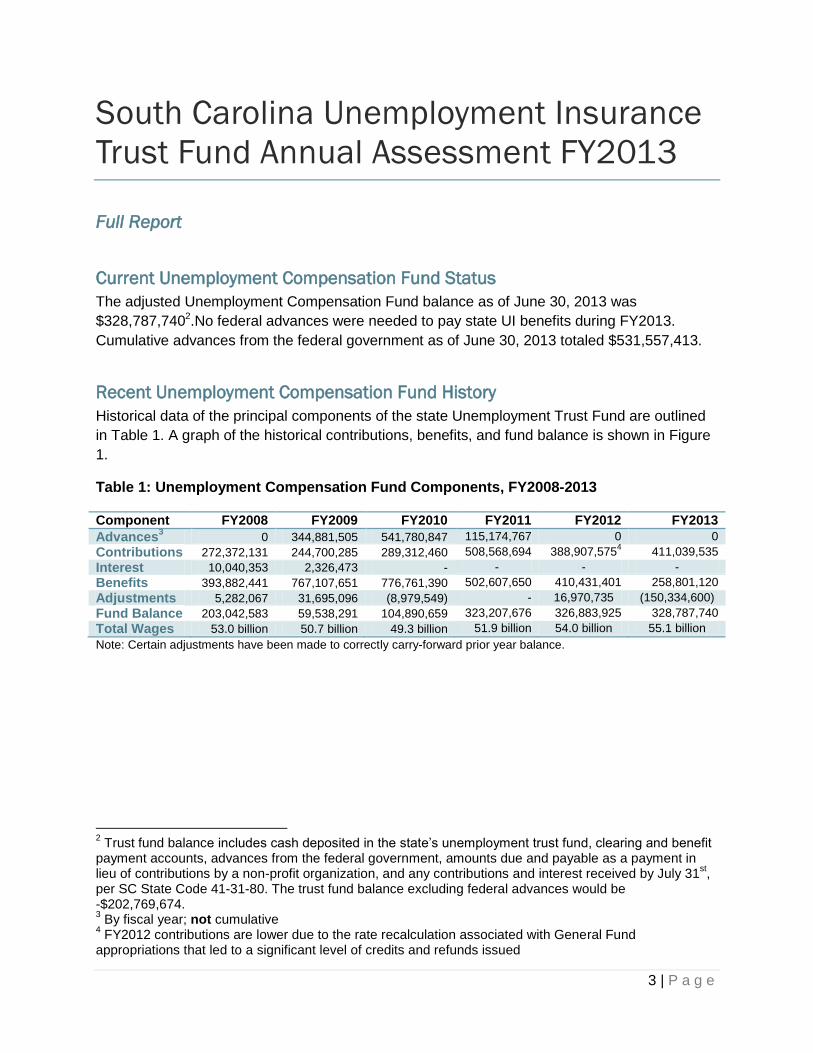
Current Unemployment Compensation Fund Status
The adjusted Unemployment Compensation Fund balance as of June 30, 2013 was
$328,787,7402.No federal advances were needed to pay state UI benefits during FY2013.
Cumulative advances from the federal government as of June 30, 2013 totaled $531,557,413.
Recent Unemployment Compensation Fund History
Historical data of the principal components of the state Unemployment Trust Fund are outlined
in Table 1. A graph of the historical contributions, benefits, and fund balance is shown in Figure
1.
Table 1: Unemployment Compensation Fund Components, FY2008-2013
Component FY2008 FY2009 FY2010 FY2011 FY2012 FY2013
Advances3 0 344,881,505 541,780,847 115,174,767 0 0
Contributions 272,372,131 244,700,285 289,312,460 508,568,694 388,907,5754 411,039,535
Interest 10,040,353 2,326,473 - - - -
Benefits 393,882,441 767,107,651 776,761,390 502,607,650 410,431,401 258,801,120
Adjustments 5,282,067 31,695,096 (8,979,549) - 16,970,735 (150,334,600)
Fund Balance 203,042,583 59,538,291 104,890,659 323,207,676 326,883,925 328,787,740
Total Wages 53.0 billion 50.7 billion 49.3 billion 51.9 billion 54.0 billion 55.1 billion
Note: Certain adjustments have been made to correctly carry-forward prior year balance.
2 Trust fund balance includes cash deposited in the state’s unemployment trust fund, clearing and benefit
payment accounts, advances from the federal government, amounts due and payable as a payment in lieu of contributions by a non-profit organization, and any contributions and interest received by July 31
st,
per SC State Code 41-31-80. The trust fund balance excluding federal advances would be -$202,769,674. 3 By fiscal year; not cumulative
4 FY2012 contributions are lower due to the rate recalculation associated with General Fund
appropriations that led to a significant level of credits and refunds issued
4 | P a g e
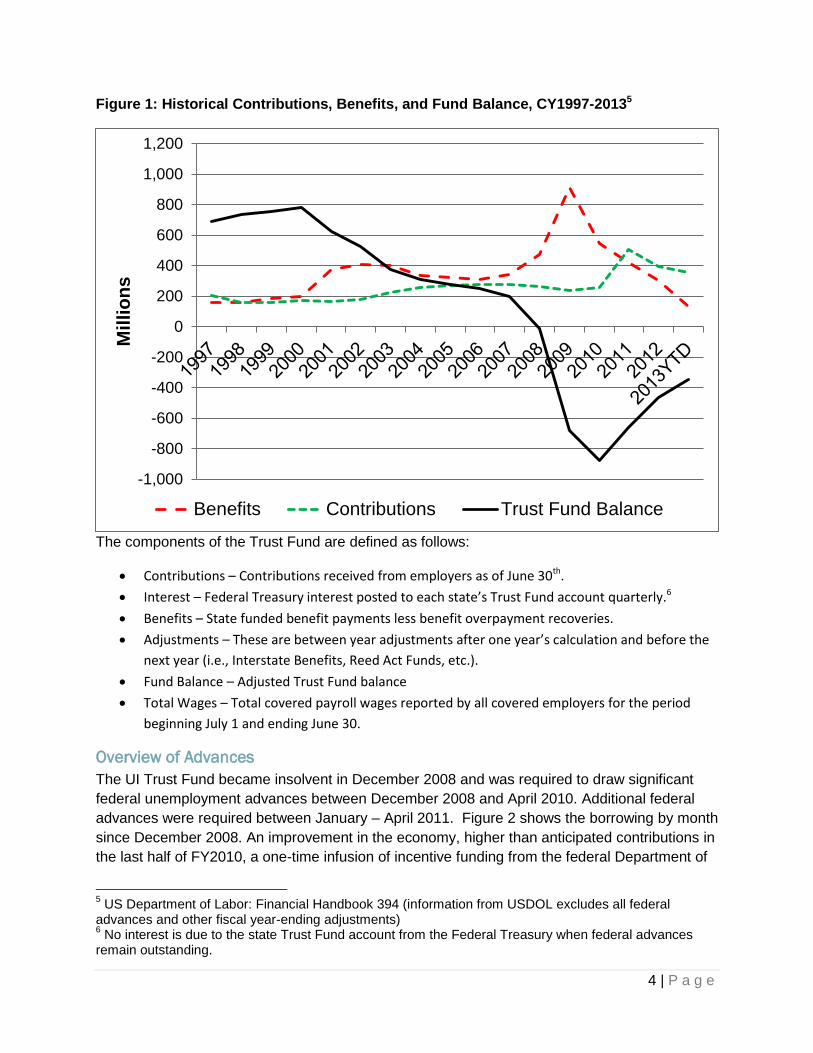
Figure 1: Historical Contributions, Benefits, and Fund Balance, CY1997-20135
The components of the Trust Fund are defined as follows:
Contributions – Contributions received from employers as of June 30th.
Interest – Federal Treasury interest posted to each state’s Trust Fund account quarterly.6
Benefits – State funded benefit payments less benefit overpayment recoveries.
Adjustments – These are between year adjustments after one year’s calculation and before the
next year (i.e., Interstate Benefits, Reed Act Funds, etc.).
Fund Balance – Adjusted Trust Fund balance
Total Wages – Total covered payroll wages reported by all covered employers for the period
beginning July 1 and ending June 30.
Overview of Advances
The UI Trust Fund became insolvent in December 2008 and was required to draw significant
federal unemployment advances between December 2008 and April 2010. Additional federal
advances were required between January – April 2011. Figure 2 shows the borrowing by month
since December 2008. An improvement in the economy, higher than anticipated contributions in
the last half of FY2010, a one-time infusion of incentive funding from the federal Department of
5 US Department of Labor: Financial Handbook 394 (information from USDOL excludes all federal
advances and other fiscal year-ending adjustments) 6 No interest is due to the state Trust Fund account from the Federal Treasury when federal advances
remain outstanding.
-1,000
-800
-600
-400
-200
0
200
400
600
800
1,000
1,200
Mil
lio
ns
Benefits Contributions Trust Fund Balance

5 | P a g e
Labor, and the new tax structure combined to allow the trust fund to reduce borrowing between
April 2010 and April 2011. Since April 2011 no additional funds have been necessary beyond
normal tax contributions to fund the declining benefit payments.
Figure 2: Monthly and Cumulative Advance Balance , December 2008-December 2013
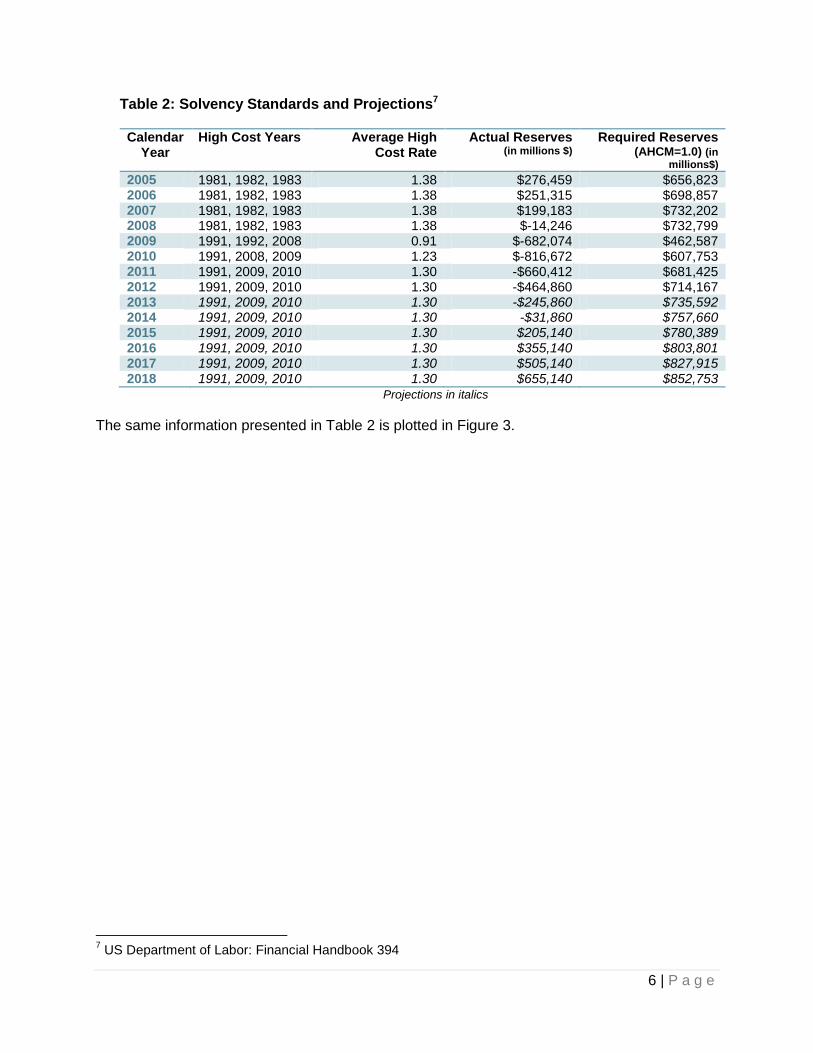
Solvency Standards
The most widely accepted measure of trust fund solvency is known as the Average High Cost
Multiple (AHCM). This measure of whether a state has enough money to cover unemployment
claims during an economic downturn was devised in 1995 by the federal Advisory Council on
Unemployment Compensation. The AHCM is calculated by taking the trust fund balance as a
percent of estimated wages for the most recent 12 months (also known as the reserve ratio) and
dividing it by the Average High Cost Rate, which is the average of the three highest calendar
year benefit cost rates, in the last 20 years or a period including three recessions, whichever is
longer. Benefit cost rates are benefits paid as a percent of total wages in taxable employment.
The Department of Labor recommends that a state have an AHCM of 1.0, which means that the
state has enough funds to pay one year of benefits at the Average High Cost. This should be
sufficient to fund benefits during a moderate recession.
Table 2 shows South Carolina’s three highest benefit cost rate years, the state’s actual (or
projected) reserves as of December 31, and the trust fund balance that would be required to
achieve the recommended solvency level of 1.0.
$0
$200
$400
$600
$800
$1,000
$1,200
$0
$10
$20
$30
$40
$50
$60
$70
$80
$90
$100
De
c-0
8
Ma
r-0
9
Jun-0
9
Sep-0
9
De
c-0
9
Ma
r-1
0
Jun-1
0
Sep-1
0
De
c-1
0
Ma
r-1
1
Jun-1
1
Sep-1
1
De
c-1
1
Ma
r-1
2
Jun-1
2
Sep-1
2
De
c-1
2
Ma
r-1
3
Jun-1
3
Sep-1
3
Millio
ns
Millio
ns
Cumulative Loan Balance Monthly Loan
6 | P a g e
Table 2: Solvency Standards and Projections7
Calendar Year
High Cost Years Average High Cost Rate
Actual Reserves (in millions $)
Required Reserves (AHCM=1.0) (in
millions$)
2005 1981, 1982, 1983 1.38 $276,459 $656,823 2006 1981, 1982, 1983 1.38 $251,315 $698,857 2007 1981, 1982, 1983 1.38 $199,183 $732,202 2008 1981, 1982, 1983 1.38 $-14,246 $732,799 2009 1991, 1992, 2008 0.91 $-682,074 $462,587 2010 1991, 2008, 2009 1.23 $-816,672 $607,753 2011 1991, 2009, 2010 1.30 -$660,412 $681,425 2012 1991, 2009, 2010 1.30 -$464,860 $714,167 2013 1991, 2009, 2010 1.30 -$245,860 $735,592 2014 1991, 2009, 2010 1.30 -$31,860 $757,660 2015 1991, 2009, 2010 1.30 $205,140 $780,389 2016 1991, 2009, 2010 1.30 $355,140 $803,801 2017 1991, 2009, 2010 1.30 $505,140 $827,915 2018 1991, 2009, 2010 1.30 $655,140 $852,753
Projections in italics
The same information presented in Table 2 is plotted in Figure 3.
7 US Department of Labor: Financial Handbook 394

7 | P a g e
Figure 3: Solvency Standards and Projections8
Once the trust fund has regained solvency (projected to be CY2015), trust fund rebuilding will
continue until reserves are sufficient to support an AHCM of 1.0, as recommended by the DOL.
Transparency of Funding (Proviso 83.5)
In accordance with FY2013-14 Appropriations Act Proviso 83.5 this report also provides
information on 1) state unemployment taxes collected by tax class, 2) unemployment benefit
claims paid, 3) number and dollar value of improper unemployment benefits paid, 4) payments
made to the federal government for outstanding unemployment benefit loans, and 5) the
balance in the state’s Unemployment Trust Fund at fiscal year’s end.
Tax Collections by Tax Class
Tax rates are set on a calendar year basis in the late fall of each year. Tax rates for CY2012
were set in October 2011. In July 2012 the General Assembly appropriated additional funds to
8 US Department of Labor: Financial Handbook 394
$251 $199
-$14
-$682
-$816
-$660
-$464
-$245
-$31
$205
$355
$505
$655
-$1,000,000
-$800,000
-$600,000
-$400,000
-$200,000
$0
$200,000
$400,000
$600,000
$800,000
$1,000,000
2006 2007 2008 2009 2010 2011 2012 2013 2014 2015 2016 2017 2018
IMillio
ns
Reserves Adequate Balance (1.0)
Influence of
PROJECTED
8 | P a g e
the South Carolina Department of Employment and Workforce (SCDEW) which resulted in the
issuance of revised tax rates in September 2012.
In CY2012, a total of $488.2 million was collected in the form of state unemployment taxes.
These funds were used to pay unemployment benefits to eligible individuals who were laid off
through no fault of their own, to make required loan repayments to the federal government for
South Carolina’s current outstanding unemployment debt, and to make interest payments on
that outstanding loan balance. In addition to the base tax rate for benefit and loan payments and
the interest surcharge for interest payments, all businesses in the state are also responsible for
paying a 0.06% administrative contingency assessment.
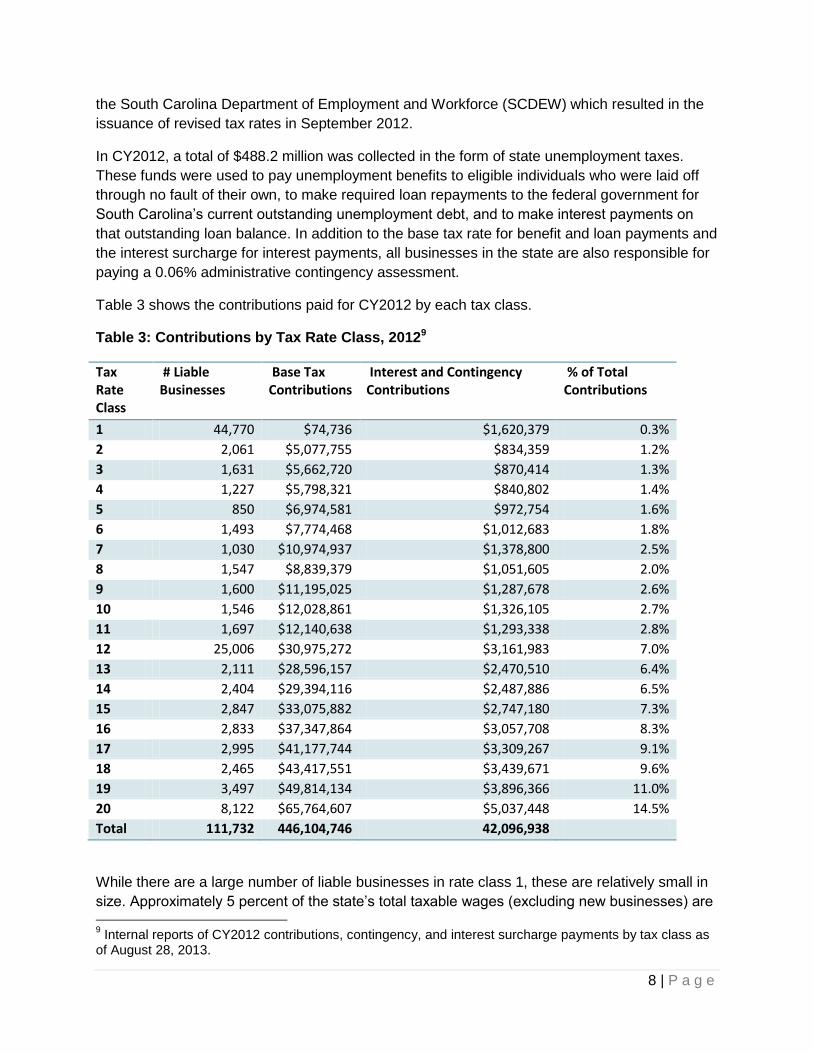
Table 3 shows the contributions paid for CY2012 by each tax class.
Table 3: Contributions by Tax Rate Class, 20129
Tax Rate Class
# Liable Businesses
Base Tax Contributions
Interest and Contingency Contributions
% of Total Contributions
1 44,770 $74,736 $1,620,379 0.3%
2 2,061 $5,077,755 $834,359 1.2%
3 1,631 $5,662,720 $870,414 1.3%
4 1,227 $5,798,321 $840,802 1.4%
5 850 $6,974,581 $972,754 1.6%
6 1,493 $7,774,468 $1,012,683 1.8%
7 1,030 $10,974,937 $1,378,800 2.5%
8 1,547 $8,839,379 $1,051,605 2.0%
9 1,600 $11,195,025 $1,287,678 2.6%
10 1,546 $12,028,861 $1,326,105 2.7%
11 1,697 $12,140,638 $1,293,338 2.8%
12 25,006 $30,975,272 $3,161,983 7.0%
13 2,111 $28,596,157 $2,470,510 6.4%
14 2,404 $29,394,116 $2,487,886 6.5%
15 2,847 $33,075,882 $2,747,180 7.3%
16 2,833 $37,347,864 $3,057,708 8.3%
17 2,995 $41,177,744 $3,309,267 9.1%
18 2,465 $43,417,551 $3,439,671 9.6%
19 3,497 $49,814,134 $3,896,366 11.0%
20 8,122 $65,764,607 $5,037,448 14.5%
Total 111,732 446,104,746 42,096,938
While there are a large number of liable businesses in rate class 1, these are relatively small in
size. Approximately 5 percent of the state’s total taxable wages (excluding new businesses) are
9 Internal reports of CY2012 contributions, contingency, and interest surcharge payments by tax class as
of August 28, 2013.

9 | P a g e
assigned to each category. Businesses with less than 12 months of liability are assigned a new
business tax rate of class 12. That accounts for the large volume of businesses in that category
in Table 3.
Unemployment Benefits Paid
State unemployment taxes fund up to the first 20 weeks of unemployment benefits to individuals
who are out of work. Prior to June 2011, the state taxes funded up to the first 26 weeks. Due to
the reduction in the number of available weeks, continued job growth, economic improvement in
the state, and stricter disqualification penalties being implemented, benefit payments have come
down substantially from their height in 2009.
Figure 4 shows the state-funded benefits paid by month from January 2008 through July 2013.
Monthly benefit payments reached a peak in March 2009 at over $98 million. In the most recent
month available from the United States Department of Labor (DOL), benefit payments had
dropped to slightly over $23 million, a 76.0 percent drop. Benefit payments have leveled off in
recent months as the unemployment rate has remained around the 8 percent mark. Benefits
can be expected to decline as the unemployment rate falls and job growth increases.

10 | P a g e
Figure 4: Monthly State-Funded Unemployment Benefit Payments, Jan 2008 – Jul 201310
Unemployment Insurance Improper Payments
The Benefit Accuracy Measurement (BAM) program is designed to identify the unemployment
insurance program’s processing trends that cause erroneous UI benefit payments or denials.
BAM investigations are a review of the records of a sample group of claims, selected each week
at random, to test the accuracy of UI decisions to issue or deny the payment of UI benefits for a
key week. In conducting a Paid Claims Accuracy investigation, a BAM auditor reviews paid
claims and provides detailed information regarding the rates, types, and causes of improper
payments.
Table 4 provides information on improper payments for South Carolina between the third
quarter 2012 and second quarter 2013 based on a sample size of 480 cases. The majority of
errors identified in the BAM sample that caused the detected overpayment were the result of
Benefit Year Earnings where UI claimants continued to draw benefits after returning to work and
not reporting their earnings to DEW. This accounted for approximately $21.7 million of the
estimated overpayments or about 70.6 percent. DEW has plans to provide additional claimant
educational awareness training on the requirement to report all earnings while filing for benefits.
10
United States Department of Labor, http://workforcesecurity.doleta.gov/unemploy/claimssum.asp
$38.2
$98.6
$23.7
$0
$20
$40
$60
$80
$100
$120
Ja
n-0
8
Apr-
08
Ju
l-0
8
Oct-
08
Ja
n-0
9
Apr-
09
Ju
l-0
9
Oct-
09
Ja
n-1
0
Apr-
10
Ju
l-1
0
Oct-
10
Ja
n-1
1
Apr-
11
Ju
l-1
1
Oct-
11
Ja
n-1
2
Apr-
12
Ju
l-1
2
Oct-
12
Ja
n-1
3
Apr-
13
Ju
l-1
3
Ben
efi
ts P
aid
Month
(mill
ion
s)

11 | P a g e
Table 4: Overpayment Comparison, 2012Q3-2013Q211
Sample Size Annual Report Rate
Est. Dollars Overpaid
South Carolina Benefit Year Earnings Separation Issues Work Search Other Issues
480 11.8% $31 million $21m (70.6%) $4m (14.2%) $1m (2.5%) $5m (12.7%)
UI Loan Payments
Between December 2008 and April 2011, the State of South Carolina borrowed nearly $1 billion
from the federal government to continue funding unemployment benefits. The state
unemployment tax system underwent a dramatic overhaul in 2011 which allowed the state to
cease all borrowing in April 2011. In October 2011, the state made its first voluntary repayment
to the federal government. Figure 2 (page 5) shows the monthly loans taken by DEW as well as
the cumulative loan from 2008 to present.
To date, approximately $546 million has been repaid to the federal government through a
combination of a one-time increase in federal taxes for tax year 2010 and five voluntary
payments made in 2011, 2012, and 2013. Table 5 provides detailed repayment information
made by the state.
11
2012Q3-2013Q2 BAM report prepared by DEW Batch Range 201227 - 201326

12 | P a g e
Table 5: South Carolina UI Loan Payments, April 2011 – August 201312
Date Payment (in millions)
Reason
Apr 2011 $29.8 FUTA Credit Reduction
May 2011 $3.6 FUTA Credit Reduction
Jun 2011 $1.3 FUTA Credit Reduction
Jul 2011 $0.5 FUTA Credit Reduction
Aug 2011 $0.1 FUTA Credit Reduction
Sep 2011 $115.2 Voluntary Payment
Nov 2011 $68.8 Voluntary Payment
Mar 2012 $0.1 FUTA Credit Reduction
Apr 2012 $0.1 FUTA Credit Reduction
May 2012 $0.1 FUTA Credit Reduction
Jun 2012 $0.1 FUTA Credit Reduction
Aug 2012 $106.5 Voluntary Payment
Dec 2012 >$0.1 FUTA Credit Reduction
Mar 2013 >$0.1 FUTA Credit Reduction
May 2013 $144.0 Voluntary Payment
Jun 2013 <$0.1 FUTA Credit Reduction
Aug 2013 <$0.1 FUTA Credit Reduction
Sep 2013 $75.0 Voluntary Payment
TOTAL $545.6
Trust Fund Balance
As of June 30, 2013 there was an unadjusted balance of $210,641,95413 in the state’s
unemployment trust fund held at the US Treasury in Washington DC. This compares favorably
with the trust fund balance at fiscal year-end 2007-2012. As shown in Figure 5, the balance in
the UI Trust Fund declined steadily between June 30, 2002 and June 30, 2011. Not shown is
that this balance includes loans between 2009 and 2012. The trust fund continues to be in a net
negative position given the outstanding loans; however, significant improvement has been
experienced since the tax reforms of 2011.
12
Ibid 13
Account Statement June 2013: http://www.treasurydirect.gov/govt/reports/tfmp/tfmp_utf.htm

13 | P a g e
Figure 5: UI Trust Fund Balance as of June 30th, 2002-2013
$0
$100
$200
$300
$400
$500
$600
$700
2002 2003 2004 2005 2006 2007 2008 2009 2010 2011 2012 2013
Mil
lio
ns