south dakota mercury tmdl - denr · south dakota mercury tmdl page 7 acknowledgements the...
TRANSCRIPT

South Dakota Mercury
Total Maximum Daily Load
SOUTH DAKOTA DEPARTMENT OF
ENVIRONMENT AND NATURAL RESOURCES
December 2015
South Dakota Mercury TMDL Page 2
Contents
Tables .............................................................................................................................................. 4
Figures............................................................................................................................................. 5
Appendices ...................................................................................................................................... 6
Acknowledgements ......................................................................................................................... 7
List of Acronyms ............................................................................................................................ 8
Executive Summary ........................................................................................................................ 9
1.0 Introduction ............................................................................................................................. 13
1.1 Background ......................................................................................................................... 14
1.1.1 Mercury Cycle ............................................................................................................. 15
1.1.2 Atmospheric Mercury Transport and Deposition ........................................................ 17
1.1.3 Global Trends in Mercury Emissions .......................................................................... 18
1.2 Impaired Waters .................................................................................................................. 19
1.3 TMDL Approach for Multiple Waterbodies and Revision Process .................................... 26
2.0 Water Quality Standards ...................................................................................................... 29
3.0 Data Analysis .......................................................................................................................... 33
3.1 Fish Tissue Mercury ........................................................................................................... 33
3.2 Standard Size Predator Fish ................................................................................................ 35
3.3 Principle of Proportionality................................................................................................. 37
3.4 Factors Affecting Methylation Processes in South Dakota ................................................ 38
3.4.1 Selch 2008 .................................................................................................................... 38
3.4.2 McCutcheon 2009 ........................................................................................................ 39
3.4.3 Betemariam 2010 ......................................................................................................... 39
3.4.4 Hayer 2011 ................................................................................................................... 40
3.4.5 Wentz 2014 .................................................................................................................. 41
3.4.6 Methylation Rate Analysis ........................................................................................... 41
4.0 Source Assessment – Point Sources ....................................................................................... 53
4.1 Mining ................................................................................................................................. 53
4.2 Municipal Separate Storm Sewer Systems ......................................................................... 54
4.3 Non Storm Water NPDES Permitted Sources .................................................................... 57
5.0 Source Assessment - Nonpoint ............................................................................................... 59
5.1 Atmospheric Mercury Deposition Monitoring ................................................................... 59

South Dakota Mercury TMDL Page 3
5.1.1 Atmospheric Mercury Deposition Monitoring Methods ............................................. 59
5.1.2 Atmospheric Mercury Deposition Results ................................................................... 62
5.1.3 Atmospheric Mercury Deposition Correlations ........................................................... 64
5.2 REMSAD Modeling Results .............................................................................................. 65
5.3 Emissions Sources .............................................................................................................. 69
5.4 Baseline Year ...................................................................................................................... 70
6.0 Wasteload Allocation (WLA) ................................................................................................. 72
7.0 Load Allocations (LA) ............................................................................................................ 72
8.0 Margin of Safety (MOS) ......................................................................................................... 73
9.0 Critical Conditions and Seasonality ........................................................................................ 74
10.0 Final TMDL Calculations ..................................................................................................... 75
11.0 Reasonable Assurance and Implementation ......................................................................... 77
11.1 Point Sources ................................................................................................................... 78
11.1.1 Dental ......................................................................................................................... 78
11.1.2 POTWs and NPDES Permitted Sources .................................................................... 79
11.1.3 MS4s .......................................................................................................................... 79
11.2 Solid Waste ....................................................................................................................... 79
12.0 Monitoring ............................................................................................................................ 81
12.1 Depositional Monitoring ................................................................................................... 81
12.2 Fish Tissue ........................................................................................................................ 81
12.3 Water Column Monitoring ................................................................................................ 81
13.0 Public Participation ............................................................................................................... 83
Works Cited .................................................................................................................................. 86
Appendices .................................................................................................................................... 91

South Dakota Mercury TMDL Page 4
Tables
Table 1. Estimated average daily intake and retention of total mercury and mercury compounds in the general population (WHO 1990; WHO 1991) ........................................................................................................................... 13
Table 2. Assessment units included as impaired in South Dakota’s 2014 Integrated Report. .................................... 20
Table 3. Waters exceeding the criterion of 0.3 mg/Kg and thus considered impaired for methylmercury but not included as impaired in the 2014 South Dakota Integrated Report. ........................................................................... 24
Table 4. Summary of draft national BAFs and BCF expressed as L/kg for dissolved mercury (USEPA 2001) .............. 30
Table 5. Summary of mercury translators for mercury in water. (USEPA 2001) ........................................................ 31
Table 6. Number of fish samples with methylmercury concentrations above 0.3 mg/Kg 1994-2014 and mean length of population (mm). ..................................................................................................................................................... 34
Table 7. Methylmercury concentration in northern pike and walleye greater than 15 inches (38 cm) collected in South Dakota during 2010-2014. ................................................................................................................................. 35
Table 8. Bitter Lake standard length walleye (WE38) methylmercury concentrations. .............................................. 36
Table 9. Results from Pearson Correlation Analysis comparing mean walleye mercury concentrations with environmental variables from 10 glacial lakes in Eastern South Dakota (Selch 2008). ............................................... 38
Table 10. Results from Hayer’s (2011) combined regression model and watershed-only model. The model parameters include alkalinity(ALK), total dissolved solids(TDS), Trophic State Index (TSI-P), ammonium (AMM), nitrogen to phosphorus ratio(N:P), surface area change (SACH), watershed slope (SLOPE), maximum depth of the lake (DMAX), percent agriculture in the watershed (AG), watershed to surface area ratio (WSSA), percent detritus in lake habitat (DET), and percent silt within lake habitat (SILT). ................................................................................ 40
Table 11. Mean water chemistry differences between non-advisory lakes and advisory lakes, lakes and impoundments (n=59 for walleye fish mercury, n=36 for water quality) . .................................................................. 43
Table 12. Chi-squared independence test between lake type and outcome >0.3 (yes or no). Insignificance indicates independence, i.e., the outcome is independent of lake type. ..................................................................................... 43
Table 13. Pearson correlation coefficients between water quality variables and WE38 (walleye fish tissue mercury). Bolded correlations are significant, p<.05. .................................................................................................................. 45
Table 14. Multiple regression water quality parameters vs. walleye fish tissue mercury. Partial R shows the correlation between parameter and walleye fish tissue mercury controlling for other variables. .............................. 45
Table 15. Pearson correlations between fish tissue mercury (SLP_Hg) and watershed and habitat variables. Bolded correlations are significant, p<.05. .............................................................................................................................. 47
Table 16. Regression results watershed parameters on fish tissue mercury .............................................................. 47
Table 17. MS4 permits and acreages in South Dakota. .............................................................................................. 56
Table 18. List of websites used to acquire precipitation data used with atmospheric samplers. ............................... 61
Table 19. Mean deposition rates for all atmospheric deposition sites 2008-2010. .................................................... 62
Table 20. REMSAD PPTM results: mercury deposition contribution analysis (mercury emissions in tons per year) (USEPA 2008). .............................................................................................................................................................. 66
Table 21. 2011 emissions sources in South Dakota (USEPA 2014). ............................................................................ 69
Table 22. REMSAD modeled sources of mercury. ....................................................................................................... 73
Table 23. TMDL calculations ....................................................................................................................................... 75
Table 24. TMDL allocations ......................................................................................................................................... 76
South Dakota Mercury TMDL Page 5
Table 25. TMDL annual calculation ............................................................................................................................ 76
Figures
Figure 1. The global mercury cycle (USEPA 1997). ...................................................................................................... 15
Figure 2. Diagram illustrating methylation in process under anaerobic conditions. (Betemariam 2010) ................. 16
Figure 3. National total mercury wet deposition for 2009 from the MDN monitoring sites. ...................................... 18
Figure 4. Waters listed as impaired for fish tissue methylmercury in South Dakotas 2014 Integrated Report. Note, Lardy Lake was mapped incorrectly in the 2014 Integrated Report, this error has been corrected in this figure. ...... 21
Figure 5. Waters exceeding the criterion of 0.3 mg/Kg and thus considered impaired for methylmercury but not included as impaired in the 2014 South Dakota Integrated Report. ........................................................................... 25
Figure 6. Boxplot of fish tissue mercury vs waterbody type. (t=-0.5760, p=0.5667) (F=1.7354, p=0.4149)................ 44
Figure 7. Mean Secchi Depth vs. mean walleye fish tissue weighted by lake-year (p=0.0223, R2=0.2914). .............. 46
Figure 8. Standard length fish methylmercury (mg/Kg) compared to water level fluctuations (feet). ....................... 48
Figure 9. WE38 fish tissue mercury concentrations in Bitter Lake plotted against lake elevation. ............................ 49
Figure 10. Individual fish tissue concentrations from Northeast South Dakota (excluding Bitter Lake) and Bitter Lake water surface elevations. ............................................................................................................................................. 50
Figure 11. Wetland cover vs. fish tissue mercury p=0.0004, R2=0.1808. .................................................................... 51
Figure 12. Wetlands within 500m buffer of lakes compared to fish tissue mercury. Regression analysis arc sin square-root transformed wetland cover percentage vs. fish tissue mercury weighted by lake-year (p=0.4767,R2=0.05) ..................................................................................................................................................... 51
Figure 13. Typical construction of a passive bulk mercury atmospheric sampler ....................................................... 59
Figure 14. Mercury sampler located near Beresford, SD at South Dakota State University SE research farm. .......... 60
Figure 15. Atmospheric bulk sampler locations. Sites shown with red stars were funded by NPS, while sites shown with orange stars were funded by South Dakota DENR and EPA. ............................................................................... 60
Figure 16. Isopleth map for the 10 atmospheric mercury monitoring sites for 2008 through 2010. Mean bulk atmospheric mercury deposition displayed in units of [µg/m2/yr]. ............................................................................ 63
Figure 17. Natural log of daily Hg deposition compared to natural log of precipitation all stations except NEF. (Lupo and Stone 2013) ........................................................................................................................................................... 64
Figure 18. South Dakota atmospheric mercury deposition versus the mean mercury concentration top 10 cm of sediment. ..................................................................................................................................................................... 64
Figure 19. REMSAD-simulated Total (Wet and Dry) annual mercury deposition (g km2) for South Dakota (USEPA 2008) ............................................................................................................................................................................ 66
Figure 20. South Dakota deposition analysis for the Single grid cell (Blue Triangle in Figure 19) where in-state sources contributed the most to simulated annual total mercury deposition for 2001 (12.5 g/km
2) (USEPA 2008) .. 67
Figure 21. South Dakota mercury deposition with North American sources summarized (Atkinson 2014) ............... 68
Figure 22. South Dakota mercury deposition with South Dakota sources summarized (Atkinson 2014). .................. 68
Figure 23. Predicted response times for fish tissue mercury concentrations once a reduction is made for mercury atmospheric deposition (Atkeson et al. 2002). ............................................................................................................ 71
Figure 24. Example fish Consumption advisory posting.............................................................................................. 83

South Dakota Mercury TMDL Page 6
Figure 25. Atmospheric mercury deposition for Beresford, SD from September 2008 to October 2010. .................... 92
Figure 26. Atmospheric mercury deposition for Huron, SD from September 2008 to October 2010. .......................... 92
Figure 27. Atmospheric mercury deposition for Antelope Field Station, SD from October 2008 to October 2010. ..... 93
Figure 28. Atmospheric mercury deposition for Wind Cave National Park, SD from October 2008 to November 2010. ..................................................................................................................................................................................... 93
Figure 29. Atmospheric mercury deposition for Badlands National Park, SD from August 2008 to October 2010. .... 94
Figure 30. Atmospheric mercury deposition for Theodore Roosevelt National Park, ND from March 2009 to November 2010. .......................................................................................................................................................... 94
Figure 31. Atmospheric mercury deposition for NE Farm, SD from September 2008 to July 2009. No data collected after July 2009 ............................................................................................................................................................. 95
Figure 32. Atmospheric mercury deposition for Devils Tower National Park, WY from February 2009 to October 2010. ............................................................................................................................................................................ 95
Figure 33. Atmospheric mercury deposition for Eagle Butte, SD from June 2009 to November 2010......................... 96
Figure 34. Atmospheric mercury deposition for Scotts Bluff National Monument, NE from April 2009 to November 2010. ............................................................................................................................................................................ 96
Appendices
Appendix A. SDSM&T Mercury Sampling Procedure................................................................................................... 91
Appendix B. Mercury Deposition Results .................................................................................................................... 92
Appendix C. Regression Equations for Walleye/Sauger .............................................................................................. 97
Appendix D. Individual Fish Mercury Data Summary ................................................................................................ 100
Appendix E. NPDES Permitted Discharge Facilities in South Dakota ........................................................................ 116
Appendix F. Public Comments and EPA Review ........................................................................................................ 123
South Dakota Mercury TMDL Page 7
Acknowledgements
The development of this TMDL was possible due to of the efforts of many groups and
individuals. Addressing impairments originating from anthropogenic sources inside and outside
of a state requires a unique approach. Approved TMDLs from Minnesota and the Northeast
States in cooperation with EPA has led to a framework that, to the extent practical, is followed in
this TMDL document. Additionally, intrastate efforts were required to establish the thresholds
for this TMDL. Dr. James Stone’s Final Report: Phase 1 Data Collection and Assessment for
South Dakota Mercury TMDL Development contributed significantly to this effort and much of
his work is included.
South Dakota Mercury TMDL Page 8
List of Acronyms AIC – Akaike’s Information Criteria
AMSA- Association of Metropolitan Sewerage
Agencies
ARSD – Administrative Rules of South Dakota
ASGM – Artisanal and Smallscale Gold Mining
BAF – Bioaccumulation Factor
BCF – Bioconcentration Factor
cm - Centimeters
CMAQ – Community Multi-scale Air Quality Model
DO – Dissolved Oxygen
DOC – Dissolved Organic Carbon
EPA – Environmental Protection Agency
FDA – Food and Drug Administration
FMSL – Feet Mean Sea Level
GIS – Geographic Information Systems
Hg – Mercury
HG0 – Elemental mercury vapor
HG2 – divalent mercury compounds in gas phase
HGP – divalent mercury compounds in particulate
phase
HUC – Hydrologic Unit Code
ICIS - Integrated Compliance Information System
kg – kilogram
km - kilometer
L - Liter
LA – Load Allocation
MATS - Mercury Air and Toxics Standards
MDN – Mercury Deposition Network
MeHg - Methylmercury
mg – milligram
mg/L – milligrams per liter
mg/Kg - milligrams per kilogram which is equal to
parts per million
MOS – Margin of Safety
MS4 – Municipal Separate Storm Sewer System
NLCD – National Land Cover Dataset
NPDES – National Pollutant Discharge Elimination
System
ng – nanograms
NPSL – Nonpoint Source Load
NRCS – Natural Resources Conservation Service
NWI – National Wetland Inventory
OM – Organic Matter
p - estimated probability of rejecting the null
hypothesis
POTW – Publicly Owned Treatment Works
PPTM – Particle and Precursor Tagging
Methodology
REMSAD - Regional Modeling System for Aerosols
and Deposition
RF – Reduction Factor
SDGFP – South Dakota Game Fish and Parks
SDDENR –South Dakota Department of
Environment and Natural Resources
SDDOH – South Dakota Department of Health
SDSU – South Dakota State University
SDSM&T – South Dakota School of Mines and
Technology
TDS – Total Dissolved Solids
TMDL – Total Maximum Daily Load
TPY – Tons Per Year
TS – Total Solids
TSL – Total Source Load
TSI – Trophic State Index
TSS – Total Suspended Solids
µg - Micrograms
µg/l – Micrograms per Liter
USDA – United States Department of Agriculture
USFWS – United States Fish and Wildlife Service
WE38 – Standard length walleye
WLA – Waste Load Allocation
WQS – Water Quality Standards
South Dakota Mercury TMDL Page 9
Executive Summary
Pursuant to Sections (§) 305(b), 303(d), and 314 of the Federal Water Pollution Control Act
(P.L. 95-217) the State of South Dakota is required to biennially publish the Integrated Report
which assesses the quality of the water in South Dakota lakes and streams (SDDENR 2014).
Included in this report is a list of surface waters currently not meeting their designated uses
(fishable, swimmable) because of some known cause or pollutant, referred to as the §303(d)
Impaired Waterbody List. These waters require the development of Total Maximum Daily
Loads (TMDLS) on the pollutants causing the impairment. A TMDL is a calculation of the
maximum amount of a pollutant that a waterbody can receive and still meet water quality
standards. It includes an evaluation of the pollutant sources, a specific allocation of the load to
each of the identified sources, and the necessary pollutant load reductions needed to meet water
quality standards.
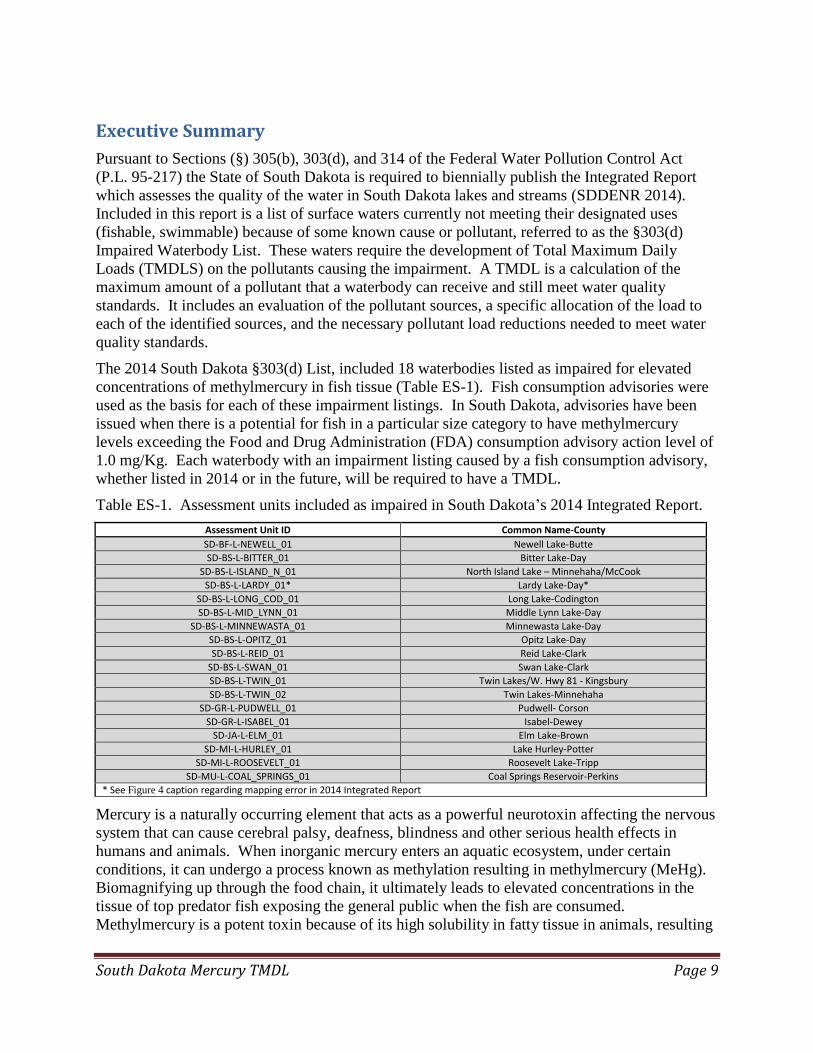
The 2014 South Dakota §303(d) List, included 18 waterbodies listed as impaired for elevated
concentrations of methylmercury in fish tissue (Table ES-1). Fish consumption advisories were
used as the basis for each of these impairment listings. In South Dakota, advisories have been
issued when there is a potential for fish in a particular size category to have methylmercury
levels exceeding the Food and Drug Administration (FDA) consumption advisory action level of
1.0 mg/Kg. Each waterbody with an impairment listing caused by a fish consumption advisory,
whether listed in 2014 or in the future, will be required to have a TMDL.
Table ES-1. Assessment units included as impaired in South Dakota’s 2014 Integrated Report.
Assessment Unit ID Common Name-County
SD-BF-L-NEWELL_01 Newell Lake-Butte
SD-BS-L-BITTER_01 Bitter Lake-Day
SD-BS-L-ISLAND_N_01 North Island Lake – Minnehaha/McCook
SD-BS-L-LARDY_01* Lardy Lake-Day*
SD-BS-L-LONG_COD_01 Long Lake-Codington
SD-BS-L-MID_LYNN_01 Middle Lynn Lake-Day
SD-BS-L-MINNEWASTA_01 Minnewasta Lake-Day
SD-BS-L-OPITZ_01 Opitz Lake-Day
SD-BS-L-REID_01 Reid Lake-Clark
SD-BS-L-SWAN_01 Swan Lake-Clark
SD-BS-L-TWIN_01 Twin Lakes/W. Hwy 81 - Kingsbury
SD-BS-L-TWIN_02 Twin Lakes-Minnehaha
SD-GR-L-PUDWELL_01 Pudwell- Corson
SD-GR-L-ISABEL_01 Isabel-Dewey
SD-JA-L-ELM_01 Elm Lake-Brown
SD-MI-L-HURLEY_01 Lake Hurley-Potter
SD-MI-L-ROOSEVELT_01 Roosevelt Lake-Tripp
SD-MU-L-COAL_SPRINGS_01 Coal Springs Reservoir-Perkins
* See Figure 4 caption regarding mapping error in 2014 Integrated Report
Mercury is a naturally occurring element that acts as a powerful neurotoxin affecting the nervous
system that can cause cerebral palsy, deafness, blindness and other serious health effects in
humans and animals. When inorganic mercury enters an aquatic ecosystem, under certain
conditions, it can undergo a process known as methylation resulting in methylmercury (MeHg).
Biomagnifying up through the food chain, it ultimately leads to elevated concentrations in the
tissue of top predator fish exposing the general public when the fish are consumed.
Methylmercury is a potent toxin because of its high solubility in fatty tissue in animals, resulting
South Dakota Mercury TMDL Page 10
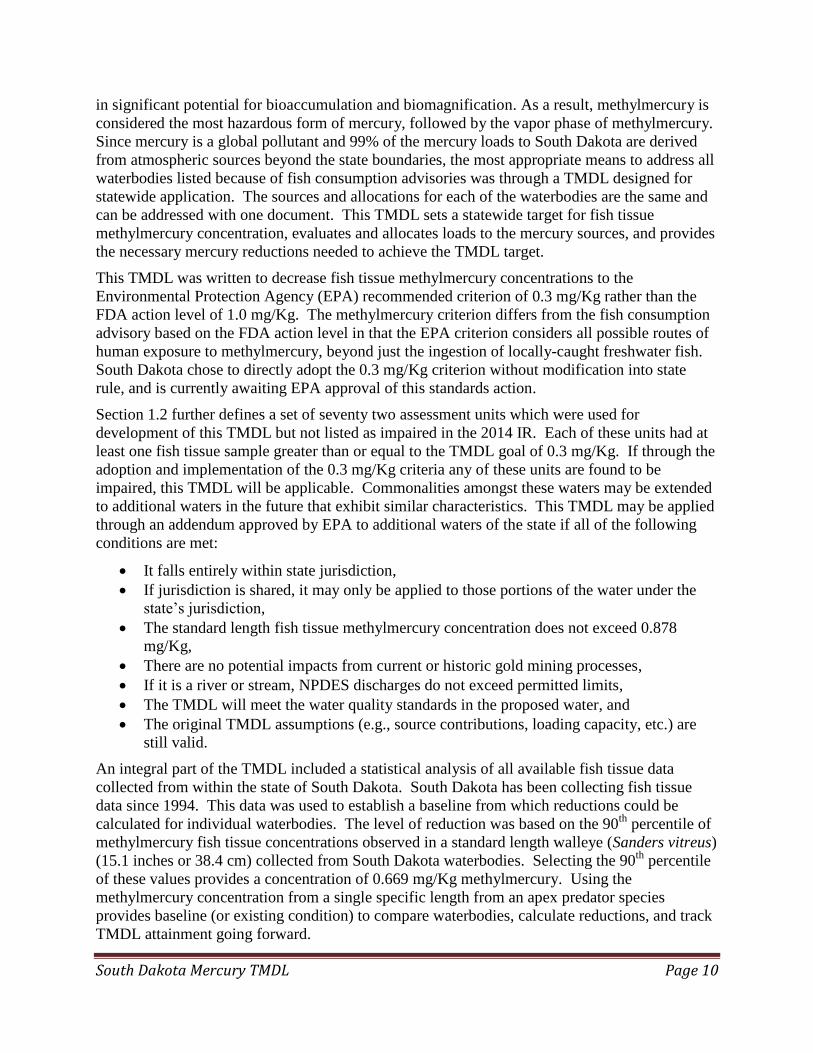
in significant potential for bioaccumulation and biomagnification. As a result, methylmercury is
considered the most hazardous form of mercury, followed by the vapor phase of methylmercury.
Since mercury is a global pollutant and 99% of the mercury loads to South Dakota are derived
from atmospheric sources beyond the state boundaries, the most appropriate means to address all
waterbodies listed because of fish consumption advisories was through a TMDL designed for
statewide application. The sources and allocations for each of the waterbodies are the same and
can be addressed with one document. This TMDL sets a statewide target for fish tissue
methylmercury concentration, evaluates and allocates loads to the mercury sources, and provides
the necessary mercury reductions needed to achieve the TMDL target.
This TMDL was written to decrease fish tissue methylmercury concentrations to the
Environmental Protection Agency (EPA) recommended criterion of 0.3 mg/Kg rather than the
FDA action level of 1.0 mg/Kg. The methylmercury criterion differs from the fish consumption
advisory based on the FDA action level in that the EPA criterion considers all possible routes of
human exposure to methylmercury, beyond just the ingestion of locally-caught freshwater fish.
South Dakota chose to directly adopt the 0.3 mg/Kg criterion without modification into state
rule, and is currently awaiting EPA approval of this standards action.
Section 1.2 further defines a set of seventy two assessment units which were used for
development of this TMDL but not listed as impaired in the 2014 IR. Each of these units had at
least one fish tissue sample greater than or equal to the TMDL goal of 0.3 mg/Kg. If through the
adoption and implementation of the 0.3 mg/Kg criteria any of these units are found to be
impaired, this TMDL will be applicable. Commonalities amongst these waters may be extended
to additional waters in the future that exhibit similar characteristics. This TMDL may be applied
through an addendum approved by EPA to additional waters of the state if all of the following
conditions are met:
It falls entirely within state jurisdiction,
If jurisdiction is shared, it may only be applied to those portions of the water under the
state’s jurisdiction,
The standard length fish tissue methylmercury concentration does not exceed 0.878
mg/Kg,
There are no potential impacts from current or historic gold mining processes,
If it is a river or stream, NPDES discharges do not exceed permitted limits,
The TMDL will meet the water quality standards in the proposed water, and
The original TMDL assumptions (e.g., source contributions, loading capacity, etc.) are
still valid.
An integral part of the TMDL included a statistical analysis of all available fish tissue data
collected from within the state of South Dakota. South Dakota has been collecting fish tissue
data since 1994. This data was used to establish a baseline from which reductions could be
calculated for individual waterbodies. The level of reduction was based on the 90th
percentile of
methylmercury fish tissue concentrations observed in a standard length walleye (Sanders vitreus)
(15.1 inches or 38.4 cm) collected from South Dakota waterbodies. Selecting the 90th
percentile
of these values provides a concentration of 0.669 mg/Kg methylmercury. Using the
methylmercury concentration from a single specific length from an apex predator species
provides baseline (or existing condition) to compare waterbodies, calculate reductions, and track
TMDL attainment going forward.
South Dakota Mercury TMDL Page 11
The basis of mercury deposition estimates for South Dakota commenced in 2009, when a project
conducted by Dr. Stone of the South Dakota School of Mines and Technology expanded the air
deposition monitoring throughout South Dakota. The year 2009 was used as the baseline loading
to which future mercury loading will be compared for mercury TMDL attainment. The year
2009 also works with the fish tissue data, which were more intensively collected from 2010 to
2014. The more recent fish tissue data should incorporate some bioaccumulation of the
methylmercury that resulted from 2009 emissions. It can be assumed that once the TMDL has
been approved and implemented, future fish tissue mercury concentrations would be expected to
decrease due to reductions in mercury loading.
The target level of 0.3 mg/Kg was applied to the single value of 0.669 mg/Kg representing all
waters fish tissue data was collected from. The difference between the baseline condition
calculated from a standard length walleye (0.669 mg/Kg) and the target level (0.3 mg/Kg) is the
reduction factor (RF) needed to meet the water quality standard. The resulting reduction factor
for the state is set at 55.2%. In other words, a 55.2% gross reduction from the aggregate sources
of mercury is necessary to achieve the TMDL goal.
In general, the mercury loads to each waterbody vary across the state relative to the surface area
and depositional rate, but the mercury sources do not. To apply this TMDL statewide it is
assumed that through the Principle of Proportionality (see Section 3.3) proportional fish tissue
mercury concentration reductions will occur for all waters of the state with concomitant
reductions in air emissions.
A TMDL consists of a Load Allocation (LA), Waste Load Allocation (WLA), and Margin of
Safety (MOS) components. The LA and WLA together constitute the Total Source Load or
TSL. For this TMDL the LA component contributes over 99% of the TSL. This is all attributed
to air deposition and is subject to all the reductions required for TMDL attainment. The point
source loads (which included NPDES permitted facilities, mining, and municipal separate storm
sewer systems) were factored into the total source load (TSL) and account for <1% of the TSL.
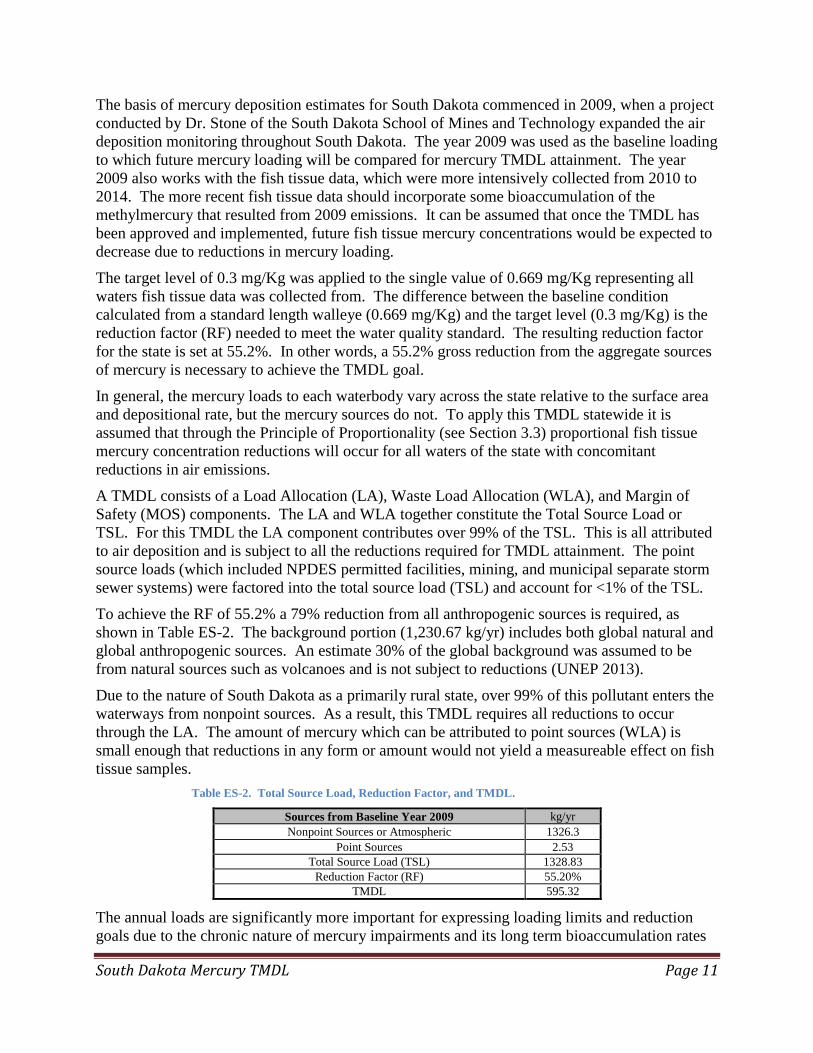
To achieve the RF of 55.2% a 79% reduction from all anthropogenic sources is required, as
shown in Table ES-2. The background portion (1,230.67 kg/yr) includes both global natural and
global anthropogenic sources. An estimate 30% of the global background was assumed to be
from natural sources such as volcanoes and is not subject to reductions (UNEP 2013).
Due to the nature of South Dakota as a primarily rural state, over 99% of this pollutant enters the
waterways from nonpoint sources. As a result, this TMDL requires all reductions to occur
through the LA. The amount of mercury which can be attributed to point sources (WLA) is
small enough that reductions in any form or amount would not yield a measureable effect on fish
tissue samples.
Table ES-2. Total Source Load, Reduction Factor, and TMDL.
Sources from Baseline Year 2009 kg/yr
Nonpoint Sources or Atmospheric 1326.3
Point Sources 2.53
Total Source Load (TSL) 1328.83
Reduction Factor (RF) 55.20%
TMDL 595.32
The annual loads are significantly more important for expressing loading limits and reduction
goals due to the chronic nature of mercury impairments and its long term bioaccumulation rates
South Dakota Mercury TMDL Page 12
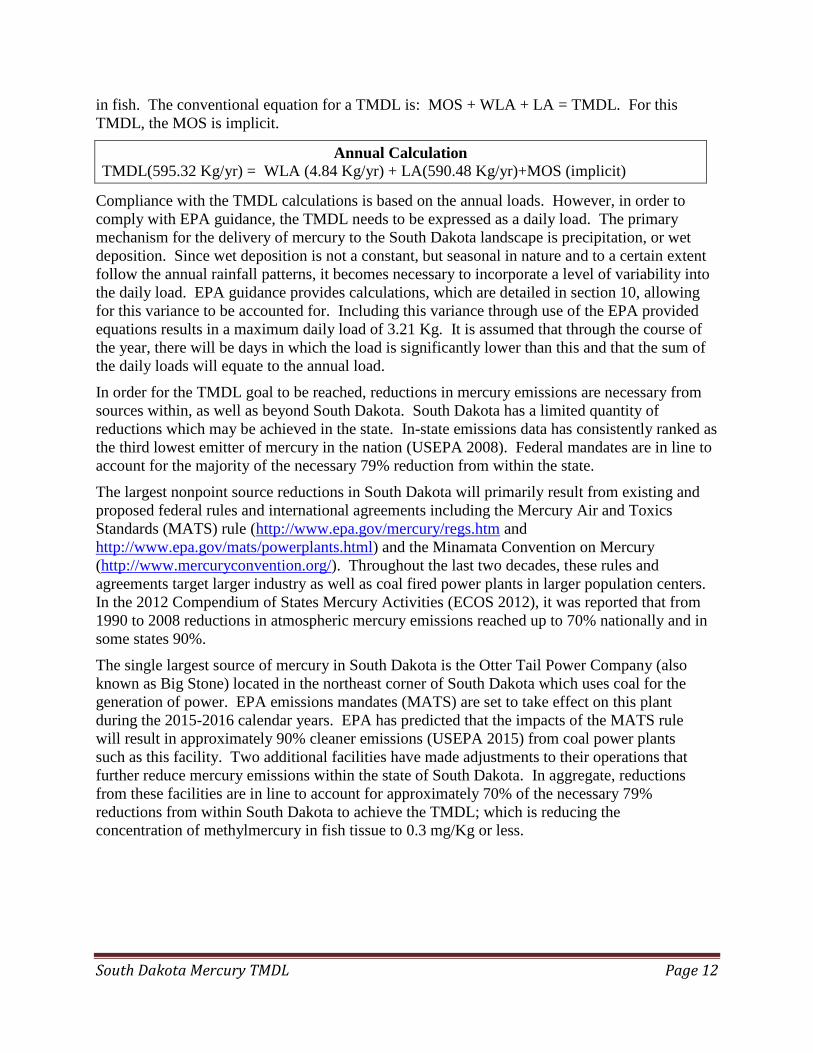
in fish. The conventional equation for a TMDL is: MOS + WLA + LA = TMDL. For this
TMDL, the MOS is implicit.
Annual Calculation
TMDL(595.32 Kg/yr) = WLA (4.84 Kg/yr) + LA(590.48 Kg/yr)+MOS (implicit)
Compliance with the TMDL calculations is based on the annual loads. However, in order to
comply with EPA guidance, the TMDL needs to be expressed as a daily load. The primary
mechanism for the delivery of mercury to the South Dakota landscape is precipitation, or wet
deposition. Since wet deposition is not a constant, but seasonal in nature and to a certain extent
follow the annual rainfall patterns, it becomes necessary to incorporate a level of variability into
the daily load. EPA guidance provides calculations, which are detailed in section 10, allowing
for this variance to be accounted for. Including this variance through use of the EPA provided
equations results in a maximum daily load of 3.21 Kg. It is assumed that through the course of
the year, there will be days in which the load is significantly lower than this and that the sum of
the daily loads will equate to the annual load.
In order for the TMDL goal to be reached, reductions in mercury emissions are necessary from
sources within, as well as beyond South Dakota. South Dakota has a limited quantity of
reductions which may be achieved in the state. In-state emissions data has consistently ranked as
the third lowest emitter of mercury in the nation (USEPA 2008). Federal mandates are in line to
account for the majority of the necessary 79% reduction from within the state.
The largest nonpoint source reductions in South Dakota will primarily result from existing and
proposed federal rules and international agreements including the Mercury Air and Toxics
Standards (MATS) rule (http://www.epa.gov/mercury/regs.htm and
http://www.epa.gov/mats/powerplants.html) and the Minamata Convention on Mercury
(http://www.mercuryconvention.org/). Throughout the last two decades, these rules and
agreements target larger industry as well as coal fired power plants in larger population centers.
In the 2012 Compendium of States Mercury Activities (ECOS 2012), it was reported that from
1990 to 2008 reductions in atmospheric mercury emissions reached up to 70% nationally and in
some states 90%.
The single largest source of mercury in South Dakota is the Otter Tail Power Company (also
known as Big Stone) located in the northeast corner of South Dakota which uses coal for the
generation of power. EPA emissions mandates (MATS) are set to take effect on this plant
during the 2015-2016 calendar years. EPA has predicted that the impacts of the MATS rule
will result in approximately 90% cleaner emissions (USEPA 2015) from coal power plants
such as this facility. Two additional facilities have made adjustments to their operations that
further reduce mercury emissions within the state of South Dakota. In aggregate, reductions
from these facilities are in line to account for approximately 70% of the necessary 79%
reductions from within South Dakota to achieve the TMDL; which is reducing the
concentration of methylmercury in fish tissue to 0.3 mg/Kg or less.
South Dakota Mercury TMDL Page 13
1.0 Introduction
The Clean Water Act requires that states must place waterbodies which do not meet water
quality standards for a given pollutant on the Threatened and Impaired Waters list (also referred
to as the 303d list). Once a waterbody is placed on this list, states are required to develop a Total
Maximum Daily Load (TMDL) for that waterbody and the pollutant that caused its listing. A
TMDL is a calculation of the maximum amount of a pollutant a waterbody may receive while
still meeting the water quality standard. The calculation allocates the loads of the pollutant to
point sources and non-point sources while incorporating a margin of safety for uncertainties in
the calculation. This TMDL was developed to address the pollutant mercury, which through
various pathways and process accumulates in fish tissue.
TMDLs are being put into place throughout the United States to help limit mercury emission on
statewide and region-wide levels. These TMDLs look at mercury sources and limit the total
anthropogenic emissions in an area to a specific, calculated amount or goal. For example, the
Minnesota TMDL called for a 93% reduction in anthropogenic loadings starting from the
baseline year of 1990. As of 2005, they had achieved a 76% reduction in anthropogenic
loadings. (MPCA 2007).
Mercury is a naturally occurring element which acts as a powerful neurotoxin in humans and
wildlife (Wentz et al. 2014). When inorganic mercury enters an aquatic ecosystem, under certain
conditions, it can undergo a process known as methylation resulting in methylmercury (MeHg).
In this form, it biomagnifies within the aquatic food chain and ultimately leads to elevated
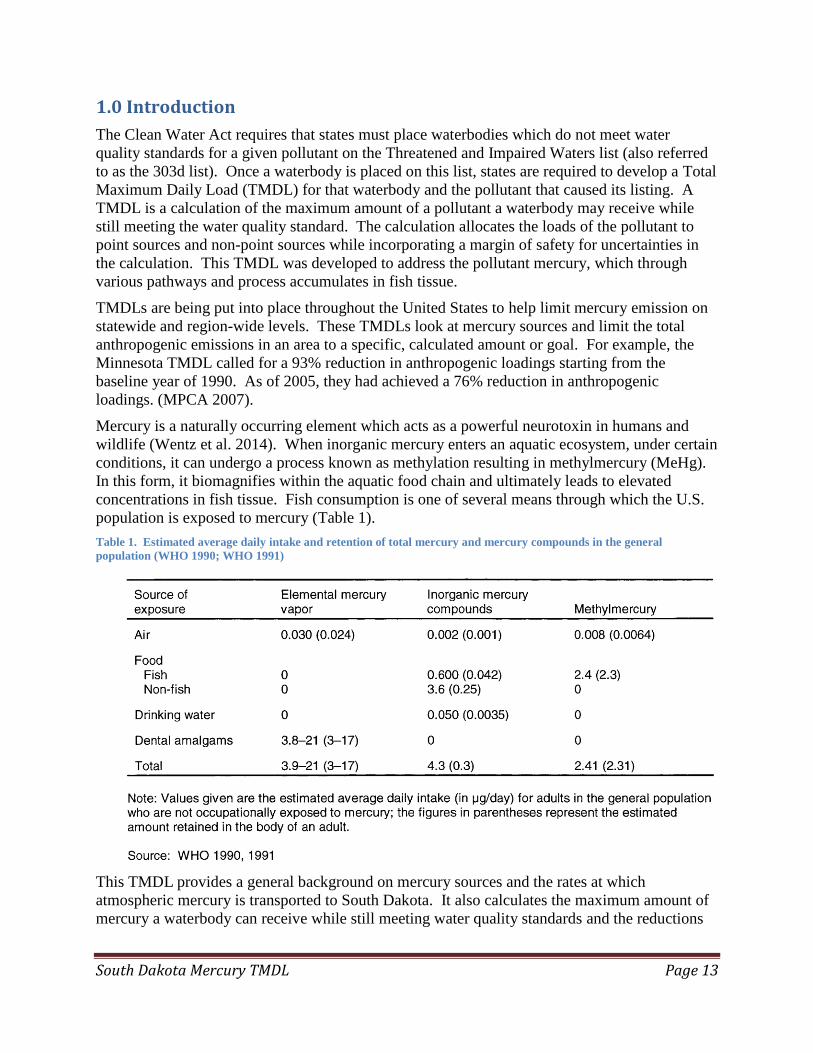
concentrations in fish tissue. Fish consumption is one of several means through which the U.S.
population is exposed to mercury (Table 1).
Table 1. Estimated average daily intake and retention of total mercury and mercury compounds in the general
population (WHO 1990; WHO 1991)
This TMDL provides a general background on mercury sources and the rates at which
atmospheric mercury is transported to South Dakota. It also calculates the maximum amount of
mercury a waterbody can receive while still meeting water quality standards and the reductions
South Dakota Mercury TMDL Page 14
from the various sources needed to meet the TMDL goal. Mercury, once deposited on the
landscape, needs to have specific conditions present in order for methylation to take place.
Several investigations conducted within the state of South Dakota and elsewhere have attempted
to determine those variables that play the most significant role in controlling the methylation
process and the rate at which it occurs. Similar analysis steps were used to help with the
development of this TMDL, only with more recent data collected in South Dakota. Section 3.4
describes the complex processes that move and transform mercury through methylation as it
pertains to South Dakota waterbodies. Because methylation involves bacteria, a host of other
abiotic factors, and atmospheric deposition, controlling it is well beyond the scope of the usual
best management practices (BMPs). A successful reduction strategy will need to focus on the
atmospheric sources rather than localized landuse modifications within a watershed. Discussions
in this document identify necessary efforts that need to be taken in order for the TMDL to be
effective.
1.1 Background
Approximately 6,600 metric tons of mercury is emitted to the atmosphere world-wide each year
(Driscoll et al. 2007). The neurotoxin mercury often exists in lakes and fish tissue and is a
concern throughout the world (USEPA 1997). Humans and wildlife are exposed to mercury
through the consumption of mercury polluted fish (Driscoll et al. 2007). As of 2004, fish
consumption advisories due to mercury found in fish tissues had been issued in 44 states of the
US (Driscoll et al. 2007). Mercury behavior within the atmosphere includes mercury emissions,
transport, and deposition. After deposition the fate of mercury is highly dependent upon
biogeochemical environmental factors responsible for transformation of inorganic mercury to the
more hazardous form of methylmercury within aquatic systems (USEPA 1997). Methylmercury
production varies greatly under high mercury loading due to differences in water chemistry of
lake systems (Driscoll et al. 2007) (Krabbenhoft et al. 1999). For example, lakes having high
total mercury loading can have low methylation efficiency leaving fish tissue concentrations far
below advisory limits, and lakes having low mercury loading can have high methylation
efficiency leaving fish tissue concentrations above state advisory limits (Krabbenhoft et al.
1999). Within aquatic systems, mercury bioaccumulation in fish was found to correlate
positively with fish age, species, and position in the food chain (Watras and Bloom 1992).
Methylmercury is the major form of fish tissue mercury, constituting approximately 83% of the
total mercury mass (Driscoll et al. 2007) (Kannan et al. 1998). EPA’s recommended
methylmercury criterion is set at levels necessary to protect consumers of fish and shellfish
among the general population –children and women of childbearing age are more sensitive.
Various studies and literature reviews have found neurodevelopmental effects to be the most
sensitive endpoints which led EPA to develop a reference dose for methylmercury. The potential
health effects of methylmercury toxicity are significant and exposure to mercury can cause
severe effects to the nervous system (USEPA 1997).
Mercury emissions to the atmosphere have ranged dramatically from year to year but by 1990
regular decreases began to occur. EPA had proposed the Clean Air Mercury Rule, which was
intended to limit mercury air emissions to 33 tons per year. However, the Washington D.C.
District Court vacated EPA’s Clean Air Mercury Rule on February 8, 2008. On March 16, 2011,
EPA proposed standards for air toxics emissions, including mercury, from coal- and oil-fired
electric generating units. On February 16, 2012, the Mercury Air and Toxics Standards (MATS)
South Dakota Mercury TMDL Page 15
rule was promulgated in 77 FR 9464. The recent U.S. Supreme Court decision (Michigan v. US
EPA) adds uncertainty to MATS rule, however, this TMDL assumes its continued and full
implementation.
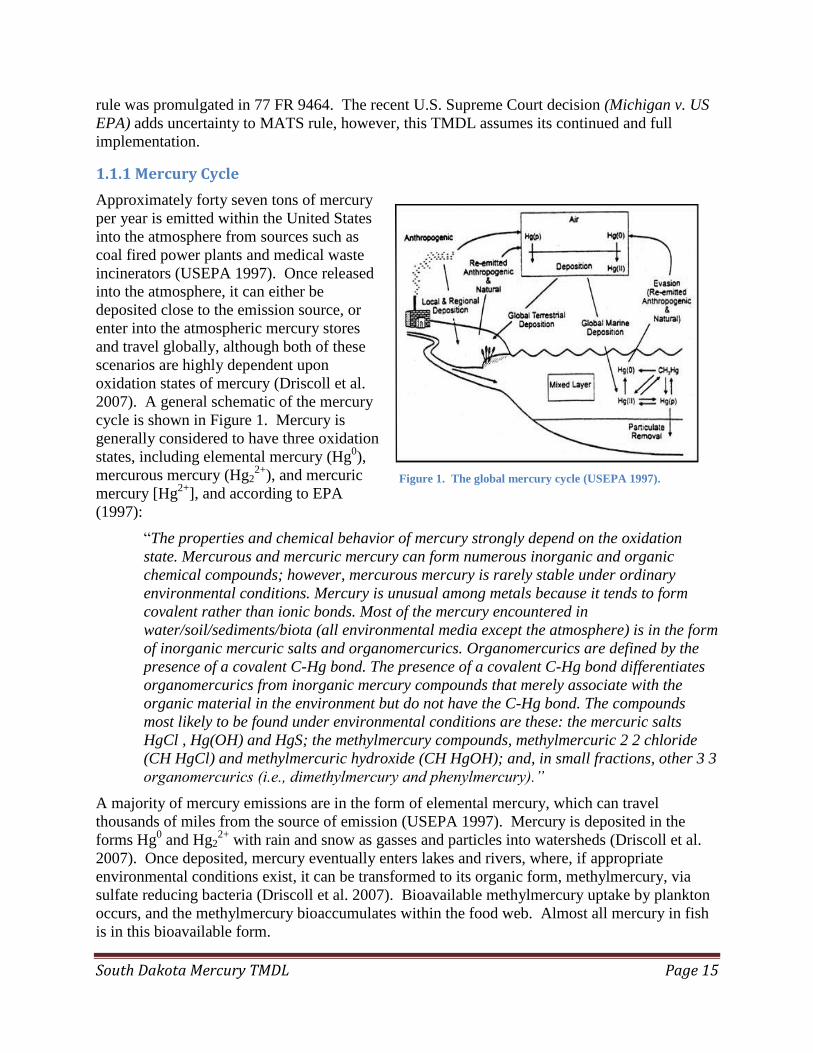
1.1.1 Mercury Cycle
Approximately forty seven tons of mercury
per year is emitted within the United States
into the atmosphere from sources such as
coal fired power plants and medical waste
incinerators (USEPA 1997). Once released
into the atmosphere, it can either be
deposited close to the emission source, or
enter into the atmospheric mercury stores
and travel globally, although both of these
scenarios are highly dependent upon
oxidation states of mercury (Driscoll et al.
2007). A general schematic of the mercury
cycle is shown in Figure 1. Mercury is
generally considered to have three oxidation
states, including elemental mercury (Hg0),
mercurous mercury (Hg22+
), and mercuric
mercury [Hg2+
], and according to EPA
(1997):
“The properties and chemical behavior of mercury strongly depend on the oxidation
state. Mercurous and mercuric mercury can form numerous inorganic and organic
chemical compounds; however, mercurous mercury is rarely stable under ordinary
environmental conditions. Mercury is unusual among metals because it tends to form
covalent rather than ionic bonds. Most of the mercury encountered in
water/soil/sediments/biota (all environmental media except the atmosphere) is in the form
of inorganic mercuric salts and organomercurics. Organomercurics are defined by the
presence of a covalent C-Hg bond. The presence of a covalent C-Hg bond differentiates
organomercurics from inorganic mercury compounds that merely associate with the
organic material in the environment but do not have the C-Hg bond. The compounds
most likely to be found under environmental conditions are these: the mercuric salts
HgCl , Hg(OH) and HgS; the methylmercury compounds, methylmercuric 2 2 chloride
(CH HgCl) and methylmercuric hydroxide (CH HgOH); and, in small fractions, other 3 3
organomercurics (i.e., dimethylmercury and phenylmercury).”
A majority of mercury emissions are in the form of elemental mercury, which can travel
thousands of miles from the source of emission (USEPA 1997). Mercury is deposited in the
forms Hg0 and Hg2
2+ with rain and snow as gasses and particles into watersheds (Driscoll et al.
2007). Once deposited, mercury eventually enters lakes and rivers, where, if appropriate
environmental conditions exist, it can be transformed to its organic form, methylmercury, via
sulfate reducing bacteria (Driscoll et al. 2007). Bioavailable methylmercury uptake by plankton
occurs, and the methylmercury bioaccumulates within the food web. Almost all mercury in fish
is in this bioavailable form.
Figure 1. The global mercury cycle (USEPA 1997).

South Dakota Mercury TMDL Page 16
The biogeochemical cycle of mercury in aqueous systems is the key factor leading to the
expansion of mercury pollution on a global scale (Nriagu 1994). In natural waters, much of the
Hg2+
is attached to suspended particulates, and eventually is deposited in lake sediments. The
mercuric ion Hg2+
forms covalent molecules rather than an ionic solid (Baird 1999). The methyl
anion, CH3-, forms a covalent compound with Hg
2+, yielding the volatile molecular liquid
dimethylmercury, Hg (CH3)2 (Baird 1999). Dimethylmercury formation occurs in the muddy
sediments of rivers and lakes, especially under anaerobic conditions when anaerobic bacteria and
microorganisms convert Hg2+
into Hg(CH3)2 (Baird 1999). The methylation process is a
microbially-facilitated process; a derivative of vitamin B12 with a CH3- anion bound to cobalt
and is called methylcobalamin (Baird 1999). Due to its volatility, dimethylmercury evaporates
(“degasses”) from water relatively quickly unless it is transformed by acidic conditions into the
mono methyl form. The less volatile “mixed” compounds CH3HgX or CH3Hg+ are called
methylmercury (or mono-methylmercury), and are more readily formed than dimethylmercury
(Baird 1999). The biogeochemical reaction pathway formation of methylmercury is presented in
Figure 2. Methylmercury is a more potent toxin because of its high solubility in fatty tissue in
animals, resulting in significant potential for bioaccumulation and bio magnification. As a result,
methylmercury is considered the most hazardous form of mercury, followed by the vapor phase
of methylmercury. The other inorganic ion of mercury, Hg2+
, is not considered toxic because it
combines in the stomach with chloride ions to produce insoluble Hg2Cl2 (Baird 1999).
Figure 2. Diagram illustrating methylation in process under anaerobic conditions. (Betemariam 2010)
The methylmercury that is on the surface of the sediment would be transferred up through the
food chain. Recent studies show this transfer proceeds by two processes: (1) insect larvae on the
surface of the sediment, exposed to high concentrations of methylmercury, feed on partially
degraded and mercury-rich organic matter, rapidly bioaccumulating significant amounts of
mercury and methylmercury and transferring it to the higher aquatic organisms as they emerge
(Plourde et al. 1997) (Tremblay et al. 1998); (2) diffusion to the water column and rapid
adsorption onto suspended particles (Morrison and Therien 1991). The suspended particulate
matter and the bio-film at the soil-water interface actively transfer methylmercury from the
sediments to invertebrates (Tremblay 1999).
+
Hg2+
+
Organic Matter
(e.g. Methyl anion,
CH3 - )
Sulfate Reducing
Bacteria (SRB)
Iron Reducing
Bacteria (FeRB)
Hg (CH3)2
(Dimethylmercury)
CH3Hg+
(Methylmercury)
Hg (CH3)2
(Dimethylmercury)
Acidic
conditions
South Dakota Mercury TMDL Page 17
1.1.2 Atmospheric Mercury Transport and Deposition
Large quantities of mercury vapor are released into the air as a result of the historically
unregulated burning of coal and fuel oil that typically contain trace amounts of mercury
(reaching several hundred ppm in some coals) and the incineration of municipal wastes both
within the US and abroad that contain mercury-containing products such as batteries. In air, the
vast majority of mercury may be found in the vapor (gaseous) state, with only a tiny fraction of it
bound to airborne particles. Airborne elemental gaseous mercury usually travels long distances
and durations before being oxidized and dissolving in rain and subsequently being deposited on
land or in water ways (Baird 1999). Most atmospheric mercury emissions are in the form of
Hg2+
. Once mercury reaches the land surface, human disturbance may influence how mercury
moves within a specific watershed. In general, increased erosion rates result in increased
mercury loading to lakes. Some studies have shown land-use of a watershed is also a major
determinant of a lake trophic status, which may in turn influence mercury behavior. Other
studies have shown lakes in largely forested catchments with limited agriculture or built-up
cover types typically have lower total phosphorus, chlorophyll-a, and higher Secchi depths. All
of these have been shown to reduce the relative rate of mercury methylation, the mercury form of
most concern due to its ability to bioaccumulate. Lakes with very small watersheds also tend to
have higher water quality, even in cases where there is substantial lake-shore development or
agricultural land-use (Engstrom et al. 1999). Mercury can also be leached from rocks and soil
into water systems by natural processes, some of which may be accelerated by human activities.
Further, flooding of vegetated areas may release mercury into water (Baird 1999).
Atmospheric deposition of mercury occurs as both wet deposition and dry deposition. Wet
deposition is associated with rain and snow, and constitutes the largest pool of mercury in the
atmosphere. Dry deposition includes both particulate-associated mercury and gaseous ionic
mercury. Direct measurement of deposition from atmospheric sources is the most accurate but
also the most labor intensive method for estimating mercury loadings into a watershed or water
body. Mercury deposition rates are typically accomplished through the measurement of either
wet, dry, or bulk (i.e., combination of wet and dry) mercury deposition. A more detailed review
of deposition data is available in Section 5.0 Source Assessment – Nonpoint.
The Mercury Deposition Network (MDN 2014) , which operates samplers installed throughout
the US, has been created to monitor wet mercury deposition. In 1996, the MDN joined the
National Atmospheric Deposition Program (NADP) and currently has over 100 sites in operation
(MDN 2014). For South Dakota, the only MDN site was commissioned in June of 2007 on the
Cheyenne River Indian Reservation at Eagle Butte, South Dakota. Data from this site was not
used for depositional estimates by NADP until after 2009. In 2009, there were no MDN sites in
Iowa or North Dakota (the Lostwood, ND site was decommissioned in 2008), two sites in
southern Nebraska, and multiple sites in Minnesota.
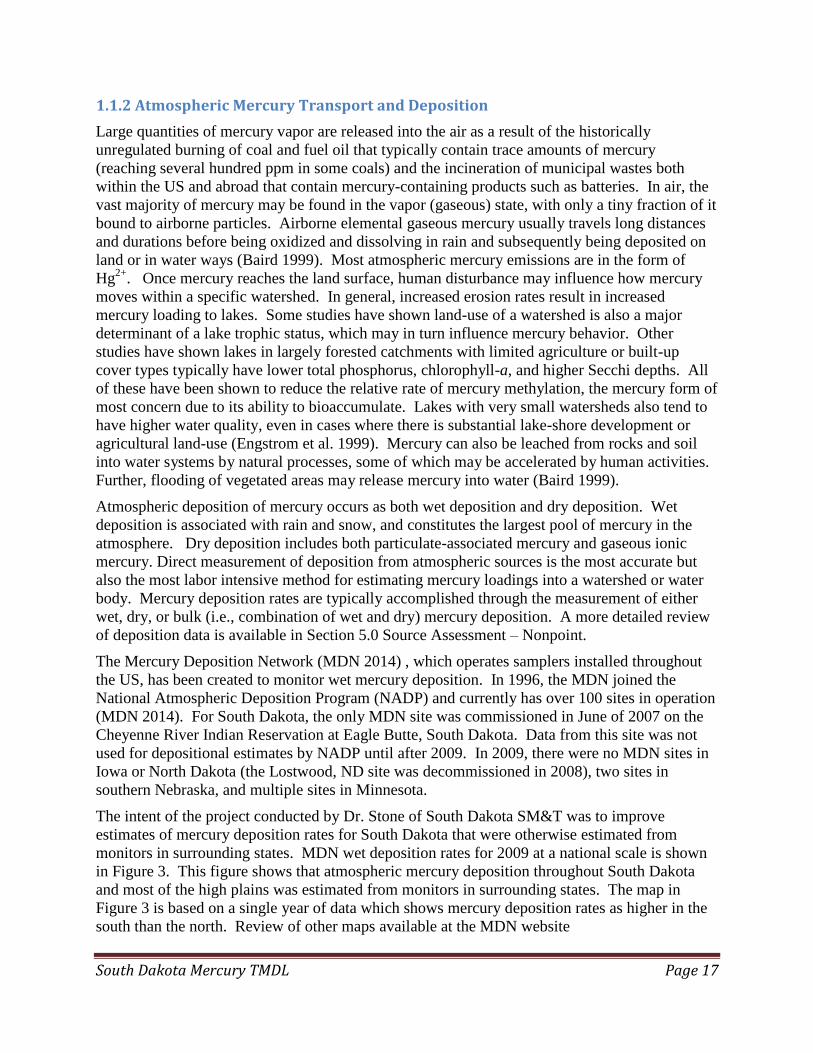
The intent of the project conducted by Dr. Stone of South Dakota SM&T was to improve
estimates of mercury deposition rates for South Dakota that were otherwise estimated from
monitors in surrounding states. MDN wet deposition rates for 2009 at a national scale is shown
in Figure 3. This figure shows that atmospheric mercury deposition throughout South Dakota
and most of the high plains was estimated from monitors in surrounding states. The map in
Figure 3 is based on a single year of data which shows mercury deposition rates as higher in the
south than the north. Review of other maps available at the MDN website

South Dakota Mercury TMDL Page 18
(http://nadp.sws.uiuc.edu/mdn/) shows patterns similar to precipitation patterns in that the
western United States is substantially lower than in the eastern United States.
Figure 3. National total mercury wet deposition for 2009 from the MDN monitoring sites.
1.1.3 Global Trends in Mercury Emissions
Mercury is widely dispersed and transported in the atmosphere thousands of miles from existing
emission sources. The ease with which mercury is mobilized into the atmosphere allows any
global source to contribute to the deposition in South Dakota. While it is beyond the scope of
this TMDL to completely address global sources, it is imperative for understanding the
limitations of this TMDL to have an awareness of the mobile nature of mercury and the global
trends associated with this persistent pollutant.
The United Nations Environment Program released the report “Global Mercury Assessment
2013: Sources, Emissions, Releases and Environmental Transport.” While acknowledging the
limitations associated with changing inventory methods and new source accounting, it presents a
review of global mercury trends for certain mercury emitting sectors. In general, the report
indicates that after many years of reductions, the period of 2005 to 2010 may have seen an
increase in aggregate mercury emissions. Some of these variables for the two largest emissions
sectors (small scale gold mining and coal fired power) are discussed in the following excerpt
from that report.
“Coal burning for power generation and for industrial purposes continues to increase, especially
in Asia. However increases in the application of air pollution controls, including some mercury
specific technologies, together with more stringent regulations in a number of countries have
reduced mercury emissions from coal burning in power plants in particular, and thus offset some
part of the emissions arising from increased coal consumption.
In the United States, for example, emissions from coal burning at power plants have reportedly
decreased from about 53 tonnes in 2005 to 27 tonnes in 2010. This decrease is largely due to new
regulations that have resulted in changes in the sources of the coal that is burned in large power

South Dakota Mercury TMDL Page 19
plants and the installation of mercury controls as well as controls on sulphur dioxide and
particulates that have the co-benefit of further reducing mercury emissions.
In China, many of the new coal-fired power plants have state-of-the-art pollution controls
installed.
Emissions of mercury from artisanal and small-scale gold mining (ASGM) reported for 2010 are
more than twice those reported for 2005. While the rise in the price of gold (from USD 400 per
ounce in 2005 to USD 1100 per ounce in 2010), along with increased rural poverty, may indeed
have caused more activity in this sector, the increased estimate for mercury emissions is
considered to be due primarily to some more and better data from many countries and regions.
West Africa, for example, was regarded as having minimal ASGM in 2005, but is now recognized
as a region with considerable activity. Thus, the baseline has improved, without necessarily any
change in actual activity or emission levels.
Waste from consumer products is affected by the amount of mercury used. For most products in
which mercury is used, mercury-free alternatives exist. Consequently, many of these uses of
mercury are declining, at least in some regions, as alternative products or processes are adopted.
Compact fluorescent light bulbs are an exception. Even though the mercury content of individual
light bulbs has decreased, use of this type of light bulb is increasing rapidly.
In order to make valid assessments of trends in emissions from global inventories, comparable data
on activity levels are required, together with information on changes in fuel and raw material
characteristics and applied air pollution control technology. One aim of the 2010 inventory
methods is to create a firmer foundation for such future trend analysis.” (UNEP 2013)
1.2 Impaired Waters
The 2014 South Dakota Integrated Report (also referred to as the State’s 303d list) included
eighteen waterbodies as impaired for elevated concentrations of methylmercury in fish tissue.
Fish consumption advisories were used as the basis for each of these impairment listings. Fish
consumption advisories are non-regulatory mechanisms used to inform the public that high
concentrations of chemical contaminants, such as mercury, have been found in local fish. In
South Dakota, the Department of Game, Fish & Parks; the Department of Environment and
Natural Resources; and the Department of Health work together to establish fish consumption
advisories and provide public education and outreach.
In South Dakota, advisories have been issued for fish in a particular size category when mercury
levels exceed the Food and Drug Administration (FDA) consumption advisory action level of 1.0
mg/Kg of methylmercury. Typically, the advisories are species specific and reflect the largest
size class present in the water body. These advisories use waterbody-specific fish tissue data and
FDA action levels to derive a maximum weekly or monthly fish consumption recommendation.
For example, children under age 7 are recommended not to eat more than 4 ounces per month of
walleye over 17” from Long lake. The advisories indicate how much locally-caught fish can be
safely consumed with no additional exposure. For methylmercury, the FDA action level of 1
mg/Kg is used to identify contaminated or adulterated food by the agency charged with
protecting our nation’s food supply. The South Dakota consumption advisories, and the FDA
action level from which they are calculated, are similar to the EPA methylmercury criterion of
0.3 mg/Kg used in this TMDL analysis but use slightly different risk assumptions (USEPA
2010).
South Dakota Mercury TMDL Page 20
The 0.3 mg/Kg criterion was developed by EPA to serve as guidance for states while establishing
water quality standards, as required under the Clean Water Act, which have regulatory
implications (e.g. surface water discharge permit limits, 401 certifications, etc.). EPA requires
states to adopt the 0.3 mg/Kg methylmercury criterion or a scientifically defensible modification
of it in their water quality standards regulations. South Dakota chose to directly adopt the 0.3
mg/Kg criterion without modification. The methylmercury criterion was the first time EPA
issued a water quality criterion expressed as a fish tissue value rather than a water column value
due to the bioaccumulative nature of mercury and the limited pathways of exposure. The
methylmercury criterion differs from the fish consumption advisory based on the FDA action
level in that the EPA criterion considers all possible routes of human exposure to
methylmercury, beyond just the ingestion of locally-caught freshwater fish. During criterion
development, EPA demonstrated that methylmercury exposure through drinking water, non-fish
dietary foods, air, and soil was negligible (USEPA 2001). The two most significant exposure
routes identified were the ingestion of both marine and freshwater fish. Thus the EPA criterion
assumes individuals are exposed to methylmercury from eating marine fish sold in stores, in
addition to the freshwater fish they catch and eat locally, and a portion of the allowable
methylmercury exposure is reserved for consumption of marine fish. As a result, the EPA
criterion is more conservative than the FDA action level. For a complete description of the
methodology and basis for the EPA criterion, please see Water Quality Criterion for the
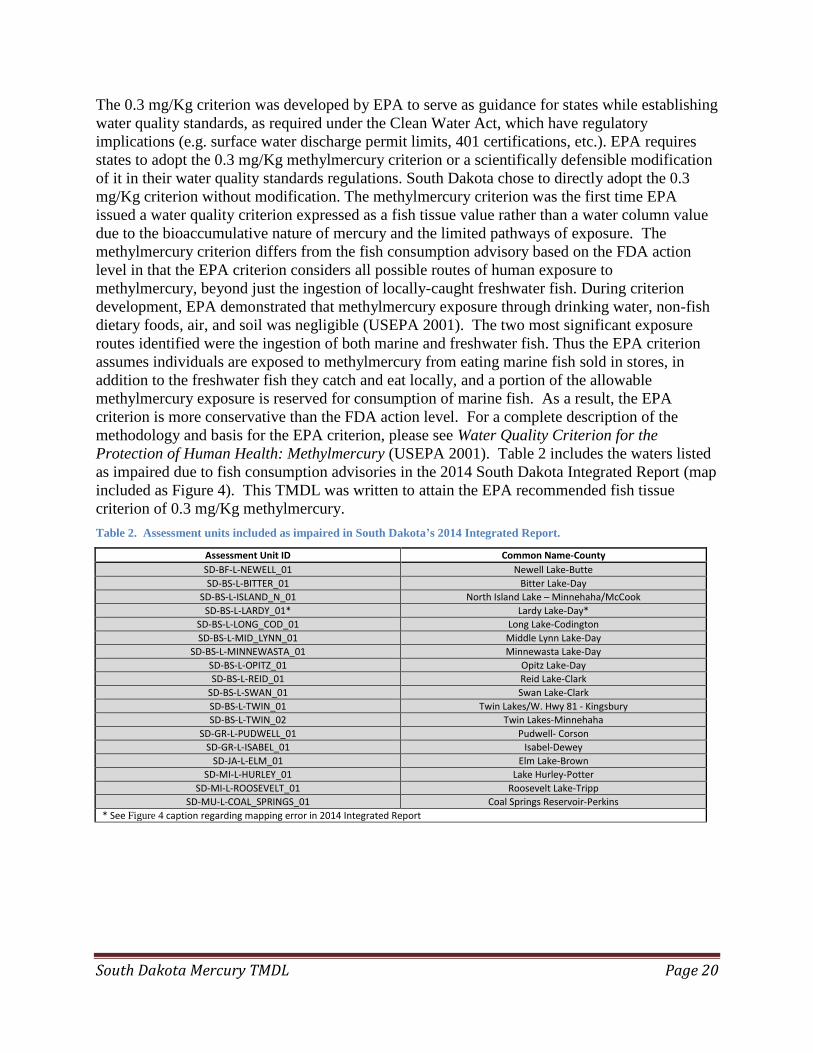
Protection of Human Health: Methylmercury (USEPA 2001). Table 2 includes the waters listed
as impaired due to fish consumption advisories in the 2014 South Dakota Integrated Report (map
included as Figure 4). This TMDL was written to attain the EPA recommended fish tissue
criterion of 0.3 mg/Kg methylmercury.
Table 2. Assessment units included as impaired in South Dakota’s 2014 Integrated Report.
Assessment Unit ID Common Name-County
SD-BF-L-NEWELL_01 Newell Lake-Butte
SD-BS-L-BITTER_01 Bitter Lake-Day
SD-BS-L-ISLAND_N_01 North Island Lake – Minnehaha/McCook
SD-BS-L-LARDY_01* Lardy Lake-Day*
SD-BS-L-LONG_COD_01 Long Lake-Codington
SD-BS-L-MID_LYNN_01 Middle Lynn Lake-Day
SD-BS-L-MINNEWASTA_01 Minnewasta Lake-Day
SD-BS-L-OPITZ_01 Opitz Lake-Day
SD-BS-L-REID_01 Reid Lake-Clark
SD-BS-L-SWAN_01 Swan Lake-Clark
SD-BS-L-TWIN_01 Twin Lakes/W. Hwy 81 - Kingsbury
SD-BS-L-TWIN_02 Twin Lakes-Minnehaha
SD-GR-L-PUDWELL_01 Pudwell- Corson
SD-GR-L-ISABEL_01 Isabel-Dewey
SD-JA-L-ELM_01 Elm Lake-Brown
SD-MI-L-HURLEY_01 Lake Hurley-Potter
SD-MI-L-ROOSEVELT_01 Roosevelt Lake-Tripp
SD-MU-L-COAL_SPRINGS_01 Coal Springs Reservoir-Perkins
* See Figure 4 caption regarding mapping error in 2014 Integrated Report
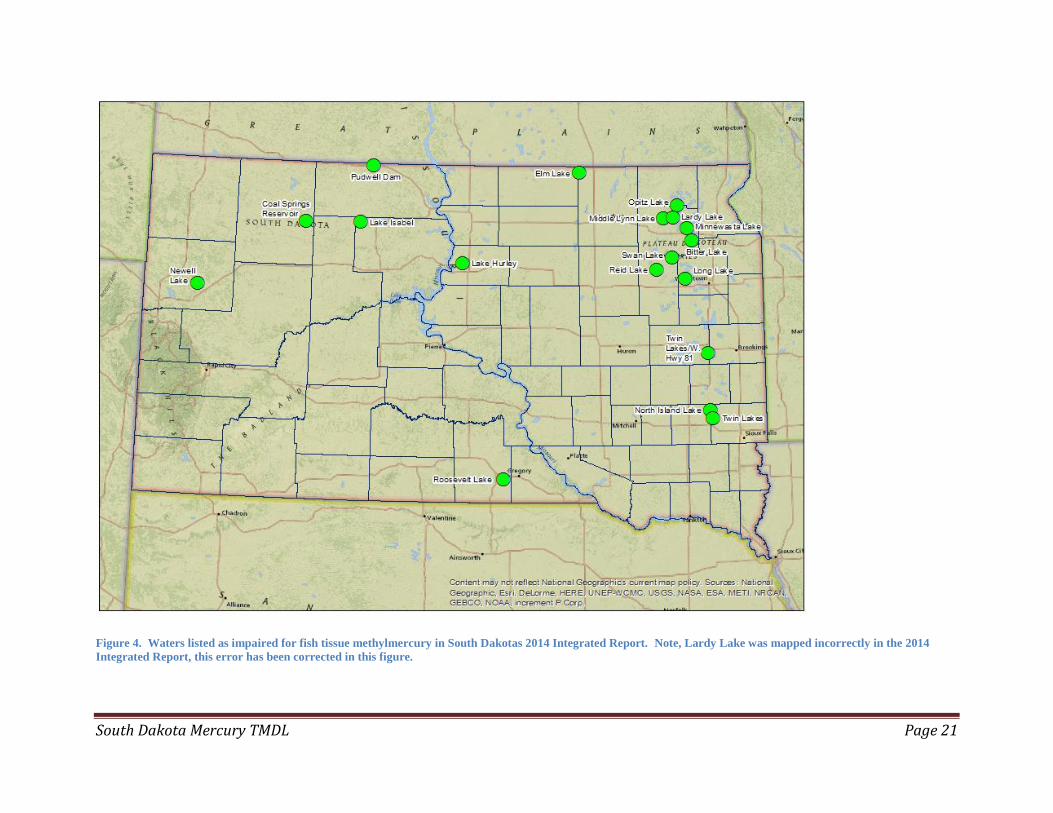
South Dakota Mercury TMDL Page 21
Figure 4. Waters listed as impaired for fish tissue methylmercury in South Dakotas 2014 Integrated Report. Note, Lardy Lake was mapped incorrectly in the 2014
Integrated Report, this error has been corrected in this figure.
South Dakota Mercury TMDL Page 22
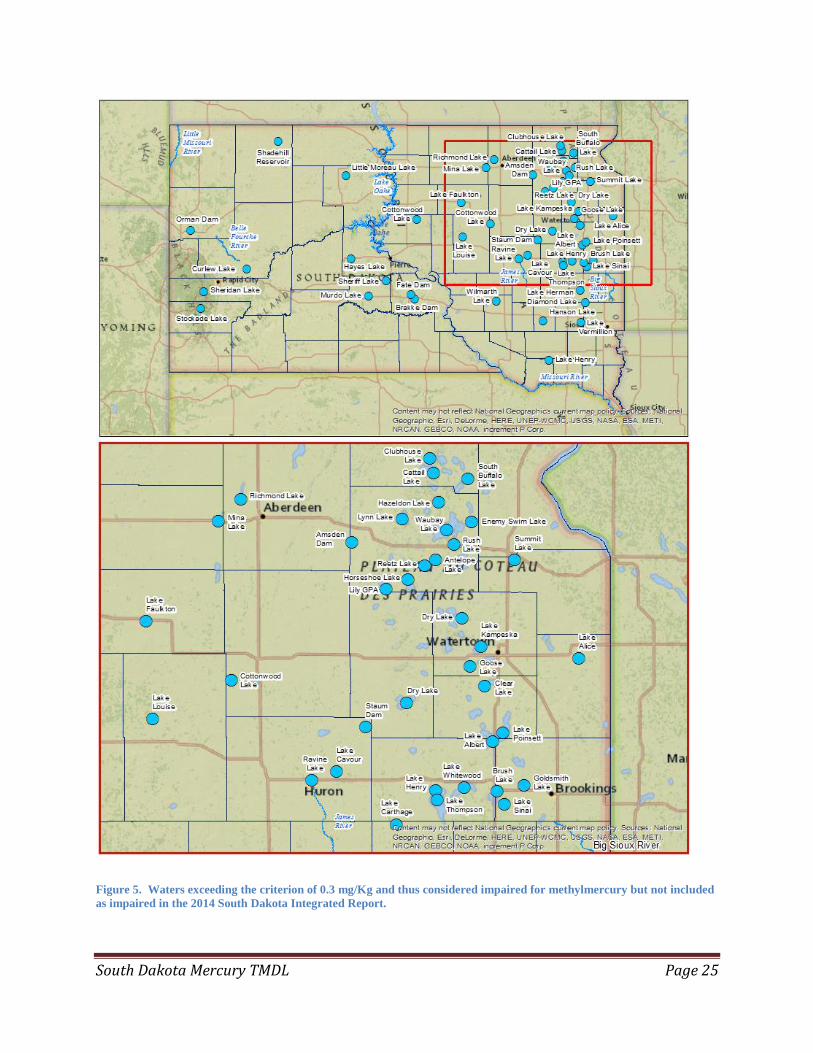
Assuming EPA will formally approve the new methyl mercury in fish tissue criterion, the State
has moved forward with developing a 303(d) listing method for the 2016IR with consultation
from EPA. To maintain consistency with the 2016 IR, the listing method was applied to all
waters with fish tissue data collected from 2006 through the 2015 sampling season. Each
assessment unit was evaluated based on the 95th
percentile of all fish tissue methylmercury
concentrations (inclusive of all species) provided there were a minimum of 10 fish tissue samples
available for a given waterbody. A species specific fish consumption advisory for any
waterbody was also considered grounds for an impairment determination. Using the 2016IR
listing method, South Dakota has determined 61 new waters will be considered impaired in
addition to the 18 waters previously mentioned. These waters are listed in Table 3 and presented
in Figure 5. Two waterbodies with 95th
percentiles above the 0.3 mg/Kg threshold were not
included in the list in Table 3 and are further explained below.
Pactola Reservoir had a single fish out of ten northern pike sampled during 2011 that exceeded
the 0.3 mg/Kg threshold with a concentration of 0.32mg/Kg. The remainder of the samples
consisted of both larger and smaller (older/younger) fish that had a mean concentration of 0.16
mg/Kg. Data from the 1994 and 2005 sampling seasons expanded the dataset to 33 individual
fish representing eight additional species. This supplementary data provided no additional
exceedances of the threshold. Based on the weight of this evidence, Pactola Reservoir was not
considered impaired for methylmercury in fish tissue.
Rosehill Dam in Hand County experienced heavy runoff in the spring of 2010 which
overwhelmed the spillway and caused a significant breach in the dam. Rosehill Dam was
reduced to intermittent stream flow and not considered a viable reservoir to support designated
beneficial uses. As a result, Rosehill was removed from the 2012 303d list for not supporting the
warmwater permanent fish life use. Plans were established to rebuild the structure during 2012;
however the FEMA funds awarded were insufficient to completely replace the structure. As of
2015 SDGFP had resubmitted an application for additional FEMA funding. Due to the
uncertainty of the future existence of this structure, it was not considered impaired for
methylmercury in fish tissue.
For the remaining 61 assessment units listed as impaired in Table 3, the TMDL should be
considered applicable to all but one. Included in the listed waters are several with conditions
which EPA has expressed concerns over. Those concerns as well as the water the TMDL does
not cover are addressed below:
1. Inclusion of riverine systems. The TMDL calculations included riverine systems as part
of the statistical analysis. There were insufficient numbers of riverine samples to conduct
extensive comparisons between them and the lentic systems included in the dataset. The
riverine systems generally had lower concentrations of fish tissue mercury than many of
the lakes or reservoirs. These systems are often interconnected and it is likely that there
is fish migration between the two systems. Due to the interconnectivity and that data
from these systems was used to develop the TMDL, South Dakota expects this TMDL to
be applied to riverine systems.
2. Black Hills Waters. Sheridan and Stockade Lakes are the only waters on the list located
in close proximity to historic mining processes. The Black Hills have an extensive
history of mining activities, the most severe of which occurred in the northern hills,
particularly in the area around Lead and Deadwood. Review of historic mine operations
South Dakota Mercury TMDL Page 23
(Allsman 1938) documented that there were many small claims in what would eventually
become the Sheridan and Stockade Lake watersheds. These claims were small, short
lived, and produced little gold, suggesting that the amount of material mined and thus
their impact on the lakes after they were constructed would be minimal. Beyond the
presence of historic mines, these impairments may be best explained by the species of
fish which are most commonly caught. While most waters in the Black Hills are
dominated by cold water species such as trout, Sheridan and Stockade Lake have a more
diverse species base including largemouth bass, which is the species that resulted in the
lakes impairment status on this list. Based on this information, South Dakota expects that
this TMDL can be applied to Sheridan and Stockade Lakes.
3. Tribal Border Waters. Lake Oahe borders both the Cheyenne River and Standing Rock
Reservations. To the states knowledge, neither of these reservations has adopted any
standards relating to mercury. As such, the South Dakota water quality standards are
more stringent than the tribal standards. Until a more restrictive water quality standard
that is more restrictive than South Dakotas is implemented, the state expects the TMDL
to apply to Lake Oahe within the State of South Dakota.
4. State Border Waters. The Missouri River below Gavins Point Dam forms a border with
the state of Nebraska. Nebraska water quality standards include a fish tissue
methylmercury concentration of 0.215 mg/Kg. This standard is more restrictive than the
0.3 mg/Kg standard used in this TMDL. It is not expected that this TMDL may be
applied to SD-MI-R-LEWIS_AND_CLARK_01 at this time.
As the state continues to monitor fish flesh contaminants there will be previously unassessed
waters where future sampling may indicate impairment due to methylmercury. If the data had
been available during development, these waters would have been included in this TMDL. Any
new impairment listings for waters exceeding the methylmercury listing method documented in
this TMDL will be included through an addendum process described in section 1.3.

South Dakota Mercury TMDL Page 24
Table 3. Waters exceeding the criterion of 0.3 mg/Kg and thus considered impaired for methylmercury but not included
as impaired in the 2014 South Dakota Integrated Report.
SD-BA-L-HAYES_01 Hayes Lake-Stanley
SD-JA-L-COTTONWOOD_01 Cottonwood Lake-Spink
SD-BA-L-MURDO_01 Murdo Dam - Jones SD-JA-L-FAULKTON_01 Lake Faulkton-Faulk
SD-BA-L-SHERIFF_01 Sheriff Dam - Jones SD-JA-L-HANSON_01 Hanson Lake-Hanson
SD-BF-L-ORMAN_01 Belle Fourche Reservoir-Butte SD-JA-L-HAZELDON_01 Hazeldon - Day
SD-BF-R-BELLE_FOURCHE_04 Belle Fourche River - Meade
SD-JA-L-HENRY_01 Lake Henry-BonHomme
SD-BS-L-ALBERT_01 Lake Albert-Kingsbury SD-JA-L-HORSESHOE_01 Horseshoe Lake-Day
SD-BS-L-ANTELOPE_01 Antelope Lake-Day SD-JA-L-LILY_01 Lily GPA-Day
SD-BS-L-BRUSH_01 Brush Lake-Brookings SD-JA-L-LOUISE_01 Lake Louise-Hand
SD-BS-L-CLEAR_H_01 Clear Lake - Hamlin SD-JA-L-LYNN_01 Lynn - Day
SD-BS-L-DIAMOND_01 Diamond Lake - Minnehaha
SD-JA-L-MINA_01 Mina Lake (Lake Parmley)-Edmunds
SD-BS-L-DRY_NO2_01 Dry Lake # 2-Clark SD-JA-L-RAVINE_01 Ravine Lake-Beadle
SD-BS-L-DRY_01 Dry Lake-Codington SD-JA-L-REETZ_01 Reetz Lake-Day
SD-BS-L-ENEMY_SWIM_01 Enemy Swim Lake-Day
SD-JA-L-RICHMOND_01 Richmond Dam-Brown
SD-BS-L-GOLDSMITH_01 Goldsmith Lake-Brookings
SD-JA-L-SOUTH_BUFFALO_01 Buffalo Lake, South-Marshall
SD-BS-L-GOOSE_01 Goose Lake-Codington SD-JA-L-STAUM_01 Staum Dam-Beadle
SD-BS-L-HERMAN_01 Lake Herman-Lake SD-JA-L-WILMARTH_01 Wilmarth Lake-Aurora
SD-BS-L-KAMPESKA_01 Lake Kampeska-Codington SD-JA-R-JAMES_08 James River - Beadle
SD-BS-L-POINSETT_01 Lake Poinsett-Hamlin
SD-LM-R-LITTLE_MISSOURI_01 Little Missouri River-Harding
SD-BS-L-RUSH_01 Rush Lake-Day SD-MI-L-BRAKKE_01 Brakke Dam-Lyman
SD-BS-L-SINAI_01 Lake Sinai-Brookings
SD-MI-L-COTTONWOOD_01 Cottonwood Lake-Sully
SD-BS-L-WAUBAY_01 Waubay Lake-Day SD-MI-L-FATE_01 Fate Dam-Lyman
SD-BS-R-BIG_SIOUX_07 Big Sioux River-Moody
SD-MI-R-LEWIS_AND_CLARK_01
Missouri River-Fort Randall Dam to Sioux City-Yankton
SD-CH-L-CURLEW_01 Curlew - Meade SD-MI-R-OAHE_01 Lake Oahe
SD-CH-L-SHERIDAN_01 Sheridan Lake-Pennington SD-MN-L-ALICE_01 Lake Alice-Deuel
SD-CH-L-STOCKADE_01 Stockade Lake - Custer SD-MN-L-SUMMIT_01 Summit Lake-Grant
SD-GR-L-SHADEHILL_01 Shadehill Reservoir-Perkins
SD-MU-L-LITTLE_MOREAU_NO1_01 Little Moreau Lake #1-Dewey
SD-JA-L-AMSDEN_01 Amsden Dam-Day
SD-VM-L-E_VERMILLION_01 Vermillion Lake-McCook
SD-JA-L-CARTHAGE_01 Lake Carthage - Miner SD-VM-L-HENRY_01 Lake Henry-Kingsbury
SD-JA-L-CATTAIL_01 Cattail Lake-Marshall SD-VM-L-THOMPSON_01 Lake Thompson-Kingsbury
SD-JA-L-CAVOUR_01 Cavour Lake-Beadle SD-VM-L-WHITEWOOD_01 Whitewood - Kingsbury
SD-JA-L-CLUBHOUSE_01 Clubhouse Lake - Marshall
South Dakota Mercury TMDL Page 25
Figure 5. Waters exceeding the criterion of 0.3 mg/Kg and thus considered impaired for methylmercury but not included
as impaired in the 2014 South Dakota Integrated Report.
South Dakota Mercury TMDL Page 26
1.3 TMDL Approach for Multiple Waterbodies and Revision Process
South Dakota is subject to atmospheric mercury deposition from regional and global mercury
emissions sources located outside the state’s boundaries. This process occurs across the entire
state and impacts both assessed and unassessed waters. Given this set of circumstances, a
statewide approach is the most logical for addressing the methylmercury problem. This
approach is not unique as several states have dealt with this problem in some regional fashion,
e.g. Northeast Regional Mercury TMDL and Minnesota Statewide Mercury TMDL. In fact,
EPA has issued guidance to help states develop TMDLs where mercury loadings are
predominantly from air deposition (USEPA 2010; USEPA 2008). In support of this approach
various factors including fish tissue data, landscape similarities, source and loading information,
among others, can be used as the basis for this rationale. This basis serves both as the rationale
for applying this TMDL to the waters included, and as the criteria for evaluating the applicability
of this TMDL to waters that are assessed at a later date.
An essential part of South Dakota’s statewide approach included all available fish tissue data
(inclusive of lakes, reservoirs, rivers, and streams) collected from within the state. This data was
used to establish a baseline from which reductions could be calculated. To apply this TMDL
statewide it is assumed that proportional reductions will occur for all waters of the state. The
level of reduction was based on the 90th percentile standard length walleye concentration as
described in Section 3.3. Waterbodies that exhibit lower methylmercury fish tissue
concentrations could be expected to meet the TMDL goal with fewer or less stringent reductions;
however, this approach provides a higher degree of protection for all waters of the state.
The relationship(s) of the mercury fish tissue data with watershed landscape features and lake
chemistry variables was also evaluated. Current research has indicated that certain combinations
of these sets of factors can exacerbate the methylation of mercury. The question to answer, as
part of the TMDL, was: Are there certain characteristics or combinations of characteristics that
can explain why some waterbodies exhibit higher concentrations of methylmercury in fish tissue
compared to others? It was necessary to determine if methylmercury as a response variable
could be explained by various predictor variables on a statewide or waterbody specific level.
Water level fluctuations and land cover characteristics such as areal wetland coverage were able
to explain 35% of the variability within the distribution of methylmercury fish tissue
concentrations producing a significant regression line. These characteristics can be used to
predict the potential for methylation of mercury. However, they do not affect the statewide
applicability of this TMDL. Although statewide, water level fluctuations and areal wetland
coverage explain some of the variability in the fish tissue concentrations, these features cannot
be changed. The primary driver of the methylation process is the presence of mercury by way of
atmospheric deposition.
Past surveys conducted by the SDDENR have also indicated ecoregional differences in lake
water quality (Stewart et al. 2000). Similar comparisons, for the purposes of the SD mercury
TMDL, were made between water body type (lake vs. reservoir) and geographic location with
regards to mean methylmercury fish tissue concentration. Differences were not significant (see
Section 3.4.6.2 Lakes and Impoundments) resulting in a TMDL that can be applied to any
waterbody type within the geographic boundary of South Dakota that fits the remainder of the
criteria defined in this section.

South Dakota Mercury TMDL Page 27
At the point of drafting this TMDL, standard length fish from Bitter Lake exhibited the highest
methylmercury concentrations measured for fish tissue in South Dakota. The design of this
TMDL provides the necessary limit needed for this maximum observed range of concentrations.
Fish tissue concentrations in Bitter Lake have exhibited a great deal of variability between
sample years (ranging from 0.469 mg/Kg to 0.878 mg/Kg for standard length fish). To ensure
that water quality standards are met, this TMDL is applicable only to waters with standard length
fish tissue methylmercury concentrations less than the observed standard length fish
concentration (0.878 mg/Kg).
Mining has the potential to release mercury into the environment through leaching and direct
runoff from tailing sites. Although mines may result in elevated elemental mercury levels in
downstream waters, this does not always result in elevated fish tissue concentrations.
Methylation processes must work in concert with a source and bioaccumulation before elevations
of fish tissue methylmercury levels are observed. Sites in the Black Hills region of South Dakota
are the most likely to be impacted by historic mining. Methylmercury concentrations in fish
tissue sampling in known mining areas (including Whitewood Creek, Spearfish Creek, and Bear
Butte Creek) have shown no impairments as a result of methylmercury. Continued monitoring is
planned for this region and though unlikely, a possibility remains that a stream segment may be
found with impairments resulting from mine waste. In the event impairments are found in waters
receiving discharge from a mine site, application of this TMDL would be deferred until such
time as adequate data shows the cause of the impairment is not related to the mine or a site
specific mercury TMDL is developed.
The State has reviewed water chemistry data from all NPDES discharges and found no
correlation between their locations and methylmercury impairments. The lack of empirical
evidence and the declining use of mercury in industry suggests the chances of a new discharge
causing this type of impairment are unlikely. However, the application of this TMDL to newly
assessed waters will include a review of those NPDES permits that discharge directly to the
impaired reach. It should also be noted that South Dakota has existing regulations (74:51:01:27.
Lakes not allowed a zone of mixing) which prohibit NPDES discharges to classified lakes.
In summary, this TMDL may be applicable to additional waters of the state if:
It falls entirely within state jurisdiction,
If jurisdiction is shared, it may only be applied to those portions of the water under South
Dakotas’ jurisdiction,
The standard length fish tissue methylmercury concentrations from the water does not
exceed 0.878 mg/Kg,
There are no potential impacts from current or historic gold mining processes,
If it is a river or stream, NPDES discharges do not exceed permitted limits,
The TMDL will meet the water quality standards in the proposed water, and
The original TMDL assumptions (e.g., source contributions, loading capacity, etc.) are
still valid.
Once it is determined a new waterbody or set of waterbodies are appropriate to include in the
statewide mercury TMDL, a revision process will be followed. To revise the original statewide
mercury TMDL to include additional waters, SDDENR will provide appropriate public notice of
the proposed changes, review and address any public comments, explain how the waters meet all
South Dakota Mercury TMDL Page 28
of the applicability criteria described above, and obtain EPA approval of the changes. Other
states have chosen to address revisions to their statewide mercury TMDL as part of the biennial
Integrated Report (IR) submission and SDDENR may use the public notice and EPA approval
pathways already established in the IR process, or may submit revisions using the same process
but not through the IR submission.
Other situations may arise where revisions to this statewide TMDL will require similar public
notice and EPA approval components as adding new waters to the TMDL. As noted in EPA’s
draft Consideration for Revising and Withdrawing TMDLs memo (USEPA 2012), these
situations may include:
Re-allocations between WLAs and LAs (except where a non-regulated LA source is re-
categorized as a regulated point source and given a WLA of the same magnitude; for
example, storm water)
Changes to the MOS, loading capacity, or method for calculating loading capacity
Changes in the applicable water quality standards such that the original TMDL is no
longer sufficient to meet the new standard

South Dakota Mercury TMDL Page 29
2.0 Water Quality Standards
South Dakota water quality standards establish 11 beneficial uses which are assigned to
individual waters based on their characteristics. All waters (both lakes and streams) are assigned
the beneficial use of fish and wildlife propagation, recreation, and stock watering. All streams
are assigned the beneficial use of irrigation. Additional uses are assigned by the state based on a
beneficial use analysis of each water body. Each beneficial use has a set of water quality
standards to protect those uses. The Administrative Rules of South Dakota (ARSD) contain the
water quality standards in Chapter 74:51.
For the evaluation of chronic standards, including geometric means and 30-day averages, a
calendar month is used. While not explicitly described within the water quality standards, this is
the method used in the South Dakota Integrated Water Quality Report (IR) as well as in permit
development.
South Dakota water quality standards specifically address mercury concentrations in the water
column designed to address both human health as well as aquatic health. The more restrictive
concentrations are for human health. Beneficial use (1) Domestic water supply waters, utilizes a
chronic standard of 0.050 µg/L for total mercury. This concentration is based on two routes of
exposure; ingestion of contaminated aquatic organisms and drinking water. The second human
health standard is based on a single route of exposure, ingestion of contaminated aquatic
organisms and is slightly higher at 0.051 µg/L total mercury and applies to beneficial uses:
(2) Coldwater permanent fish life propagation waters;
(3) Coldwater semipermanent fish life propagation waters;
(4) Warmwater permanent fish life propogation waters;
(5) Warmwater semipermanent fish life propagation waters;
(6) Warmwater marginal fish life propagation waters; and
(9) Fish and wildlife propagation, recreation, and stock watering waters.
South Dakota Mercury Water Quality Criteria associated with Beneficial Uses 1-9 prior to 2015
Benefic
ial Uses
Human Health
Criteria for
Use (1)
Freshwater Aquatic
life criteria for uses
(2), (3), (4), (5), (6)
and (9)
Human health
criteria for
uses (2), (3),
(4), (5), (6)
and (9)
FDA based
Advisory
threshold for
uses (2), (3),
(4), (5), (6)
and (9)
WQ
criteria
0.050 µg/L
(water column
, total
mercury)
1.4 µg/L (acute,
dissolved mercury)
0.77 µg/L (chronic,
total recoverable
mercury)
0.051 µg/L
(water column
total mercury)
1.0 mg/Kg
(fish flesh
methylmercu
ry
Additional water quality regulations which apply to mercury impairments include the biological
integrity of waters. Elevated levels of mercury may impair biological integrity, such as through
reduced reproductive success of walleye (Selch 2008). ARSD Section 74:51:01:12 ascertains
that all waters of the state must be free from substances, whether attributable to human-induced
point source discharges or nonpoint source activities, in concentrations or combinations which

South Dakota Mercury TMDL Page 30
will adversely impact the structure and function of indigenous or intentionally introduced aquatic
communities. Additionally, ARSD Section 74:51:01:55 also states that toxic pollutants
(including mercury) may not exist at levels which are or may become injurious to public health,
safety, or welfare. Protection of these narrative criteria is best accomplished by meeting the
most stringent numeric water column criteria 0.050 µg/L of total mercury.
As a part of the 2014 triennial review, SDDENR proposed and the Water Management Board
adopted into the states Surface Water Quality Standards a fish flesh MeHg standard of 0.3
mg/Kg. This concentration is the EPA recommended human health criterion and applicable to
beneficial uses 2, 3, 4, 5, 6, and 9.
A fish flesh based concentration standard requires a linkage to ensure protection of the existing
water column standards. This linkage is accomplished through application of a bioaccumulation
factor (BAF). Bioaccumulation refers to the uptake and retention of a chemical by an aquatic
organism from all surrounding media including water, sediment, and the foods it consumes. It is
similar to, but not the same as a bioconcentration factor (BCF), which differs by only
considering the organisms uptake from the surrounding water as opposed to including the foods
it consumes.
BAFs can vary significantly throughout the nation and even between waterbodies within a
region. The optimal evaluation would involve a BAF based on the specific waters that are
addressed in this TMDL. In the absence of sufficient data, the draft national BAF was evaluated
for applicability in this TMDL.
Due to regional variability, the draft national BAF is typically considered the least preferred
option for developing water quality standards. An exception for use consideration includes when
it will be used as a temporary measure (USEPA 2010). This exception is applicable in the case
of this TMDL. It is expected that the fish tissue criterion will be adopted and the application of
the draft national BAF was used as a verification tool for confirmation that the 0.3 mg/Kg
criterion is protective of South Dakotas existing water quality standards.
The draft national BAFs were derived through three approaches: direct, indirect, and
conversions (modified direct) approaches. Each approach has its own limitation summarized in
greater detail along with the steps used in the development of the values in Appendix A of Water
Quality Criterion for the Protection of Human Health: Methylmercury (USEPA 2001). The
resulting BAFs were based on the geometric mean of field data collected from across the United
States and reported in literature (Table 4).
Table 4. Summary of draft national BAFs and BCF expressed as L/kg for dissolved mercury (USEPA 2001)
Valuea BCF BAF2 BAF3 BAF4
5th percentile 5,300 18,000 74,300 250,000
50th (GM) percentile 33,000 117,000 680,000 2,670,000
95th percentile 204,000 770,000 6,230,000 28,400,000
GSD 3.03 3.15 3.84 4.21
Draft National Values 3.3E+04 1.2E+05 6.8E+05 2.7E+06 aGM=geometric mean; GSD=geometric standard deviation

South Dakota Mercury TMDL Page 31
The three BAF(x) values presented in Table 4 address 2nd
through 4th
order trophic levels.
Trophic levels are the feeding position of organisms in the food chain and higher orders
represent organisms higher in that chain. In the case of this TMDL, it is based on the
accumulation of methylmercury in top predator fish which are a higher trophic order. Thus the
BAF4 is the most applicable for determining if the 0.3 mg/Kg is protective of the existing water
quality standards.
The methylmercury bioaccumulation factor (BAF) can be calculated using the following
generalized equation:
𝐵𝐴𝐹 = 𝐶𝑡
𝐶𝑤
Where:
Ct = Concentration of total methylmercury in the wet tissue
Cw = Concentration of dissolved methylmercury in water
To solve this equation for the most conservative water column standard of 0.050 µg/L total
mercury, the equation is rewritten as:
𝐶𝑡
𝐵𝐴𝐹= 𝐶𝑤
Where:
BAF = Draft national BAF for trophic level 4 = 2.7 x 10⁶ L/kg
Ct = Methylmercury criterion = 0.3 mg/Kg
Cw = Concentration of dissolved methylmercury in water in mg/L
Solving this equation using the values as presented, results in 1.1 x 10⁻⁷
mg/L or 1.1 x 10⁻⁴
µg/L
dissolved MeHg in the water column. The state’s water quality standard is written for total
mercury, therefore the dissolved methylmercury concentration must be further converted for
comparison. This conversion is accomplished by using mercury translators as provided by EPA
and presented in Table 5.
Table 5. Summary of mercury translators for mercury in water. (USEPA 2001)
fd value Lentic Lotic
fd Hgd/Hgt 0.600 0.370
fd MeHgd/Hgt 0.032 0.014
fd MeHgd/MeHgt 0.613 0.490
d=dissolved t=total
Table 5 includes values for both lentic and lotic systems. Lentic waters are defined as “still”
waters such as lakes, ponds, pools, and most reservoirs. Lotic systems are defined as those with
flowing waters such as springs, creeks, and rivers. Bioaccumulation trends are expected to be
different for these two types of systems due to inherent difference in methylation processes, food
web dynamics, mercury loadings, and watershed variables among other factors (USEPA 2001).

South Dakota Mercury TMDL Page 32
The equation used for the conversion of dissolved methylmercury to total mercury is presented
below:
𝑀𝑒𝐻𝑔𝑑
𝐻𝑔𝑡
= 𝑇𝑟𝑎𝑛𝑠𝑙𝑎𝑡𝑜𝑟
Solving the equation for the total mercury (Hgt) factor the following equation is used:
𝑀𝑒𝐻𝑔𝑑
𝑇𝑟𝑎𝑛𝑠𝑙𝑎𝑡𝑜𝑟 = 𝐻𝑔𝑡
Where:
MeHgd = Concentration of dissolved methylmercury
Hgt = Concentration of total mercury
Using the translators as presented in Table 5 (0.032 for lentic systems and 0.014 for lotic
systems) with the dissolved methylmercury concentration previously calculated (1.1 x 10⁻⁴
µg/L)
the following solutions are generated:
Lentic
1.1 𝑥10−4
0.032 = 0.003 (
µ𝑔
𝐿) 𝑡𝑜𝑡𝑎𝑙 𝑚𝑒𝑟𝑐𝑢𝑟𝑦
Lotic
1.1 𝑥10−4
0.014 = 0.008 (
µ𝑔
𝐿) 𝑡𝑜𝑡𝑎𝑙 𝑚𝑒𝑟𝑐𝑢𝑟𝑦
These concentrations are then compared to the most protective water column standard used in
South Dakota (0.050 µg/L total mercury). The water quality standard is over 16 times greater
than the lentic calculation and over 6 times greater than the lotic. It is important at this point to
reiterate regional BAFs may be significantly different than the draft national BAFs from which
these were derived. Discussion of uncertainty in Water Quality Criterion for the Protection of
Human Health: Methylmercury (USEPA 2001) included that there was at least an order of
magnitude in variability. Considering the uncertainty in the draft national numbers, the large
margins between the water quality standard and the calculated values add reasonable certainty
that using the fish tissue concentration 0.3 mg/Kg methylmercury is providing adequate
protection for the existing water quality standards.

South Dakota Mercury TMDL Page 33
3.0 Data Analysis
To determine the necessary mercury reductions needed to attain the TMDL, a single
methylmercury concentration representing current conditions must be derived so a reduction
factor can be calculated to meet the water quality standards. It must be demonstrated that this
concentration is protective of all fish. Common to other regional and statewide mercury
TMDLs, the approach involves selecting a standard length of a single representative species.
These processes are described in Sections 3.1 and 3.2.
In Section 3.3, the Principal of Proportionality explains how changes in atmospheric mercury
deposition are linked to changes in fish tissue methylmercury concentrations. This discussion
outlines a common approach in Stone’s 2011 report and other regional and statewide Hg
TMDLs.
An important link in the process of atmospheric deposition of mercury to its accumulation in
aquatic life is the methylation process which converts mercury into methylmercury, the form
which most readily bioaccumulates. Section 3.4 includes research summaries conducted
partially or entirely within South Dakota, as well as additional analysis conducted by SDDENR
to expand the results of the individual studies. The intent of this review and analysis was to
determine if additional measures could be taken to reduce the methylation rates, thus limiting the
amount of methylmercury available for uptake into the food web.
3.1 Fish Tissue Mercury
A single predator fish species was selected to calculate a consistent level of reductions for the Hg
TMDL. Top predator fish are defined as those species whose position is at the top of the food
chain. These top predator species are the most appropriate as they exhibit the highest levels of
toxin bioaccumulation of methylmercury and are most commonly consumed. In South Dakota,
there are several species which fit this description and the following section describes the
selection process. Differences in the selection for this TMDL, from those suggested by Stone in
Phase I Data Collection and Assessment for South Dakota Mercury TMDL Development can be
most adequately explained by the four additional years of data collection which greatly expanded
the useable dataset. A summary of all individual fish tissue samples is available in Appendix D.
Regional mercury TMDLs in Minnesota, New Jersey, and the Northeast United States each
examined several species of top predator fish. Species distribution and relative fish tissue
mercury concentrations were used as a basis for selection. These species are typically the most
sought after and consumed by anglers making them the species of greatest concern. The two
most widely distributed top predator fish in South Dakota are walleye (Sander vitreus) and
northern pike (Esox lucius) representing over 50% of individual fish sampled. Largemouth bass
(Micropterus salmoides) and smallmouth bass (Micropterus dolomieu) have been selected in
other mercury TMDLs. The Micropterus genus is found throughout South Dakota, but was not
evaluated due to low numbers of individual fish in the dataset.
In South Dakota, thirty three species of fish have been sampled for mercury since 1994.
Seventeen of those species had at least one fish that exceeded the 0.3 mg/Kg threshold (Table 6).
Individual samples separate the Sander genus into walleye, sauger, and hybrids of the two
South Dakota Mercury TMDL Page 34
referred to as saugeye. For the purposes of this assessment, walleye (n=2533) and the other
members of the Sander genus (n=55) were grouped together.
Table 6. Number of fish samples with methylmercury concentrations above 0.3 mg/Kg 1994-2014 and mean length of
population (mm).
Species Total
N
N>0.3 mg/Kg MeHg
Length (mm)
Species Total
N
N>0.3 mg/Kg MeHg
Length (mm)
Bigmouth Buffalo 2 1 Insf1 Northern Pike 1034 761 615
Black Bullhead 687 25 274 Shorthead Redhorse 25 2 Insf1
Black Crappie 401 86 242 Smallmouth Bass 108 27 299
Bluegill 285 34 189 Walleye/Sauger 2637 1238 384
Channel Catfish 472 68 446 White Bass 215 118 350
Common Carp 177 7 472 White Crappie 22 6 244
Freshwater Drum 12 4 Insf1 White Sucker 204 10 417
Goldeye 20 4 Insf1 Yellow Perch 690 139 232
Largemouth Bass 503 372 373
1 –Insufficient sample size: Population variance of walleye (highest), northen pike (lowest), and largemouth bass indicated a
minimum sample size of 60 -135 individuals is required to calculate a mean with an accuracy of 95%. Other species are
expected to have a similar variance and a minimum N of 100 was set for calculating mean lengths.
Fish tissue sampling methodologies changed between initial data collection in 1994 and more
recent collections. Historic data collection (prior to 2010) primarily utilized a process in which
five similar length fish of the same species were composited to obtain a single mean mercury
concentration for all five fish. This method is poorly suited for data analysis as it does not
provide any kind of data distribution. However, in instances where studies were conducted in
which individual fish were analyzed, or where multiple five fish datasets were collected at
different sizes (creating variability between the measurements) the data was included in the
analysis. As a result of this qualification for using the pre 2010 data, the majority of fish tissue
analysis used for this TMDL focused on collections between 2010 and 2014. In 2010, the
methodologies changed, where up to 10 individual fish of a species were sampled. Each
individual fish was then analyzed separately creating variability within the datasets.
To determine the more protective species, a comparison between walleye and northern pike was
completed. The population used for evaluation was limited to fish of both species greater than
15 inches (38 cm). Larger fish exhibit higher concentrations of mercury and the length of 15
inches is a common minimum harvest length limit for walleye in South Dakota. Northern pike
reach longer lengths more quickly than walleye, and minimum length limits for northern pike are
uncommon in South Dakota, but generally anglers target larger fish. Limiting the dates to 2010
to 2014 removed bias attributed to composite sampling.
Data in Table 7 presents both the mean and median concentrations of methylmercury in
individual fish for walleye and northern pike. Mean values observed in catchable walleye were
higher than those observed in northern pike while median concentrations were equal. Using the
walleye data to establish the reduction target would provide a margin of safety inclusive of the
other predator species.
South Dakota Mercury TMDL Page 35
Table 7. Methylmercury concentration in northern pike and walleye greater than 15 inches (38 cm) collected in South
Dakota during 2010-2014.
Species N Mean Hg (mg/Kg) Median Hg (mg/Kg)
Northern Pike 473 0.470 0.40
Walleye/Sauger 431 0.489 0.40
3.2 Standard Size Predator Fish
After selecting walleye as the most protective species, a methylmercury concentration must be
derived or calculated for this population. The reduction factor needed to meet the TMDL is
based on this standardized methylmercury concentration. This process uses a standard length
walleye for which methylmercury concentrations may be calculated. Both the selection of the
standard length walleye and the method for calculating the methylmercury concentrations are
described below.
Bioaccumulation of methylmercury is a chronic issue where as a fish ages the concentration of
methylmercury in its tissue increases. Fish length is correlated to age and in South Dakota,
walleye may be expected to reach a length of 15 inches between 3 and 4 years of age. It may
take up to 7 years to reach 20 inches of length (Wolf et al. 1994). It becomes important to select
a single, specific length to represent the methylmercury concentration. This specific length is
the standard length for that species (walleye). Developing a standard length for concentration
calculations provides the potential for comparisons to be drawn between waterbodies. More
importantly, it allows for comparisons from year to year for any individual waterbody.
Comparisons through time will provide insight into TMDL attainment in the future. As interim
goals are reached for reducing mercury, concentrations of methylmercury calculated for the
standard length walleye should diminish.
To calculate the standard length, South Dakota used the walleye lengths collected as part of the
mercury dataset (Appendix D) to establish a mean length (n=2,637). The sampling methods used
for the mercury dataset targeted fish lengths most likely to be consumed by the public. This is
consistent with the Northeast and New Jersey TMDLs where the mean population lengths of
predator fish were also used to derive a protective methylmercury level in fish most likely to be
consumed. Using the South Dakota dataset, the mean length of walleye was calculated at 15.1
inches (38.4 cm).
Harvest regulations in South Dakota vary between waterbodies, however the most commonly
used minimum length limit for walleye harvest is 15 inches. This is typically accompanied with
a regulation where only one fish greater than 20 inches may be harvested. The mean length of
15.1 inches (38.4 cm) for the mercury dataset falls within the size class of most commonly
harvested and consumed walleye. It is also similar to the size selected for the Minnesota
Statewide Mercury TMDL where a 40 cm walleye was chosen. A distinction between the
minimum harvest length of 15 inches (as implemented from fisheries management objectives
created by SDGFP) and the standard length calculated from the mercury dataset of 15.1 inches
needs to be emphasized. The standard length of 15.1 inches (38.4 cm) calculated from the
mercury dataset was used to develop the TMDL target. The standard length of 38.4 cm was
referred to as “WE38” for the remaining steps in the TMDL reduction process.
South Dakota Mercury TMDL Page 36
To generate the methylmercury concentrations for a WE38 (standard length) walleye in each
waterbody for a given sample year, a best fit trend line was plotted. The methylmercury fish
tissue concentration is plotted on the y-axis and the corresponding fish length is plotted on the x-
axis. Once the trend line is plotted, the intercept of that trend line with WE38 equates to the
concentration used for the reduction goal from that waterbody. The use of WE38 “standardizes”
the data and provides a baseline to assess attainment of the TMDL.
The best fit trend line (regression) approach was used to determine the annual WE38 mercury
concentration where sufficient walleye samples were available for individual waterbodies. In the
mercury dataset some waterbodies were sampled more than once. This resulted in multiple
WE38 calculations for those waterbodies. Four of the equations resulted in negative values and
were omitted from all further calculations. The equations for the trend lines may be found in
Appendix C. Using the WE38 calculations, a single value representing all waters was selected
to calculate the reduction factor. Selecting the 90th
percentile of these values (Appendix C)
provides a concentration of 0.669 mg/Kg methylmercury. .
Table 8. Bitter Lake standard length walleye (WE38) methylmercury concentrations.
To ensure that a methylmercury concentration of
0.669 mg/Kg provides an existing condition that
encompasses most waterbodies, it was compared to
Bitter Lake, which has exhibited the highest WE38
values in South Dakota. Bitter Lake, as a result of
the high concentrations, is the most intensively
sampled (for methylmercury) water in the state of
South Dakota. Table 8 shows the WE38
concentrations calculated from Bitter Lake. The
0.669 mg/Kg exceeds the concentrations observed
from the five most recent years of Bitter Lake
sample data and provides a significant level of
protection for South Dakota waterbodies.
Considering the high variability observed in Bitter
Lake, other waters in the state may be expected to exhibit similar variations from year to year.
For this TMDL to effectively apply to a waterbody the standard length fish concentrations should
not exceed those measured in Bitter Lake. If subsequent samples from waters exceed the
maximum measured standard length walleye concentration observed from Bitter Lake (>0.878
mg/Kg in Table 8), individual TMDLs will need to be drafted to address them.
The WE38 calculation of 0.669 mg/Kg was compared to all the individual fish tissue samples
across all species (Appendix D), in which it fell at the 92nd
percentile. Using 0.669 as the value
from which to calculate reductions will result in all species of fish attaining the TMDL goal.
Therefore, the 90th
percentile of WE38, established at 0.669 mg/Kg, will be used to calculate the
reduction factor needed to meet the water quality standard and the TMDL.
Site MeHg (mg/Kg) Year
Bitter Lake-Day 0.469 2006
Bitter Lake-Day 0.536 2005
Bitter Lake-Day 0.558 2013
Bitter Lake-Day 0.567 2003
Bitter Lake-Day 0.649 2007
Bitter Lake-Day 0.724 2001
Bitter Lake-Day 0.878 2000

South Dakota Mercury TMDL Page 37
3.3 Principle of Proportionality
The principal of proportionality for mercury in air and biota states that a decrease in atmospheric
mercury deposition should decrease mercury in fish tissue. Multiple states, including Minnesota,
Wisconsin, and Florida, have reported a decrease in fish methylmercury concentrations when
mercury emissions or loadings were reduced from baseline levels (MPCA 2007). Several
dynamic, ecosystem scale models such as the Mercury Cycling Model (MCM) and IEM-2M
assume that, at steady state (i.e., over long time scales), reductions in fish mercury
concentrations will be proportional to reductions in mercury inputs. When atmospheric
deposition is the main source of mercury to a given water body, these models predict a linear
response between changes in deposition, ambient concentrations in water and sediments, and fish
mercury levels. Below, an approach is outlined, deriving a simplified relationship between
percent reductions in air deposition load and fish tissue concentrations at steady state that draws
on this same assumption of long-term proportionality from more complex modeling frameworks
(Northeast Regional Mercury TMDL 2007).
For this to be applicable for estimating mercury load reductions in South Dakota, the following
assumptions must be applied:
Decreases in emissions from sources lead to comparative decreases in the deposition rate
in South Dakota.
Decreases in deposition lead to comparative decreases in mercury loading to lakes and
rivers.
A decrease in the mercury loading to a lake or river leads to a comparative decrease in
mercury concentrations in the fish of that lake or river (MPCA 2007).
An example of a proportional reduction is explained in the Minnesota Statewide Mercury TMDL
where a 50% reduction of mercury emissions in Minnesota was expected to result in a 5%
reduction in mercury deposition in Minnesota. The 5% reduction in Minnesota mercury
deposition is then assumed to cause a 5% reduction in methylmercury in fish (MPCA 2007).
Also, if global anthropogenic mercury emissions were reduced by 50%, Minnesota’s mercury
deposition and fish tissue mercury would be expected to decrease by 35% (MPCA 2007). The
principle of proportionality assumes environmental factors such as bioavailability to be constant
and unaffected by atmospheric deposition rates (MPCA 2007).
The reduction factor (RF) will be used to establish the mercury reductions necessary to attain the
fish tissue standard of 0.3 mg/Kg. The current fish tissue concentration, as established
previously, for WE38 is 0.669 mg/Kg. To calculate the RF, the following equation was used.
The resulting RF from this equation is 55.2%.
RF = (WE38 – 0.3)/WE38
55.2%=(0.669-0.3)/0.669

South Dakota Mercury TMDL Page 38
3.4 Factors Affecting Methylation Processes in South Dakota
Methylation is the process through which inorganic forms of mercury are converted by microbes
to the more harmful organic form, methylmercury. Methylation, a complex process in itself,
occurs at different rates in different water bodies. Water chemistry, land use, habitat features and
other potential factors which could affect the rate of methylation, are complex and interact with
each other in ways unknown. These potential factors also change through time. Deposition rates
vary throughout the state, and are presented in greater detail in section 5.1 and shown in Figure
16. Likewise, methylmercury fish tissue concentrations vary throughout the state. However,
these variations are not coincident; the majority of waters with the highest concentrations (waters
listed in the 2014 integrated report) are located in the Northeast part of the state while the areas
which receive the greatest deposition rates are located in the Southeast part of the state.
Use of a single mercury reduction factor for multiple water bodies that clearly have different fish
tissue concentrations and do not follow mercury depositional patterns necessitates a review of
the factors that influence the variance in methylation rates. A great deal of research has been
conducted across the nation’s ecosystem types addressing the variables which influence
methylation rates. Assessments that focused partially or entirely on South Dakota waters include
a doctoral dissertation by Trevor Selch (Selch 2008), graduate studies by McCutcheon
(McCutcheon 2009) and Betemariam (Betemariam 2010), a peer-reviewed journal article by
Hayer (Hayer et al. 2011), as well as a USGS report released in 2014 (Wentz et al. 2014). These
studies were reviewed and a summary of pertinent findings is provided in the following section.
Where sufficient data was available, additional analysis was conducted by SDDENR to test the
conclusions that were drawn in these studies.
3.4.1 Selch 2008
This study investigated the influence of fluctuating water levels on Hg concentrations in adult
walleye. Evaluated parameters included watershed area to lake surface area ratio, lake volume to
surface area ratio, chlorophyll a concentration, pH, alkalinity, and percent change in surface area
between wet (2000) and dry (1987) years. These parameters were compared to mercury
concentrations in adult walleye (35-50 cm in length). The only significant relationship (p<.05)
found was between fish mercury and percent change in lake surface area (Table 9).
Table 9. Results from Pearson Correlation Analysis comparing mean walleye mercury concentrations with
environmental variables from 10 glacial lakes in Eastern South Dakota (Selch 2008).
Parameter r p
Watershed area to Lake surface area ratio -0.45 0.192
Lake volume to surface area ratio 0.397 0.257
Chlorophyll a concentration 0.391 0.263
pH -0.006 0.987
Alkalinity 0.45 0.192
Conductivity 0.252 0.483
Percent change in surface area wet to dry years 0.759 0.011

South Dakota Mercury TMDL Page 39
The report also discussed differences between the date of water level expansions in northeastern
South Dakota amongst lakes despite nearly uniform rainfall. “Although the region experienced
relatively uniform precipitation during the extended wet period of the mid-1990’s, some lakes
expanded faster and several years earlier than others. Lakes from early water-level expansions
may be receding in MeHg production, and reduced MeHg production within a lake should result
in lower total Hg concentrations in the resident fish communities.” (Selch 2008).
3.4.2 McCutcheon 2009
McCutcheon (2009) evaluated the link between water quality parameters and fish tissue mercury
for walleye and pike in South Dakota lakes and impoundments. The best predictors for fish tissue
mercury were tested in four models to find the model that best predicted fish tissue mercury.
Water quality data was divided into lakes or impoundments and fish tissue into either walleye or
northern pike. Phosphorus was the best predictor of fish tissue mercury in the northern pike-
impoundment scenario. The other scenarios, northern pike-natural lakes, walleye-impoundments
and walleye-natural lakes did not show any significant relationship between phosphorus and fish
tissue mercury.
McCutcheon’s (2009) water quality data included alkalinity, pH, dissolved oxygen (DO),
dissolved organophosphate as P, total phosphorus, total dissolved phosphorus, Secchi disk depth
(SDD), specific conductance, total solids (TS), total dissolved solids (TDS), total suspended
solids (TSS), turbidity, trophic state index for phosphorus (TSI-P) and Secchi disk depth (TSI-
SDD), sulfate, and dissolved organic carbon (DOC). Two methods, linear regression and AIC
model selection, were used to select variables. Advisory lakes (more than one exceedance of fish
mercury >1.0 mg/Kg) were compared to non-advisory lakes (fish mercury <1.0 mg/Kg) using
boxplot screening and correlations based on linear regression with composite data that included
all fish species and all waterbodies. The composite data was later divided into species, walleye or
pike; and lake type, impoundment or natural. Lakes were divided into impoundments and natural
lakes to assess any difference in fish mercury response between the two. Water quality
parameters of impoundments and natural lakes were found to be “comparable but not identical.”
3.4.3 Betemariam 2010
Betemariam (2010) compared land cover and habitat characteristics in ten advisory and non-
advisory (based on mean Hg fish tissue > 1 mg/Kg) lakes’ watersheds to determine if links
existed between land cover and advisory status. Though no significant differences in land cover
were found, advisory lakes tended to have lower wetland cover, shallower slope, higher organic
matter (OM) and higher shoreline to lake area ratio than non-advisory lakes.
This study further compared six non-advisory lakes to four advisory lakes to discern possible
land use differences between the lakes that might point to a mechanism for increased fish tissue
mercury in advisory lakes. There was no statistical difference between advisory and non-
advisory lakes in catchment area to lake area ratio (C/L) (p=0.517), wetland cover (p=0.352),
slope (p=0.927), or shoreline to lake area ratio (p=1.000). Non advisory lakes had higher mean
wetland coverage, lower C/L ratios, shallower slopes, lower grass and higher cultivated land than
advisory lakes although none of the differences were significant.
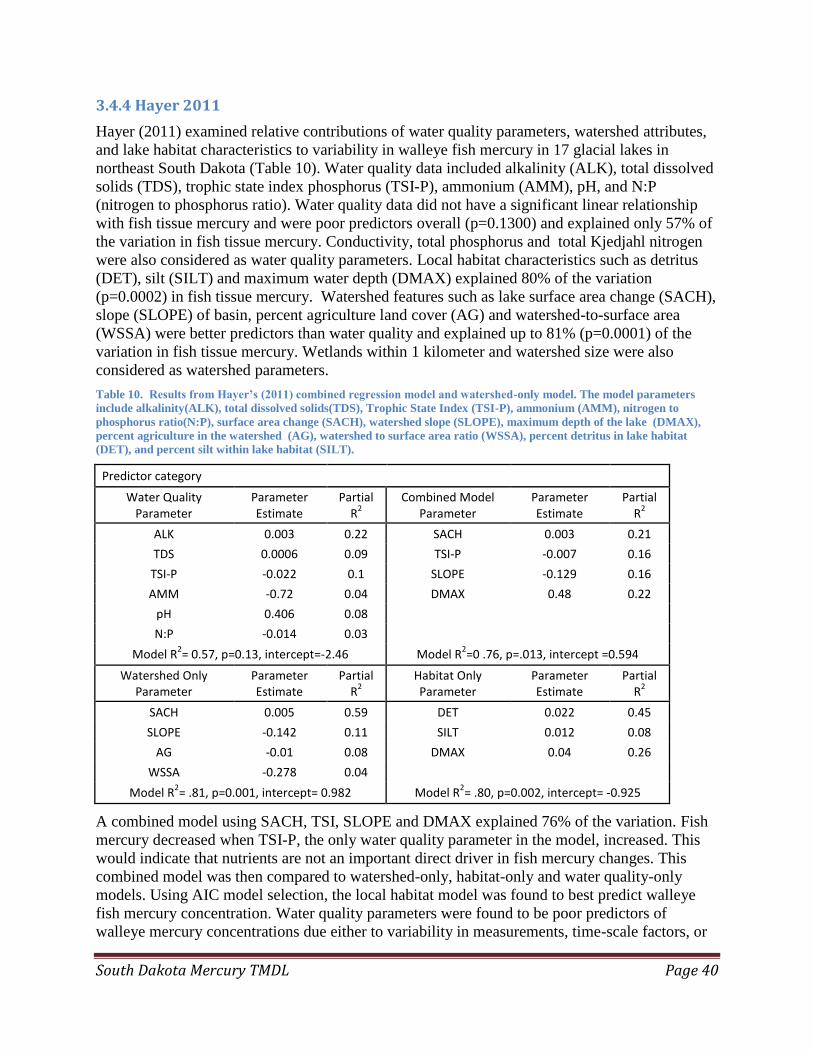
South Dakota Mercury TMDL Page 40
3.4.4 Hayer 2011
Hayer (2011) examined relative contributions of water quality parameters, watershed attributes,
and lake habitat characteristics to variability in walleye fish mercury in 17 glacial lakes in
northeast South Dakota (Table 10). Water quality data included alkalinity (ALK), total dissolved
solids (TDS), trophic state index phosphorus (TSI-P), ammonium (AMM), pH, and N:P
(nitrogen to phosphorus ratio). Water quality data did not have a significant linear relationship
with fish tissue mercury and were poor predictors overall (p=0.1300) and explained only 57% of
the variation in fish tissue mercury. Conductivity, total phosphorus and total Kjedjahl nitrogen
were also considered as water quality parameters. Local habitat characteristics such as detritus
(DET), silt (SILT) and maximum water depth (DMAX) explained 80% of the variation
(p=0.0002) in fish tissue mercury. Watershed features such as lake surface area change (SACH),
slope (SLOPE) of basin, percent agriculture land cover (AG) and watershed-to-surface area
(WSSA) were better predictors than water quality and explained up to 81% (p=0.0001) of the
variation in fish tissue mercury. Wetlands within 1 kilometer and watershed size were also
considered as watershed parameters.
Table 10. Results from Hayer’s (2011) combined regression model and watershed-only model. The model parameters
include alkalinity(ALK), total dissolved solids(TDS), Trophic State Index (TSI-P), ammonium (AMM), nitrogen to
phosphorus ratio(N:P), surface area change (SACH), watershed slope (SLOPE), maximum depth of the lake (DMAX),
percent agriculture in the watershed (AG), watershed to surface area ratio (WSSA), percent detritus in lake habitat
(DET), and percent silt within lake habitat (SILT).
Predictor category
Water Quality Parameter
Parameter Estimate
Partial R
2
Combined Model Parameter
Parameter Estimate
Partial R
2
ALK 0.003 0.22 SACH 0.003 0.21
TDS 0.0006 0.09 TSI-P -0.007 0.16
TSI-P -0.022 0.1 SLOPE -0.129 0.16
AMM -0.72 0.04 DMAX 0.48 0.22
pH 0.406 0.08
N:P -0.014 0.03
Model R2= 0.57, p=0.13, intercept=-2.46 Model R
2=0 .76, p=.013, intercept =0.594
Watershed Only Parameter
Parameter Estimate
Partial R
2
Habitat Only Parameter
Parameter Estimate
Partial R
2
SACH 0.005 0.59 DET 0.022 0.45
SLOPE -0.142 0.11 SILT 0.012 0.08
AG -0.01 0.08 DMAX 0.04 0.26
WSSA -0.278 0.04
Model R2= .81, p=0.001, intercept= 0.982 Model R
2= .80, p=0.002, intercept= -0.925
A combined model using SACH, TSI, SLOPE and DMAX explained 76% of the variation. Fish
mercury decreased when TSI-P, the only water quality parameter in the model, increased. This
would indicate that nutrients are not an important direct driver in fish mercury changes. This
combined model was then compared to watershed-only, habitat-only and water quality-only
models. Using AIC model selection, the local habitat model was found to best predict walleye
fish mercury concentration. Water quality parameters were found to be poor predictors of
walleye mercury concentrations due either to variability in measurements, time-scale factors, or
South Dakota Mercury TMDL Page 41
complex chemical interactions. Watershed and habitat characteristics are more predictive of fish
mercury than water quality parameters but further investigation is needed outside of the northeast
region of South Dakota.
3.4.5 Wentz 2014
The 2014 USGS report, ‘Mercury in the Nations Streams- Levels, Trends, and Implications’,
provided a broad summary of mercury related issues and survey of possible factors controlling
methylmercury production. The report referenced three studies in which methylmercury
concentrations in streams showed a strong correlation with wetland abundance. For each 10%
increase in upstream wetland area, increases of approximately 0.1 part per trillion of
methylmercury were found in stream water.
3.4.6 Methylation Rate Analysis
While studies of factors affecting methylation have been completed in South Dakota (Selch
2008, McCutcheon 2009, Betemariam 2010, Hayer 2011) and elsewhere (Greenfield 2001 and
Wentz 2014), the South Dakota studies focused on a limited number of lakes that tended to be
clustered in the northeast region. A statewide approach with 4-7 years of additional data beyond
the South Dakota specific studies was needed to expand the conclusions of those authors in order
to determine how water quality, watershed, and habitat factors affect fish tissue methylmercury.
Including more lakes in the regression analysis (SDDENR n=84 vs. Hayer’s n=17) is vital to
capturing the statewide response. Water quality, land use, and habitat data was compiled and
compared to standard length fish mercury to assess correlations and identify important factors
controlling methylation. Standard length fish calculations from the preceding section (Standard
Size Predator Fish) were used to develop reductions for the TMDL. Those calculations resulted
in a dataset that could be used to compare methylation rates between waterbodies.
3.4.6.1 Methylation Rate Data
Fish tissue methylmercury data was standardized and analyzed according to the Standard Size
Predator Fish section. Included in the data set were all standard length fish calculations for
walleye, northern pike, and largemouth bass. These species are all considered top predator fish
and are likely to have higher methylmercury concentrations relative to other fish species. To
provide for the largest dataset and include as many water bodies as possible, MeHg
concentrations in these three species were compared at their standard lengths, which were
calculated as the mean length for the species population sampled. Due to low numbers of waters
with adequate paired samples for a correlation between largemouth bass and walleye,
comparisons were only drawn between northern pike and walleye as well as northern pike and
largemouth bass. Correlations between northern pike and walleye were strongest (n=27,
r2=0.6805, p=0.0000). Northern pike to largemouth bass exhibited a slightly lower correlation
(n=11, r2=.5059, p=0.0141).
Water chemistry data collected within South Dakota was used to complete the chemical
attributes analysis. Watershed data included HUC 12 – scale land use from the 2013 Cropland
Data Layer (USDA 2014), wetland area from National Wetland Inventory (NWI) (USFWS
2014), and delineated HUCs using the National Hydrological Dataset (NHD) (USDA NRCS
2014). Habitat data included lake elevations for analysis of water level fluctuations from
SDDENR Water Rights database (SDDENR 2014). Other lake habitat data such as shoreline,

South Dakota Mercury TMDL Page 42
lake surface area, maximum depth and elevation were obtained from a variety of sources: the
DENR Lake Assessment report (SDDENR 1995), South Dakota Game Fish and Parks Lake
Surveys (SDGF&P 2014) and Bureau of Reclamation’s (BOR) online database (BOR 2014).
SDGF&P provided the most comprehensive lake information but if the survey was from a very
wet year, the lake data was adjusted if the other sources listed very different numbers. Lake
surface area can change drastically from year to year in shallow lakes. Two lake area outliers,
Lake Thompson and Waubay Lake were corrected using the USGS’s NHD layer. SDDENR’s
Lake Assessment report and SDGF&P Lake Survey do not list the data points by year, and
instead include an estimate for the above parameters. The data from Water Rights and BOR is of
greater detail and there is access to lake depth data points by month and year which provides a
more reliable estimate of water level fluctuations by providing an interannual standard deviation
of the lake elevation.
Watershed-scale factors that could affect methylation rates are the percent cover of land use
types found within each lake’s 12 digit HUC, watershed area, and lake area to watershed ratio.
Land use type includes open water, developed land, forest, wetland, herbaceous non-ag,
cultivated crop, and hay percent cover. Habitat variables include lake area, shoreline perimeter,
maximum lake depth, wetland cover within 500m of the lake, and lake level fluctuations. Some
lakes had more than one year of data on mean fish tissue mercury and up to three fish species,
walleye, northern pike, and largemouth bass. Lakes with multiple years of measurement were
weighted with a year-weight variable and lakes with multiple fish species and/or years were
weighted with a species-year-weight variable so that each lake had a total weight of one in the
analysis. An example of this would be Bitter Lake in which 7 independent sample years are
represented, thus the weight of each sample year in the final calculation is 0.143 (1/7).
3.4.6.2 Lakes and Impoundments
McCutcheon (2009) analyzed lakes and impoundments separately. With a larger dataset and
using a statewide approach, all lakes and impoundments would potentially be subjected to the
same TMDL reduction. Mercury advisory lakes, defined by Betemariam (2010), are currently
found throughout the state. It was suspected that the lake type (impoundment vs. natural) would
have no bearing on whether a lake would be listed for fish tissue methylmercury. First, it was
necessary to determine if there were any differences in water chemistry or fish tissue
methylmercury between lake types, impoundments and natural. T-tests and Chi-square tests
were used to evaluate differences between lake types. SDDENR found that natural lakes and
impoundments do have some differences in water column chemistry. Mean Total Kjeldahl
Nitrogen (TKN), mean log chlorophyll a and mean pH differ between natural lakes and
impoundments. There was no significant difference between natural lakes and impoundments
exhibited in the remaining parameters of Table 12. Significant water chemistry differences were
not exhibited between advisory and non-advisory lakes (Table 11).

South Dakota Mercury TMDL Page 43
Table 11. Mean water chemistry differences between non-advisory lakes and advisory lakes, lakes and impoundments
(n=59 for walleye fish mercury, n=36 for water quality) .
Advisory and Non-Advisory Lakes Lakes and Impoundments
t-test p t-test p
Total Phosphorus (TP) 0.7995 0.4292 -1.8880 0.0671
Total Kjeldahl Nitrogen (TKN) 0.1433 0.8868 -5.6619 0.0000
Log Chlorophyll a -0.7630 0.4514 -3.9649 0.0004
pH 1.4671 0.1510 -6.5006 0.0000
Secchi 1.7083 0.0973 1.1214 0.2704
Ammonia (NH3) -0.8002 0.4288 -1.6604 0.1055
Nitrates (NO2+NO3) 0.6067 0.5478 -0.9587 0.3441
Walleye Fish Tissue Mercury 12.0796 0.0000 -0.5761 0.5668
A Chi-squared test of independence was used to assess if the small subset of impoundments
differed from the larger pool of all lake types according to the advisory status outcome. If a lake
has a fish tissue measurement equal to or greater than 0.3 mg/Kg, it was given the advisory lake
status for the year in which the sample was taken. If the fish tissue measurement is less than
0.3mg/Kg, then it is classified as a non-advisory lake. The Chi-squared test for independence
was not significant, as shown in Table 12, indicating that the outcome (>0.3 vs. <0.3) was
independent of lake type and that natural lakes and impoundments can be treated as a single
group (Chi-squared=0.3725, p=0.5416).
Table 12. Chi-squared independence test between lake type and outcome >0.3 (yes or no). Insignificance indicates
independence, i.e., the outcome is independent of lake type.
Lake Type x advisory status [mean WE38>.3)(Yes,No)
(Impoundment n=9, Lake n=52)
Chi-square df p
Pearson Chi-square 0.372549 df=1 0.5416
M-L Chi-square 0.380518 df=1 0.5373
Mean mercury concentrations in walleye (WE38) were slightly higher in natural lakes than
impoundments with a mean value of 0.3077 mg/Kg vs. 0.2657 mg/Kg, respectively. However,
the difference exhibited between lake types was not significant, (t=-0.5760, p=0.5667) and their
group variance was similar (F= 1.7354, p=0.4149) (Figure 6).

South Dakota Mercury TMDL Page 44
Figure 6. Boxplot of fish tissue mercury vs waterbody type. (t=-0.5760, p=0.5667) (F=1.7354, p=0.4149).
3.4.6.3 Chemical Attributes
McCutcheon (2009) found that correlations exist between water quality characteristics and fish
tissue mercury and phosphorus predicts high fish mercury under a specific scenario (northern
pike in impoundments). Greenfield (2001) found that pH was the best predictor of yellow perch
tissue mercury in Wisconsin. As SDDENR found that there is no meaningful difference between
impoundments and natural lakes, analysis was performed on all lake types with a dataset that had
expanded greatly since the time of McCutcheon’s report (2009).
Pearson correlations were calculated to quantify relationships between water quality parameters
and fish tissue mercury. Pearson correlations are the covariance of a pair of (x,y) variables
divided by the standard deviation and are used to examine correlation unbiased by the units of
the variables (Quinn and Keough 2002). Correlations between water quality variables and fish
tissue mercury are shown in Table 13 with bolded values representing significant correlations of
p<.05.
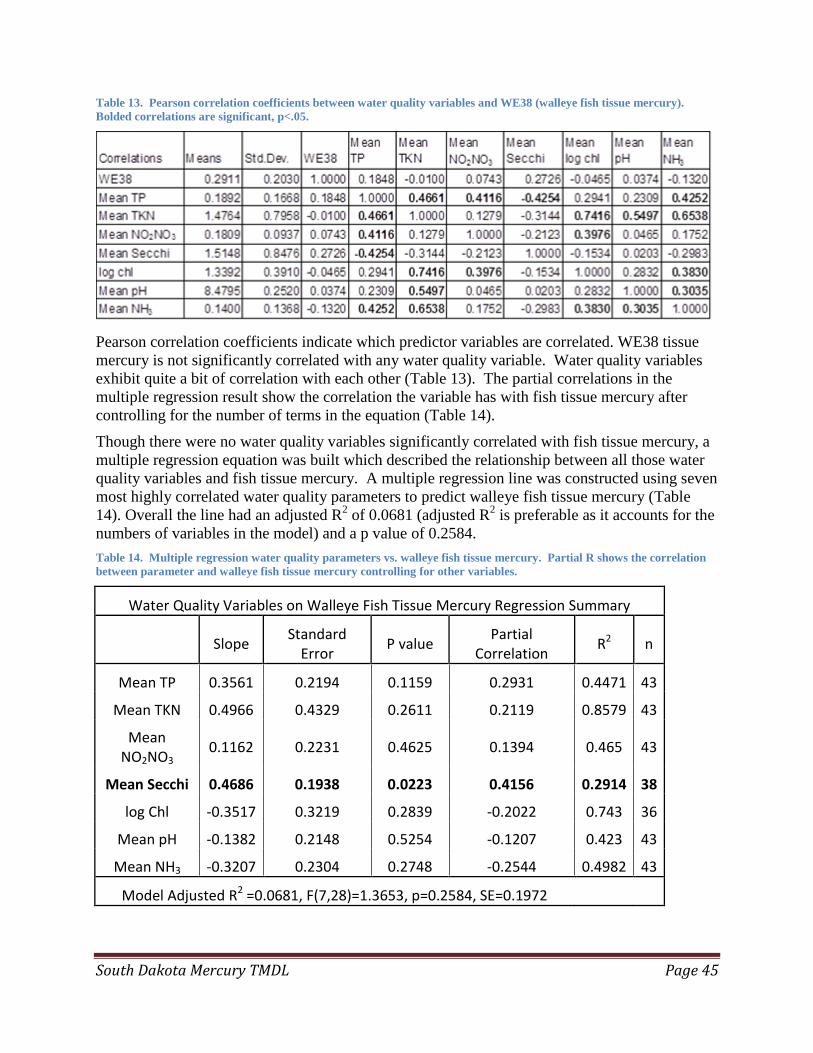
South Dakota Mercury TMDL Page 45
Table 13. Pearson correlation coefficients between water quality variables and WE38 (walleye fish tissue mercury).
Bolded correlations are significant, p<.05.
Pearson correlation coefficients indicate which predictor variables are correlated. WE38 tissue
mercury is not significantly correlated with any water quality variable. Water quality variables
exhibit quite a bit of correlation with each other (Table 13). The partial correlations in the
multiple regression result show the correlation the variable has with fish tissue mercury after
controlling for the number of terms in the equation (Table 14).
Though there were no water quality variables significantly correlated with fish tissue mercury, a
multiple regression equation was built which described the relationship between all those water
quality variables and fish tissue mercury. A multiple regression line was constructed using seven
most highly correlated water quality parameters to predict walleye fish tissue mercury (Table
14). Overall the line had an adjusted R2 of 0.0681 (adjusted R
2 is preferable as it accounts for the
numbers of variables in the model) and a p value of 0.2584.
Table 14. Multiple regression water quality parameters vs. walleye fish tissue mercury. Partial R shows the correlation
between parameter and walleye fish tissue mercury controlling for other variables.
Water Quality Variables on Walleye Fish Tissue Mercury Regression Summary
Slope
Standard Error
P value Partial
Correlation R2 n
Mean TP 0.3561 0.2194 0.1159 0.2931 0.4471 43
Mean TKN 0.4966 0.4329 0.2611 0.2119 0.8579 43
Mean NO2NO3
0.1162 0.2231 0.4625 0.1394 0.465 43
Mean Secchi 0.4686 0.1938 0.0223 0.4156 0.2914 38
log Chl -0.3517 0.3219 0.2839 -0.2022 0.743 36
Mean pH -0.1382 0.2148 0.5254 -0.1207 0.423 43
Mean NH3 -0.3207 0.2304 0.2748 -0.2544 0.4982 43
Model Adjusted R2 =0.0681, F(7,28)=1.3653, p=0.2584, SE=0.1972
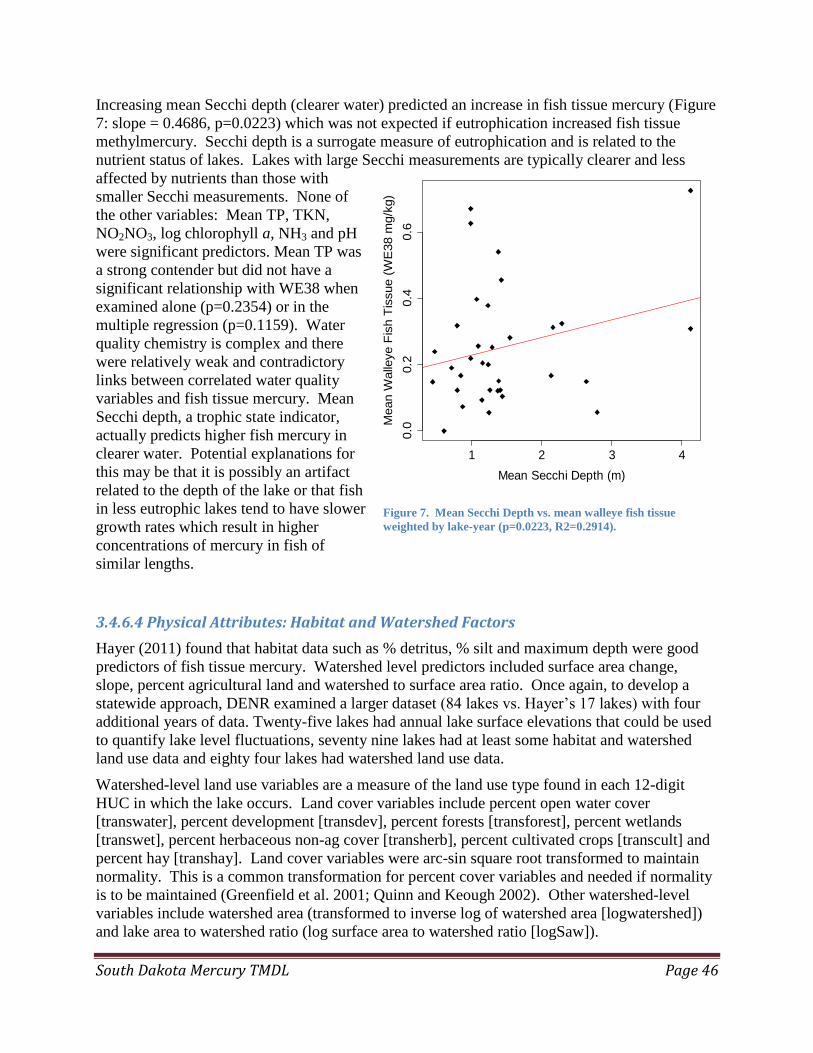
South Dakota Mercury TMDL Page 46
Increasing mean Secchi depth (clearer water) predicted an increase in fish tissue mercury (Figure
7: slope = 0.4686, p=0.0223) which was not expected if eutrophication increased fish tissue
methylmercury. Secchi depth is a surrogate measure of eutrophication and is related to the
nutrient status of lakes. Lakes with large Secchi measurements are typically clearer and less
affected by nutrients than those with
smaller Secchi measurements. None of
the other variables: Mean TP, TKN,
NO2NO3, log chlorophyll a, NH3 and pH
were significant predictors. Mean TP was
a strong contender but did not have a
significant relationship with WE38 when
examined alone (p=0.2354) or in the
multiple regression (p=0.1159). Water
quality chemistry is complex and there
were relatively weak and contradictory
links between correlated water quality
variables and fish tissue mercury. Mean
Secchi depth, a trophic state indicator,
actually predicts higher fish mercury in
clearer water. Potential explanations for
this may be that it is possibly an artifact
related to the depth of the lake or that fish
in less eutrophic lakes tend to have slower
growth rates which result in higher
concentrations of mercury in fish of
similar lengths.
3.4.6.4 Physical Attributes: Habitat and Watershed Factors
Hayer (2011) found that habitat data such as % detritus, % silt and maximum depth were good
predictors of fish tissue mercury. Watershed level predictors included surface area change,
slope, percent agricultural land and watershed to surface area ratio. Once again, to develop a
statewide approach, DENR examined a larger dataset (84 lakes vs. Hayer’s 17 lakes) with four
additional years of data. Twenty-five lakes had annual lake surface elevations that could be used
to quantify lake level fluctuations, seventy nine lakes had at least some habitat and watershed
land use data and eighty four lakes had watershed land use data.
Watershed-level land use variables are a measure of the land use type found in each 12-digit
HUC in which the lake occurs. Land cover variables include percent open water cover
[transwater], percent development [transdev], percent forests [transforest], percent wetlands
[transwet], percent herbaceous non-ag cover [transherb], percent cultivated crops [transcult] and
percent hay [transhay]. Land cover variables were arc-sin square root transformed to maintain
normality. This is a common transformation for percent cover variables and needed if normality
is to be maintained (Greenfield et al. 2001; Quinn and Keough 2002). Other watershed-level
variables include watershed area (transformed to inverse log of watershed area [logwatershed])
and lake area to watershed ratio (log surface area to watershed ratio [logSaw]).
1 2 3 4
0.0
0.2
0.4
0.6
Mean Secchi Depth (m)
Mean W
alle
ye F
ish T
issue (
WE
38 m
g/k
g)
Figure 7. Mean Secchi Depth vs. mean walleye fish tissue
weighted by lake-year (p=0.0223, R2=0.2914).

South Dakota Mercury TMDL Page 47
Habitat variables include lake area (inverse log of lake area[inverselogsa]), shoreline perimeter
(log of shoreline perimeter[logshoreline]), maximum lake depth [log max depth], arc-sin square
root transformed wetland cover within 500m of the lake [newwetland500trans], and lake
fluctuations (standard deviation of the previous eight years of lake elevation data
[8yearsstddev]). The standard deviation of lake depth of the previous eight years was chosen
based on analysis which is explained later in this section. The lake area to watershed ratio and
maximum lake depth were discarded due to large standard deviations and negligible correlation
to fish tissue mercury.
To test the continuous response of fish tissue mercury (SLP_Hg) to watershed and habitat
characteristics, regression was used rather than t-tests or nonparametric tests. Variables were
transformed to maintain normality, put into a correlation table to select likely predictors (Table
15).
Table 15. Pearson correlations between fish tissue mercury (SLP_Hg) and watershed and habitat variables. Bolded
correlations are significant, p<.05.
The most highly correlated predictors, lake level fluctuation [8 yearsstddev] and watershed-scale
wetland area [transwet] were then put into a multiple linear regression equation (Table 16). In a
separate analysis, the other significant correlates, inverse log of surface area and log of shoreline
were included. Fish tissue mercury also tended to increase in smaller lakes and smaller
watershed areas, but they were not significant predictors. The regression model improved when
these terms were dropped (Adjusted R2=0.3534, vs. Adjusted R
2=0.2992), Table 16 shows the
predictors based on the better regression model.
Table 16. Regression results watershed parameters on fish tissue mercury
Means Std.Dev. SLP_Hg transwate
r
transdev transfores
t
transwet transherb transhay transcult newwetla
nd500tran
s
inverselog
sa
log
shoreline
8yearstd.
dev
SLP_Hg 0.337120 0.214425 1.000000 -0.063066 -0.157706 -0.157931 -0.348948 0.093778 -0.064723 0.143940 -0.076853 0.327011 -0.265135 0.544260
transwater 0.382363 0.200417 -0.063066 1.000000 0.068850 -0.196914 0.134626 -0.079826 -0.144422 -0.121785 0.624879 -0.511984 0.240819 0.096300
transdev 0.182558 0.048850 -0.157706 0.068850 1.000000 -0.363735 0.436052 -0.310496 0.330963 0.613311 0.195345 -0.120193 -0.099433 -0.263576
transforest 0.122229 0.228624 -0.157931 -0.196914 -0.363735 1.000000 -0.313008 -0.296286 -0.282184 -0.576467 -0.305559 -0.082801 0.169347 -0.250168
transwet 0.126968 0.061645 -0.348948 0.134626 0.436052 -0.313008 1.000000 -0.141480 0.333412 0.335206 0.343697 -0.261030 0.088314 -0.040882
transherb 0.556515 0.271440 0.093778 -0.079826 -0.310496 -0.296286 -0.141480 1.000000 -0.524147 -0.403895 -0.228784 0.165626 -0.041013 -0.001043
transhay 0.214418 0.184287 -0.064723 -0.144422 0.330963 -0.282184 0.333412 -0.524147 1.000000 0.431320 0.159134 -0.097719 0.078417 -0.336383
transcult 0.597395 0.247340 0.143940 -0.121785 0.613311 -0.576467 0.335206 -0.403895 0.431320 1.000000 0.225049 0.179102 -0.371069 0.185200
newwetland500trans0.391191 0.211375 -0.076853 0.624879 0.195345 -0.305559 0.343697 -0.228784 0.159134 0.225049 1.000000 -0.294440 0.060818 0.349659
inverselogsa0.392645 0.102654 0.327011 -0.511984 -0.120193 -0.082801 -0.261030 0.165626 -0.097719 0.179102 -0.294440 1.000000 -0.790767 0.365262
log shoreline0.844204 0.376980 -0.265135 0.240819 -0.099433 0.169347 0.088314 -0.041013 0.078417 -0.371069 0.060818 -0.790767 1.000000 -0.261738
8yearstd.dev1.437715 0.861717 0.544260 0.096300 -0.263576 -0.250168 -0.040882 -0.001043 -0.336383 0.185200 0.349659 0.365262 -0.261738 1.000000
Variable
Correlations (finalnewoldlanduse) Marked correlations are significant at p < .05000
Results Parameter N Adjusted R2
Correlation
coefficient
Partial
Correlation
Regression
Slope F (df) F P Value
All fish weighted by lake-years 0.3534 2,24 8.1048 0.0020
transwet 92 0.0017 -0.3898 -0.3272 0.0490
8year_sd_lakelevel 27 0.0017 0.5660 0.5309 0.0026
Walleye weighted by species 0.32364317 2,18 5.785095 0.01148
transwet 54 0.00570209 -0.26458384 -0.21467123 0.25961
8year_sd_lakelevel 21 0.00570209 0.58985742 0.571546357 0.00619
Northern Pike weighted by species N/A too few samples
transwet 27
8year_sd_lakelevel 6
Largemouth Bass weighted by species N/A: too few samples
transwet 11
8year_sd_lakelevel 0
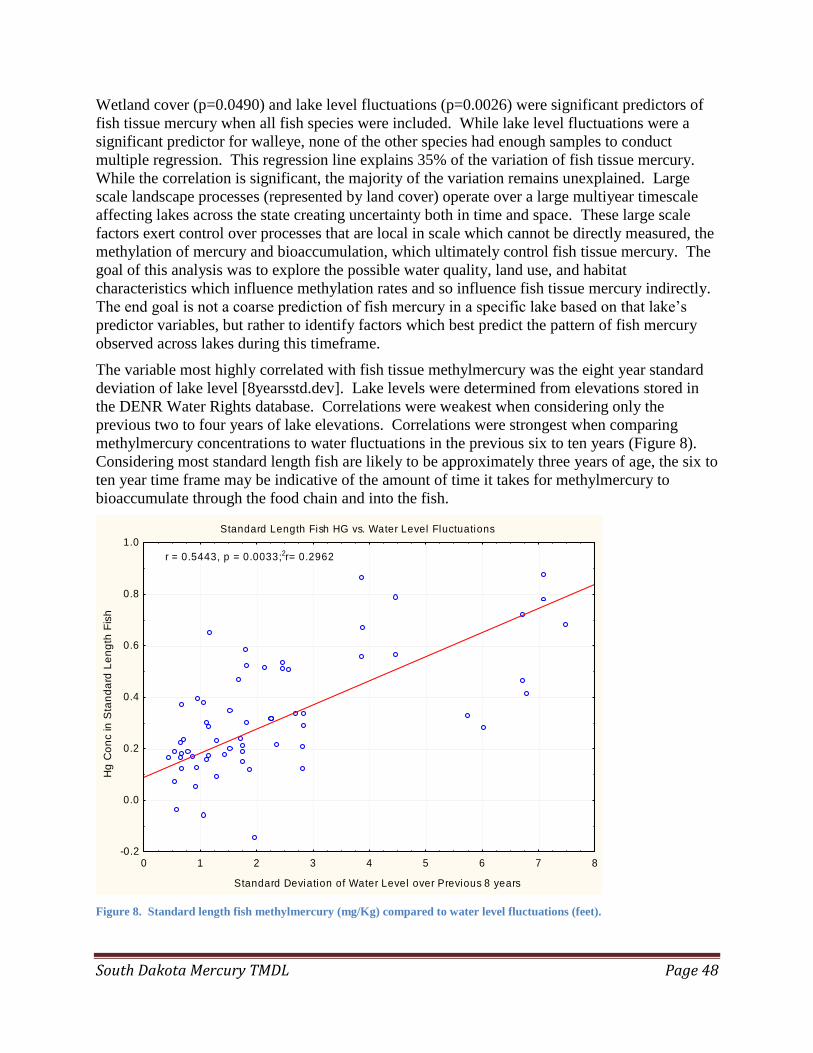
South Dakota Mercury TMDL Page 48
Wetland cover (p=0.0490) and lake level fluctuations (p=0.0026) were significant predictors of
fish tissue mercury when all fish species were included. While lake level fluctuations were a
significant predictor for walleye, none of the other species had enough samples to conduct
multiple regression. This regression line explains 35% of the variation of fish tissue mercury.
While the correlation is significant, the majority of the variation remains unexplained. Large
scale landscape processes (represented by land cover) operate over a large multiyear timescale
affecting lakes across the state creating uncertainty both in time and space. These large scale
factors exert control over processes that are local in scale which cannot be directly measured, the
methylation of mercury and bioaccumulation, which ultimately control fish tissue mercury. The
goal of this analysis was to explore the possible water quality, land use, and habitat
characteristics which influence methylation rates and so influence fish tissue mercury indirectly.
The end goal is not a coarse prediction of fish mercury in a specific lake based on that lake’s
predictor variables, but rather to identify factors which best predict the pattern of fish mercury
observed across lakes during this timeframe.
The variable most highly correlated with fish tissue methylmercury was the eight year standard
deviation of lake level [8yearsstd.dev]. Lake levels were determined from elevations stored in
the DENR Water Rights database. Correlations were weakest when considering only the
previous two to four years of lake elevations. Correlations were strongest when comparing
methylmercury concentrations to water fluctuations in the previous six to ten years (Figure 8).
Considering most standard length fish are likely to be approximately three years of age, the six to
ten year time frame may be indicative of the amount of time it takes for methylmercury to
bioaccumulate through the food chain and into the fish.
Figure 8. Standard length fish methylmercury (mg/Kg) compared to water level fluctuations (feet).
Standard Length Fish HG vs. Water Level Fluctuations
0 1 2 3 4 5 6 7 8
Standard Deviation of Water Level over Previous 8 years
-0.2
0.0
0.2
0.4
0.6
0.8
1.0
Hg
Co
nc in
Sta
nd
ard
Le
ng
th F
ish
r = 0.5443, p = 0.0033; r2 = 0.2962

South Dakota Mercury TMDL Page 49
Selch’s hypothesis that lakes that expanded in recent years may have internally adjusted
methylation rates and thus are showing lower concentrations in the fish is evident in Bitter Lake
(Figure 9). Lake levels rose dramatically (approximately twenty feet) in the closed basin through
the 1990’s. Fish tissue samples collected in 2000 from Bitter Lake were among the highest ever
recorded in the state. Regional drought conditions from 2000 through 2007 saw stable to
decreasing water levels and the resulting concentrations of mercury in the fish also decreased.
Figure 9. WE38 fish tissue mercury concentrations in Bitter Lake plotted against lake elevation.
To further test Selch’s hypothesis, Bitter Lake levels were used as a surrogate for regional
hydrologic conditions. The levels on Bitter Lake represent similar conditions exhibited in most
lakes found in northeastern SD (Clark, Codington, Day, Deuel, Grant, Marshall, and Roberts
Counties). Fish tissue samples collected from these counties were plotted against Bitter Lake
Levels to verify the trend shown in Figure 9. Note that the fish tissue methylmercury samples
collected from Bitter Lake were omitted from the comparison shown in Figure 10. Both figures
indicate a relationship between lake level and fish tissue methylmercury concentrations. While
atmospheric mercury deposition is widely accepted to have decreased during this time period,
regionally, changing water levels appear to be strongly linked to resultant methylmercury
concentrations in fish.
1765
1770
1775
1780
1785
1790
1795
1800
1805
0.000
0.200
0.400
0.600
0.800
1.000
1980 1985 1990 1995 2000 2005 2010 2015 2020
Ele
vati
on
(fm
sl)
Hg
Co
nc
Year
Walleye Lake Elevation
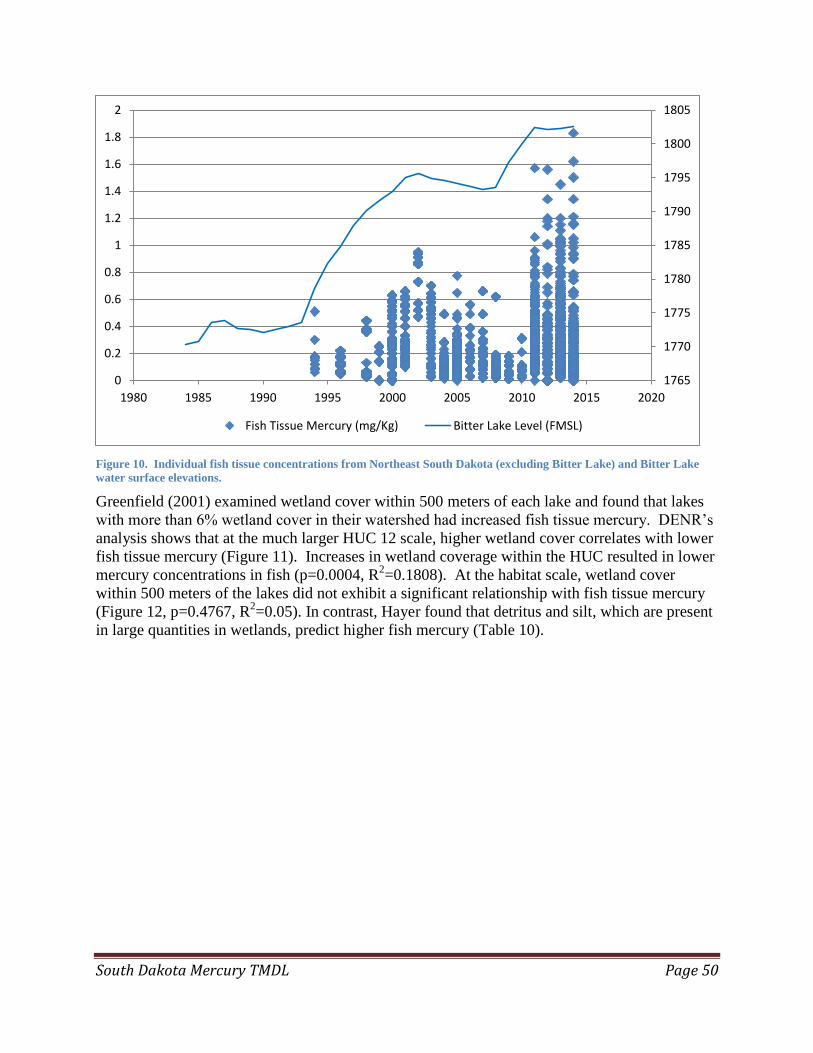
South Dakota Mercury TMDL Page 50
Figure 10. Individual fish tissue concentrations from Northeast South Dakota (excluding Bitter Lake) and Bitter Lake
water surface elevations.
Greenfield (2001) examined wetland cover within 500 meters of each lake and found that lakes
with more than 6% wetland cover in their watershed had increased fish tissue mercury. DENR’s
analysis shows that at the much larger HUC 12 scale, higher wetland cover correlates with lower
fish tissue mercury (Figure 11). Increases in wetland coverage within the HUC resulted in lower
mercury concentrations in fish (p=0.0004, R2=0.1808). At the habitat scale, wetland cover
within 500 meters of the lakes did not exhibit a significant relationship with fish tissue mercury
(Figure 12, p=0.4767, R2=0.05). In contrast, Hayer found that detritus and silt, which are present
in large quantities in wetlands, predict higher fish mercury (Table 10).
1765
1770
1775
1780
1785
1790
1795
1800
1805
0
0.2
0.4
0.6
0.8
1
1.2
1.4
1.6
1.8
2
1980 1985 1990 1995 2000 2005 2010 2015 2020
Fish Tissue Mercury (mg/Kg) Bitter Lake Level (FMSL)

South Dakota Mercury TMDL Page 51
Figure 11. Wetland cover vs. fish tissue mercury p=0.0004, R2=0.1808.
Figure 12. Wetlands within 500m buffer of lakes compared to fish tissue mercury. Regression analysis arc sin square-root
transformed wetland cover percentage vs. fish tissue mercury weighted by lake-year (p=0.4767,R2=0.05)
0.00 0.02 0.04 0.06 0.08 0.10 0.12
0.0
0.2
0.4
0.6
0.8
Proportion of Wetland Cover in Lake’s HUC 12
Mean F
ish T
issue M
erc
ury
(m
g/k
g)
0.0 0.2 0.4 0.6 0.8
0.0
0.2
0.4
0.6
0.8
Proportion of Wetland Cover within 500m of Lake
Mean F
ish T
issue M
erc
ury
(m
g/k
g)
South Dakota Mercury TMDL Page 52
3.4.6.5 Methylation Rate Analysis Conclusions
With the greatly expanded dataset of eighty four lakes, four main conclusions were drawn
regarding water quality, habitat, and land cover characteristics’ influence on fish tissue mercury.
Some of the results SDDENR found differ from previous research when using water quality,
habitat and watershed properties to predict fish tissue mercury.
No major difference existed between lakes and impoundments on the basis of water
quality or fish tissue.
Chemical attributes were poor predictors of fish tissue mercury.
Increased watershed-level wetland cover predicted lower fish mercury. However, local
wetland cover appeared to have no direct effect on fish mercury.
Water level fluctuations were a major driver in the fish tissue methylmercury
concentrations.
The absence of a significant difference between water body types is important in the context of
the TMDLs application to all surface waters. The effectiveness of the TMDL should be similar
in all water body types.
Linking specific water quality parameters to methylmercury accumulation in fish provided few
significant findings. Literature reviews yield conflicting conclusions ranging from suggestions
that eutrophic lakes should result in fish with higher concentrations to findings that suggest
cleaner lakes are more susceptible to elevated levels (Pickhardt et al. 2002). Data analysis in
South Dakota may best be referenced as inconclusive in either case.
The conclusion that watershed-scale wetlands coverage is negatively correlated to fish mercury
levels in lakes and reservoirs contradicts some studies (Greenfield et al. 2001) but occurs at very
different spatial scales. In Greenfield’s study, the average watershed-level wetland cover for
study lakes was 17% in a watershed area that averaged 539 hectares while South Dakota’s
average watershed wetland cover for lakes was 1.7% in an area averaging 10,519 hectares.
Wetlands may facilitate methylation by providing an ideal habitat (low dissolved oxygen, high
organic matter) for microbes (Wentz et al. 2014). Some studies have suggested that wetlands in
the watershed trap sediment with a high mercury load that would otherwise wash into the lake
(Engstrom et al. 1999; Betemariam 2010) leading to a reduction in fish mercury.
The strong correlation between the fish tissue mercury and water level fluctuations reinforces
Selch’s (2008) findings that water level fluctuations are a primary component influencing
methylation rates for South Dakota Lakes. Wentz (2014) also suggests that water level
fluctuations can increase methylation rates. Future considerations of TMDL progress and
attainment should consider the elevation variability of the water bodies evaluated. Increasing
water levels in the northeastern part of South Dakota have created numerous issues ranging from
lost tax revenue and farm income to flooded roads and public access. Stabilization of the water
levels, although desirable on many fronts, is not currently a feasible option for addressing
mercury. Reducing mercury inputs is the only feasible option for addressing elevated fish tissue
concentrations.
South Dakota Mercury TMDL Page 53
4.0 Source Assessment – Point Sources
Point sources of water pollution were grouped into three primary categories: mining, traditional
point sources, National Pollutions Discharge Elimination System (NPDES) permitted facilities,
and Municipal Separate Storm Sewer Systems (MS4s).
4.1 Mining
Mercury mining and the use of mercury for the extraction of gold are potential point sources of
inorganic mercury. Although mercury mining ceased in the United States in 1992 and mercury
amalgamation for the extraction of gold has been replaced by cyanide leaching (Wentz et al.
2014), deposits from these processes remain a localized concern in portions of the country.
South Dakota has no record of mercury mining occurring within the state, but does have a
history of gold mining in the Black Hills that continues to this day.
Mining has the potential to release mercury into the environment through two separate
mechanisms. Air emissions from gold mining may release mercury during the ore extraction
process. This fraction is addressed in the air emissions reductions of the TMDL. The other
mechanism through which mercury may enter the environment from mining is leaching and
direct runoff from tailing sites either from historic mine tailings or existing operations (Wharf
Resources USA, Inc.). All of the major mining sites in the Black Hills have individual NPDES
permits and are accounted for in section 4.3. Mine tailings may contain elevated mercury
concentrations, however this does not always result in elevated fish tissue concentrations.
Methylation processes in concert with a source of mercury followed by bioaccumulation are
required to elevate fish tissue methylmercury levels. Waters in the Black Hills region of South
Dakota are the only ones with potential to be impacted by historic mining. Fish tissue
methylmercury sampling from known mining areas (including Whitewood Creek, Spearfish
Creek, Rapid Creek, and Bear Butte Creek) have shown no impairments as a result of mercury.
These coldwater streams may lack many of the methylation pathways necessary for
bioaccumulation to occur. In addition, tailings or mining discharges, if present, may not have
contained sufficient levels of mercury to result in subsequent impairments.
Historically, the tailings from the Homestake Gold Mine had been linked to elevated fish tissue
methylmercury concentrations in the Cheyenne arm of Lake Oahe, which is located several
hundred kilometers downstream of the mine. The following excerpt from the USGS provides
some perspective on this history.
“From the original discovery of gold at Deadwood, SD in 1875 until the late 1970’s, huge
volumes of mining and milling wastes were discharged into Whitewood Creek and its tributaries
at Lead and Deadwood, South Dakota. The wastes were transported down Whitewood Creek to
the Belle Fourche River, then to the Cheyenne River, and then to the Missouri River.” (Goddard
1989)
In the 1970’s, fish tissue samples collected from the Cheyenne arm of Lake Oahe had
methylmercury concentrations above a then FDA guideline of 0.5 mg/Kg (USEPA 1971). As a
result, consumption advisories were issued for this area. Additional fish samples from other
areas of western South Dakota and at various locations in Lake Oahe led to two conclusions at
that time: First, methylmercury was found in fish tissue throughout western South Dakota

South Dakota Mercury TMDL Page 54
suggesting to the investigators it may be naturally occurring. Secondly, the Cheyenne arm had
higher concentrations than other parts of Lake Oahe, leading the investigators to the conclusion
that Homestake tailings were contributing to the impairment (USEPA 1973).
Since this original investigation in the early 1970’s, Homestake mine constructed the Grizzly
Gulch Tailings Dam which then began receiving all of the mine tailings by December of 1977.
This was followed by a wastewater treatment plant for additional removal of mercury and other
pollutants. Homestake mine eventually ceased operation in 2002, and has since been converted
to a Deep Underground Science and Engineering Lab. While the mine no longer produces
discharges through operation, historically discharged tailings can be found along Whitewood
Creek, which is why the state continues to actively monitor water quality and fish tissue from
this stream.
The Cheyenne River drains over 24,000 square miles of South Dakota, Wyoming, and Nebraska.
Through its sheer size, it naturally carries large volumes of sediment, which are deposited in
Lake Oahe. Since the construction of the tailings dam, the river has continued to move
sediments downstream which ultimately accumulated in Oahe Reservoir. Near the mouth of the
Cheyenne, the delta has visibly extended for nearly 15 miles since the construction of Oahe.
This accumulation has entombed most of the tailings which had moved down the Cheyenne
River.
Current (1994-2014) fish tissue data from Lake Oahe (Appendix D) is collected from several
locations. The samples identified as “Minneconjou Bay” were collected from the Cheyenne Arm
(confluence of the Cheyenne River and Lake Oahe). Recent data for Lake Oahe shows that
throughout the reservoir fish tissue concentrations are similar. Current data are also similar to
concentrations measured outside of the Cheyenne River arm in the 1970’s. Although insufficient
for statistical analysis, a trend appears to be emerging in which tissue concentrations rise and fall
following major reservoir elevation shifts due to wet and dry hydrologic cycles.
It is probable that tailings from the Homestake mine were indeed a contributing cause of elevated
mercury levels in fish sampled in the 1970’s. The following facts suggest that the current
primary cause of elevated mercury levels is atmospheric deposition:
Most of the mine tailings are entombed in cleaner sediments limiting their access to the
current food web.
When mine tailings were exposed, fish tissue concentrations were greater in the
Cheyenne arm then the rest of Lake Oahe.
Current fish tissue concentrations of mercury are consistent throughout the reservoir.
Continued monitoring is planned statewide, and though it is presently unexpected, a possibility
remains that a stream segment may be found with impairments resulting from mine tailings. In
the event impairments are found in waters receiving discharge from a mine site, application of
this TMDL would be deferred until such time as adequate data shows the cause of the
impairment is not related to the mine or a site specific mercury TMDL is developed.
4.2 Municipal Separate Storm Sewer Systems
The requirements of MS4 permits are to control anthropogenic loads in storm water discharges.
They are considered a point source under the clean water act and are typically included as a part
of the WLA within the TMDL calculation. Factoring out atmospheric deposition, which is
South Dakota Mercury TMDL Page 55
accounted for separately in the TMDL source assessment, and illicit discharges, which are
already regulated, there should be no anthropogenic sources of mercury found in their runoff.
Thus, the only source of mercury in MS4 loads is atmospheric deposition. The MS4 permit areas
are included in the measured and modeled deposition results, and as such are fully accounted for
by the load allocation (LA) of this TMDL. In previously approved regional and statewide
mercury TMDLs, EPA allowed for the MS4 loads to be accounted for in the LA. Based on
comments received from EPA during the public notice period of this TMDL, MS4 loads must be
termed a portion of the WLA in the final TMDL calculation. It should be emphasized though,
that these mercury loads originate entirely from nonpoint sources via atmospheric deposition.
Section 5.0 clearly outlines these sources and the processes affecting the distribution of mercury
throughout SD. They cannot be mitigated through BMPs identified within MS4 permits.
To calculate this load, the sum of the MS4 acreages (Table 17) was first calculated at 778 km2.
This area was then divided by the area of the state (199,742.5 km2) which results in 0.39% of the
TMDL to be allocated to the MS4s. The remaining 99.61% was allocated to the remainder of the
state outside of permitted MS4 boundaries. These percentages will be used to apportion the
loads between the MS4’s and nonpoint sources.
Reductions associated with the LA will result in equivalent reductions in the MS4 loads,
therefore, no additional reductions are necessary as part of the existing permits, nor is it
appropriate to calculate a duplicate WLA for loads that are fully represented in the LA
component of the TMDL. All of the minimum measures required by MS4 permits (Stormwater
Phase II Final Rule Fact Sheet) are designed to reduce storm water volume and sediment
loading. Any measure which reduces the volume of water (addresses wet deposition
mercury) and sediments (addresses dry deposition mercury) will reduce the amount of
mercury delivered to receiving water bodies. The intent of the MS4 WLA will be achieved
by the BMPs outlined as part of the existing permit conditions and, therefore, changes to the
permit resulting from this TMDL are not necessary.
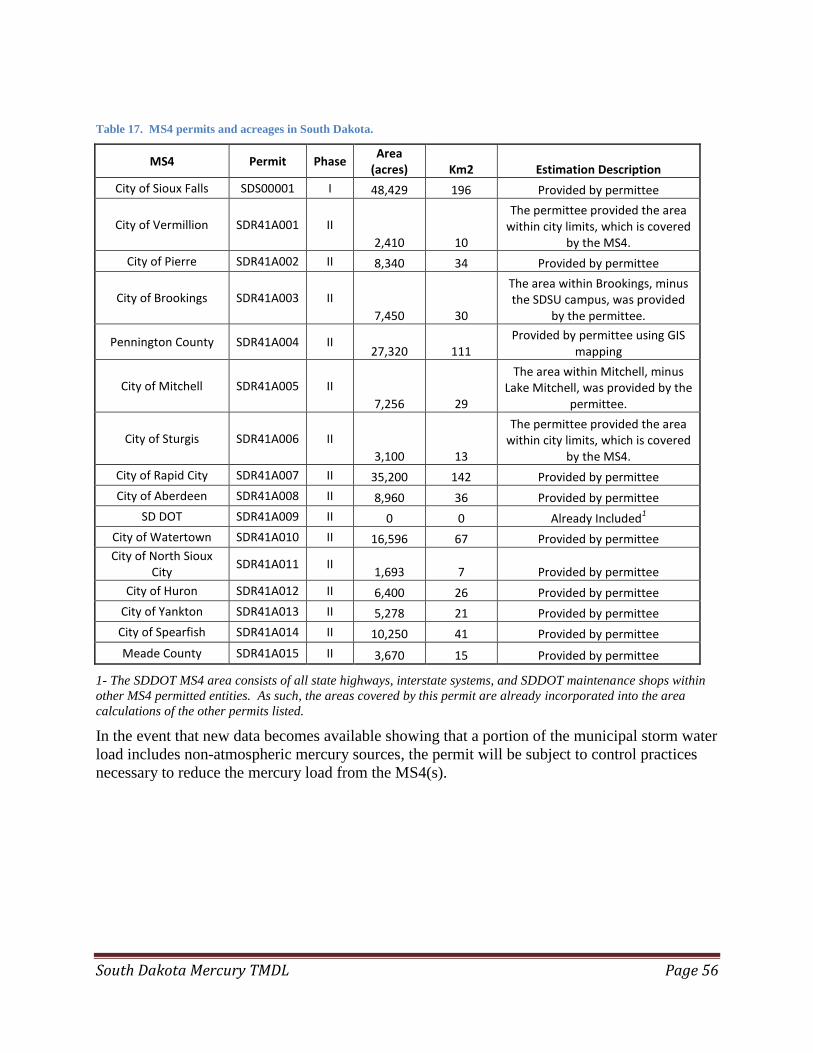
South Dakota Mercury TMDL Page 56
Table 17. MS4 permits and acreages in South Dakota.
MS4 Permit Phase Area
(acres) Km2 Estimation Description
City of Sioux Falls SDS00001 I 48,429 196 Provided by permittee
City of Vermillion SDR41A001 II
2,410 10
The permittee provided the area within city limits, which is covered
by the MS4.
City of Pierre SDR41A002 II 8,340 34 Provided by permittee
City of Brookings SDR41A003 II
7,450 30
The area within Brookings, minus the SDSU campus, was provided
by the permittee.
Pennington County SDR41A004 II 27,320 111
Provided by permittee using GIS mapping
City of Mitchell SDR41A005 II
7,256 29
The area within Mitchell, minus Lake Mitchell, was provided by the
permittee.
City of Sturgis SDR41A006 II
3,100 13
The permittee provided the area within city limits, which is covered
by the MS4.
City of Rapid City SDR41A007 II 35,200 142 Provided by permittee
City of Aberdeen SDR41A008 II 8,960 36 Provided by permittee
SD DOT SDR41A009 II 0 0 Already Included1
City of Watertown SDR41A010 II 16,596 67 Provided by permittee
City of North Sioux City
SDR41A011 II 1,693 7 Provided by permittee
City of Huron SDR41A012 II 6,400 26 Provided by permittee
City of Yankton SDR41A013 II 5,278 21 Provided by permittee
City of Spearfish SDR41A014 II 10,250 41 Provided by permittee
Meade County SDR41A015 II 3,670 15 Provided by permittee
1- The SDDOT MS4 area consists of all state highways, interstate systems, and SDDOT maintenance shops within
other MS4 permitted entities. As such, the areas covered by this permit are already incorporated into the area
calculations of the other permits listed.
In the event that new data becomes available showing that a portion of the municipal storm water
load includes non-atmospheric mercury sources, the permit will be subject to control practices
necessary to reduce the mercury load from the MS4(s).

South Dakota Mercury TMDL Page 57
4.3 Non Storm Water NPDES Permitted Sources
South Dakota has required water quality sampling for mercury in NPDES permits if mercury is
expected to be present in the discharge and places water quality-based mercury limits in those
permits when there is reasonable potential mercury could cause a violation of the surface water
quality standards. Seven of the state’s largest POTWs have implemented pretreatment programs.
The approved programs must look at the loading to their treatment plants and develop local
limits for pollutants of concern, including mercury. The pollutants investigated usually dictate
whether or not the wastewater effluent will meet permit requirements or if the sludge will be
disposed of properly. The cities of Brookings, Mitchell, Rapid City, and Watertown have
developed a local limit for mercury to ensure that the influent into the plant will not cause
elevated mercury levels in the sludge or effluent. The other municipalities (Aberdeen, Huron,
and Sioux Falls) have determined that a local limit for mercury is not necessary at this time.
SDDENR retrieved data from the EPA Integrated Compliance Information System (ICIS) to
characterize the mercury concentration of effluent in South Dakota. Statewide, samples from
POTWs above the detection limit have historically been uncommon with the most recent period
(2008-2014 accounting for 126 samples) having no samples in excess of the detection limit.
Expanding this dataset to include all NPDES data from 1997-2015, increases the amount of
information significantly, with 2,039 measurements. With the expanded dataset, the percentage
of effluent samples with detectable levels of mercury remained low at 1%, however, many
samples in these datasets were not collected using ultra-low level methods (EPA 1631 revision E
or EPA 245.7) that report detection limits low enough to compare against the human health water
column criterion (0.05 µg/L). Due to the low percentage of quantifiable concentrations and
concerns about the representativeness of using insufficient detection limits in calculations to
characterize effluent in South Dakota, it was necessary to use a surrogate source of data to
calculate the wasteload allocation.
The Minnesota Mercury TMDL found similarities between data collected by the Association of
Metropolitan Sewerage Agencies (AMSA) and monitoring completed by the Minnesota
Pollution Control Agency (MPCA) on thirty seven NPDES facilities (POTWs and Industry).
The MPCA data indicated that central tendencies fell in line with the AMSA study which used
clean sampling and analytical techniques in monitoring twenty four POTWs throughout six states
(Nellor 1999). The central tendency of the data in both studies fell at or near 0.005 µg/L. The
AMSA study included a range of concentrations from 0.0007 µg/L to 0.0699 with arithmetic
mean of 0.00725 µg/L and a 90th
percentile of 0.01536 µg/L. It is reasonable to expect that
South Dakota NPDES permitted facilities would be similar to the ranges found in these studies.
While the MPCA study included POTWs and Industry, the AMSA study looked only at POTWs.
To fully account for uncertainties in NPDES contributions, including both POTW and industrial
sources, the TMDL will use the 90th
percentile of the AMSA study (0.01536 µg/L) to
approximate concentrations of mercury in the effluent of South Dakota’s point source
dischargers.
South Dakota has 247 NPDES permits (Appendix E) which include industry, mines,
municipalities and fish hatcheries. Many of the smaller municipalities do not continuously
discharge and typically release effluent for a few weeks each year. Average daily flow for 2014
was 119 million gallons with an average annual flow volume of 43 billion gallons. Using the
annual flow volume with the 0.01536 µg/L mercury concentration yields a load of 2.53 kg/yr.

South Dakota Mercury TMDL Page 58
The final TMDL calculation is not discussed until later in this document (section 10). However,
it is important to present the final TMDL load of 595.32 kg/yr in order to gain perspective on the
small percentage (0.43%) attributable to the state’s non-stormwater point sources.
Previously approved TMDLs where sources of mercury are predominately from air deposition
have taken varying approaches to address the large differences in required reductions from the
LA in comparison to the WLA. These approaches range from providing individual WLAs for
individual sources such as in the Ochlockonee TMDL (USEPA 2002) to assigning a single WLA
for all sources within the region such as the Minnesota TMDL (MPCA 2007). A commonality
amongst them is the low percentage (approximately 1%) of mercury allocated to the WLA.
The Minnesota and Northeast Regional Mercury TMDLs used the legal term de minimis when
referencing the small contributions represented by the NPDES discharges. As defined in those
TMDLs, de minimis - insignificant; a Latin expression “de minimis non curat lex: “The law does
not concern itself with trifles;” the effect is too small to be of consequence. For the mercury
TMDL, wastewater point sources were considered de minimis if they represented less than one
percent of the TMDL of mercury to the region and reductions to the WLA component of the
TMDL were not calculated. The de minimis definition is clearly applicable to the contributions
of the WLAs in South Dakota. The final TMDL calculation will preserve the current load of
2.53 kg/yr for the WLA component. This approach is consistent with approved mercury TMDLs
referenced in this document. Although the WLA contribution is determined to be de minimis, it
is not an allowance for increased discharges of mercury, nor does it provide exemption from
further efforts to reduce mercury from these sources.

South Dakota Mercury TMDL Page 59
5.0 Source Assessment - Nonpoint
Nonpoint sources of mercury pollution are numerous and diffuse throughout the world in the
form of emissions from power plants, gold mining, and other human activities. Although diffuse
in origin, they coalesce in the atmosphere and are delivered to waterbodies through both wet and
dry atmospheric deposition.
This section will first discuss a project conducted by Dr. Stone of the South Dakota School of
Mines and Technology (SDSM&T). The intent of this project was to measure wet and dry
atmospheric mercury deposition through the deployment of passive bulk mercury deposition
monitors at six locations throughout the state. This statewide project improved the resolution of
the existing Mercury Deposition Network (MDN) which is a national monitoring network set up
to monitor the trends of atmospheric mercury deposition. The data collected from this statewide
effort included with existing MDN data refined the measured mercury deposition rates
specifically within South Dakota.
The Regional Modeling System for Aerosols and Deposition (REMSAD) is a national modeling
effort designed to estimate the sources, rates, and patterns of both wet and dry atmospheric
mercury deposition effected by regional meteorologic conditions.
Dr. Stones project was used to establish the atmospheric depositional rates for the baseline year
of 2009. The REMSAD model results were used to appropriate the relative percentages of the
load to a set of sources which were selected by EPA. A baseline year is used as a loading or
occurrence reference point to which future mercury loading will be compared for mercury
TMDL attainment and implementation.
5.1 Atmospheric Mercury Deposition Monitoring
5.1.1 Atmospheric Mercury Deposition Monitoring Methods
Bulk mercury samplers constructed and
deployed by South Dakota School of
Mines and Technology (SDSM&T) were
designed using sampling principles utilized
from the MDN samplers, Swedish IVL
bulk samplers (Chazin et al. 1995), and
Wisconsin air samplers (Morrison et al.
1995). The passive samplers consist of
insulated steel boxes containing heating
and cooling components and rain,
moisture, and particulate collection
glassware. The glassware components
housed within each sampler include a
funnel, a thistle tube, and a 1.89 liter
bottle; all pre-cleaned to ensure no residual
mercury exists prior to deployment. The
glassware is kept in place using a system
of springs, a strap, and an adjustable
platform. The samplers have a thermostat-Figure 13. Typical construction of a passive bulk mercury
atmospheric sampler
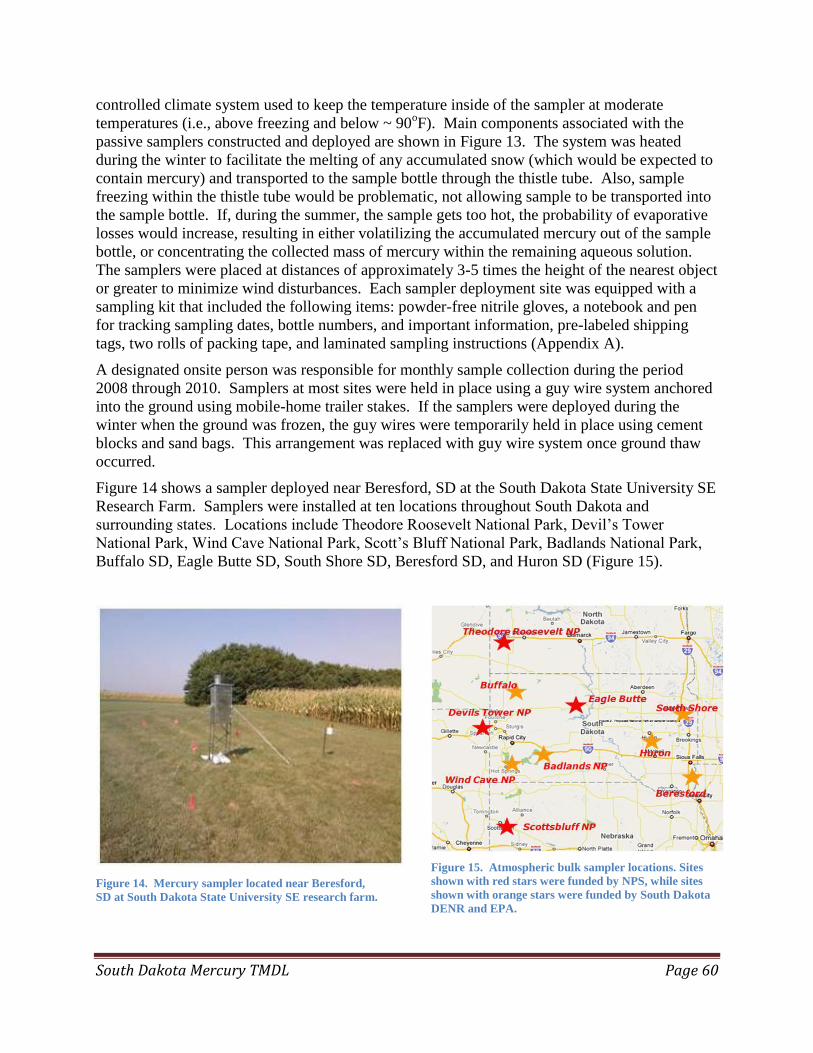
South Dakota Mercury TMDL Page 60
controlled climate system used to keep the temperature inside of the sampler at moderate
temperatures (i.e., above freezing and below ~ 90oF). Main components associated with the
passive samplers constructed and deployed are shown in Figure 13. The system was heated
during the winter to facilitate the melting of any accumulated snow (which would be expected to
contain mercury) and transported to the sample bottle through the thistle tube. Also, sample
freezing within the thistle tube would be problematic, not allowing sample to be transported into
the sample bottle. If, during the summer, the sample gets too hot, the probability of evaporative
losses would increase, resulting in either volatilizing the accumulated mercury out of the sample
bottle, or concentrating the collected mass of mercury within the remaining aqueous solution.
The samplers were placed at distances of approximately 3-5 times the height of the nearest object
or greater to minimize wind disturbances. Each sampler deployment site was equipped with a
sampling kit that included the following items: powder-free nitrile gloves, a notebook and pen
for tracking sampling dates, bottle numbers, and important information, pre-labeled shipping
tags, two rolls of packing tape, and laminated sampling instructions (Appendix A).
A designated onsite person was responsible for monthly sample collection during the period
2008 through 2010. Samplers at most sites were held in place using a guy wire system anchored
into the ground using mobile-home trailer stakes. If the samplers were deployed during the
winter when the ground was frozen, the guy wires were temporarily held in place using cement
blocks and sand bags. This arrangement was replaced with guy wire system once ground thaw
occurred.
Figure 14 shows a sampler deployed near Beresford, SD at the South Dakota State University SE
Research Farm. Samplers were installed at ten locations throughout South Dakota and
surrounding states. Locations include Theodore Roosevelt National Park, Devil’s Tower
National Park, Wind Cave National Park, Scott’s Bluff National Park, Badlands National Park,
Buffalo SD, Eagle Butte SD, South Shore SD, Beresford SD, and Huron SD (Figure 15).
Figure 14. Mercury sampler located near Beresford,
SD at South Dakota State University SE research farm.
Figure 15. Atmospheric bulk sampler locations. Sites
shown with red stars were funded by NPS, while sites
shown with orange stars were funded by South Dakota
DENR and EPA.
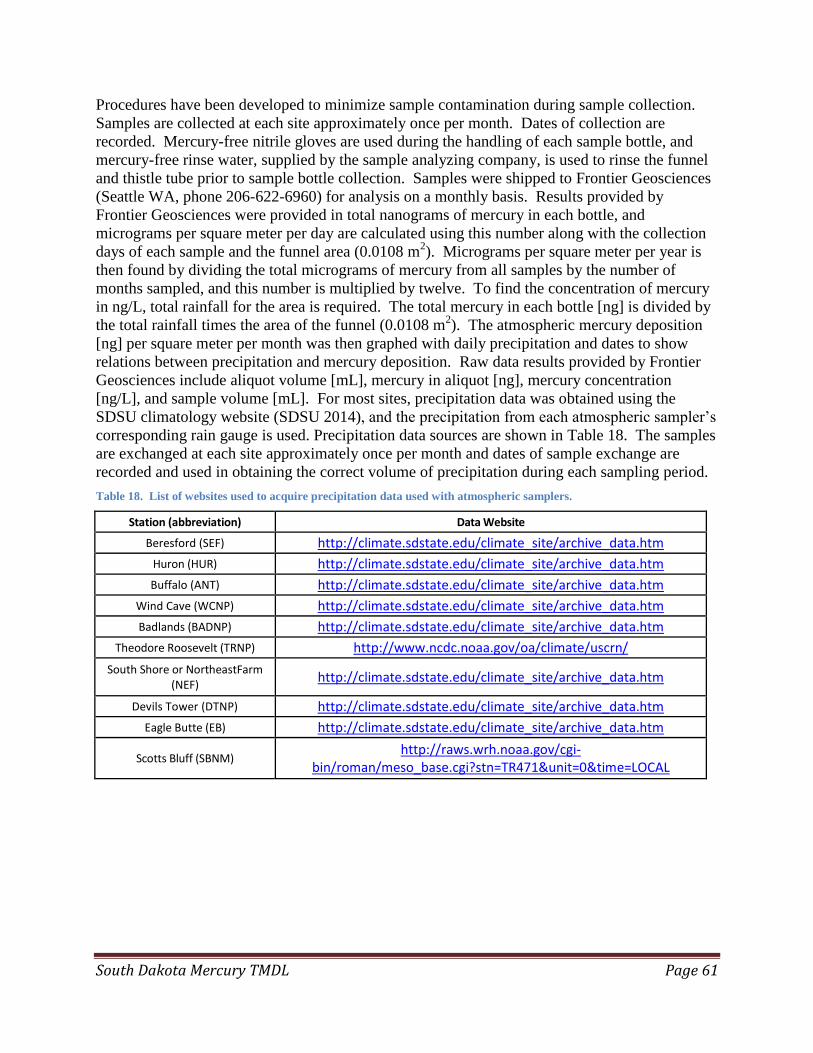
South Dakota Mercury TMDL Page 61
Procedures have been developed to minimize sample contamination during sample collection.
Samples are collected at each site approximately once per month. Dates of collection are
recorded. Mercury-free nitrile gloves are used during the handling of each sample bottle, and
mercury-free rinse water, supplied by the sample analyzing company, is used to rinse the funnel
and thistle tube prior to sample bottle collection. Samples were shipped to Frontier Geosciences
(Seattle WA, phone 206-622-6960) for analysis on a monthly basis. Results provided by
Frontier Geosciences were provided in total nanograms of mercury in each bottle, and
micrograms per square meter per day are calculated using this number along with the collection
days of each sample and the funnel area (0.0108 m2). Micrograms per square meter per year is
then found by dividing the total micrograms of mercury from all samples by the number of
months sampled, and this number is multiplied by twelve. To find the concentration of mercury
in ng/L, total rainfall for the area is required. The total mercury in each bottle [ng] is divided by
the total rainfall times the area of the funnel (0.0108 m2). The atmospheric mercury deposition
[ng] per square meter per month was then graphed with daily precipitation and dates to show
relations between precipitation and mercury deposition. Raw data results provided by Frontier
Geosciences include aliquot volume [mL], mercury in aliquot [ng], mercury concentration
[ng/L], and sample volume [mL]. For most sites, precipitation data was obtained using the
SDSU climatology website (SDSU 2014), and the precipitation from each atmospheric sampler’s
corresponding rain gauge is used. Precipitation data sources are shown in Table 18. The samples
are exchanged at each site approximately once per month and dates of sample exchange are
recorded and used in obtaining the correct volume of precipitation during each sampling period.
Table 18. List of websites used to acquire precipitation data used with atmospheric samplers.
Station (abbreviation) Data Website
Beresford (SEF) http://climate.sdstate.edu/climate_site/archive_data.htm
Huron (HUR) http://climate.sdstate.edu/climate_site/archive_data.htm
Buffalo (ANT) http://climate.sdstate.edu/climate_site/archive_data.htm
Wind Cave (WCNP) http://climate.sdstate.edu/climate_site/archive_data.htm
Badlands (BADNP) http://climate.sdstate.edu/climate_site/archive_data.htm
Theodore Roosevelt (TRNP) http://www.ncdc.noaa.gov/oa/climate/uscrn/
South Shore or NortheastFarm (NEF)
http://climate.sdstate.edu/climate_site/archive_data.htm
Devils Tower (DTNP) http://climate.sdstate.edu/climate_site/archive_data.htm
Eagle Butte (EB) http://climate.sdstate.edu/climate_site/archive_data.htm
Scotts Bluff (SBNM) http://raws.wrh.noaa.gov/cgi-
bin/roman/meso_base.cgi?stn=TR471&unit=0&time=LOCAL
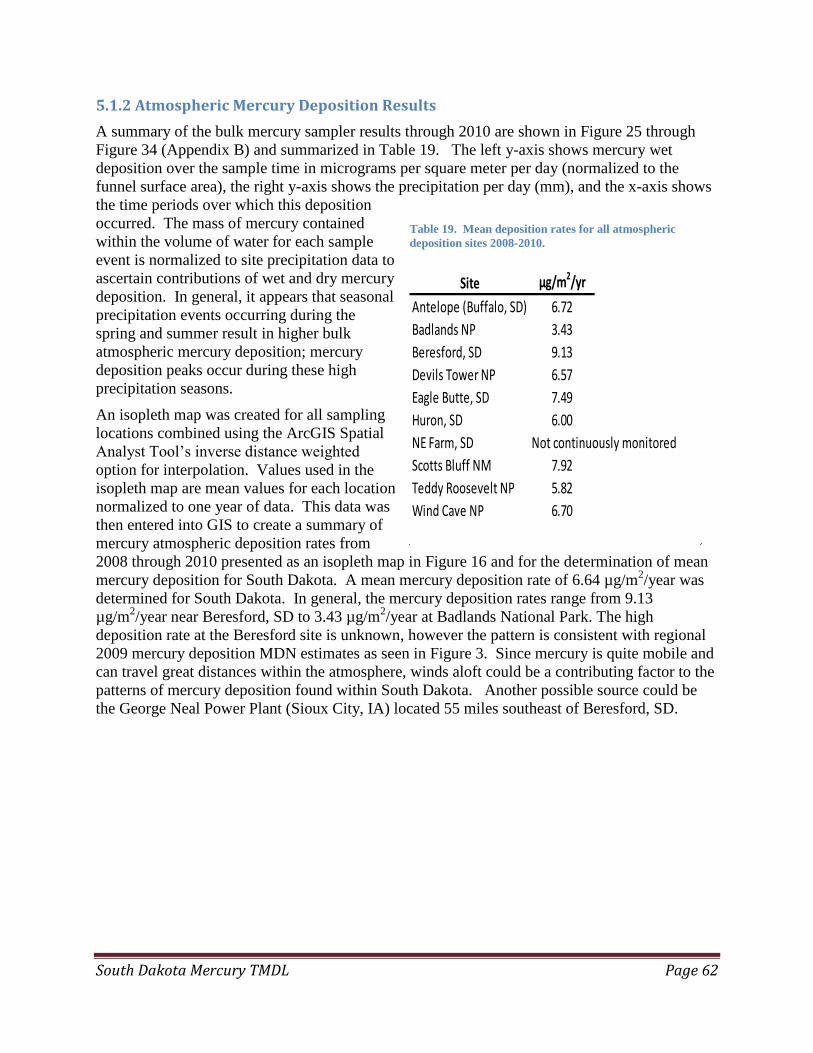
South Dakota Mercury TMDL Page 62
5.1.2 Atmospheric Mercury Deposition Results
A summary of the bulk mercury sampler results through 2010 are shown in Figure 25 through
Figure 34 (Appendix B) and summarized in Table 19. The left y-axis shows mercury wet
deposition over the sample time in micrograms per square meter per day (normalized to the
funnel surface area), the right y-axis shows the precipitation per day (mm), and the x-axis shows
the time periods over which this deposition
occurred. The mass of mercury contained
within the volume of water for each sample
event is normalized to site precipitation data to
ascertain contributions of wet and dry mercury
deposition. In general, it appears that seasonal
precipitation events occurring during the
spring and summer result in higher bulk
atmospheric mercury deposition; mercury
deposition peaks occur during these high
precipitation seasons.
An isopleth map was created for all sampling
locations combined using the ArcGIS Spatial
Analyst Tool’s inverse distance weighted
option for interpolation. Values used in the
isopleth map are mean values for each location
normalized to one year of data. This data was
then entered into GIS to create a summary of
mercury atmospheric deposition rates from
2008 through 2010 presented as an isopleth map in Figure 16 and for the determination of mean
mercury deposition for South Dakota. A mean mercury deposition rate of 6.64 µg/m2/year was
determined for South Dakota. In general, the mercury deposition rates range from 9.13
µg/m2/year near Beresford, SD to 3.43 µg/m
2/year at Badlands National Park. The high
deposition rate at the Beresford site is unknown, however the pattern is consistent with regional
2009 mercury deposition MDN estimates as seen in Figure 3. Since mercury is quite mobile and
can travel great distances within the atmosphere, winds aloft could be a contributing factor to the
patterns of mercury deposition found within South Dakota. Another possible source could be
the George Neal Power Plant (Sioux City, IA) located 55 miles southeast of Beresford, SD.
Site µg/m2/yr
Antelope (Buffalo, SD) 6.72
Badlands NP 3.43
Beresford, SD 9.13
Devils Tower NP 6.57
Eagle Butte, SD 7.49
Huron, SD 6.00
NE Farm, SD Not continuously monitored
Scotts Bluff NM 7.92
Teddy Roosevelt NP 5.82
Wind Cave NP 6.70
Table 19. Mean deposition rates for all atmospheric
deposition sites 2008-2010.
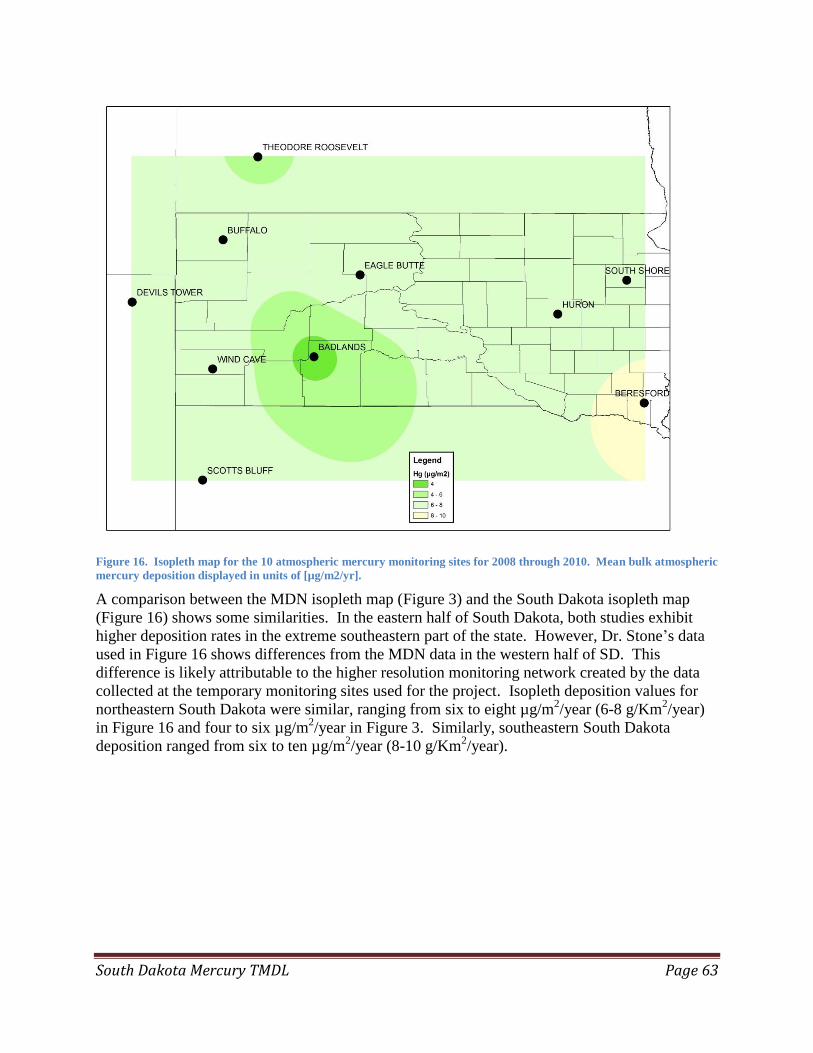
South Dakota Mercury TMDL Page 63
Figure 16. Isopleth map for the 10 atmospheric mercury monitoring sites for 2008 through 2010. Mean bulk atmospheric
mercury deposition displayed in units of [µg/m2/yr].
A comparison between the MDN isopleth map (Figure 3) and the South Dakota isopleth map
(Figure 16) shows some similarities. In the eastern half of South Dakota, both studies exhibit
higher deposition rates in the extreme southeastern part of the state. However, Dr. Stone’s data
used in Figure 16 shows differences from the MDN data in the western half of SD. This
difference is likely attributable to the higher resolution monitoring network created by the data
collected at the temporary monitoring sites used for the project. Isopleth deposition values for
northeastern South Dakota were similar, ranging from six to eight µg/m2/year (6-8 g/Km
2/year)
in Figure 16 and four to six µg/m2/year in Figure 3. Similarly, southeastern South Dakota
deposition ranged from six to ten µg/m2/year (8-10 g/Km
2/year).

South Dakota Mercury TMDL Page 64
5.1.3 Atmospheric Mercury Deposition Correlations
A regression analysis showing
significant positive correlation (p <
0.05) was completed comparing
precipitation during sample period
versus atmospheric mercury deposition
at all locations (Figure 17). This
suggests that mercury deposition for
South Dakota conditions is primarily
correlated to rain and snow precipitation
instead of dry matter particulate
deposition that is common in the
western U.S. This conclusion is
consistent with EPA REMSAD
modeling which is further discussed
later in this document.
A regression analysis was completed
comparing the mercury concentration
within the top ten cm of sediment
collected from the ten lakes sampled (as
a part of Dr. Stones study) to
atmospheric deposition rates. The
estimated mercury deposition for each
lake was determined using an isopleths
map. The results of this analysis, a
significant positive correlation between
mercury concentration in ten cm and
atmospheric deposition, are shown in
Figure 18. This trend was expected as
the atmospheric mercury deposition that
is deposited in a specific watershed
would eventually travel into lake
sediments, although the specific
mechanisms of transport would vary
widely depending on topography,
geochemistry, and fluvial
characteristics. These results suggest
that a reduction in atmospheric mercury
deposition would eventually lead to a
decrease in the loading or occurrence of
mercury within lake sediments.
y = 24.3x - 89.0
R² = 0.803
p = 0.0005
0.0
30.0
60.0
90.0
120.0
150.0
180.0
0.0 2.0 4.0 6.0 8.0 10.0 12.0
Mea
n T
op
10
cm
Hg
[n
g/g
]
Atmospheric Hg Deposition [ug/m^2/year]
Figure 18. South Dakota atmospheric mercury deposition versus
the mean mercury concentration top 10 cm of sediment.
Figure 17. Natural log of daily Hg deposition compared to
natural log of precipitation all stations except NEF. (Lupo and
Stone 2013)
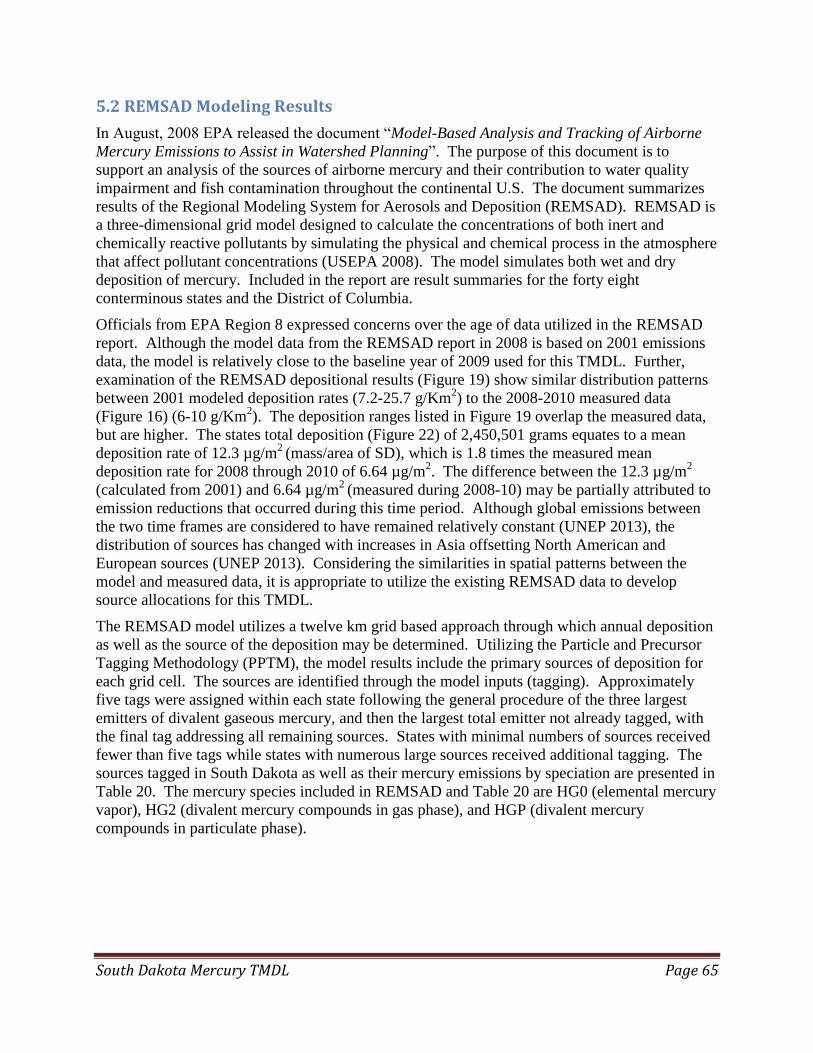
South Dakota Mercury TMDL Page 65
5.2 REMSAD Modeling Results
In August, 2008 EPA released the document “Model-Based Analysis and Tracking of Airborne
Mercury Emissions to Assist in Watershed Planning”. The purpose of this document is to
support an analysis of the sources of airborne mercury and their contribution to water quality
impairment and fish contamination throughout the continental U.S. The document summarizes
results of the Regional Modeling System for Aerosols and Deposition (REMSAD). REMSAD is
a three-dimensional grid model designed to calculate the concentrations of both inert and
chemically reactive pollutants by simulating the physical and chemical process in the atmosphere
that affect pollutant concentrations (USEPA 2008). The model simulates both wet and dry
deposition of mercury. Included in the report are result summaries for the forty eight
conterminous states and the District of Columbia.
Officials from EPA Region 8 expressed concerns over the age of data utilized in the REMSAD
report. Although the model data from the REMSAD report in 2008 is based on 2001 emissions
data, the model is relatively close to the baseline year of 2009 used for this TMDL. Further,
examination of the REMSAD depositional results (Figure 19) show similar distribution patterns
between 2001 modeled deposition rates (7.2-25.7 g/Km2) to the 2008-2010 measured data
(Figure 16) (6-10 g/Km2). The deposition ranges listed in Figure 19 overlap the measured data,
but are higher. The states total deposition (Figure 22) of 2,450,501 grams equates to a mean
deposition rate of 12.3 µg/m2
(mass/area of SD), which is 1.8 times the measured mean
deposition rate for 2008 through 2010 of 6.64 µg/m2. The difference between the 12.3 µg/m
2
(calculated from 2001) and 6.64 µg/m2
(measured during 2008-10) may be partially attributed to
emission reductions that occurred during this time period. Although global emissions between
the two time frames are considered to have remained relatively constant (UNEP 2013), the
distribution of sources has changed with increases in Asia offsetting North American and
European sources (UNEP 2013). Considering the similarities in spatial patterns between the
model and measured data, it is appropriate to utilize the existing REMSAD data to develop
source allocations for this TMDL.
The REMSAD model utilizes a twelve km grid based approach through which annual deposition
as well as the source of the deposition may be determined. Utilizing the Particle and Precursor
Tagging Methodology (PPTM), the model results include the primary sources of deposition for
each grid cell. The sources are identified through the model inputs (tagging). Approximately
five tags were assigned within each state following the general procedure of the three largest
emitters of divalent gaseous mercury, and then the largest total emitter not already tagged, with
the final tag addressing all remaining sources. States with minimal numbers of sources received
fewer than five tags while states with numerous large sources received additional tagging. The
sources tagged in South Dakota as well as their mercury emissions by speciation are presented in
Table 20. The mercury species included in REMSAD and Table 20 are HG0 (elemental mercury
vapor), HG2 (divalent mercury compounds in gas phase), and HGP (divalent mercury
compounds in particulate phase).

South Dakota Mercury TMDL Page 66
Table 20. REMSAD PPTM results: mercury deposition contribution analysis (mercury emissions in tons per year)
(USEPA 2008).
Source Source Type HGO HG2 HGP
Otter Tail Power (Big Stone) Coal Fired Utility 0.03700 0.01800 0.00024
Health Services Health services 0.00600 0.00000 0.00000
Collective Sources (remaining sources in State)
0.00700 0.00300 0.00200
Published state summaries included analysis of the point within each state where simulated in-
state contributions constituted the greatest percentage of total deposition. This point in South
Dakota is located in Butte County and presented in Figure 19. While not representative of the
state as a whole, it represents the maximum amount of impact that instate reductions may have.
Comparing the point of highest contribution to the state averages provides a more thorough
understanding of the impacts that reductions will have on the entire state.
The deposition summary for the point in Butte County is presented in
Figure 20. Deposition is broken down in several ways. Bar charts in the upper left of the figure
present a comparison of the REMSAD and Community Multi-Scale Air Quality (CMAQ)
models while the bar chart in the upper right compares both wet and dry deposition. The chart
indicates that wet deposition rates are larger than dry deposition. This is in agreement Stone’s
monitored data from 2008-2010, which indicated that wet deposition is more strongly correlated
to accumulations than dry deposition.
Figure 19. REMSAD-simulated Total (Wet and Dry) annual mercury deposition (g km2) for South Dakota (USEPA
2008)

South Dakota Mercury TMDL Page 67
Figure 20. South Dakota deposition analysis for the Single grid cell (Blue Triangle in Figure 19) where in-state sources
contributed the most to simulated annual total mercury deposition for 2001 (12.5 g/km2) (USEPA 2008)
The pie charts break out emissions sources in detail. The chart at the lower left indicates that
4.5% of deposition to this grid cell was from sources located within South Dakota. It is
important to note that this is the highest in-state percentage simulated by the model and that the
statewide average is significantly lower. The pie charts in the lower right portion of the figure
utilize the same data, but progressively remove a component in each step. The first pie
represents the proportion of sources when background emissions (grey portion of first pie) are
removed. Background, defined by REMSAD as the model’s boundary conditions, represents
sources (both natural and anthropogenic) originating outside of the REMSAD modeling domain,
consisting of the continental United States plus parts of Canada and Mexico, and emissions
originating within but transported outside of the modeling domain that become part of the global
pool.The final pie breaks down only those sources located within the state. The collective
sources tag represents all other sources not individually tagged. Since the three largest emitters
of divalent gaseous mercury within the state combined to account for only 0.01% of the total
deposition, the data clearly indicates that there are no single sources of mercury within the state
that are contributing significantly to the deposition in South Dakota.

South Dakota Mercury TMDL Page 68
Understanding the maximum impacts that in-
state reductions will have may be gained
through analysis of the Butte County grid cell.
However, it is not appropriate to use for
source allocations on a statewide basis. To
address the statewide depositional rates, EPA
utilized the AggreGATOR tool developed by
ESRI for EPA. The tool calculates mass
loading to a polygon of interest, in the case of
this TMDL it was applied to the entire state.
The functional outputs of the process are a
summary of the REMSAD modeling results
for the entire state.
The contribution of state scale sources follows
a similar distribution to Butte County, the
point of highest in-state source contribution.
The data in Figure 21 and Figure 22 present
potential sources in two separate methods. In
each chart the two largest sources remain
static: background and re-emission at 92% and
4%, respectively. The remaining sources
accounted for less than 4% of all deposition in
the state. Figure 21 includes the South Dakota
portion within the ‘Other Sources’ tag and
breaks down primary sources in North
America. These include Canada, Wyoming,
Iowa, and Texas. In combination, these
sources account for 0.73% of deposition in the
state.
The data in Figure 22 aggregates the North
American sources into the other sources tag
and separates out three individual sources
from within South Dakota. These include
Health Services, Otter Tail Power Company
(Big Stone), and all other South Dakota
Sources. The contribution from each of these
is too small to be visible in the pie chart and
collectively the three account for 0.12% of the
deposition occurring in the state.
The percentage contributions presented in
Figure 21 and Figure 22 are applicable to the
area addressed by this TMDL. These values
were used to establish the source allocations in
the final TMDL calculations.
Figure 21. South Dakota mercury deposition with
North American sources summarized (Atkinson 2014)
Figure 22. South Dakota mercury deposition with
South Dakota sources summarized (Atkinson 2014).
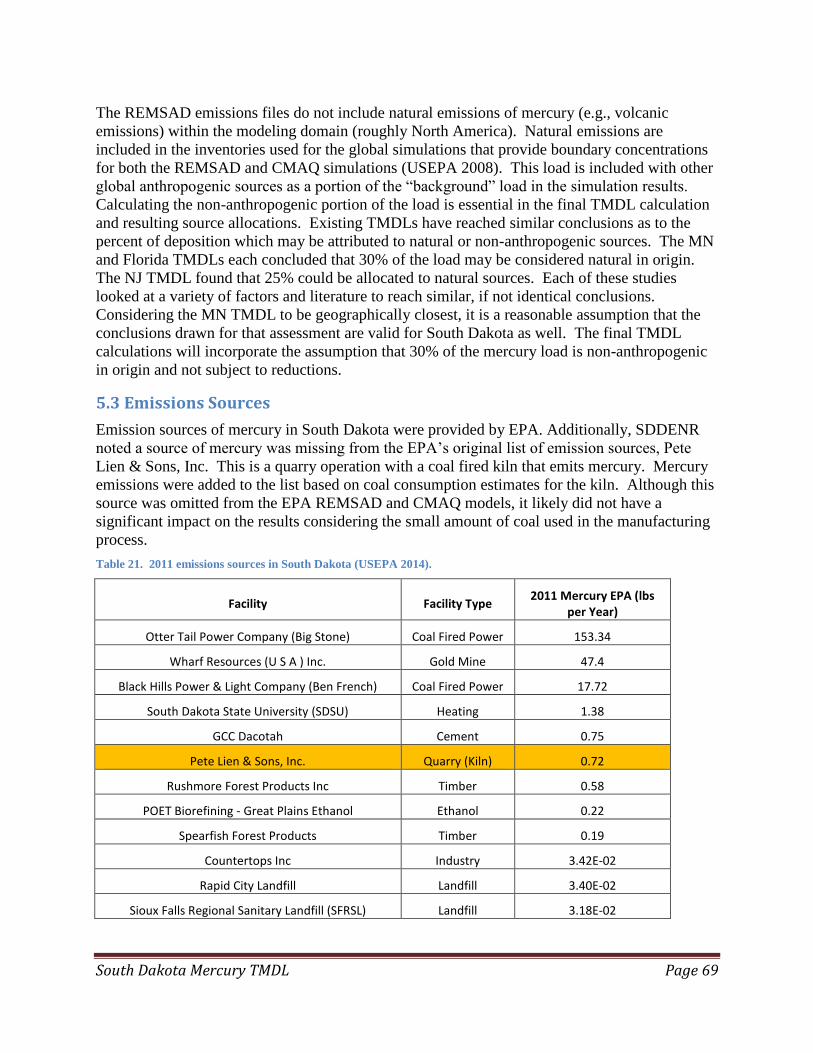
South Dakota Mercury TMDL Page 69
The REMSAD emissions files do not include natural emissions of mercury (e.g., volcanic
emissions) within the modeling domain (roughly North America). Natural emissions are
included in the inventories used for the global simulations that provide boundary concentrations
for both the REMSAD and CMAQ simulations (USEPA 2008). This load is included with other
global anthropogenic sources as a portion of the “background” load in the simulation results.
Calculating the non-anthropogenic portion of the load is essential in the final TMDL calculation
and resulting source allocations. Existing TMDLs have reached similar conclusions as to the
percent of deposition which may be attributed to natural or non-anthropogenic sources. The MN
and Florida TMDLs each concluded that 30% of the load may be considered natural in origin.
The NJ TMDL found that 25% could be allocated to natural sources. Each of these studies
looked at a variety of factors and literature to reach similar, if not identical conclusions.
Considering the MN TMDL to be geographically closest, it is a reasonable assumption that the
conclusions drawn for that assessment are valid for South Dakota as well. The final TMDL
calculations will incorporate the assumption that 30% of the mercury load is non-anthropogenic
in origin and not subject to reductions.
5.3 Emissions Sources
Emission sources of mercury in South Dakota were provided by EPA. Additionally, SDDENR
noted a source of mercury was missing from the EPA’s original list of emission sources, Pete
Lien & Sons, Inc. This is a quarry operation with a coal fired kiln that emits mercury. Mercury
emissions were added to the list based on coal consumption estimates for the kiln. Although this
source was omitted from the EPA REMSAD and CMAQ models, it likely did not have a
significant impact on the results considering the small amount of coal used in the manufacturing
process.
Table 21. 2011 emissions sources in South Dakota (USEPA 2014).
Facility Facility Type 2011 Mercury EPA (lbs
per Year)
Otter Tail Power Company (Big Stone) Coal Fired Power 153.34
Wharf Resources (U S A ) Inc. Gold Mine 47.4
Black Hills Power & Light Company (Ben French) Coal Fired Power 17.72
South Dakota State University (SDSU) Heating 1.38
GCC Dacotah Cement 0.75
Pete Lien & Sons, Inc. Quarry (Kiln) 0.72
Rushmore Forest Products Inc Timber 0.58
POET Biorefining - Great Plains Ethanol Ethanol 0.22
Spearfish Forest Products Timber 0.19
Countertops Inc Industry 3.42E-02
Rapid City Landfill Landfill 3.40E-02
Sioux Falls Regional Sanitary Landfill (SFRSL) Landfill 3.18E-02

South Dakota Mercury TMDL Page 70
When considering specific loads from the facilities listed, it is important to note that loads are
variable from year to year. Power generation facilities, although listing a particular load, may
produce higher or lower loads in any given year as power demands from these facilities are
balanced with regional alternative power supplies such as wind and hydroelectric. The
reductions in this TMDL will focus more closely on percentages than reported loads from a
given year.
The largest source in South Dakota is the Otter Tail Power Company (Big Stone), located in the
northeast corner of the state, which utilizes coal for the generation of power. EPA emission
reduction mandates through MATS are scheduled to take effect on this plant during the 2015-
2016 calendar years. EPA has claimed that “The final rule establishes power plant emission
standards for mercury, acid gases, and non-mercury metallic toxic pollutants which will result
in: preventing about 90 percent of the mercury in coal burned in power plants being emitted to
the air; reducing 88 percent of acid gas emissions from power plants; and reducing 41
percent of sulfur dioxide emissions from power plants beyond the reductions expected from the
Cross State Air Pollution Rule.” (USEPA 2015)
Two additional facilities have made adjustments to their operations that further reduce mercury
emissions in the state. Black Hills Power & Light Company shut down its coal fired power plant
at its Ben French facility in Rapid City in 2014. SDSU is still permitted to burn coal for the
generation of heat in its physical plant; however, the facility has chosen not to in recent years.
Although there is some capacity to burn coal remaining, in most years very little if any coal is
burned, resulting in reductions approaching 100%.
Including the reductions from Otter Tail Power Company (Big Stone Power Plant) and the
decommissioned Black Hills Power & Light Company Power Facility (Ben French) South
Dakota will be able to achieve a 70% decrease in mercury emissions (i.e., cumulative emissions
from Table 21 [222.4 lbs/yr] minus expected reduction from Otter Tail Power Company [153.34
x 0.9 = 138.006 lbs/yr] minus expected reductions from Black Hills Power & Light Company
[17.72 lbs/yr] equates to a predicted future in-state emissions total of 66.674 lbs/yr, which is a
70% reduction from the 2011 estimate of 222.4 lbs/yr). SDSU was not included in the estimated
reductions as the facility is still permitted to burn coal. However, the resulting lack of use will
help achieve an additional level of reduction.
5.4 Baseline Year
The basis of mercury deposition estimates for South Dakota commenced in 2009 when the
expanded air deposition monitors were installed through Dr. Stone’s project through SDSM&T.
The year 2009 was used as a loading or occurrence reference point (baseline) to which future
mercury loading will be compared for mercury TMDL attainment. The year 2009 also works
with the fish tissue data, which was primarily collected from 2010 to 2014. The more recent fish
tissue data should incorporate some bioaccumulation of the methylmercury that resulted from
2009 emissions. It can be assumed that once the TMDL has been approved and implemented,
future fish tissue mercury concentrations would be expected to decrease due to reductions in
mercury loading.
According to the Minnesota TMDL (2007), patterns in the predicted time required for a decrease
in fish tissue mercury should remain fairly consistent for all locations throughout the United
States. An example of mercury loading reduction and subsequent fish tissue behavior is
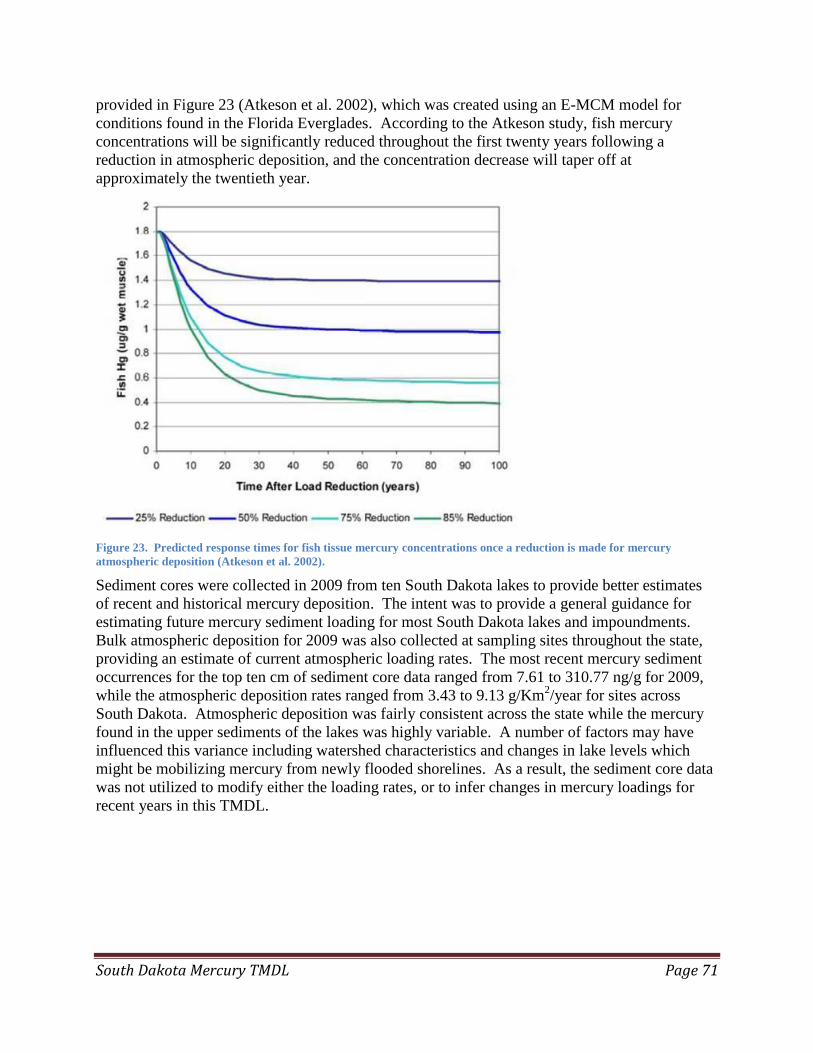
South Dakota Mercury TMDL Page 71
provided in Figure 23 (Atkeson et al. 2002), which was created using an E-MCM model for
conditions found in the Florida Everglades. According to the Atkeson study, fish mercury
concentrations will be significantly reduced throughout the first twenty years following a
reduction in atmospheric deposition, and the concentration decrease will taper off at
approximately the twentieth year.
Figure 23. Predicted response times for fish tissue mercury concentrations once a reduction is made for mercury
atmospheric deposition (Atkeson et al. 2002).
Sediment cores were collected in 2009 from ten South Dakota lakes to provide better estimates
of recent and historical mercury deposition. The intent was to provide a general guidance for
estimating future mercury sediment loading for most South Dakota lakes and impoundments.
Bulk atmospheric deposition for 2009 was also collected at sampling sites throughout the state,
providing an estimate of current atmospheric loading rates. The most recent mercury sediment
occurrences for the top ten cm of sediment core data ranged from 7.61 to 310.77 ng/g for 2009,
while the atmospheric deposition rates ranged from 3.43 to 9.13 g/Km2/year for sites across
South Dakota. Atmospheric deposition was fairly consistent across the state while the mercury
found in the upper sediments of the lakes was highly variable. A number of factors may have
influenced this variance including watershed characteristics and changes in lake levels which
might be mobilizing mercury from newly flooded shorelines. As a result, the sediment core data
was not utilized to modify either the loading rates, or to infer changes in mercury loadings for
recent years in this TMDL.
South Dakota Mercury TMDL Page 72
6.0 Wasteload Allocation (WLA)
The TMDL wasteload allocation accounts for point source contributions of mercury and much of
their contributions are described in greater detail throughout section 4.0 Source Assessment –
Point Sources.
Presently, all mine sites that are known to have a reasonable potential to result in water quality
impairments of any kind have NPDES permits which limit mercury discharges. Historically
discharged tailings discussed in section 4.1 do not appear to be a contributing factor to the states
elevated fish tissue methylmercury concentrations measured since the late 1990’s.
MS4 loads are typically addressed as individual WLA’s; however, the modeling and atmospheric
measurements fully accounted for their contributions within the LA, as discussed in section 4.2.
Although the source of mercury to MS4’s is atmospheric, EPA has dictated that they must be
included in WLA component of this TMDL.
There are 247 NPDES facilities (Appendix E) permitted to discharge effluent to South Dakota
surface waters. These permits cover industries such as ethanol and railcar repair facilities as well
as municipalities, mines, and fish hatcheries. Total aggregate annual flow from NPDES facilities
equaled 43 billion gallons. A concentration of 0.01536 µg/L was applied to this water load
based on rationale discussed in section 4.3. The sum of mercury loads from these facilities
equaled 2.53 kg/yr and was used for the WLA in the final TMDL. In aggregate, they account for
less than 0.2% of the total source load and 0.43% of the final TMDL. Although the WLA
contribution was determined to be de minimis (Section 4.3) and thus not subject to reductions, it
is not an allowance for increased discharges of mercury, nor does it provide exemption from
further efforts to reduce mercury from these sources.
7.0 Load Allocations (LA)
The majority of this TMDL is accounted for in the Load Allocation component. The major
source of mercury for waters in South Dakota is air deposition (>99%) and this component is
subject to all the reductions required for TMDL attainment. REMSAD modeled contributions
used for the baseline year (percentage from source) from all nonpoint sources are presented in
Table 22. Measured loads calculated in Section 5.0 did not include point source discharges of
mercury. To accurately calculate the allocations for the nonpoint sources, point source loads
were factored into the total source load (TSL) (see section 10 Table 24). The resulting reduction
necessary for the LA was 79% which was applied evenly to all anthropogenic sources. It is
important to reiterate that the background portion (92.79%) includes both natural and global
anthropogenic sources of mercury. As identified in section 5.2, 30% of this portion of the load is
assumed to originate from non-anthropogenic (natural) sources and is therefore not subject to
load reductions.

South Dakota Mercury TMDL Page 73
Table 22. REMSAD modeled sources of mercury.
Modeled Air Deposition
All Sources 100.00%
Background 92.79%
Reemission 4.08%
Other Sources 2.29%
Other US States 0.48%
Canada 0.24%
South Dakota 0.12%
The source allocations for the LA component of the TMDL contribute an area weighted
proportion to the MS4s and the rural areas of the state. The MS4s account for 0.39% of the state
area while the remaining 99.61% of the state is considered rural. Although a part of the load
allocation, the MS4 portion of this load was sub calculated to identify the specific portion of the
TMDL attributable to deposition occurring in urban areas. To obtain these loads, the LA was
multiplied by the percentage from each category, the resulting split is calculated in section 10
Table 24 with the MS4 portion being then redefined as a WLA, even though it is calculated and
tied directly to the LA.
8.0 Margin of Safety (MOS)
According to 40 C.F.R. 130.7, TMDLs must include a margin of safety to account for any lack of
knowledge concerning the relationship between effluent limits and water quality. A MOS may
be implicit through the use of conservative estimates within the calculations or explicitly stated
reserving a portion of load allocation to account for uncertainty. The following conservative
assumptions were incorporated into the implicit MOS for South Dakotas Mercury TMDL:
In the calculation of the standard length fish concentration (WE38=0.669 mg/Kg), fish
tissue sampling utilized a process where waterbodies with fish consumption advisories
were targeted for additional sampling, i.e. fish flesh MeHg concentrations exceeded 1.0
mg/Kg. As a result, the concentration of 0.669 mg/Kg is biased towards those
waterbodies considered impaired three times beyond the recommended EPA criterion of
0.3 mg/Kg. Removing the bias would result in a lower, but less protective, concentration
of 0.586 mg/Kg for all waters of the state. Using the higher concentration of 0.669
mg/Kg for TMDL calculations provides a substantial implicit margin of safety that was
incorporated into the TMDL calculation.
Reductions for this TMDL are based on reductions in total fish tissue mercury while the
EPA criterion is for methylmercury. Additional implicit MOS is incorporated into the
TMDL through the assumption that not all of the mercury measured is methylmercury.
Approximately 83% of fish tissue measurements are in the form of methylmercury
(Driscoll et al. 2007; Kannan et al. 1998) adding to the potential for an increased MOS.
Walleye typically contain the highest levels of methylmercury in comparison to other
species due to the species top predator status. Reductions adequate to achieve the TMDL
goal for walleye will result in proportional reductions in other species. These
proportional reductions will result in other species attaining the TMDL sooner as well as
South Dakota Mercury TMDL Page 74
reducing concentrations in these species to well below the TMDL goal when it is
achieved for walleye.
As a regional TMDL, reductions were biased towards the most severely impaired waters
in the state. The primary source of the pollutant (mercury) is atmospheric deposition, and
it is expected that as emissions are curbed, reductions statewide will be proportional.
Although a reduction of 79% is called for in the TMDL, lesser reductions would fully
attain the TMDL goal for many of the waters, thus further incorporating an implicit
margin of safety for a majority of the waters in the state.
Approved TMDLs from Minnesota, the Northeast, and New Jersey all included
reductions in sulfur emissions as an added margin of safety. A great deal of research
(Branfireun et al. 1999; Gilmour and Henry 1991; Gilmour et al. 1992; Jeremiason et al.
2006; Jeremiason et al. 2003) has been conducted linking increased sulfates to a more
efficient methylation process. Sulfate-reducing bacteria (SRB) convert inorganic
mercury into methylmercury using sulfur rather than oxygen as part of their metabolic
processes. Reductions in sulfur emissions as a result of the 1990 Clean Air Act are
expected to reduce SRB activity lowering the amount methylated mercury available for
bioaccumulation.
9.0 Critical Conditions and Seasonality
As required by 40 CFR 130.7(c)(1), TMDLs need to be established at levels that attain and
maintain applicable water quality standards with seasonal variations. TMDLs must also consider
critical conditions for stream flow, loading, and water quality. These requirements were
incorporated in the final TMDL through:
The primary seasonal condition considered for this TMDL relates to precipitation
patterns. Wet deposition of mercury increases during seasons with increased rainfall.
Seasonal rainfall may also result in river and stream connectivity to adjacent wetland
areas that have higher methylation rates. These factors affect the overall concentration of
mercury; however, fish tissue mercury concentrations are the product of bioaccumulation
throughout the lifespan of the fish. The concentration of mercury in the fish at the time
of sample collection includes aspects of seasonality since it is a product of the
aforementioned conditions.
To account for the depositional variability that results from seasonal precipitation, the
TMDL was initially calculated as an annual load prior to conversion to a daily load.
Basing the initial calculation on annual deposition rates fully incorporates the seasonality
requirement of the TMDL, which is ultimately reflected in the final daily calculation.
Numerous critical conditions have been linked to methylation rates throughout the
country. Conditions that are frequently mentioned in publications include presence of
wetlands, sulfates, depleted oxygen levels, pH, and trophic status. The conditions which
were determined to be the most influential factors in determining methylation rates
(section 3.0 Data Analysis) for South Dakota waters include presence of wetlands and
Secchi depth (both of which were negative correlations) and highly variable lake levels.
These conditions are correlated to the waters with the highest mercury concentrations.
The development of the reduction targets included the critical conditions described in
Section 5.0. Through calculation of the TMDL on a regional level requiring reductions

South Dakota Mercury TMDL Page 75
adequate to meet the conditions of the most severely impaired waters, these factors are
accounted for within the final calculation.
10.0 Final TMDL Calculations
The primary components in defining the South Dakota TMDL calculation include estimating the
existing atmospheric load (non-point source load), selecting the target atmospheric load, and
calculating the atmospheric load reduction required to meet the target load. The Total Source
Load (TSL) is the total atmospheric deposition in Kg/yr plus the point source load discussed in
sections 4 and 5, respectively.
Table 23 presents the sources of mercury, calculates the Total Source Load (TSL), and applies
the Reduction Factor (RF) to calculate the TMDL. The point sources described in section 4.3 are
represented as derivative A. The nonpoint source or atmospheric load is based on instate
deposition monitoring. South Dakota’s average atmospheric mercury deposition is
approximately 0.00664 kg/km2/yr (6.64 µg/m2/yr). The state’s area is 199,742.5 km2. Thus, the
product of the two is 1,326.3 kg/yr (derivative B). Derivative B is then sub allocated amongst
the six REMSAD source categories based on the modeled percentages (derivatives b1-b6). The
TSL sums the atmospheric deposition and the point source loads, which were considered
separate from the atmospheric modeling or the deposition sampler estimates. The sum of these
loads (TSL) is represented as derivative C. The RF from section 3.3 (derivative D) is then used
to calculate the TMDL from the TSL.
Table 23. TMDL calculations
Sources Derivation Load (kg/yr)
Point Sources (NPDES) - Section 4.3 A 2.53
Nonpoint Sources or Atmospheric - Section 5.1.2 B 1326.30
Global Background - 92.79% b1 1230.67
Reemission - 4.08% b2 54.11
Other Sources - 2.29% b3 30.37
Other US States - 0.48% b4 6.37
Canada - 0.24% b5 3.18
South Dakota - 0.12% b6 1.59
Total Source Load (TSL) C=A+B 1328.83
Reduction Factor (RF) - Section 3.3 D 55.2%
TMDL E = C*(1-D) 595.32
Table 24 shows 30% of the REMSAD modeled loadings were considered to be from non-
anthropogenic background, i.e. natural sources, and were removed from the overall load subject
to reductions (derivative F). Removing the background load and the point sources (which were
not subject to reductions as described in section 4.3) from the TMDL, the balance of the load
(derivative H) is divided into the following components: 1) the municipal areas regulated
through MS4s (derivative h1); and 2) the remaining area of the State that falls outside of those
MS4s permits (derivative h2). Derivative I is the percent reduction required from anthropogenic
non-point sources necessary to achieve the TMDL target. The final allocation of the LA, WLA,
and MOS are then shown.

South Dakota Mercury TMDL Page 76
Table 24. TMDL allocations
TMDL Calculations Derivation Load kg/yr
Point Sources (NPDES) - Section 4.3 A 2.53
Non-Anthropogenic Background (cannot be reduced) F=0.3*B 397.89
Anthropogenic Nonpoint Sources or Atmospheric G= E-A-F 194.90
Atmospheric Total H=G+F 592.79
MS4 fraction - 0.39% h1=H*0.0039 2.31
Non MS4 Fraction - 99.61% h2=H*0.9961 590.47
Percent Reduction for Anthropogenic Atmospheric Sources I=(((B-F)-G)/(B-F))*100 79.01%
Load Allocation (LA) LA = H-h1 590.48
Wasteload Allocation (WLA) WLA = A+h1 4.84
Margin of Safety (MOS) MOS = Implicit 0.00
Final TMDL TMDL = LA+WLA+MOS 595.32
The annual loads are significantly more important for expressing loading limits and reduction
goals due to the chronic nature of mercury impairments and their long term bioaccumulation
rates in fish. The conventional equation for a TMDL is: MOS + WLA + LA = TMDL. For this
TMDL, the MOS is implicit. The WLA and LA components are described in sections 6.0
Wasteload Allocation (WLA) and 7.0 Load Allocations (LA), respectively.
Table 25. TMDL annual calculation
Annual Calculation
TMDL(595.32 Kg/yr) = WLA (4.84 Kg/yr) + LA(590.48 Kg/yr) + MOS (implicit)
Compliance with the TMDL calculations is based on the annual loads. However, in order to
comply with EPA guidance, the TMDL needs to be expressed as a daily load. To identify a
maximum daily limit, a method from EPA’s “Technical Support Document For Water Quality-
Based Toxics Control,” referred to as the TSD method (USEPA 1991), was used. This method,
which is based on a long-term average load that considers variation in a dataset, is a
recommended method in EPA’s technical guidance “Options for Expressing Daily Loads in
TMDLs” (USEPA 2007).
The TSD method is represented by the following equation:
MDL = LTA + Zp*σ
where,
MDL = maximum daily limit in kg/day
LTA = long-term average=μ, 595.32 kg/yr converted to 1.63 kg/day
Zp= z statistic of the probability of occurrence= 1.645
σ =CV/μ
CV = coefficient of variation
The daily load expression is identified as a static maximum daily limit (MDL). A higher value
for the MDL is produced for the same long term average (LTA) as the CV increases, in order to
allow for fluctuations about the mean. Assuming a probability of occurrence of 95% and a CV
of 1.569 (based on Eagle Butte Hg deposition data), the MDL corresponding with an LTA of
595.32 kg/yr is 3.21 kg/day.

South Dakota Mercury TMDL Page 77
11.0 Reasonable Assurance and Implementation
Reasonable assurance that a TMDL will be attained is required when reductions in the LA are
used to balance less stringent reductions in the WLA. This is necessary due to the nature of
South Dakota as a primarily rural state and the transport mechanisms of mercury, over 99% of
mercury loading enters the waterways from nonpoint sources. As a result, this TMDL requires
all reductions to occur through the LA. The amount of mercury which can be attributed to point
sources (WLA) is small enough that reductions in any form or amount would not yield a
measureable effect on fish tissue samples.
South Dakota has a limited quantity of reductions which may be achieved in the state. South
Dakota emissions data has consistently ranked as the third lowest emitter of mercury in the
nation (USEPA 2008). Federal mandates are in line to account for the majority of the necessary
79% reduction from within the state.
The single largest source of mercury in South Dakota is the Otter Tail Power Company (Big
Stone) located in the northeast corner of the state which uses coal for the generation of power.
EPA emissions mandates (MATS) are set to take effect on this plant during the 2015-2016
calendar years. EPA has predicted that the impacts of MATS rule will result in approximately
90% cleaner emissions (USEPA 2015) from this facility.
Two additional facilities have made adjustments to their operations that further reduce mercury
emissions in the state. Black Hills Power & Light Company permanently shut down its coal
fired power plant at its Ben French facility in Rapid City in 2014. SDSU is still permitted to
burn coal for the generation of heat in its physical plant; however, the facility has chosen not to
in recent years. Although there is some capacity to burn coal remaining, in most years very
little if any coal is burned, resulting in reductions approaching 100%.
The majority of sources exist outside of the state, thus nonpoint source reductions in South
Dakota will primarily result from existing and proposed federal rules, e.g. the Mercury Air and
Toxics Standards (MATS) rule, which can be found on the following EPA websites
(http://www.epa.gov/mercury/regs.htm and http://www.epa.gov/mats/powerplants.html).
On February 16, 2012, the Mercury Air and Toxics Standards (MATS) rule was promulgated in
77 FR 9464. The intent of the rule is to limit power plant emissions of toxic air pollutants such
as mercury, arsenic, and metals. The establishment and subsequent revisions of these rules will
provide an ongoing reduction effort at the national level which will result in progress towards
the attainment of this TMDL. Please note that the recent U.S. Supreme Court decision
(Michigan v. US EPA) adds uncertainty to MATS rule, however, this TMDL assumes its
continued and full implementation; indeed many of the affected power plants (including Otter
Tail Power Company - Big Stone) throughout the country are already in the process of
installing the necessary controls needed to cut mercury and other emissions.
An outline of these rules, as available from EPA, follows:
These rules finalize standards to reduce air pollution from coal and oil-fired power
plants under sections 111 (new source performance standards) and 112 (toxics program)
of the 1990 Clean Air Act amendments.
Emissions standards set under the toxics program are federal air pollution limits that
individual facilities must meet by a set date. EPA must set emission standards for existing
South Dakota Mercury TMDL Page 78
sources in the category that are at least as stringent as the emission reductions achieved
by the average of the top 12 percent best controlled sources.
These rules set technology-based emissions limitation standards for mercury and other
toxic air pollutants, reflecting levels achieved by the best-performing sources currently in
operation.
The final rule sets standards for all hazardous air pollutants (HAPs) emitted by coal- and
oil-fired electric generating units (EGUs) with a capacity of 25 megawatts or greater.
All regulated EGUs are considered major under the final rule. EPA did not identify any
size, design or engineering distinction between major and area sources.
Existing sources generally will have up to 4 years if they need it to comply with MATS.
o This includes the 3 years provided to all sources by the Clean Air Act. EPAs
analysis continues to demonstrate that this will be sufficient time for most, if not
all, sources to comply.
o Under the Clean Air Act, state permitting authorities can also grant an additional
year as needed for technology installation. EPA expects this option to be broadly
available. (USEPA 2014).
In addition further reductions will follow with the participation of the United States in
international agreements designed to curtail mercury pollution. In November 2013, the United
States signed the Minamata Convention on Mercury. This multilateral environmental agreement
addresses human activities contributing to the global problem of mercury pollution. EPA
worked with the State Department and other federal agencies in negotiating a set of approaches
that strengthen the global action on mercury (UNEP 2013). These sets of federal rules and
international instruments will result in the largest reductions for South Dakota. They target
larger industry and coal fired power plants which, unlike the larger population centers on the
eastern and western parts of the United States, do not exist in South Dakota in any significant
fashion as shown in Figure 22. In the 2012 Compendium of States Mercury Activities it was
reported that for period of 1990 to 2008 reductions in atmospheric mercury sources reached up to
70% nationally and in some states 90% (ECOS, 2012). .
The measures South Dakota can implement are limited because of the global nature of mercury.
Section 5.0 (Source Assessment) outlines ad nauseum the mercury sources derived instate via
MS4, NPDES permits, and nonpoint sources which are derived through atmospheric generators.
This section shows the order of magnitude difference between instate sources versus atmospheric
sources (globally). Although energy efficiency and renewable energy projects such as wind
power are aiding in the reduction of atmospheric mercury sources, the best efforts for South
Dakota implementation will focus across two additional areas outside of the already discussed air
emissions; point sources and solid waste.
11.1 Point Sources
11.1.1 Dental
The Federal Register (FR) cites an American Dental Association study which estimated that 50%
of mercury entering POTWs was contributed by dental offices (page 63260). On October, 22,
2014, EPA proposed Effluent Limitations Guidelines and Standards for the Dental Category (79
FR 63258). This proposed rule states that wastewater from dental offices that use and/or remove
amalgam containing mercury shall remove 99% of the mercury entering the sanitary sewer
South Dakota Mercury TMDL Page 79
system. Once the rule is finalized, the state of South Dakota will be required to implement this
regulation for all municipalities that do not have an approved pretreatment program. Cities with
approved pretreatment programs will be required to implement these regulations as part of their
pretreatment program. Under the proposed rule, dental offices will be required to submit yearly
certifications if they are using amalgam separators that remove 99% of solids. If dental offices
do not provide the yearly certification, they will be considered a significant industrial user and
will need to submit wastewater monitoring data showing that they meet the 99% mercury
removal. As this rule is still in the proposal phase, it is unclear at this point the amount of impact
that will result if implemented.
11.1.2 POTWs and NPDES Permitted Sources
South Dakota has required that certain NPDES permittees monitor for mercury in their effluent.
Effluent sampling for mercury is only required if the industrial and manufacturing community
discharging to the POTW has the potential to be a source of mercury based on their
manufacturing process. Currently, the seven of the largest POTWs within the State have
implemented pretreatment programs. The approved programs look at the loading to their plants
and develop local limits for pollutants of concern, including mercury. These cities will continue
to evaluate the wastewater entering their system and will do periodic reviews to determine if new
or more stringent mercury local limits are necessary.
11.1.3 MS4s
The six minimum measures that operators of regulated small MS4s must implement are outlined
below. Each of these measures contributes to the reduction of water and sediment runoff from
within the facilities. Although the MS4 area in South Dakota accounts for only 0.39% of the
state’s area, any measure which reduces the delivery of either wet or dry deposited mercury to
the surface waters of the state can be deemed beneficial towards reaching the TMDL goal.
Public Education and Outreach
Public Participation/Involvement
Illicit Discharge Detection and Elimination
Construction Site Runoff Control
Post-Construction Runoff Control
Pollution Prevention/Good Housekeeping
11.2 Solid Waste
Spent standard fluorescent bulbs, high intensity discharge lamps, batteries, thermostats,
pesticides, and switches may contain enough mercury to cause them to be regulated under state
and federal hazardous waste requirements. To promote the collection and recycling of these
commonly used mercury-containing products, EPA allowed these items to be classified as
universal waste when it came time to dispose of them (40 CFR 273). Recycling under the
federal Universal Waste rules, adopted by reference in this state, became a more viable
management option for many small businesses. The Universal Waste Rule provides a regulatory
incentive for businesses that opt to recycle mercury containing wastes and helps keep the
mercury from being disposed of in solid waste municipal landfills and thus reduce releases of
South Dakota Mercury TMDL Page 80
mercury to the environment. State inspectors have noted an increase in the number of small
businesses who have opted to recycle their mercury-containing wastes rather than legally
disposing them in municipal solid waste facilities. State inspectors also encourage companies to
switch light bulbs to low or no mercury-containing bulbs. Further information on mercury-
containing wastes recycling options within the state of South Dakota may be obtained at the
SDDENR Hazardous Waste Program webpage.
South Dakota Mercury TMDL Page 81
12.0 Monitoring
Continued monitoring is an essential component of any TMDL. It is needed to determine TMDL
applicability and evaluate attainment for South Dakota waterbodies. Monitoring efforts
evaluating fish tissue concentrations, air deposition, and water column concentrations all
contribute to this evaluation. Global reductions in mercury are expected to occur in an
incremental fashion. Monitoring air deposition will provide information on progress towards
these reductions and captures data gaps in sources (UNEP 2013). In addition to identifying
impairment status of a waterbody, continued fish tissue monitoring will contribute towards a
better understanding of methylation processes. Improved water column monitoring at NPDES
facilities is necessary to better characterize their contributions to the total mercury load in the
state.
12.1 Depositional Monitoring
Since the initial phases of development of this TMDL, the Mercury Deposition Network
(MDN) has grown its number of monitoring sites. As of 2015, South Dakota had a permanent
site in Eagle Butte, SD, and a site located on the border of Nebraska at Santee, established in
2013. These sites in addition to those located in other neighboring states will provide for
continued monitoring of progress towards reductions in deposition.
12.2 Fish Tissue
Fish tissue monitoring in South Dakota is a collaborative effort between the Department of
Health, the Department of Game, Fish, and Parks, and the Department of Environment and
Natural Resources. Waterbodies are selected for monitoring based on fishing pressure and
fishery management objectives. Waterbodies are initially sampled for specific pesticides,
PCBs, and some metals including mercury. South Dakotas standard protocol is for each fish
length to be measured and either a whole fish or a biopsy plug of muscle tissue to be submitted
for individual analysis. After the initial screening is complete, additional testing for specific
pollutants is conducted. In the case of mercury, five fish are collected and individually tested
for mercury concentrations. Individual fish analysis is an adjustment to the assessment
methodology which was adopted in 2010. Previously, five fish composite samples were
collected which did not provide variability in the data. This adjustment filled a significant data
gap and continued use of this method will be necessary for evaluating TMDL progress and
attainment.
Waterbodies found to have maximum fish tissue mercury concentrations greater than 0.5
mg/Kg or those with fish consumption advisories are resampled at five year intervals.
Waterbodies with maximum fish tissue mercury concentrations below 0.5 mg/Kg are resampled
at ten to fifteen year intervals. The use of the 0.5 mg/Kg or consumption advisory triggers is
not to be confused with the 0.3 mg/Kg EPA criteria. These triggers are simply a planning tool
to help allocate limited funding to waters that have fish with the highest levels of
methylmercury. A list of waters with fish tissue mercury data is kept current on SDDENRs
web site: http://denr.sd.gov/des/sw/fish.aspx.
12.3 Water Column Monitoring
Monitoring data for NPDES facilities presented challenges to calculating an accurate load.

South Dakota Mercury TMDL Page 82
Much of the existing data was analyzed using methods that were insufficiently accurate to
detect the low levels of mercury originating from these sources. This gap in knowledge has
been addressed by EPA when it issued the sufficiently Sensitive Test Methods for Permit
Applications and Reporting Rule in August of 2014. The rule states:
“The U.S. Environmental Protection Agency (EPA) has finalized minor amendments to its
Clean Water Act (CWA) regulations to codify that under the National Pollutant Discharge
Elimination System (NPDES) program, where EPA has promulgated or otherwise approved
analytical methods under 40 CFR Part 136, or 40 CFR Chapter I, subchapters N and O,
permit applicants must use “sufficiently sensitive” analytical test methods when completing
an NPDES permit application. Also, the Director (head of the permit-issuing authority) must
prescribe that only “sufficiently sensitive” methods be used for analyses of pollutants or
pollutant parameters under an NPDES permit.” (USEPA 2014)
Promulgation of this rule will result in facilities testing mercury concentrations with methods
that are accurate enough to detect the low levels of mercury found in their effluent. The
complete text of this rule is available at EPA NPDES Sufficiently Sensitive Test Methods.

South Dakota Mercury TMDL Page 83
13.0 Public Participation
This section will highlight the components of the public notice period once it is complete.
Prior to the public notice of the mercury TMDL the state was, and continues to be, active in
informing the public about health concerns related to the presence of fish with elevated mercury
levels.
The South Dakota Departments of Health, Game Fish and Parks, and Environment and Natural
Resources use a collaborative approach to monitoring, issuing advisories, and educating the
public about mercury. Each agency maintains information regarding consumption advisories on
its website (listed below) with links to the cooperating agencies information. In addition to
traditional websites, the use of social media for public information is a developing avenue for
agencies to inform the public about mercury issues.
SDDOH – https://doh.sd.gov/food/mercury.aspx?
SDGFP – http://gfp.sd.gov/fishing-boating/fish-consumption-advisoiries.aspx
SDDENR – http://denr.sd.gov/des/sw/fish.aspx
South Dakota Game Fish and Parks includes the most current list of fish consumption advisories
in its annual fishing regulations publications. Individual lakes with consumption advisories are
posted at public access points. Figure 24 shows a typical sign posted at public access points
where a fish consumption advisory has been issued.
Figure 24. Example fish Consumption advisory posting.
The public notice period for this TMDL resulted in no public comments beyond what EPA
provided through both formal and informal reviews.
This TMDL was noticed in the following newspapers in September of 2015:
Sioux Falls Argus Leader
Rapid City Journal
Aberdeen American News
Pierre Capital Journal
Native Sun News
South Dakota Mercury TMDL Page 84
In addition to advertising in the aforementioned news sites, the following groups and agencies
were also notified directly.
Federal Agencies
Environmental Protection Agency
U.S. Dept. Agriculture – NRCS
U.S. Forest Service
U.S. Geological Survey
U.S. Fish & Wildlife Service
Bureau of Land Management (PN only, by mail)
U.S. Army Corps of engineers
Bureau of Reclamation
State Agencies
SD Dept. Agriculture
SD Dept. Game Fish & Parks
SD Dept. of Health
MN Minnesota Pollution Control Agency
MN Dept. Natural Resources
Water Development Districts
East Dakota Water Development District
James River Water Development District
West Dakota Water Development District
West River Water Development District
Central Plains Water Development District
South Central Water Development District
Vermillion Water Development District
Other Groups
SD Assoc. Conservation Districts
Trout Unlimited
Nature Conservancy
SD Wildlife Federation
MS4 Facilities
City of Sioux Falls
City of Vermillion
City of Pierre
City of Brookings
Pennington County
City of Mitchell
City of Sturgis
City of Rapid City

South Dakota Mercury TMDL Page 85
City of Aberdeen
City of Watertown
SD Dept. of Transportation
City of North Sioux City
City of Huron
City of Yankton
City of Spearfish
Meade County
South Dakota Mercury TMDL Page 86
Works Cited
Allsman, Paul T., 1938, “Reconnaissance of Gold-Mining Districts in The Black Hills, South
Dakota.” Bulletin 427, United States Department of the Interior Burearu of Mines.
Atkeson, T., Axelrad, D., Pollman, C., and Keeler, G., 2002, “Integrated Summary Integrating
Atmospheric Mercury Deposition and Aquatic Cycling in the Florida Everglades: An approach
for conducting a Total Maximum Daily Load analysis for an atmospherically derived pollutant.”
Prepared for: United States Environmental Protection Agency, October, 2002,
ftp:zzftp.dep.state.fl.us/pub/labs/assessment/mercury/tmdlreport.pdf.
Atkinson, D., 2014, “Personal Communication through EPA Region 8.” in Model Results of the
AggreGATOR tool for South Dakota. United States Environmental Protection Agency.
Baird, C., 1999, Environmental Chemistry. New York: W.H. Freeman.
Betemariam, H., 2010, “Sediment Mercury Geochemical Behavior and Watershed Influences for
South Dakota Lakes and Impoundments.” Masters Thesis, South Dakota School of Mines and
Technology, Rapid City, SD.
BOR., 2014, “U.S. Department of Interior Bureau of Reclamation.” South Dakota Lakes and
Reservoirs. Retrieved November 20, 2014
(http://www.usbr.gov/gp/lakes_reservoirs/south_dakota_lakes.htm).
Branfireun, B. A., Roulet, N. T., Kelly, C. A., and Rudd, W. M., 1999, “In situ sulphate
stimulation of mercury methylation in boreal peatland: toward a link betwen acid rain and
methylmercuy contamination in remote environments.” Global Biogeochemical Cycles 13:743-
750.
Burnham, K. P. and Anderson, D. R., 2002, Model Selection and Multimodel Inference: a
Practical Information-Theoretic Approach. Springer.
Chazin, J. D., Allen, M. K., and Rodger, B. C., 1995, “Meaurement of Mercury Deposition
Using Passive Samplers Based on the Swedish (IVL)-Design.” Atmospheric Environment
29(11):1201-1209.
Driscoll, C. T., Han, Y. J., Chen, C. Y., Evers, D. C., Lambert, K. F., Holsen, T. M., and
Kamman, N. C., 2007, “Mercury Contamination in Forest and Freshwater Ecosystems in the
Northeastern United States.” BioScience 57(1):17-28.
ECOS., 2012, “2012 Compendium of States' Mercury Activities.” Compendium to Mercury in
the Environment States Respond to the Challenge: A Compendium of State Mercury Activities,
The Environmental Council of the States (ECOS), Washington DC.
Engstrom, D. R., Thommes, K., Balogh, S. J., Swain, E. B., and Post, H. A., 1999, “Trends in
Atmospheric Mercury Deposition Across Minnesota: Evidence From Dated Sediment Cores
From 50 Minnesota Lakes.” Legislative Commission on Minnesota Resources, St. Paul, Minn ,
p. 32.
Gilmour, C. C. and Henry, E. A., 1991, “Mercury methylation in aquatic systems affected by
acid deposition.” Environmental Pollution 71:131-169.
Gilmour, C. C., Henry, E. A., and Mitchell, R., 1992, “Sulfate stimulation of mercury
methylation in freshwater sediments.” 26:2281-2287.
South Dakota Mercury TMDL Page 87
Goddard, K., 1989, “Composition, Distribution, and Hydrologic Effects of Contaminated
Sediments Resulting From the Discharge of Gold Milling Wastes to Whitewood Creek at Lead
and Deadwood, South Dakota.” Water-Resources Investigations Report 87-4051, United States
Department of Interior, Geological Survey, Rapid City South Dakota.
Greenfield, B. K., Hrabik, T. R., Harvey, C. J., and Carpenter, S. R., 2001, “Predicting mercury
levels in yellow perch: use of water chemistry, trophic ecology, and spatial traits.” Canadian
Journal of Fisheries and Aquatic Sciences 58(7):1419-1429.
Hayer, C. A., Chipps, S. R., and Stone, J. J., 2011, “Influence of physiochemical and watershed
characteristics on mercury concentrations in Walleye, Sander vitreus.” Bulletin of Environmental
Contamination and Toxicology 86(2):163-167.
Jeremiason, J. D., Engstrom, D. R., Swain, E. B., Nater, E. A., Johnson, B. M., Almendinger, J.
E., Monson, B. A., and Kolka, R. K., 2006, “Sulfate addition increases methylmercury
production from an experimental wetland.” Environmental Science and Technology 40(12):3800-
3806.
Jeremiason, J. D., Swain, E. B., Nater, E. A., Cotner, J. B., Johnson, B. M., Engstrom, D. R., and
Almendinger, J. E., 2003, “Sulfate Addition Enhances Concentrations and Export of
Methylmercury from a Treated Wetland.” Abstract. Presented at the Amercan Society of
Limnology and Oceanography annual meeting, Salt Lake City. February 2003.
Kannan, K., Smith, J. R. G., Lee, R. F., Windom, H. L., Heitmuller, P. T., Macauley, J. M., and
Summers, J. K., 1998, “Distribution of Total Mercury and Methyl Mercury in Water, Sediment,
and Fish from South Florida Estuaries.” Archives of Environmental Contamination and
Toxicology 34(2):109-118.
Krabbenhoft, D. P., Wiener, J. G., Brumbaugh, W. G., Olson, M. L., DeWild, J. F., and Sabin, T.
J., 1999, “A national pilot study of mercury contamination of aquatic ecosystems along multiple
gradients.” US Geological Survey Water-Resources Investigations, Charleston, South Carolina.
Lupo, C. D. and Stone, J. J., 2013, “Bulk Atmospheric Mercury Fluxes for the Northern Great
Plains, USA.” Water Air Soil Pollution 224(1437):1-12.
McCutcheon, C., 2009, “Relations Between Water Quality and Mercury Fish Tissue
Concentrations for Natural Lakes and Impoundments in South Dakota.” Masters Thesis, South
Dakota School of Mines and Technology, Rapid City, SD.
MDN., 2014, “National Atmospheric Deposition Program.” Mercury Deposition Network.
Retrieved 2014 (http://nadp.sws.uiuc.edu/MDN/).
Montgomery, D. C. and Runger, G. C., 2006, Applied Statistics and Probablity for Engineers.
John Wiley & Sons; p. 207.
Morrison, K. A., Kuhn, E. S., and Watras, C. J., 1995, “Comparison of 3 Methods of Estimating
Atmospheric Mercury Deposition.” Environmental Science & Technology 29(3):571-576.
Morrison, K. A. and Therien, N., 1991, “Influence of Environmental Factors on Mercury Release
in Hydroelectric Reservoirs.” p. 122.
MPCA., 2007, “Minnesota Statewide Mercury Total Maximum Daily Load.” Minnesota
Pollution Control Agency.

South Dakota Mercury TMDL Page 88
Nellor, M., 1999, “Letter to Tudor Davies, Director EPA Office of Science and Technology, On
Mercury Effluent Sampling Results.”
Northeast Regional Mercury TMDL., 2007, “Northeast Regional Mercury Total Maximum Daily
Load.” Total Maximum Daily Load, New England Interstate Water Pollution Control
Commission.
Nriagu, J. O., 1994, “Mechanistic Steps in the Photoreduction of Mercury in Natural-Waters.”
Science of the Total Environment 154(1):1-8.
Ott and Longnecker., 2010, An Introduction to Statistical Methods and Data Analysis. Texas
A&M; p. 207.
Pickhardt, Paul C., Folt, Carol L., Chen, Celiea Y., Klaue, Bjoern, and Blum, Joel D., 2002,
“Algal blooms reduce the uptake of toxic methylmercury in freshwater food webs.” Proceedings
of the National Academy of Sciences 99(7):4419-4423.
Plourde, Y., Lucotte, M., and Pichet, P., 1997, “Contribution of suspended particulate matter and
zooplankton to MeHg contamination of the food chain in Mid-Northern Quebec (Canada)
Reservoirs.” Canadian Journal of Fish and Aquatic Science 54:821-831.
Quinn and Keough., 2002, Experimental Design and Data Analysis for Bioligists. Cambridge.
SDDENR., 1995, “1995 South Dakota Lakes Assessment Final Report.” Final Report,
Environment and Natural Resources, State of South Dakota, Pierre.
SDDENR., 2014, “Search for Historical Lake Levels in South Dakota.” South Dakota
Department of Environment and Natural Resouces. Retrieved November 2014
(http://denr.sd.gov/des/wr/dblakesearch.aspx).
SDGF&P., 2014, “South Dakota Game Fish and Parks.” Surveys, Maps and Fishing Information.
Retrieved November 13, 2014 (http://gfp.sd.gov/fishing-boating/tacklebox/lake-surveys/).
SDSU., 2014, “South Dakota Climate and Weather.” Retrieved 2011
(http://climate.sdstate.edu/climate_site/archive_data.htm).
Selch, T. M., 2008, “Factors Affecting Mercury Accumulation in South Dakota Fishes.” PhD
Dissertation, Department of Agriculural and Biological Sciences, South Dakota State University,
Brookings, SD.
Stewart, W., Stueven, E., Smith, R., and Repsys, A., 2000, “Ecoregion Targeting for Impaired
Lakes in South Dakota.” Watershed Protection Program, Division of Financial and Technical
Assistance, Department of Environment and Natural Resources, Pierre.
Stone, J., 2011, “Phase I Data Collection and Assessment for South Dakota Mercury TMDL
Development.” Final Report, Dept of Civil and Environmental Engineering, South Dakota
School of Mines and Technology, Rapid City, SD.
Tremblay, A., 1999, Bioaccumulation of methylmercury in invertebrates from Boreal
hydroelectric reservoirs. p. 334, New York.
Tremblay, A., Cloutier, L., and Lucotte, M., 1998, “Total mercury and methylmercury fluxes via
emerging insects in recently flooded hydroelectric reservoirs and a natural lake.” Science of the
Total Environment 219(2-3):209-221.
South Dakota Mercury TMDL Page 89
UNEP., 2013, “Global Mercury Assessment 2013: Sources, Emissions, Releases and
Environmental Transport.” UNEP Chemicals Branch, Geneva, Switzerland.
USDA., 2014, “U.S. Department of Agriculture National Ag Statistics Service Research and
Development Division.” Cropland Data Layer. Retrieved November 20, 2014
(http://www.nass.usda.gov/research/Cropland/SARS1a.htm).
USDA NRCS., 2014, “U.S. Department of Ag Natural Resources Conservation Service.”
Geospatial Gateway. Retrieved November 20, 2014 (http://datagateway.nrcs.usda.gov).
USEPA., 1971, “Pollution Affecting Water Quality of the Cheyenne River System Western
South Dakota.” Environmental Protection Agency Division of Field Investigations - Denver
Center and Region VII Kansas City MO and Region VIII Denver CO, Denver, CO.
USEPA., 1973, “Mercury Concentrations in Fish in Lake Oahe South Dakota April 16 to
Septermber 27, 1972.” Environmental Protection Agency Technical Support Branch Surveillance
and Analysis Division Region VIII, Denver, CO.
USEPA., 1991, “Technical Support Document for Water Quality-based Toxics Control.” United
States Environmental Protection Agency, Washington D.C.
USEPA., 1997, “Mercury Study Report to Congress: Health Effects of Mercury and Mercury
Compounds.” Office of Air Quality Planning & Standards and office of Research and
Development, Washington, DC.
USEPA., 2001, “Water Quality Criterion for the Protection of Human Health: Methylmercury.”
United States Environmental Protection Agency, Washington DC.
USEPA., 2002, “Total Maximum Daily Load (TMDL) Development For Total Mercury in the
Ochlockonee Watershed.” United States Environmental Protection Agency Region 4.
(https://epd.georgia.gov/sites/epd.georgia.gov/files/related_files/site_page/EPA_Ochlockonee_Ri
ver_Hg_TMDL.pdf).
USEPA., 2005, “Fact Sheet - EPA’s Clean Air Mercury Rule.” U.S. EPA Clean Air Mercury
Rule. Retrieved April 10, 2015 (http://www.epa.gov/air/mercuryrule/factsheetfin.html).
USEPA., 2007, “Options for Expressing Daily Loads in TMDLs.” United States Environmental
Protection Agency, Washington D.C.
USEPA., 2008, “Model-Based Analysis and Tracking of Airborne Mercury Emissions to Assist
in Watershed Planning.” Office of Wetland, Oceans, and Watersheds, U.S. Environmental
Protection Agency, Office of Water, Washington, DC.
USEPA., 2008, “TMDLs Where Mercury Loadings Are Predominatly From Air Deposition.”
TMDL Elements Memo, United States Environmental Protection Agency, Washington, D.C.
USEPA., 2010, “Guidance for Implementing the January 2001 methylmercury Water Quality
Criterion.” EPA-823-R-10-001, United States Environmental Protection Agency, Office of
Science and Technology, Washington, DC 20460.
USEPA., 2012, “Considerations for Revising and Withdrawing TMDLs (Draft).” Memo, United
States Environmental Protection Agency, Washington D.C.
(http://water.epa.gov/lawsregs/lawsguidance/cwa/tmdl/upload/Draft-TMDL_32212.pdf).

South Dakota Mercury TMDL Page 90
USEPA., 2014, “Mercury and Air Toxics Standards (MATS).” United States Environmental
Protection Agency. Retrieved November 6, 2014 (http://www.epa.gov/mats/basic.html).
USEPA., 2014, “National Pollutant Discharge Elimination System (NPDES): Use of Sufficiently
Sensitive Test Methods for Permit Aplications and Reporting.” Fact Sheet, Unite States
Environmental Protection Agency, Washington D. C.
(http://water.epa.gov/polwaste/npdes/basics/upload/Public-Fact-Sheet-Sufficiently-Sensitive-
Methods-Rule-8-18-14-Final.pdf).
USEPA., 2014, “Technology Transfer Network Clearinghouse for Inventories & Emissions
Factors.” U.S. Environmental Protections Agency. Retrieved November 5, 2014
(http://www.epa.gov/ttn/chief/net/2011inventory.html).
USEPA., 2015, “Cleaner Power Plants.” USEPA Mercury and Air Toxics (MATS). Retrieved
July 2015 (http://www.epa.gov/mats/powerplants.html).
USFWS., 2014, “U.S. Fish and Wildlife Service.” National Wetland Inventory Dataset.
Retrieved November 20, 2014 (http://www.fws.gov/wetlands/data).
Watras, C. J. and Bloom, N. S., 1992, “Mercury and Methylmercury in Individual Zooplankton:
Implications for Bioaccumulation.” Limnology and Oceanography 37(1):1313-1318.
Wentz, D.A., Brigham, M.E., Chasar, L.C., Lutz, M.A., and Krabbenhoft, D.P., 2014, “Mercury
in the Nation's streams - Levels, trends, and implications.” U.S. Geological Survey Circular
1395. (http://dx.doi.org/10.3133/cir1395).
WHO., 1990, “Methyl mercury.” Vol. 101. World Health Organization, International Programme
on Chemical Safety, Geneva, Switzerland.
WHO., 1991, “Inorganic mercury.” World Health Organization, International Programme on
Chemical Safety, Vol. 118. Geneva, Switzerland.
Wolf, A., Hubers, M., Johnson, B., St. Sauver, T., and Willis, D., 1994, “Growth of Walleyes in
South Dakota Waters.” Prairie Naturalist 26(3):217-220.
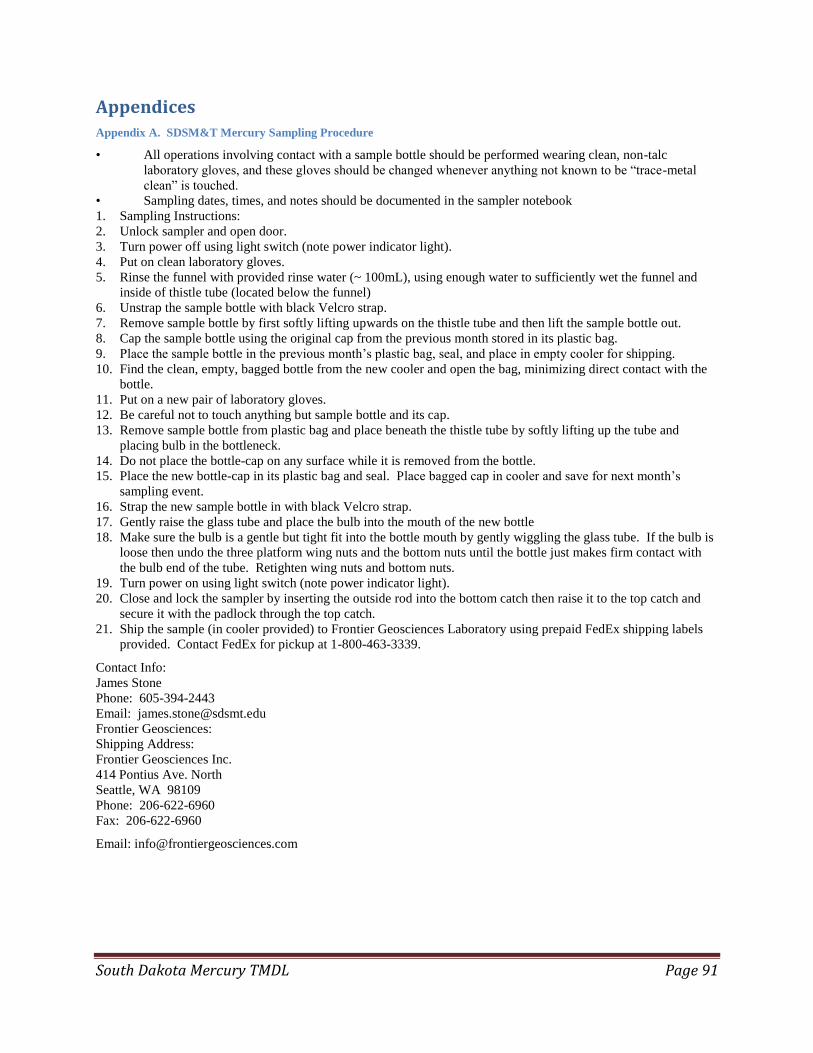
South Dakota Mercury TMDL Page 91
Appendices
Appendix A. SDSM&T Mercury Sampling Procedure
• All operations involving contact with a sample bottle should be performed wearing clean, non-talc
laboratory gloves, and these gloves should be changed whenever anything not known to be “trace-metal
clean” is touched.
• Sampling dates, times, and notes should be documented in the sampler notebook
1. Sampling Instructions:
2. Unlock sampler and open door.
3. Turn power off using light switch (note power indicator light).
4. Put on clean laboratory gloves.
5. Rinse the funnel with provided rinse water (~ 100mL), using enough water to sufficiently wet the funnel and
inside of thistle tube (located below the funnel)
6. Unstrap the sample bottle with black Velcro strap.
7. Remove sample bottle by first softly lifting upwards on the thistle tube and then lift the sample bottle out.
8. Cap the sample bottle using the original cap from the previous month stored in its plastic bag.
9. Place the sample bottle in the previous month’s plastic bag, seal, and place in empty cooler for shipping.
10. Find the clean, empty, bagged bottle from the new cooler and open the bag, minimizing direct contact with the
bottle.
11. Put on a new pair of laboratory gloves.
12. Be careful not to touch anything but sample bottle and its cap.
13. Remove sample bottle from plastic bag and place beneath the thistle tube by softly lifting up the tube and
placing bulb in the bottleneck.
14. Do not place the bottle-cap on any surface while it is removed from the bottle.
15. Place the new bottle-cap in its plastic bag and seal. Place bagged cap in cooler and save for next month’s
sampling event.
16. Strap the new sample bottle in with black Velcro strap.
17. Gently raise the glass tube and place the bulb into the mouth of the new bottle
18. Make sure the bulb is a gentle but tight fit into the bottle mouth by gently wiggling the glass tube. If the bulb is
loose then undo the three platform wing nuts and the bottom nuts until the bottle just makes firm contact with
the bulb end of the tube. Retighten wing nuts and bottom nuts.
19. Turn power on using light switch (note power indicator light).
20. Close and lock the sampler by inserting the outside rod into the bottom catch then raise it to the top catch and
secure it with the padlock through the top catch.
21. Ship the sample (in cooler provided) to Frontier Geosciences Laboratory using prepaid FedEx shipping labels
provided. Contact FedEx for pickup at 1-800-463-3339.
Contact Info:
James Stone
Phone: 605-394-2443
Email: [email protected]
Frontier Geosciences:
Shipping Address:
Frontier Geosciences Inc.
414 Pontius Ave. North
Seattle, WA 98109
Phone: 206-622-6960
Fax: 206-622-6960
Email: [email protected]

South Dakota Mercury TMDL Page 92
Appendix B. Mercury Deposition Results
Figure 25. Atmospheric mercury deposition for Beresford, SD from September 2008 to October 2010.
Figure 26. Atmospheric mercury deposition for Huron, SD from September 2008 to October 2010.
0.0
0.5
1.0
1.5
2.0
2.5
3.0
3.5
0.0
10.0
20.0
30.0
40.0
50.0
60.0
70.0
Me
rcu
ry D
ep
oso
tio
n [
ug
/m2/3
0 d
ay
s]
24
hr
Pre
cip
ita
tio
n [
mm
/da
y]
Beresford, SD Atmospheric Mercury Deposition
Precipitation
Mercury Deposition
0.0
0.5
1.0
1.5
2.0
2.5
3.0
3.5
0.0
10.0
20.0
30.0
40.0
50.0
60.0
Me
rcu
ry D
ep
oso
tio
n [
ug
/m2/3
0 d
ay
s]
24
hr
Pre
cip
ita
tio
n [
mm
/da
y]
Huron, SD Atmospheric Mercury Deposition
Precipitation
Mercury Deposition

South Dakota Mercury TMDL Page 93
Figure 27. Atmospheric mercury deposition for Antelope Field Station, SD from October 2008 to October 2010.
Figure 28. Atmospheric mercury deposition for Wind Cave National Park, SD from October 2008 to November 2010.
0.0
0.5
1.0
1.5
2.0
2.5
3.0
3.5
0.0
10.0
20.0
30.0
40.0
50.0
60.0
Me
rcu
ry D
ep
oso
tio
n [
ug
/m2/3
0 d
ay
s]
24
hr
Pre
cip
ita
tio
n [
mm
/da
y]
Antelope, SD Atmospheric Mercury Deposition
Precipitation
Mercury Deposition
0.0
0.5
1.0
1.5
2.0
2.5
3.0
3.5
0
5
10
15
20
25
30
35
Me
rcu
ry D
ep
oso
tio
n [
ug
/m2/3
0 d
ay
s]
24
hr
Pre
cip
ita
tio
n [
mm
/da
y]
Wind Cave National ParkAtmospheric Mercury Deposition
Precipitation
Mercury Deposition

South Dakota Mercury TMDL Page 94
Figure 29. Atmospheric mercury deposition for Badlands National Park, SD from August 2008 to October 2010.
Figure 30. Atmospheric mercury deposition for Theodore Roosevelt National Park, ND from March 2009 to November
2010.
0.0
0.5
1.0
1.5
2.0
2.5
3.0
3.5
0
10
20
30
40
50
60
70A
ug
-08
Se
p-0
8
Oct
-08
No
v-0
8
De
c-0
8
Jan
-09
Fe
b-0
9
Ma
r-0
9
Ap
r-0
9
Ma
y-0
9
Jun
-09
Jul-
09
Au
g-0
9
Se
p-0
9
Oct
-09
No
v-0
9
De
c-0
9
Jan
-10
Fe
b-1
0
Ma
r-1
0
Ap
r-1
0
Ma
y-1
0
Jun
-10
Jul-
10
Au
g-1
0
Se
p-1
0
Oct
-10
Me
rcu
ry D
ep
oso
tio
n [
ug
/m2/3
0 d
ay
s]
24
hr
Pre
cip
ita
tio
n [
mm
/da
y]
Badlands National Park Atmospheric Mercury Deposition
Precipitation
Mercury Deposition
0.0
0.5
1.0
1.5
2.0
2.5
3.0
3.5
0
10
20
30
40
50
Me
rcu
ry D
ep
oso
tio
n [
ug
/m2/3
0 d
ay
s]
24
hr
Pre
cip
ita
tio
n [
mm
/da
y]
Theodore Roosevelt National ParkAtmospheric Mercury Deposition
Precipitation
Mercury Deposition
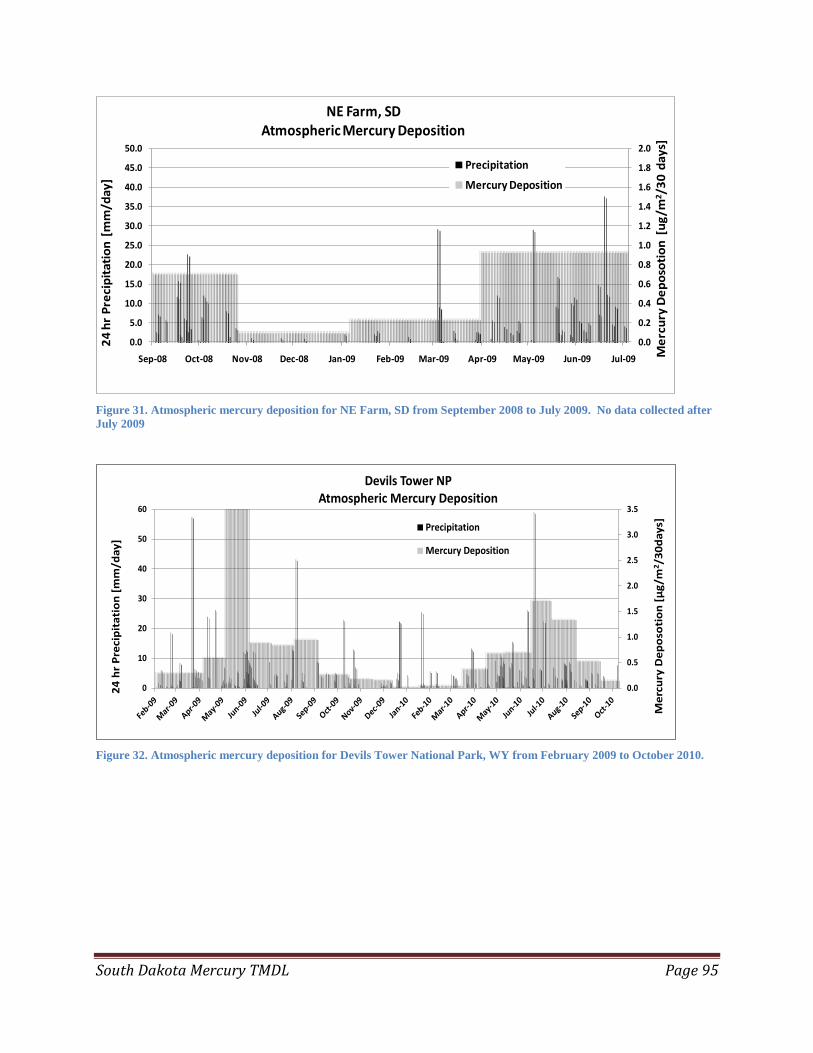
South Dakota Mercury TMDL Page 95
Figure 31. Atmospheric mercury deposition for NE Farm, SD from September 2008 to July 2009. No data collected after
July 2009
Figure 32. Atmospheric mercury deposition for Devils Tower National Park, WY from February 2009 to October 2010.
0.0
0.2
0.4
0.6
0.8
1.0
1.2
1.4
1.6
1.8
2.0
0.0
5.0
10.0
15.0
20.0
25.0
30.0
35.0
40.0
45.0
50.0
Sep-08 Oct-08 Nov-08 Dec-08 Jan-09 Feb-09 Mar-09 Apr-09 May-09 Jun-09 Jul-09 Me
rcu
ry D
ep
oso
tio
n [
ug
/m2/3
0 d
ay
s]
24
hr
Pre
cip
ita
tio
n [
mm
/da
y]
NE Farm, SDAtmospheric Mercury Deposition
Precipitation
Mercury Deposition
0.0
0.5
1.0
1.5
2.0
2.5
3.0
3.5
0
10
20
30
40
50
60
Me
rcu
ry D
ep
oso
tio
n [
µg
/m2/3
0d
ay
s]
24
hr
Pre
cip
ita
tio
n [
mm
/da
y]
Devils Tower NPAtmospheric Mercury Deposition
Precipitation
Mercury Deposition
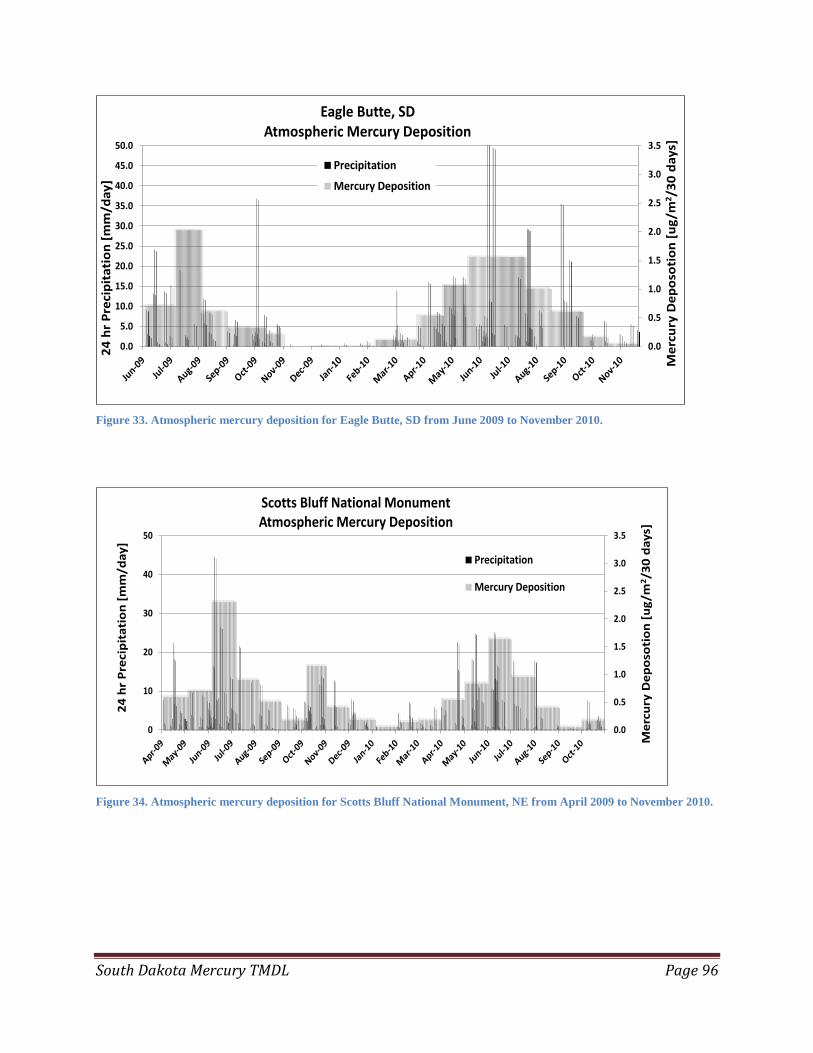
South Dakota Mercury TMDL Page 96
Figure 33. Atmospheric mercury deposition for Eagle Butte, SD from June 2009 to November 2010.
Figure 34. Atmospheric mercury deposition for Scotts Bluff National Monument, NE from April 2009 to November 2010.
0.0
0.5
1.0
1.5
2.0
2.5
3.0
3.5
0.0
5.0
10.0
15.0
20.0
25.0
30.0
35.0
40.0
45.0
50.0
Me
rcu
ry D
ep
oso
tio
n [
ug
/m2/3
0 d
ay
s]
24
hr
Pre
cip
ita
tio
n [
mm
/da
y]
Eagle Butte, SDAtmospheric Mercury Deposition
Precipitation
Mercury Deposition
0.0
0.5
1.0
1.5
2.0
2.5
3.0
3.5
0
10
20
30
40
50
Me
rcu
ry D
ep
oso
tio
n [
ug
/m2/3
0 d
ay
s]
24
hr
Pre
cip
ita
tio
n [
mm
/da
y]
Scotts Bluff National MonumentAtmospheric Mercury Deposition
Precipitation
Mercury Deposition

South Dakota Mercury TMDL Page 97
Appendix C. Regression Equations for Walleye/Sauger
Equations based off of fish measured in mm and concentrations of total mercury reported as mg/Kg.
Site Year Species equation Statistics Total Hg mg/Kg
Amsden Dam-Day 2011 Walleye/Sauger y= -0.2901 + 0.0016*x r = 0.8569, p = 0.0015; r2 = 0.7343 0.3243
Angostura Reservoir-Fall River 2014 Walleye/Sauger y= -0.0588 + 0.0003*x r = 0.6635, p = 0.0365; r2 = 0.4402 0.0564
Belle Fourche Reservoir-Butte 2006 Walleye/Sauger y= -0.0011 + 0.0001*x r = 0.8582, p = 0.0627; r2 = 0.7366 0.0373
Belle Fourche Reservoir-Butte 2011 Walleye/Sauger y= -0.0588 + 0.0007*x r = 0.4785, p = 0.1618; r2 = 0.2290 0.21
Big Sioux River-Moody 2012 Walleye/Sauger y= -0.4347 + 0.0024*x r = 0.8716, p = 0.1284; r2 = 0.7596 0.4869
Bitter Lake-Day 2000 Walleye/Sauger y= -0.2358 + 0.0029*x r = 0.8274, p = 0.0000; r2 = 0.6846 0.8778
Bitter Lake-Day 2001 Walleye/Sauger y= -0.6972 + 0.0037*x r = 0.8267, p = 0.00000; r2 = 0.6834 0.7236
Bitter Lake-Day 2003 Walleye/Sauger y= -0.8929 + 0.0038*x r = 0.8751, p = 0.0000; r2 = 0.7658 0.5663
Bitter Lake-Day 2005 Walleye/Sauger y= -0.2317 + 0.002*x r = 0.7675, p = 0.0000;r2 = 0.5891 0.5363
Bitter Lake-Day 2006 Walleye/Sauger y= -0.5677 + 0.0027*x r = 0.7964, p = 0.00000; r2 = 0.6342 0.4691
Bitter Lake-Day 2007 Walleye/Sauger y= 0.4189 + 0.0006*x r = 0.2885, p = 0.0030; r2 = 0.0833 0.6493
Bitter Lake-Day 2013 Walleye/Sauger y= -1.2468 + 0.0047*x r = 0.8906, p = 0.0005; r2 = 0.7932 0.558
Blue Dog Lake-Day 2011 Walleye/Sauger y= 0.0328 + 0.0003*x r = 0.4855, p = 0.1549; r2 = 0.2357 0.148
Bonham #2-Bon Homme 2003 Walleye/Sauger y= 0.3222 + 0.0002*x r = 0.0172, p = 0.9578; r2 = 0.0003 0.399
Bonham #4-Bon Homme 2003 Walleye/Sauger y= -0.0263 + 0.0007*x r = 0.5225, p = 0.0814; r2 = 0.2730 0.2425
Brant Lake-Lake 2012 Walleye/Sauger y= -0.0322 + 0.0004*x r = 0.7556, p = 0.1396; r2 = 0.5709 0.1214
Brush Lake-Brookings 2011 Walleye/Sauger y= 0.294 + 0.0002*x r = 0.1101, p = 0.8601; r2 = 0.0121 0.3708
Buffalo Lake, South-Marshall 2011 Walleye/Sauger y= -0.1404 + 0.0014*x r = 0.9285, p = 0.0001; r2 = 0.8622 0.3972
Cattail/Kettle Lake-Marshall 2006 Walleye/Sauger y= -0.6421 + 0.002*x r = 0.9302, p = 0.2393; r2 = 0.8653 0.1259
Cattail/Kettle Lake-Marshall 2012 Walleye/Sauger y= -0.1732 + 0.0009*x r = 0.8570, p = 0.0008; r2 = 0.7344 0.1724
Clear Lake-Deuel 2013 Walleye/Sauger y= -0.2167 + 0.001*x r = 0.8984, p = 0.00001; r2 = 0.8072 0.1673
Clear Lake-Hamlin 2014 Walleye/Sauger y= -0.1926 + 0.001*x r = 0.9649, p = 0.0000;r2 = 0.9311 0.1914
Cottonwood Lake-Spink 2013 Walleye/Sauger y= -0.5874 + 0.0021*x r = 0.9088, p = 0.00000; r2 = 0.8259 0.219
Cottonwood Lake-Sully 2012 Walleye/Sauger y= 0.5166 + 0.0004*x r = 0.2141, p = 0.5525; r2 = 0.0458 0.6702
Diamond Lake-Minnehaha 2008 Walleye/Sauger y= -0.4735 + 0.0018*x r = 0.9216, p = 0.00000; r2 = 0.8493 0.2177
Dry Lake # 2-Clark 2011 Walleye/Sauger y= 0.2261 + 0.0012*x r = 0.2340, p = 0.5153; r2 = 0.0547 0.6869
Dry Lake-Codington 2013 Walleye/Sauger y= -0.2228 + 0.0009*x r = 0.7867, p = 0.0069; r2 = 0.6190 0.1228
Elm Lake-Brown 2012 Walleye/Sauger y= -0.3434 + 0.0023*x r = 0.9793, p = 0.00000; r2 = 0.9590 0.5398
Enemy Swim Lake-Day 2005 Walleye/Sauger y= -0.0253 + 0.0005*x r = 0.3671, p = 0.0422; r2 = 0.1348 0.1667
Fourche lake-Butte 2004 Walleye/Sauger y= 0.0282 + 9.8922E-5*x r = 0.2508, p = 0.4846; r2 = 0.0629 0.06619
Goldsmith Lake-Brookings 2013 Walleye/Sauger y= -0.04 + 0.0006*x r = 0.3212, p = 0.1174;r2 = 0.1032 0.1904
Goose Lake-Codington 2013 Walleye/Sauger y= -0.4418 + 0.0026*x r = 0.7722, p = 0.0002; r2 = 0.5963 0.5566
Gross Lake-McCook 2004 Walleye/Sauger y= 0.0439 - 1.2841E-6*x r = -0.0132, p = 0.9660; r2 = 0.0002 0.04341
Hazeldon Lake-Day 2014 Walleye/Sauger y= -0.8112 + 0.0034*x r = 0.9493, p = 0.00000; r2 = 0.9011 0.4944
Horseshoe Lake-Day 2004 Walleye/Sauger y= 0.0994 + 0.0002*x r = 0.2555, p = 0.3779; r2 = 0.0653 0.1762
Horseshoe Lake-Day 2011 Walleye/Sauger y= -0.0667 + 0.0017*x r = 0.8409, p = 0.0023; r2 = 0.7071 0.5861

South Dakota Mercury TMDL Page 98
Island Lake-Minnehaha 2005 Walleye/Sauger y= -0.6545 + 0.0028*x r = 0.8095, p = 0.0969; r2 = 0.6553 0.4207
Island Lake-Minnehaha 2006 Walleye/Sauger y= 0.2132 + 0.0013*x r = 0.4502, p = 0.1062; r2 = 0.2027 0.7124
Island Lake-Minnehaha 2012 Walleye/Sauger y= -0.377 + 0.0023*x r = 0.5002, p = 0.1409; r2 = 0.2502 0.5062
James River-Beadle 2013 Walleye/Sauger y= 0.0687 + 0.0012*x r = 0.3427, p = 0.3324;r2 = 0.1174 0.5295
Lake Albert-Kingsbury 2014 Walleye/Sauger y= -0.2581 + 0.0015*x r = 0.8048, p = 0.0009; r2 = 0.6477 0.3179
Lake Alice-Deuel 2013 Walleye/Sauger y= -0.8291 + 0.0024*x r = 0.9527, p = 0.00002; r2 = 0.9077 0.0925
Lake Byron-Beadle 2005 Walleye/Sauger y= 0.1989 - 2.3155E-5* r = -0.0741, p = 0.4354; r2 = 0.0055 0.19001
Lake Byron-Beadle 2011 Walleye/Sauger y= 0.0591 - 1.0721E-5*x r = -0.0327, p = 0.9285; r2 = 0.0011 0.05498
Lake Henry-Kingsbury 2014 Walleye/Sauger y= -0.4531 + 0.0017*x r = 0.8921, p = 0.00001; r2 = 0.7958 0.1997
Lake Kampeska-Codington 2005 Walleye/Sauger y= -0.0593 + 0.0006*x r = 0.8696, p = 0.00000; r2 = 0.7561 0.1711
Lake Kampeska-Codington 2014 Walleye/Sauger y= -0.2988 + 0.0014*x r = 0.9592, p = 0.00001; r2 = 0.9200 0.2388
Lake Minnewasta-Day 2012 Walleye/Sauger y= -3.7539 + 0.0094*x r = 0.6373, p = 0.2475; r2 = 0.4061 -0.1443
Lake Minnewasta-Day 2013 Walleye/Sauger y= -0.2751 + 0.0015*x r = 0.7967, p = 0.0102; r2 = 0.6348 0.3009
Lake Oahe (Grand River Embayment)-Corson 2001 Walleye/Sauger y= -0.2818 + 0.0013*x r = 0.7763, p = 0.0000; r2 = 0.6027 0.2174
Lake Oahe (Grand River Embayment)-Corson 2010 Walleye/Sauger y= 0.215 + 0.0004*x r = 0.4089, p = 0.1302; r2 = 0.1672 0.3686
Lake Oahe (Minneconjou Bay)-Stanley 2001 Walleye/Sauger y= -0.614 + 0.0024*x r = 0.8785, p = 0.0000; r2 = 0.7718 0.3076
Lake Oahe (Minneconjou Bay)-Stanley 2002 Walleye/Sauger y= -1.6303 + 0.0042*x r = 0.8244, p = 0.0860; r2 = 0.6797 -0.0175
Lake Oahe (Minneconjou Bay)-Stanley 2007 Walleye/Sauger y= -0.0513 + 0.0004*x r = 0.9937, p = 0.0006; r2 = 0.9873 0.1023
Lake Oahe (Minneconjou Bay)-Stanley 2010 Walleye/Sauger y= 0.176 + 0.0003*x r = 0.3739, p = 0.1698; r2 = 0.1398 0.2912
Lake Oahe (Moreau River Embayment)-Dewey 2001 Walleye/Sauger y= -0.0157 + 0.0007*x r = 0.5704, p = 0.00004; r2 = 0.3253 0.2531
Lake Oahe (Moreau River Embayment)-Dewey 2011 Walleye/Sauger y= -0.1757 + 0.0012*x r = 0.8357, p = 0.0026; r2 = 0.6984 0.2851
Lake Oahe (West Whitlock)-Potter 2002 Walleye/Sauger y= -0.911 + 0.0025*x r = 0.9637, p = 0.0020; r2 = 0.9287 0.049
Lake Oahe (West Whitlock)-Potter 2007 Walleye/Sauger y= -0.0694 + 0.0004*x r = 0.9567, p = 0.00001; r2 = 0.9153 0.0842
Lake Oahe (West Whitlock)-Potter 2010 Walleye/Sauger y= 0.3053 + 7.1704E-5*x r = 0.0623, p = 0.8255; r2 = 0.0039 0.33283
Lake Oakwood-Brookings 2013 Walleye/Sauger y= -0.3433 + 0.0008*x r = 0.8780, p = 0.0041; r2 = 0.7709 -0.0361
Lake Poinsett-Hamlin 2011 Walleye/Sauger y= -0.0176 + 0.0008*x r = 0.2675, p = 0.4550; r2 = 0.0716 0.2896
Lake Poinsett-Hamlin 2014 Walleye/Sauger y= -0.1263 + 0.0012*x r = 0.7244, p = 0.0178; r2 = 0.5247 0.3345
Lake Sharpe (Joe Creek Area)-Hughes/Lyman 1999 Walleye/Sauger y= -0.4268 + 0.0012*x r = 0.6255, p = 0.0531; r2 = 0.3913 0.034
Lake Sinai-Brookings 2012 Walleye/Sauger y= -0.4874 + 0.002*x r = 0.8225, p = 0.0035; r2 = 0.6766 0.2806
Lake Thompson-Kingsbury 2012 Walleye/Sauger y= 0.0259 + 0.0006*x r = 0.5901, p = 0.0725; r2 = 0.3483 0.2563
Lardy Lake-Day 2013 Walleye/Sauger y= -0.6018 + 0.0024*x r = 0.9256, p = 0.00000; r2 = 0.8568 0.3198
Lily GPA-Day 2012 Walleye/Sauger y= 0.0607 + 0.0008*x r = 0.2159, p = 0.7272; r2 = 0.0466 0.3679
Lindroth Lake-Day 2004 Walleye/Sauger y= -0.014 + 0.0003*x r = 0.7097, p = 0.0097; r2 = 0.5037 0.1012
Long Lake-Codington 2013 Walleye/Sauger y= -0.7772 + 0.0035*x r = 0.9044, p = 0.00000; r2 = 0.8179 0.5668
Lynn Lake-Day 2002 Walleye/Sauger y= -0.1619 + 0.0022*x r = 0.8852, p = 0.0000; r2 = 0.7836 0.6829
Lynn Lake-Day 2003 Walleye/Sauger y= 0.1691 + 0.0009*x r = 0.5445, p = 0.0001; r2 = 0.2965 0.5147
Lynn Lake-Day 2005 Walleye/Sauger y= -0.4486 + 0.0019*x r = 0.9064, p = 0.00000; r2 = 0.8215 0.281
Lynn Lake-Day 2014 Walleye/Sauger y= -0.8362 + 0.0035*x r = 0.8864, p = 0.0006; r2 = 0.7856 0.5078
Lyons Lake-McCook 2003 Walleye/Sauger y= 0.0303 + 4.5759E-5*x r = 0.1495, p = 0.6428; r2 = 0.0224 0.04787
Middle Lynn Lake-Day 2012 Walleye/Sauger y= -0.4242 + 0.0025*x r = 0.8219, p = 0.0878; r2 = 0.6756 0.5358
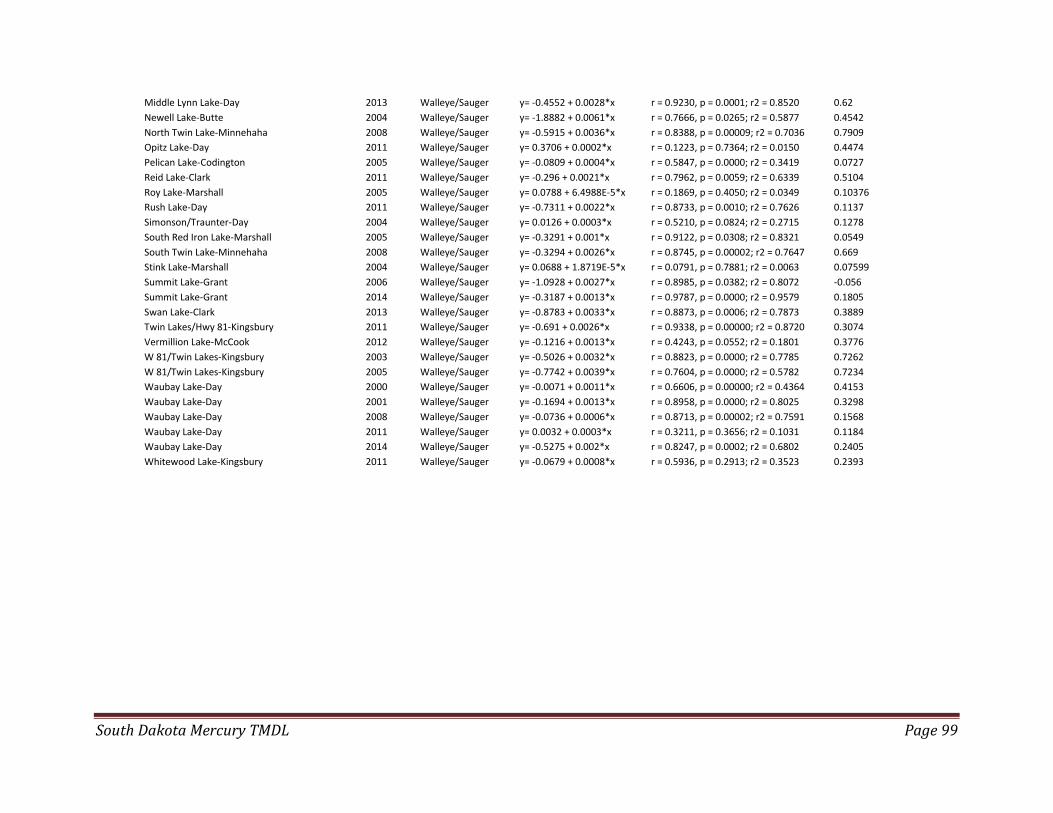
South Dakota Mercury TMDL Page 99
Middle Lynn Lake-Day 2013 Walleye/Sauger y= -0.4552 + 0.0028*x r = 0.9230, p = 0.0001; r2 = 0.8520 0.62
Newell Lake-Butte 2004 Walleye/Sauger y= -1.8882 + 0.0061*x r = 0.7666, p = 0.0265; r2 = 0.5877 0.4542
North Twin Lake-Minnehaha 2008 Walleye/Sauger y= -0.5915 + 0.0036*x r = 0.8388, p = 0.00009; r2 = 0.7036 0.7909
Opitz Lake-Day 2011 Walleye/Sauger y= 0.3706 + 0.0002*x r = 0.1223, p = 0.7364; r2 = 0.0150 0.4474
Pelican Lake-Codington 2005 Walleye/Sauger y= -0.0809 + 0.0004*x r = 0.5847, p = 0.0000; r2 = 0.3419 0.0727
Reid Lake-Clark 2011 Walleye/Sauger y= -0.296 + 0.0021*x r = 0.7962, p = 0.0059; r2 = 0.6339 0.5104
Roy Lake-Marshall 2005 Walleye/Sauger y= 0.0788 + 6.4988E-5*x r = 0.1869, p = 0.4050; r2 = 0.0349 0.10376
Rush Lake-Day 2011 Walleye/Sauger y= -0.7311 + 0.0022*x r = 0.8733, p = 0.0010; r2 = 0.7626 0.1137
Simonson/Traunter-Day 2004 Walleye/Sauger y= 0.0126 + 0.0003*x r = 0.5210, p = 0.0824; r2 = 0.2715 0.1278
South Red Iron Lake-Marshall 2005 Walleye/Sauger y= -0.3291 + 0.001*x r = 0.9122, p = 0.0308; r2 = 0.8321 0.0549
South Twin Lake-Minnehaha 2008 Walleye/Sauger y= -0.3294 + 0.0026*x r = 0.8745, p = 0.00002; r2 = 0.7647 0.669
Stink Lake-Marshall 2004 Walleye/Sauger y= 0.0688 + 1.8719E-5*x r = 0.0791, p = 0.7881; r2 = 0.0063 0.07599
Summit Lake-Grant 2006 Walleye/Sauger y= -1.0928 + 0.0027*x r = 0.8985, p = 0.0382; r2 = 0.8072 -0.056
Summit Lake-Grant 2014 Walleye/Sauger y= -0.3187 + 0.0013*x r = 0.9787, p = 0.0000; r2 = 0.9579 0.1805
Swan Lake-Clark 2013 Walleye/Sauger y= -0.8783 + 0.0033*x r = 0.8873, p = 0.0006; r2 = 0.7873 0.3889
Twin Lakes/Hwy 81-Kingsbury 2011 Walleye/Sauger y= -0.691 + 0.0026*x r = 0.9338, p = 0.00000; r2 = 0.8720 0.3074
Vermillion Lake-McCook 2012 Walleye/Sauger y= -0.1216 + 0.0013*x r = 0.4243, p = 0.0552; r2 = 0.1801 0.3776
W 81/Twin Lakes-Kingsbury 2003 Walleye/Sauger y= -0.5026 + 0.0032*x r = 0.8823, p = 0.0000; r2 = 0.7785 0.7262
W 81/Twin Lakes-Kingsbury 2005 Walleye/Sauger y= -0.7742 + 0.0039*x r = 0.7604, p = 0.0000; r2 = 0.5782 0.7234
Waubay Lake-Day 2000 Walleye/Sauger y= -0.0071 + 0.0011*x r = 0.6606, p = 0.00000; r2 = 0.4364 0.4153
Waubay Lake-Day 2001 Walleye/Sauger y= -0.1694 + 0.0013*x r = 0.8958, p = 0.0000; r2 = 0.8025 0.3298
Waubay Lake-Day 2008 Walleye/Sauger y= -0.0736 + 0.0006*x r = 0.8713, p = 0.00002; r2 = 0.7591 0.1568
Waubay Lake-Day 2011 Walleye/Sauger y= 0.0032 + 0.0003*x r = 0.3211, p = 0.3656; r2 = 0.1031 0.1184
Waubay Lake-Day 2014 Walleye/Sauger y= -0.5275 + 0.002*x r = 0.8247, p = 0.0002; r2 = 0.6802 0.2405
Whitewood Lake-Kingsbury 2011 Walleye/Sauger y= -0.0679 + 0.0008*x r = 0.5936, p = 0.2913; r2 = 0.3523 0.2393
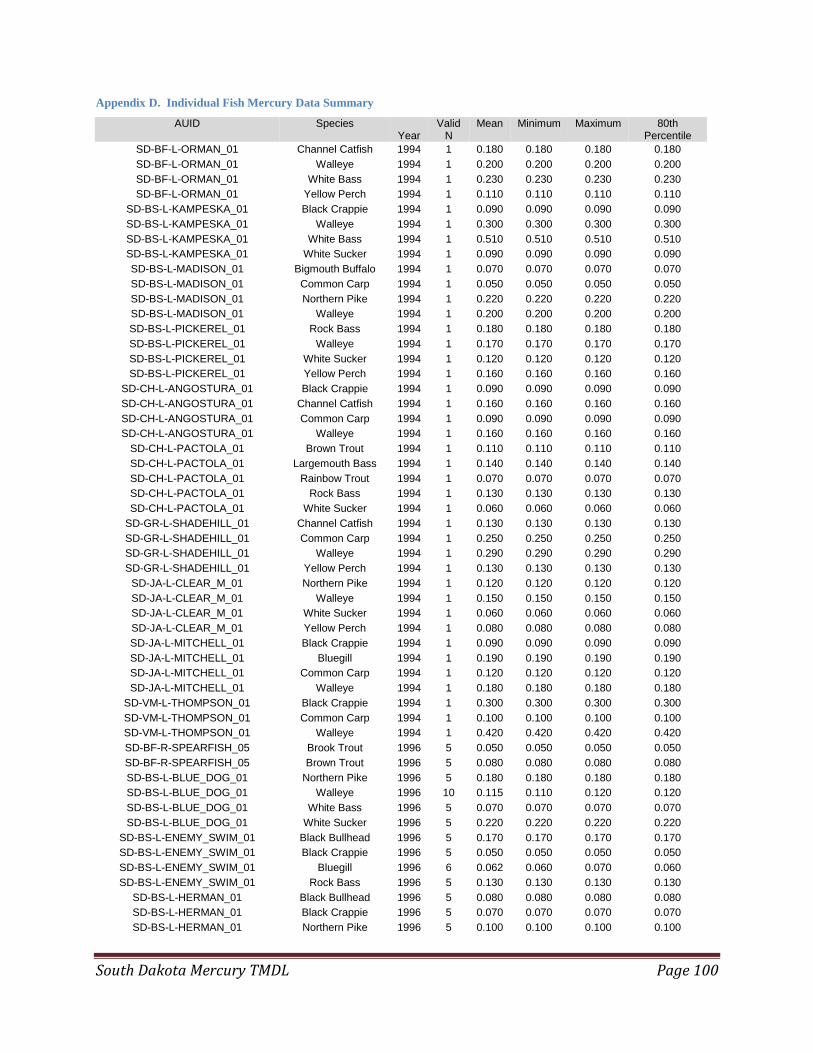
South Dakota Mercury TMDL Page 100
Appendix D. Individual Fish Mercury Data Summary
AUID Species Year
Valid N
Mean Minimum Maximum 80th Percentile
SD-BF-L-ORMAN_01 Channel Catfish 1994 1 0.180 0.180 0.180 0.180
SD-BF-L-ORMAN_01 Walleye 1994 1 0.200 0.200 0.200 0.200
SD-BF-L-ORMAN_01 White Bass 1994 1 0.230 0.230 0.230 0.230
SD-BF-L-ORMAN_01 Yellow Perch 1994 1 0.110 0.110 0.110 0.110
SD-BS-L-KAMPESKA_01 Black Crappie 1994 1 0.090 0.090 0.090 0.090
SD-BS-L-KAMPESKA_01 Walleye 1994 1 0.300 0.300 0.300 0.300
SD-BS-L-KAMPESKA_01 White Bass 1994 1 0.510 0.510 0.510 0.510
SD-BS-L-KAMPESKA_01 White Sucker 1994 1 0.090 0.090 0.090 0.090
SD-BS-L-MADISON_01 Bigmouth Buffalo 1994 1 0.070 0.070 0.070 0.070
SD-BS-L-MADISON_01 Common Carp 1994 1 0.050 0.050 0.050 0.050
SD-BS-L-MADISON_01 Northern Pike 1994 1 0.220 0.220 0.220 0.220
SD-BS-L-MADISON_01 Walleye 1994 1 0.200 0.200 0.200 0.200
SD-BS-L-PICKEREL_01 Rock Bass 1994 1 0.180 0.180 0.180 0.180
SD-BS-L-PICKEREL_01 Walleye 1994 1 0.170 0.170 0.170 0.170
SD-BS-L-PICKEREL_01 White Sucker 1994 1 0.120 0.120 0.120 0.120
SD-BS-L-PICKEREL_01 Yellow Perch 1994 1 0.160 0.160 0.160 0.160
SD-CH-L-ANGOSTURA_01 Black Crappie 1994 1 0.090 0.090 0.090 0.090
SD-CH-L-ANGOSTURA_01 Channel Catfish 1994 1 0.160 0.160 0.160 0.160
SD-CH-L-ANGOSTURA_01 Common Carp 1994 1 0.090 0.090 0.090 0.090
SD-CH-L-ANGOSTURA_01 Walleye 1994 1 0.160 0.160 0.160 0.160
SD-CH-L-PACTOLA_01 Brown Trout 1994 1 0.110 0.110 0.110 0.110
SD-CH-L-PACTOLA_01 Largemouth Bass 1994 1 0.140 0.140 0.140 0.140
SD-CH-L-PACTOLA_01 Rainbow Trout 1994 1 0.070 0.070 0.070 0.070
SD-CH-L-PACTOLA_01 Rock Bass 1994 1 0.130 0.130 0.130 0.130
SD-CH-L-PACTOLA_01 White Sucker 1994 1 0.060 0.060 0.060 0.060
SD-GR-L-SHADEHILL_01 Channel Catfish 1994 1 0.130 0.130 0.130 0.130
SD-GR-L-SHADEHILL_01 Common Carp 1994 1 0.250 0.250 0.250 0.250
SD-GR-L-SHADEHILL_01 Walleye 1994 1 0.290 0.290 0.290 0.290
SD-GR-L-SHADEHILL_01 Yellow Perch 1994 1 0.130 0.130 0.130 0.130
SD-JA-L-CLEAR_M_01 Northern Pike 1994 1 0.120 0.120 0.120 0.120
SD-JA-L-CLEAR_M_01 Walleye 1994 1 0.150 0.150 0.150 0.150
SD-JA-L-CLEAR_M_01 White Sucker 1994 1 0.060 0.060 0.060 0.060
SD-JA-L-CLEAR_M_01 Yellow Perch 1994 1 0.080 0.080 0.080 0.080
SD-JA-L-MITCHELL_01 Black Crappie 1994 1 0.090 0.090 0.090 0.090
SD-JA-L-MITCHELL_01 Bluegill 1994 1 0.190 0.190 0.190 0.190
SD-JA-L-MITCHELL_01 Common Carp 1994 1 0.120 0.120 0.120 0.120
SD-JA-L-MITCHELL_01 Walleye 1994 1 0.180 0.180 0.180 0.180
SD-VM-L-THOMPSON_01 Black Crappie 1994 1 0.300 0.300 0.300 0.300
SD-VM-L-THOMPSON_01 Common Carp 1994 1 0.100 0.100 0.100 0.100
SD-VM-L-THOMPSON_01 Walleye 1994 1 0.420 0.420 0.420 0.420
SD-BF-R-SPEARFISH_05 Brook Trout 1996 5 0.050 0.050 0.050 0.050
SD-BF-R-SPEARFISH_05 Brown Trout 1996 5 0.080 0.080 0.080 0.080
SD-BS-L-BLUE_DOG_01 Northern Pike 1996 5 0.180 0.180 0.180 0.180
SD-BS-L-BLUE_DOG_01 Walleye 1996 10 0.115 0.110 0.120 0.120
SD-BS-L-BLUE_DOG_01 White Bass 1996 5 0.070 0.070 0.070 0.070
SD-BS-L-BLUE_DOG_01 White Sucker 1996 5 0.220 0.220 0.220 0.220
SD-BS-L-ENEMY_SWIM_01 Black Bullhead 1996 5 0.170 0.170 0.170 0.170
SD-BS-L-ENEMY_SWIM_01 Black Crappie 1996 5 0.050 0.050 0.050 0.050
SD-BS-L-ENEMY_SWIM_01 Bluegill 1996 6 0.062 0.060 0.070 0.060
SD-BS-L-ENEMY_SWIM_01 Rock Bass 1996 5 0.130 0.130 0.130 0.130
SD-BS-L-HERMAN_01 Black Bullhead 1996 5 0.080 0.080 0.080 0.080
SD-BS-L-HERMAN_01 Black Crappie 1996 5 0.070 0.070 0.070 0.070
SD-BS-L-HERMAN_01 Northern Pike 1996 5 0.100 0.100 0.100 0.100

South Dakota Mercury TMDL Page 101
SD-BS-L-HERMAN_01 Yellow Perch 1996 5 0.060 0.060 0.060 0.060
SD-BS-L-SINAI_01 Black Bullhead 1996 5 0.230 0.230 0.230 0.230
SD-BS-L-SINAI_01 Common Carp 1996 4 0.090 0.090 0.090 0.090
SD-BS-L-SINAI_01 Walleye 1996 10 0.425 0.420 0.430 0.430
SD-BS-L-SINAI_01 Yellow Perch 1996 5 0.210 0.210 0.210 0.210
SD-JA-L-ELM_01 Black Bullhead 1996 4 0.180 0.180 0.180 0.180
SD-JA-L-ELM_01 Black Crappie 1996 8 0.180 0.180 0.180 0.180
SD-JA-L-ELM_01 Walleye 1996 4 0.280 0.280 0.280 0.280
SD-JA-L-ELM_01 Yellow Perch 1996 4 0.150 0.150 0.150 0.150
SD-MI-R-FRANCIS_CASE_01 Channel Catfish 1996 15 0.070 0.060 0.080 0.080
SD-MI-R-FRANCIS_CASE_01 Common Carp 1996 15 0.147 0.130 0.180 0.180
SD-MI-R-FRANCIS_CASE_01 Smallmouth Bass 1996 15 0.087 0.060 0.100 0.100
SD-MI-R-FRANCIS_CASE_01 Walleye 1996 30 0.090 0.070 0.110 0.100
SD-VM-L-E_VERMILLION_01 Black Bullhead 1996 5 0.120 0.120 0.120 0.120
SD-VM-L-E_VERMILLION_01 Black Crappie 1996 5 0.110 0.110 0.110 0.110
SD-VM-L-E_VERMILLION_01 Bluegill 1996 5 0.130 0.130 0.130 0.130
SD-VM-L-E_VERMILLION_01 Northern Pike 1996 5 0.380 0.380 0.380 0.380
NoAUID-FFWhitewoodCr-SDDOH Brown Trout 1997 15 0.067 0.060 0.070 0.070
NoAUID-FFWhitewoodCr-SDDOH Mountain Sucker 1997 5 0.030 0.030 0.030 0.030
SD-BF-R-BEAR_BUTTE_01 Brook Trout 1997 10 0.045 0.040 0.050 0.050
SD-BF-R-BEAR_BUTTE_01 Longnose Dace 1997 5 0.060 0.060 0.060 0.060
SD-BF-R-BEAR_BUTTE_01 Mountain Sucker 1997 5 0.030 0.030 0.030 0.030
SD-BF-R-BEAR_BUTTE_01 White Sucker 1997 5 0.030 0.030 0.030 0.030
SD-BF-R-BELLE_FOURCHE_03 Common Carp 1997 5 0.200 0.200 0.200 0.200
SD-BF-R-BELLE_FOURCHE_03 Largemouth Bass 1997 10 0.285 0.270 0.300 0.300
SD-BF-R-BELLE_FOURCHE_03 Shorthead Redhorse
1997 5 0.100 0.100 0.100 0.100
SD-BF-R-BELLE_FOURCHE_03 White Sucker 1997 5 0.150 0.150 0.150 0.150
SD-BS-L-POINSETT_01 Black Bullhead 1997 5 0.080 0.080 0.080 0.080
SD-BS-L-POINSETT_01 Northern Pike 1997 1 0.200 0.200 0.200 0.200
SD-BS-L-POINSETT_01 Smallmouth Bass 1997 5 0.150 0.150 0.150 0.150
SD-BS-L-POINSETT_01 Walleye 1997 10 0.095 0.090 0.100 0.100
SD-BS-L-POINSETT_01 Yellow Perch 1997 5 0.040 0.040 0.040 0.040
SD-BS-R-BIG_SIOUX_08 Channel Catfish 1997 5 0.150 0.150 0.150 0.150
SD-BS-R-BIG_SIOUX_08 Common Carp 1997 10 0.155 0.150 0.160 0.160
SD-BS-R-BIG_SIOUX_08 River Carpsucker 1997 5 0.270 0.270 0.270 0.270
SD-BS-R-BIG_SIOUX_08 Walleye 1997 4 0.250 0.250 0.250 0.250
SD-CH-R-CHEYENNE_02 Channel Catfish 1997 10 0.180 0.160 0.200 0.200
SD-CH-R-CHEYENNE_02 River Carpsucker 1997 5 0.130 0.130 0.130 0.130
SD-JA-R-JAMES_08 Black Bullhead 1997 5 0.170 0.170 0.170 0.170
SD-JA-R-JAMES_08 Channel Catfish 1997 5 0.140 0.140 0.140 0.140
SD-MI-R-OAHE_01 Channel Catfish 1997 20 0.198 0.140 0.320 0.225
SD-MI-R-OAHE_01 Common Carp 1997 10 0.220 0.220 0.220 0.220
SD-MI-R-OAHE_01 Goldeye 1997 5 0.096 0.080 0.110 0.105
SD-MI-R-OAHE_01 Walleye 1997 15 0.239 0.150 0.370 0.370
SD-MI-R-OAHE_01 White Bass 1997 15 0.268 0.100 0.630 0.380
SD-MI-R-OAHE_01 Yellow Perch 1997 10 0.075 0.070 0.080 0.080
SD-BS-L-BRANT_01 Black Bullhead 1998 2 0.075 0.030 0.120 0.120
SD-BS-L-BRANT_01 Black Crappie 1998 1 0.067 0.067 0.067 0.067
SD-BS-L-BRANT_01 Walleye 1998 1 0.180 0.180 0.180 0.180
SD-BS-L-BRANT_01 Yellow Perch 1998 1 0.069 0.069 0.069 0.069
SD-BS-L-E_OAKWOOD_01 Black Bullhead 1998 2 0.056 0.054 0.057 0.057
SD-BS-L-E_OAKWOOD_01 Common Carp 1998 1 0.019 0.019 0.019 0.019
SD-BS-L-E_OAKWOOD_01 Walleye 1998 1 0.069 0.069 0.069 0.069
SD-BS-L-E_OAKWOOD_01 Yellow Perch 1998 5 0.029 0.029 0.029 0.029
SD-BS-L-PELICAN_01 Northern Pike 1998 5 0.065 0.065 0.065 0.065
SD-BS-L-PELICAN_01 Walleye 1998 10 0.053 0.043 0.063 0.063
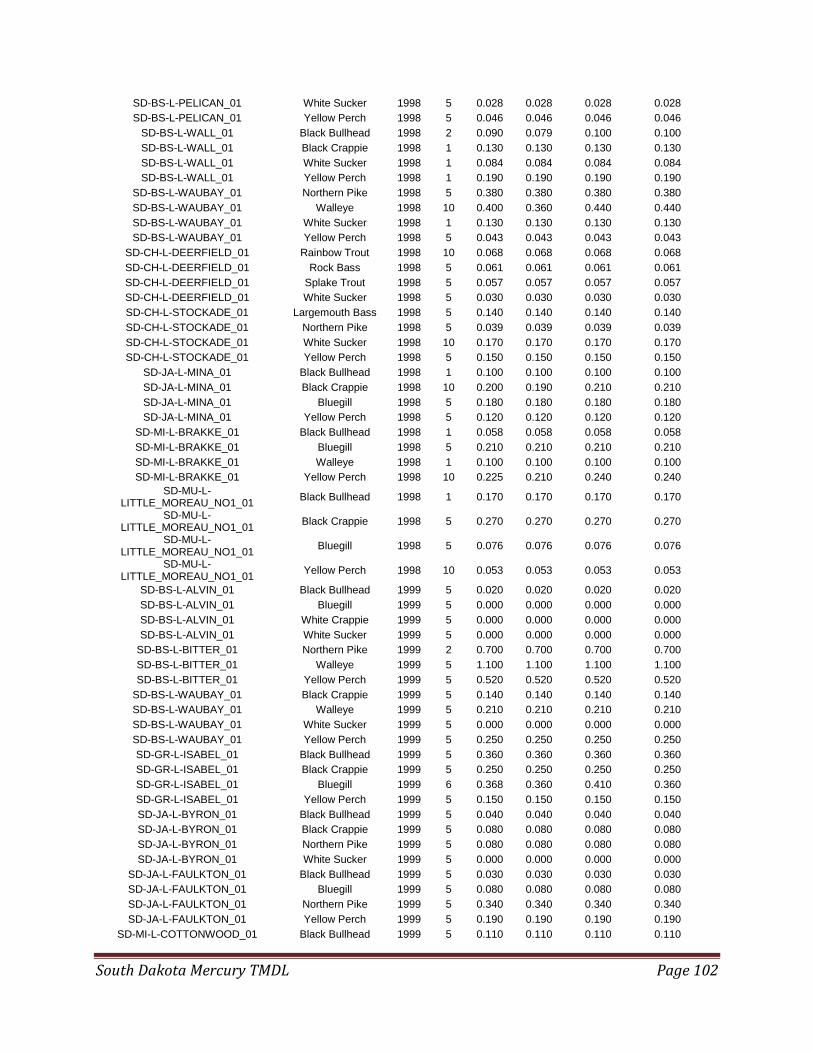
South Dakota Mercury TMDL Page 102
SD-BS-L-PELICAN_01 White Sucker 1998 5 0.028 0.028 0.028 0.028
SD-BS-L-PELICAN_01 Yellow Perch 1998 5 0.046 0.046 0.046 0.046
SD-BS-L-WALL_01 Black Bullhead 1998 2 0.090 0.079 0.100 0.100
SD-BS-L-WALL_01 Black Crappie 1998 1 0.130 0.130 0.130 0.130
SD-BS-L-WALL_01 White Sucker 1998 1 0.084 0.084 0.084 0.084
SD-BS-L-WALL_01 Yellow Perch 1998 1 0.190 0.190 0.190 0.190
SD-BS-L-WAUBAY_01 Northern Pike 1998 5 0.380 0.380 0.380 0.380
SD-BS-L-WAUBAY_01 Walleye 1998 10 0.400 0.360 0.440 0.440
SD-BS-L-WAUBAY_01 White Sucker 1998 1 0.130 0.130 0.130 0.130
SD-BS-L-WAUBAY_01 Yellow Perch 1998 5 0.043 0.043 0.043 0.043
SD-CH-L-DEERFIELD_01 Rainbow Trout 1998 10 0.068 0.068 0.068 0.068
SD-CH-L-DEERFIELD_01 Rock Bass 1998 5 0.061 0.061 0.061 0.061
SD-CH-L-DEERFIELD_01 Splake Trout 1998 5 0.057 0.057 0.057 0.057
SD-CH-L-DEERFIELD_01 White Sucker 1998 5 0.030 0.030 0.030 0.030
SD-CH-L-STOCKADE_01 Largemouth Bass 1998 5 0.140 0.140 0.140 0.140
SD-CH-L-STOCKADE_01 Northern Pike 1998 5 0.039 0.039 0.039 0.039
SD-CH-L-STOCKADE_01 White Sucker 1998 10 0.170 0.170 0.170 0.170
SD-CH-L-STOCKADE_01 Yellow Perch 1998 5 0.150 0.150 0.150 0.150
SD-JA-L-MINA_01 Black Bullhead 1998 1 0.100 0.100 0.100 0.100
SD-JA-L-MINA_01 Black Crappie 1998 10 0.200 0.190 0.210 0.210
SD-JA-L-MINA_01 Bluegill 1998 5 0.180 0.180 0.180 0.180
SD-JA-L-MINA_01 Yellow Perch 1998 5 0.120 0.120 0.120 0.120
SD-MI-L-BRAKKE_01 Black Bullhead 1998 1 0.058 0.058 0.058 0.058
SD-MI-L-BRAKKE_01 Bluegill 1998 5 0.210 0.210 0.210 0.210
SD-MI-L-BRAKKE_01 Walleye 1998 1 0.100 0.100 0.100 0.100
SD-MI-L-BRAKKE_01 Yellow Perch 1998 10 0.225 0.210 0.240 0.240
SD-MU-L-LITTLE_MOREAU_NO1_01
Black Bullhead 1998 1 0.170 0.170 0.170 0.170
SD-MU-L-LITTLE_MOREAU_NO1_01
Black Crappie 1998 5 0.270 0.270 0.270 0.270
SD-MU-L-LITTLE_MOREAU_NO1_01
Bluegill 1998 5 0.076 0.076 0.076 0.076
SD-MU-L-LITTLE_MOREAU_NO1_01
Yellow Perch 1998 10 0.053 0.053 0.053 0.053
SD-BS-L-ALVIN_01 Black Bullhead 1999 5 0.020 0.020 0.020 0.020
SD-BS-L-ALVIN_01 Bluegill 1999 5 0.000 0.000 0.000 0.000
SD-BS-L-ALVIN_01 White Crappie 1999 5 0.000 0.000 0.000 0.000
SD-BS-L-ALVIN_01 White Sucker 1999 5 0.000 0.000 0.000 0.000
SD-BS-L-BITTER_01 Northern Pike 1999 2 0.700 0.700 0.700 0.700
SD-BS-L-BITTER_01 Walleye 1999 5 1.100 1.100 1.100 1.100
SD-BS-L-BITTER_01 Yellow Perch 1999 5 0.520 0.520 0.520 0.520
SD-BS-L-WAUBAY_01 Black Crappie 1999 5 0.140 0.140 0.140 0.140
SD-BS-L-WAUBAY_01 Walleye 1999 5 0.210 0.210 0.210 0.210
SD-BS-L-WAUBAY_01 White Sucker 1999 5 0.000 0.000 0.000 0.000
SD-BS-L-WAUBAY_01 Yellow Perch 1999 5 0.250 0.250 0.250 0.250
SD-GR-L-ISABEL_01 Black Bullhead 1999 5 0.360 0.360 0.360 0.360
SD-GR-L-ISABEL_01 Black Crappie 1999 5 0.250 0.250 0.250 0.250
SD-GR-L-ISABEL_01 Bluegill 1999 6 0.368 0.360 0.410 0.360
SD-GR-L-ISABEL_01 Yellow Perch 1999 5 0.150 0.150 0.150 0.150
SD-JA-L-BYRON_01 Black Bullhead 1999 5 0.040 0.040 0.040 0.040
SD-JA-L-BYRON_01 Black Crappie 1999 5 0.080 0.080 0.080 0.080
SD-JA-L-BYRON_01 Northern Pike 1999 5 0.080 0.080 0.080 0.080
SD-JA-L-BYRON_01 White Sucker 1999 5 0.000 0.000 0.000 0.000
SD-JA-L-FAULKTON_01 Black Bullhead 1999 5 0.030 0.030 0.030 0.030
SD-JA-L-FAULKTON_01 Bluegill 1999 5 0.080 0.080 0.080 0.080
SD-JA-L-FAULKTON_01 Northern Pike 1999 5 0.340 0.340 0.340 0.340
SD-JA-L-FAULKTON_01 Yellow Perch 1999 5 0.190 0.190 0.190 0.190
SD-MI-L-COTTONWOOD_01 Black Bullhead 1999 5 0.110 0.110 0.110 0.110

South Dakota Mercury TMDL Page 103
SD-MI-L-COTTONWOOD_01 Black Crappie 1999 5 0.210 0.210 0.210 0.210
SD-MI-L-COTTONWOOD_01 Common Carp 1999 5 0.000 0.000 0.000 0.000
SD-MI-L-COTTONWOOD_01 Walleye 1999 6 0.330 0.080 0.380 0.380
SD-MI-R-SHARPE_01 Channel Catfish 1999 15 0.040 0.010 0.070 0.070
SD-MI-R-SHARPE_01 Common Carp 1999 10 0.075 0.050 0.100 0.100
SD-MI-R-SHARPE_01 River Carpsucker 1999 5 0.050 0.050 0.050 0.050
SD-MI-R-SHARPE_01 Sauger 1999 6 0.090 0.090 0.090 0.090
SD-MI-R-SHARPE_01 Smallmouth Bass 1999 5 0.020 0.020 0.020 0.020
SD-MI-R-SHARPE_01 Walleye 1999 21 0.058 0.000 0.220 0.110
SD-MI-R-SHARPE_01 White Bass 1999 5 0.070 0.070 0.070 0.070
SD-BS-L-ANTELOPE_01 Northern Pike 2000 5 0.400 0.400 0.400 0.400
SD-BS-L-ANTELOPE_01 Walleye 2000 2 0.415 0.410 0.420 0.420
SD-BS-L-ANTELOPE_01 Yellow Perch 2000 5 0.230 0.230 0.230 0.230
SD-BS-L-BITTER_01 Northern Pike 2000 35 0.794 0.540 1.130 0.980
SD-BS-L-BITTER_01 Walleye 2000 40 0.814 0.490 1.100 1.040
SD-BS-L-BITTER_01 Yellow Perch 2000 20 0.563 0.410 0.700 0.700
SD-BS-L-BLUE_DOG_01 Northern Pike 2000 5 0.260 0.260 0.260 0.260
SD-BS-L-BLUE_DOG_01 Walleye 2000 6 0.282 0.280 0.290 0.280
SD-BS-L-BLUE_DOG_01 White Bass 2000 5 0.200 0.200 0.200 0.200
SD-BS-L-BLUE_DOG_01 White Sucker 2000 5 0.100 0.100 0.100 0.100
SD-BS-L-CAMPBELL_01 Black Bullhead 2000 5 0.000 0.000 0.000 0.000
SD-BS-L-CAMPBELL_01 White Crappie 2000 5 0.000 0.000 0.000 0.000
SD-BS-L-CAMPBELL_01 White Sucker 2000 5 0.000 0.000 0.000 0.000
SD-BS-L-CAMPBELL_01 Yellow Perch 2000 5 0.040 0.040 0.040 0.040
SD-BS-L-DRY_01 Black Bullhead 2000 5 0.000 0.000 0.000 0.000
SD-BS-L-DRY_01 Northern Pike 2000 5 0.200 0.200 0.200 0.200
SD-BS-L-DRY_01 Walleye 2000 5 0.290 0.290 0.290 0.290
SD-BS-L-DRY_01 White Sucker 2000 5 0.000 0.000 0.000 0.000
SD-BS-L-DRY_01 Yellow Perch 2000 5 0.040 0.040 0.040 0.040
SD-BS-L-LONG_DAY_01 Northern Pike 2000 5 0.270 0.270 0.270 0.270
SD-BS-L-LONG_DAY_01 Walleye 2000 5 0.520 0.520 0.520 0.520
SD-BS-L-LONG_DAY_01 Yellow Perch 2000 5 0.260 0.260 0.260 0.260
SD-BS-L-RUSH_01 Black Bullhead 2000 5 0.050 0.050 0.050 0.050
SD-BS-L-RUSH_01 Northern Pike 2000 5 0.290 0.290 0.290 0.290
SD-BS-L-RUSH_01 Walleye 2000 5 0.280 0.280 0.280 0.280
SD-BS-L-RUSH_01 White Sucker 2000 5 0.050 0.050 0.050 0.050
SD-BS-L-RUSH_01 Yellow Perch 2000 5 0.160 0.160 0.160 0.160
SD-BS-L-SWAN_01 Black Bullhead 2000 5 0.010 0.010 0.010 0.010
SD-BS-L-SWAN_01 Walleye 2000 5 0.160 0.160 0.160 0.160
SD-BS-L-SWAN_01 Yellow Perch 2000 5 0.140 0.140 0.140 0.140
SD-BS-L-WAUBAY_01 Black Crappie 2000 5 0.120 0.120 0.120 0.120
SD-BS-L-WAUBAY_01 Northern Pike 2000 5 0.310 0.310 0.310 0.310
SD-BS-L-WAUBAY_01 Walleye 2000 55 0.484 0.270 0.630 0.590
SD-BS-L-WAUBAY_01 White Sucker 2000 5 0.000 0.000 0.000 0.000
SD-BS-L-WAUBAY_01 Yellow Perch 2000 5 0.260 0.260 0.260 0.260
SD-JA-L-CATTAIL_01 Northern Pike 2000 5 0.300 0.300 0.300 0.300
SD-JA-L-CATTAIL_01 Walleye 2000 5 0.250 0.250 0.250 0.250
SD-JA-L-CAVOUR_01 Black Bullhead 2000 5 0.030 0.030 0.030 0.030
SD-JA-L-CAVOUR_01 Black Crappie 2000 5 0.060 0.060 0.060 0.060
SD-JA-L-CAVOUR_01 Northern Pike 2000 5 0.320 0.320 0.320 0.320
SD-JA-L-CAVOUR_01 Yellow Perch 2000 5 0.180 0.180 0.180 0.180
NoAUID-FFMankeyS-SDDOH Black Bullhead 2001 5 0.100 0.100 0.100 0.100
NoAUID-FFMankeyS-SDDOH Yellow Perch 2001 5 0.180 0.180 0.180 0.180
SD-BS-L-BITTER_01 Northern Pike 2001 30 0.428 0.260 0.540 0.500
SD-BS-L-BITTER_01 Walleye 2001 30 0.787 0.490 1.040 1.020
SD-BS-L-BITTER_01 Yellow Perch 2001 10 0.695 0.660 0.730 0.730

South Dakota Mercury TMDL Page 104
SD-BS-L-DRY_#2_01 Black Bullhead 2001 5 0.120 0.120 0.120 0.120
SD-BS-L-DRY_#2_01 Northern Pike 2001 5 0.250 0.250 0.250 0.250
SD-BS-L-DRY_#2_01 Walleye 2001 5 0.240 0.240 0.240 0.240
SD-BS-L-KAMPESKA_01 White Bass 2001 20 0.423 0.220 0.560 0.560
SD-BS-L-REID_01 Black Bullhead 2001 5 0.140 0.140 0.140 0.140
SD-BS-L-REID_01 Walleye 2001 5 0.460 0.460 0.460 0.460
SD-BS-L-REID_01 Yellow Perch 2001 5 0.300 0.300 0.300 0.300
SD-BS-L-WAUBAY_01 Walleye 2001 45 0.347 0.160 0.620 0.600
SD-CH-R-CHEYENNE_02 Black Bullhead 2001 5 0.120 0.120 0.120 0.120
SD-CH-R-CHEYENNE_02 Bluegill 2001 5 0.030 0.030 0.030 0.030
SD-CH-R-CHEYENNE_02 River Carpsucker 2001 5 0.080 0.080 0.080 0.080
SD-CH-R-CHEYENNE_02 Smallmouth Bass 2001 5 0.050 0.050 0.050 0.050
SD-CH-R-CHEYENNE_04 Channel Catfish 2001 5 0.080 0.080 0.080 0.080
SD-CH-R-CHEYENNE_04 Goldeye 2001 5 0.190 0.190 0.190 0.190
SD-CH-R-CHEYENNE_04 Shorthead Redhorse
2001 5 0.180 0.180 0.180 0.180
SD-CH-R-RAPID_05 Channel Catfish 2001 5 0.140 0.140 0.140 0.140
SD-CH-R-RAPID_05 Goldeye 2001 5 0.180 0.180 0.180 0.180
SD-CH-R-RAPID_05 Shorthead Redhorse
2001 5 0.100 0.100 0.100 0.100
SD-JA-L-CARTHAGE_01 Black Bullhead 2001 5 0.030 0.030 0.030 0.030
SD-JA-L-CARTHAGE_01 Black Crappie 2001 5 0.090 0.090 0.090 0.090
SD-JA-L-CARTHAGE_01 Bluegill 2001 5 0.070 0.070 0.070 0.070
SD-JA-L-CARTHAGE_01 Largemouth Bass 2001 5 0.300 0.300 0.300 0.300
SD-JA-L-LYNN_01 Black Crappie 2001 5 0.330 0.330 0.330 0.330
SD-JA-L-LYNN_01 Bluegill 2001 5 0.150 0.150 0.150 0.150
SD-JA-L-LYNN_01 Saugeye 2001 5 0.660 0.660 0.660 0.660
SD-JA-L-REETZ_01 White Sucker 2001 5 0.120 0.120 0.120 0.120
SD-JA-L-REETZ_01 Yellow Perch 2001 5 0.260 0.260 0.260 0.260
SD-MI-R-LEWIS_AND_CLARK_01 Paddlefish 2001 1 0.000 0.000 0.000 0.000
SD-MI-R-OAHE_01 Channel Catfish 2001 127 0.192 0.070 0.420 0.270
SD-MI-R-OAHE_01 Walleye 2001 140 0.268 0.100 0.960 0.290
SD-MI-R-OAHE_01 White Bass 2001 35 0.350 0.240 0.460 0.440
NoAUID-FFLDimock-SDDOH Black Bullhead 2002 5 0.070 0.070 0.070 0.070
NoAUID-FFLDimock-SDDOH Black Crappie 2002 5 0.120 0.120 0.120 0.120
NoAUID-FFLDimock-SDDOH Common Carp 2002 5 0.160 0.160 0.160 0.160
NoAUID-FFLDimock-SDDOH White Crappie 2002 5 0.100 0.100 0.100 0.100
NoAUID-FFLDimock-SDDOH Yellow Perch 2002 5 0.120 0.120 0.120 0.120
NoAUID-FFMcNenny-SDDOH Brown Trout 2002 6 0.000 0.000 0.000 0.000
NoAUID-FFMcNenny-SDDOH Rainbow Trout 2002 8 0.000 0.000 0.000 0.000
SD-BF-L-NEWELL_01 Bluegill 2002 5 0.330 0.330 0.330 0.330
SD-BF-L-NEWELL_01 Rudd 2002 5 0.050 0.050 0.050 0.050
SD-BF-L-NEWELL_01 Walleye 2002 5 0.360 0.360 0.360 0.360
SD-BF-L-NEWELL_01 White Sucker 2002 5 0.380 0.380 0.380 0.380
SD-BF-L-NEWELL_01 Yellow Perch 2002 5 0.560 0.560 0.560 0.560
SD-BS-L-TWIN_01 Black Bullhead 2002 5 0.300 0.300 0.300 0.300
SD-BS-L-TWIN_01 Northern Pike 2002 3 1.080 1.080 1.080 1.080
SD-BS-L-TWIN_01 Walleye 2002 5 0.540 0.540 0.540 0.540
SD-BS-L-TWIN_01 Yellow Bullhead 2002 5 0.190 0.190 0.190 0.190
SD-BS-L-TWIN_01 Yellow Perch 2002 5 0.300 0.300 0.300 0.300
SD-GR-L-ISABEL_01 Largemouth Bass 2002 20 0.765 0.600 1.120 1.120
SD-GR-L-ISABEL_01 Northern Pike 2002 9 0.872 0.600 1.190 1.190
SD-JA-L-LYNN_01 Walleye 2002 20 0.573 0.470 0.730 0.730
SD-JA-L-LYNN_01 Walleye/Saugeye 2002 21 0.898 0.860 0.950 0.940
SD-LM-R-LITTLE_MISSOURI_01 Sauger 2002 2 0.480 0.480 0.480 0.480
SD-MI-L-HURLEY_01 Black Crappie 2002 10 0.280 0.220 0.340 0.340
SD-MI-L-HURLEY_01 Bluegill 2002 5 0.300 0.300 0.300 0.300
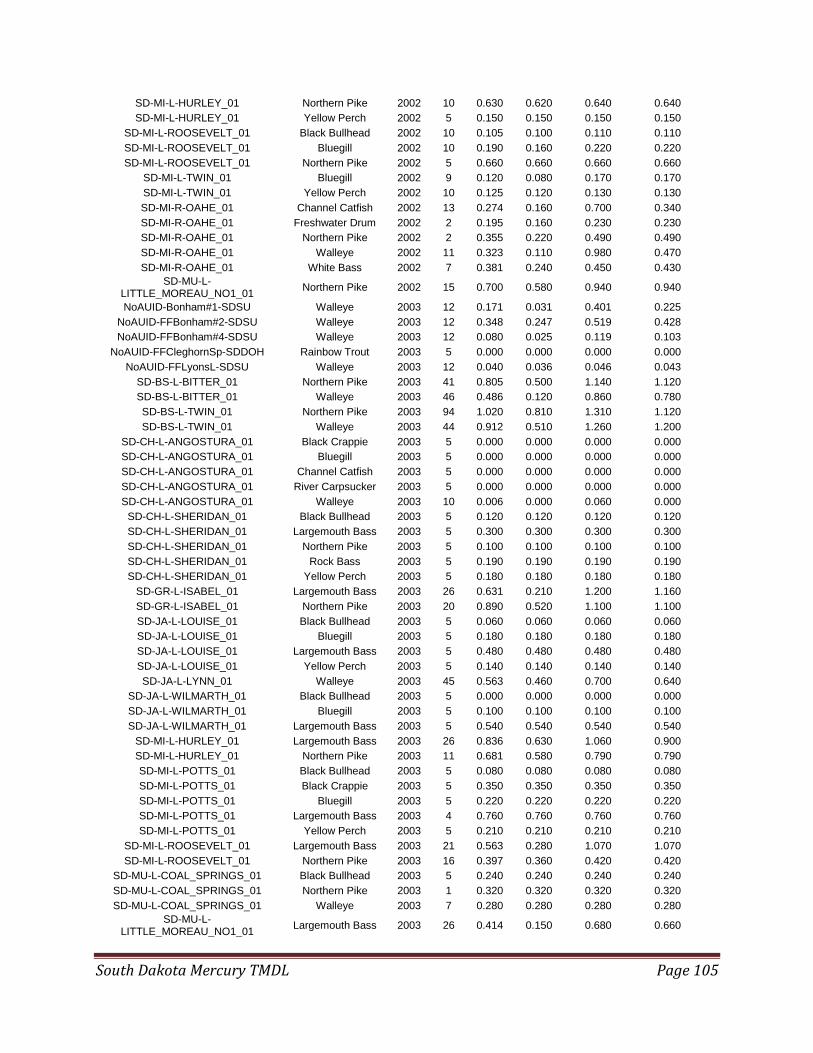
South Dakota Mercury TMDL Page 105
SD-MI-L-HURLEY_01 Northern Pike 2002 10 0.630 0.620 0.640 0.640
SD-MI-L-HURLEY_01 Yellow Perch 2002 5 0.150 0.150 0.150 0.150
SD-MI-L-ROOSEVELT_01 Black Bullhead 2002 10 0.105 0.100 0.110 0.110
SD-MI-L-ROOSEVELT_01 Bluegill 2002 10 0.190 0.160 0.220 0.220
SD-MI-L-ROOSEVELT_01 Northern Pike 2002 5 0.660 0.660 0.660 0.660
SD-MI-L-TWIN_01 Bluegill 2002 9 0.120 0.080 0.170 0.170
SD-MI-L-TWIN_01 Yellow Perch 2002 10 0.125 0.120 0.130 0.130
SD-MI-R-OAHE_01 Channel Catfish 2002 13 0.274 0.160 0.700 0.340
SD-MI-R-OAHE_01 Freshwater Drum 2002 2 0.195 0.160 0.230 0.230
SD-MI-R-OAHE_01 Northern Pike 2002 2 0.355 0.220 0.490 0.490
SD-MI-R-OAHE_01 Walleye 2002 11 0.323 0.110 0.980 0.470
SD-MI-R-OAHE_01 White Bass 2002 7 0.381 0.240 0.450 0.430
SD-MU-L-LITTLE_MOREAU_NO1_01
Northern Pike 2002 15 0.700 0.580 0.940 0.940
NoAUID-Bonham#1-SDSU Walleye 2003 12 0.171 0.031 0.401 0.225
NoAUID-FFBonham#2-SDSU Walleye 2003 12 0.348 0.247 0.519 0.428
NoAUID-FFBonham#4-SDSU Walleye 2003 12 0.080 0.025 0.119 0.103
NoAUID-FFCleghornSp-SDDOH Rainbow Trout 2003 5 0.000 0.000 0.000 0.000
NoAUID-FFLyonsL-SDSU Walleye 2003 12 0.040 0.036 0.046 0.043
SD-BS-L-BITTER_01 Northern Pike 2003 41 0.805 0.500 1.140 1.120
SD-BS-L-BITTER_01 Walleye 2003 46 0.486 0.120 0.860 0.780
SD-BS-L-TWIN_01 Northern Pike 2003 94 1.020 0.810 1.310 1.120
SD-BS-L-TWIN_01 Walleye 2003 44 0.912 0.510 1.260 1.200
SD-CH-L-ANGOSTURA_01 Black Crappie 2003 5 0.000 0.000 0.000 0.000
SD-CH-L-ANGOSTURA_01 Bluegill 2003 5 0.000 0.000 0.000 0.000
SD-CH-L-ANGOSTURA_01 Channel Catfish 2003 5 0.000 0.000 0.000 0.000
SD-CH-L-ANGOSTURA_01 River Carpsucker 2003 5 0.000 0.000 0.000 0.000
SD-CH-L-ANGOSTURA_01 Walleye 2003 10 0.006 0.000 0.060 0.000
SD-CH-L-SHERIDAN_01 Black Bullhead 2003 5 0.120 0.120 0.120 0.120
SD-CH-L-SHERIDAN_01 Largemouth Bass 2003 5 0.300 0.300 0.300 0.300
SD-CH-L-SHERIDAN_01 Northern Pike 2003 5 0.100 0.100 0.100 0.100
SD-CH-L-SHERIDAN_01 Rock Bass 2003 5 0.190 0.190 0.190 0.190
SD-CH-L-SHERIDAN_01 Yellow Perch 2003 5 0.180 0.180 0.180 0.180
SD-GR-L-ISABEL_01 Largemouth Bass 2003 26 0.631 0.210 1.200 1.160
SD-GR-L-ISABEL_01 Northern Pike 2003 20 0.890 0.520 1.100 1.100
SD-JA-L-LOUISE_01 Black Bullhead 2003 5 0.060 0.060 0.060 0.060
SD-JA-L-LOUISE_01 Bluegill 2003 5 0.180 0.180 0.180 0.180
SD-JA-L-LOUISE_01 Largemouth Bass 2003 5 0.480 0.480 0.480 0.480
SD-JA-L-LOUISE_01 Yellow Perch 2003 5 0.140 0.140 0.140 0.140
SD-JA-L-LYNN_01 Walleye 2003 45 0.563 0.460 0.700 0.640
SD-JA-L-WILMARTH_01 Black Bullhead 2003 5 0.000 0.000 0.000 0.000
SD-JA-L-WILMARTH_01 Bluegill 2003 5 0.100 0.100 0.100 0.100
SD-JA-L-WILMARTH_01 Largemouth Bass 2003 5 0.540 0.540 0.540 0.540
SD-MI-L-HURLEY_01 Largemouth Bass 2003 26 0.836 0.630 1.060 0.900
SD-MI-L-HURLEY_01 Northern Pike 2003 11 0.681 0.580 0.790 0.790
SD-MI-L-POTTS_01 Black Bullhead 2003 5 0.080 0.080 0.080 0.080
SD-MI-L-POTTS_01 Black Crappie 2003 5 0.350 0.350 0.350 0.350
SD-MI-L-POTTS_01 Bluegill 2003 5 0.220 0.220 0.220 0.220
SD-MI-L-POTTS_01 Largemouth Bass 2003 4 0.760 0.760 0.760 0.760
SD-MI-L-POTTS_01 Yellow Perch 2003 5 0.210 0.210 0.210 0.210
SD-MI-L-ROOSEVELT_01 Largemouth Bass 2003 21 0.563 0.280 1.070 1.070
SD-MI-L-ROOSEVELT_01 Northern Pike 2003 16 0.397 0.360 0.420 0.420
SD-MU-L-COAL_SPRINGS_01 Black Bullhead 2003 5 0.240 0.240 0.240 0.240
SD-MU-L-COAL_SPRINGS_01 Northern Pike 2003 1 0.320 0.320 0.320 0.320
SD-MU-L-COAL_SPRINGS_01 Walleye 2003 7 0.280 0.280 0.280 0.280
SD-MU-L-LITTLE_MOREAU_NO1_01
Largemouth Bass 2003 26 0.414 0.150 0.680 0.660
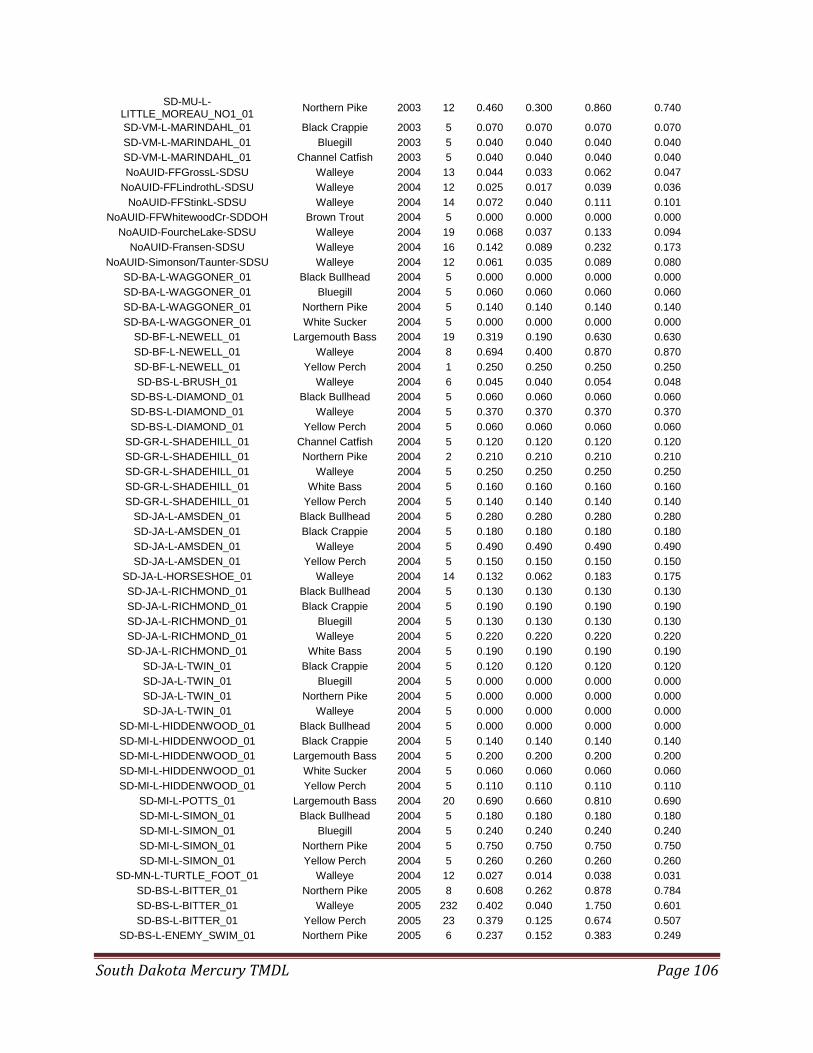
South Dakota Mercury TMDL Page 106
SD-MU-L-LITTLE_MOREAU_NO1_01
Northern Pike 2003 12 0.460 0.300 0.860 0.740
SD-VM-L-MARINDAHL_01 Black Crappie 2003 5 0.070 0.070 0.070 0.070
SD-VM-L-MARINDAHL_01 Bluegill 2003 5 0.040 0.040 0.040 0.040
SD-VM-L-MARINDAHL_01 Channel Catfish 2003 5 0.040 0.040 0.040 0.040
NoAUID-FFGrossL-SDSU Walleye 2004 13 0.044 0.033 0.062 0.047
NoAUID-FFLindrothL-SDSU Walleye 2004 12 0.025 0.017 0.039 0.036
NoAUID-FFStinkL-SDSU Walleye 2004 14 0.072 0.040 0.111 0.101
NoAUID-FFWhitewoodCr-SDDOH Brown Trout 2004 5 0.000 0.000 0.000 0.000
NoAUID-FourcheLake-SDSU Walleye 2004 19 0.068 0.037 0.133 0.094
NoAUID-Fransen-SDSU Walleye 2004 16 0.142 0.089 0.232 0.173
NoAUID-Simonson/Taunter-SDSU Walleye 2004 12 0.061 0.035 0.089 0.080
SD-BA-L-WAGGONER_01 Black Bullhead 2004 5 0.000 0.000 0.000 0.000
SD-BA-L-WAGGONER_01 Bluegill 2004 5 0.060 0.060 0.060 0.060
SD-BA-L-WAGGONER_01 Northern Pike 2004 5 0.140 0.140 0.140 0.140
SD-BA-L-WAGGONER_01 White Sucker 2004 5 0.000 0.000 0.000 0.000
SD-BF-L-NEWELL_01 Largemouth Bass 2004 19 0.319 0.190 0.630 0.630
SD-BF-L-NEWELL_01 Walleye 2004 8 0.694 0.400 0.870 0.870
SD-BF-L-NEWELL_01 Yellow Perch 2004 1 0.250 0.250 0.250 0.250
SD-BS-L-BRUSH_01 Walleye 2004 6 0.045 0.040 0.054 0.048
SD-BS-L-DIAMOND_01 Black Bullhead 2004 5 0.060 0.060 0.060 0.060
SD-BS-L-DIAMOND_01 Walleye 2004 5 0.370 0.370 0.370 0.370
SD-BS-L-DIAMOND_01 Yellow Perch 2004 5 0.060 0.060 0.060 0.060
SD-GR-L-SHADEHILL_01 Channel Catfish 2004 5 0.120 0.120 0.120 0.120
SD-GR-L-SHADEHILL_01 Northern Pike 2004 2 0.210 0.210 0.210 0.210
SD-GR-L-SHADEHILL_01 Walleye 2004 5 0.250 0.250 0.250 0.250
SD-GR-L-SHADEHILL_01 White Bass 2004 5 0.160 0.160 0.160 0.160
SD-GR-L-SHADEHILL_01 Yellow Perch 2004 5 0.140 0.140 0.140 0.140
SD-JA-L-AMSDEN_01 Black Bullhead 2004 5 0.280 0.280 0.280 0.280
SD-JA-L-AMSDEN_01 Black Crappie 2004 5 0.180 0.180 0.180 0.180
SD-JA-L-AMSDEN_01 Walleye 2004 5 0.490 0.490 0.490 0.490
SD-JA-L-AMSDEN_01 Yellow Perch 2004 5 0.150 0.150 0.150 0.150
SD-JA-L-HORSESHOE_01 Walleye 2004 14 0.132 0.062 0.183 0.175
SD-JA-L-RICHMOND_01 Black Bullhead 2004 5 0.130 0.130 0.130 0.130
SD-JA-L-RICHMOND_01 Black Crappie 2004 5 0.190 0.190 0.190 0.190
SD-JA-L-RICHMOND_01 Bluegill 2004 5 0.130 0.130 0.130 0.130
SD-JA-L-RICHMOND_01 Walleye 2004 5 0.220 0.220 0.220 0.220
SD-JA-L-RICHMOND_01 White Bass 2004 5 0.190 0.190 0.190 0.190
SD-JA-L-TWIN_01 Black Crappie 2004 5 0.120 0.120 0.120 0.120
SD-JA-L-TWIN_01 Bluegill 2004 5 0.000 0.000 0.000 0.000
SD-JA-L-TWIN_01 Northern Pike 2004 5 0.000 0.000 0.000 0.000
SD-JA-L-TWIN_01 Walleye 2004 5 0.000 0.000 0.000 0.000
SD-MI-L-HIDDENWOOD_01 Black Bullhead 2004 5 0.000 0.000 0.000 0.000
SD-MI-L-HIDDENWOOD_01 Black Crappie 2004 5 0.140 0.140 0.140 0.140
SD-MI-L-HIDDENWOOD_01 Largemouth Bass 2004 5 0.200 0.200 0.200 0.200
SD-MI-L-HIDDENWOOD_01 White Sucker 2004 5 0.060 0.060 0.060 0.060
SD-MI-L-HIDDENWOOD_01 Yellow Perch 2004 5 0.110 0.110 0.110 0.110
SD-MI-L-POTTS_01 Largemouth Bass 2004 20 0.690 0.660 0.810 0.690
SD-MI-L-SIMON_01 Black Bullhead 2004 5 0.180 0.180 0.180 0.180
SD-MI-L-SIMON_01 Bluegill 2004 5 0.240 0.240 0.240 0.240
SD-MI-L-SIMON_01 Northern Pike 2004 5 0.750 0.750 0.750 0.750
SD-MI-L-SIMON_01 Yellow Perch 2004 5 0.260 0.260 0.260 0.260
SD-MN-L-TURTLE_FOOT_01 Walleye 2004 12 0.027 0.014 0.038 0.031
SD-BS-L-BITTER_01 Northern Pike 2005 8 0.608 0.262 0.878 0.784
SD-BS-L-BITTER_01 Walleye 2005 232 0.402 0.040 1.750 0.601
SD-BS-L-BITTER_01 Yellow Perch 2005 23 0.379 0.125 0.674 0.507
SD-BS-L-ENEMY_SWIM_01 Northern Pike 2005 6 0.237 0.152 0.383 0.249

South Dakota Mercury TMDL Page 107
SD-BS-L-ENEMY_SWIM_01 Walleye 2005 31 0.163 0.065 0.773 0.244
SD-BS-L-ISLAND_N_01 Black Bullhead 2005 5 0.140 0.140 0.140 0.140
SD-BS-L-ISLAND_N_01 Northern Pike 2005 5 0.630 0.310 0.710 0.710
SD-BS-L-ISLAND_N_01 Walleye 2005 5 0.488 0.290 1.040 0.705
SD-BS-L-KAMPESKA_01 Walleye 2005 22 0.113 0.045 0.191 0.140
SD-BS-L-PELICAN_01 Walleye 2005 101 0.081 0.000 0.647 0.108
SD-BS-L-TWIN_01 Northern Pike 2005 4 1.178 0.811 1.580 1.580
SD-BS-L-TWIN_01 Walleye 2005 58 0.867 0.084 2.270 1.540
SD-BS-L-TWIN_01 Yellow Perch 2005 3 0.461 0.454 0.465 0.465
SD-CH-L-CURLEW_01 Black Bullhead 2005 5 0.120 0.120 0.120 0.120
SD-CH-L-CURLEW_01 Black Crappie 2005 5 0.150 0.150 0.150 0.150
SD-CH-L-CURLEW_01 Common Carp 2005 2 0.030 0.030 0.030 0.030
SD-CH-L-CURLEW_01 Largemouth Bass 2005 5 0.110 0.110 0.110 0.110
SD-CH-L-CURLEW_01 Northern Pike 2005 1 0.250 0.250 0.250 0.250
SD-CH-L-CURLEW_01 Walleye 2005 4 0.080 0.080 0.080 0.080
SD-CH-L-PACTOLA_01 Black Crappie 2005 4 0.100 0.100 0.100 0.100
SD-CH-L-PACTOLA_01 Bluegill 2005 5 0.130 0.130 0.130 0.130
SD-CH-L-PACTOLA_01 Largemouth Bass 2005 4 0.145 0.100 0.190 0.190
SD-CH-L-PACTOLA_01 Rock Bass 2005 5 0.260 0.260 0.260 0.260
SD-CH-L-PACTOLA_01 Yellow Perch 2005 5 0.240 0.240 0.240 0.240
SD-GR-L-ISABEL_01 Largemouth Bass 2005 36 0.490 0.033 1.620 0.681
SD-JA-L-BYRON_01 Walleye 2005 113 0.191 0.034 0.265 0.211
SD-JA-L-LYNN_01 Northern Pike 2005 1 0.490 0.490 0.490 0.490
SD-JA-L-LYNN_01 Walleye 2005 20 0.270 0.180 0.465 0.329
SD-JA-L-ROY_01 Black Bullhead 2005 5 0.090 0.090 0.090 0.090
SD-JA-L-ROY_01 Bluegill 2005 5 0.060 0.060 0.060 0.060
SD-JA-L-ROY_01 Northern Pike 2005 7 0.173 0.027 0.300 0.210
SD-JA-L-ROY_01 Walleye 2005 22 0.105 0.036 0.262 0.123
SD-JA-L-ROY_01 White Sucker 2005 5 0.220 0.220 0.220 0.220
SD-JA-L-S_RED_IRON_01 Black Bullhead 2005 5 0.090 0.090 0.090 0.090
SD-JA-L-S_RED_IRON_01 Northern Pike 2005 2 0.170 0.100 0.240 0.240
SD-JA-L-S_RED_IRON_01 Walleye 2005 5 0.084 0.050 0.220 0.135
SD-JA-L-S_RED_IRON_01 White Sucker 2005 5 0.030 0.030 0.030 0.030
SD-JA-L-SOUTH_BUFFALO_01 Black Bullhead 2005 5 0.100 0.100 0.100 0.100
SD-JA-L-SOUTH_BUFFALO_01 Bluegill 2005 5 0.090 0.090 0.090 0.090
SD-JA-L-SOUTH_BUFFALO_01 Walleye 2005 5 0.238 0.190 0.270 0.270
SD-JA-L-SOUTH_BUFFALO_01 White Sucker 2005 5 0.030 0.030 0.030 0.030
SD-JA-L-WILMARTH_01 Largemouth Bass 2005 19 0.387 0.290 0.640 0.640
SD-JA-L-WILMARTH_01 Northern Pike 2005 15 0.440 0.300 0.650 0.650
SD-MI-L-BYRE_01 Black Bullhead 2005 5 0.040 0.040 0.040 0.040
SD-MI-L-BYRE_01 Bluegill 2005 5 0.130 0.130 0.130 0.130
SD-MI-L-BYRE_01 Walleye 2005 5 0.130 0.130 0.130 0.130
SD-MI-L-FATE_01 Black Crappie 2005 5 0.160 0.160 0.160 0.160
SD-MI-L-FATE_01 Walleye 2005 5 0.290 0.290 0.290 0.290
SD-MI-L-HURLEY_01 Largemouth Bass 2005 25 0.822 0.557 1.080 0.926
SD-MI-L-MCCOOK_01 Black Crappie 2005 5 0.200 0.200 0.200 0.200
SD-MI-L-MCCOOK_01 Channel Catfish 2005 5 0.030 0.030 0.030 0.030
SD-MI-L-MCCOOK_01 Largemouth Bass 2005 5 0.188 0.170 0.260 0.215
SD-MI-L-SIMON_01 Largemouth Bass 2005 17 0.889 0.800 0.920 0.920
SD-MI-L-SIMON_01 Northern Pike 2005 15 0.633 0.550 0.690 0.690
NoAUID-FFBeaverL-SDDOH Black Bullhead 2006 5 0.020 0.020 0.020 0.020
NoAUID-FFBeaverL-SDDOH Black Crappie 2006 5 0.120 0.120 0.120 0.120
NoAUID-FFEastLemmonL-SDDOH Black Bullhead 2006 5 0.180 0.180 0.180 0.180
NoAUID-FFEastLemmonL-SDDOH White Sucker 2006 5 0.190 0.190 0.190 0.190
NoAUID-FFEastLemmonL-SDDOH Yellow Perch 2006 5 0.150 0.150 0.150 0.150
SD-BA-L-HAYES_01 Black Bullhead 2006 5 0.090 0.090 0.090 0.090
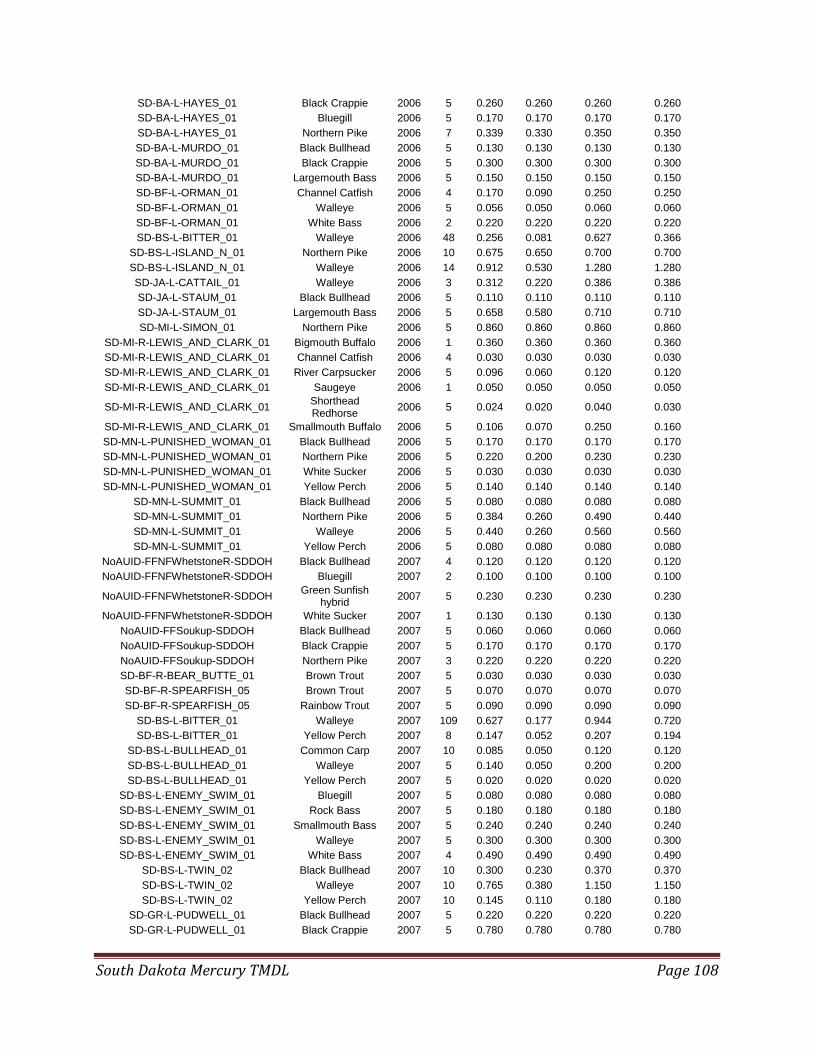
South Dakota Mercury TMDL Page 108
SD-BA-L-HAYES_01 Black Crappie 2006 5 0.260 0.260 0.260 0.260
SD-BA-L-HAYES_01 Bluegill 2006 5 0.170 0.170 0.170 0.170
SD-BA-L-HAYES_01 Northern Pike 2006 7 0.339 0.330 0.350 0.350
SD-BA-L-MURDO_01 Black Bullhead 2006 5 0.130 0.130 0.130 0.130
SD-BA-L-MURDO_01 Black Crappie 2006 5 0.300 0.300 0.300 0.300
SD-BA-L-MURDO_01 Largemouth Bass 2006 5 0.150 0.150 0.150 0.150
SD-BF-L-ORMAN_01 Channel Catfish 2006 4 0.170 0.090 0.250 0.250
SD-BF-L-ORMAN_01 Walleye 2006 5 0.056 0.050 0.060 0.060
SD-BF-L-ORMAN_01 White Bass 2006 2 0.220 0.220 0.220 0.220
SD-BS-L-BITTER_01 Walleye 2006 48 0.256 0.081 0.627 0.366
SD-BS-L-ISLAND_N_01 Northern Pike 2006 10 0.675 0.650 0.700 0.700
SD-BS-L-ISLAND_N_01 Walleye 2006 14 0.912 0.530 1.280 1.280
SD-JA-L-CATTAIL_01 Walleye 2006 3 0.312 0.220 0.386 0.386
SD-JA-L-STAUM_01 Black Bullhead 2006 5 0.110 0.110 0.110 0.110
SD-JA-L-STAUM_01 Largemouth Bass 2006 5 0.658 0.580 0.710 0.710
SD-MI-L-SIMON_01 Northern Pike 2006 5 0.860 0.860 0.860 0.860
SD-MI-R-LEWIS_AND_CLARK_01 Bigmouth Buffalo 2006 1 0.360 0.360 0.360 0.360
SD-MI-R-LEWIS_AND_CLARK_01 Channel Catfish 2006 4 0.030 0.030 0.030 0.030
SD-MI-R-LEWIS_AND_CLARK_01 River Carpsucker 2006 5 0.096 0.060 0.120 0.120
SD-MI-R-LEWIS_AND_CLARK_01 Saugeye 2006 1 0.050 0.050 0.050 0.050
SD-MI-R-LEWIS_AND_CLARK_01 Shorthead Redhorse
2006 5 0.024 0.020 0.040 0.030
SD-MI-R-LEWIS_AND_CLARK_01 Smallmouth Buffalo 2006 5 0.106 0.070 0.250 0.160
SD-MN-L-PUNISHED_WOMAN_01 Black Bullhead 2006 5 0.170 0.170 0.170 0.170
SD-MN-L-PUNISHED_WOMAN_01 Northern Pike 2006 5 0.220 0.200 0.230 0.230
SD-MN-L-PUNISHED_WOMAN_01 White Sucker 2006 5 0.030 0.030 0.030 0.030
SD-MN-L-PUNISHED_WOMAN_01 Yellow Perch 2006 5 0.140 0.140 0.140 0.140
SD-MN-L-SUMMIT_01 Black Bullhead 2006 5 0.080 0.080 0.080 0.080
SD-MN-L-SUMMIT_01 Northern Pike 2006 5 0.384 0.260 0.490 0.440
SD-MN-L-SUMMIT_01 Walleye 2006 5 0.440 0.260 0.560 0.560
SD-MN-L-SUMMIT_01 Yellow Perch 2006 5 0.080 0.080 0.080 0.080
NoAUID-FFNFWhetstoneR-SDDOH Black Bullhead 2007 4 0.120 0.120 0.120 0.120
NoAUID-FFNFWhetstoneR-SDDOH Bluegill 2007 2 0.100 0.100 0.100 0.100
NoAUID-FFNFWhetstoneR-SDDOH Green Sunfish
hybrid 2007 5 0.230 0.230 0.230 0.230
NoAUID-FFNFWhetstoneR-SDDOH White Sucker 2007 1 0.130 0.130 0.130 0.130
NoAUID-FFSoukup-SDDOH Black Bullhead 2007 5 0.060 0.060 0.060 0.060
NoAUID-FFSoukup-SDDOH Black Crappie 2007 5 0.170 0.170 0.170 0.170
NoAUID-FFSoukup-SDDOH Northern Pike 2007 3 0.220 0.220 0.220 0.220
SD-BF-R-BEAR_BUTTE_01 Brown Trout 2007 5 0.030 0.030 0.030 0.030
SD-BF-R-SPEARFISH_05 Brown Trout 2007 5 0.070 0.070 0.070 0.070
SD-BF-R-SPEARFISH_05 Rainbow Trout 2007 5 0.090 0.090 0.090 0.090
SD-BS-L-BITTER_01 Walleye 2007 109 0.627 0.177 0.944 0.720
SD-BS-L-BITTER_01 Yellow Perch 2007 8 0.147 0.052 0.207 0.194
SD-BS-L-BULLHEAD_01 Common Carp 2007 10 0.085 0.050 0.120 0.120
SD-BS-L-BULLHEAD_01 Walleye 2007 5 0.140 0.050 0.200 0.200
SD-BS-L-BULLHEAD_01 Yellow Perch 2007 5 0.020 0.020 0.020 0.020
SD-BS-L-ENEMY_SWIM_01 Bluegill 2007 5 0.080 0.080 0.080 0.080
SD-BS-L-ENEMY_SWIM_01 Rock Bass 2007 5 0.180 0.180 0.180 0.180
SD-BS-L-ENEMY_SWIM_01 Smallmouth Bass 2007 5 0.240 0.240 0.240 0.240
SD-BS-L-ENEMY_SWIM_01 Walleye 2007 5 0.300 0.300 0.300 0.300
SD-BS-L-ENEMY_SWIM_01 White Bass 2007 4 0.490 0.490 0.490 0.490
SD-BS-L-TWIN_02 Black Bullhead 2007 10 0.300 0.230 0.370 0.370
SD-BS-L-TWIN_02 Walleye 2007 10 0.765 0.380 1.150 1.150
SD-BS-L-TWIN_02 Yellow Perch 2007 10 0.145 0.110 0.180 0.180
SD-GR-L-PUDWELL_01 Black Bullhead 2007 5 0.220 0.220 0.220 0.220
SD-GR-L-PUDWELL_01 Black Crappie 2007 5 0.780 0.780 0.780 0.780

South Dakota Mercury TMDL Page 109
SD-GR-L-PUDWELL_01 Walleye 2007 5 0.770 0.770 0.770 0.770
SD-JA-L-HORSESHOE_01 Black Crappie 2007 3 0.210 0.210 0.210 0.210
SD-JA-L-HORSESHOE_01 Bluegill 2007 5 0.120 0.120 0.120 0.120
SD-JA-L-HORSESHOE_01 Smallmouth Bass 2007 4 0.300 0.300 0.300 0.300
SD-JA-L-HORSESHOE_01 Walleye 2007 5 0.660 0.660 0.660 0.660
SD-JA-L-HORSESHOE_01 Yellow Perch 2007 5 0.190 0.190 0.190 0.190
SD-JA-L-ROSEHILL_01 Black Bullhead 2007 5 0.220 0.220 0.220 0.220
SD-JA-L-ROSEHILL_01 Black Crappie 2007 5 0.340 0.340 0.340 0.340
SD-MI-R-OAHE_01 Channel Catfish 2007 5 0.200 0.200 0.200 0.200
SD-MI-R-OAHE_01 Walleye 2007 15 0.133 0.100 0.180 0.180
SD-MI-R-OAHE_01 White Bass 2007 5 0.280 0.280 0.280 0.280
SD-MN-L-ALICE_01 Black Bullhead 2007 5 0.120 0.120 0.120 0.120
SD-MN-L-ALICE_01 Common Carp 2007 5 0.140 0.140 0.140 0.140
SD-MN-L-ALICE_01 European Rudd 2007 4 0.280 0.280 0.280 0.280
SD-MN-L-ALICE_01 Northern Pike 2007 5 0.360 0.360 0.360 0.360
SD-MN-L-ALICE_01 Walleye 2007 5 0.110 0.110 0.110 0.110
SD-VM-L-THOMPSON_01 Black Crappie 2007 5 0.310 0.310 0.310 0.310
SD-VM-L-THOMPSON_01 Walleye 2007 5 0.250 0.250 0.250 0.250
NoAUID-FFBullheadLR-SDDOH Black Bullhead 2008 15 0.027 0.020 0.040 0.040
NoAUID-FFBullheadLR-SDDOH Northern Pike 2008 10 0.145 0.100 0.190 0.190
NoAUID-FFBullheadLR-SDDOH Yellow Perch 2008 5 0.050 0.050 0.050 0.050
NoAUID-FFCrookedL-SDDOH Black Bullhead 2008 5 0.030 0.030 0.030 0.030
NoAUID-FFCrookedL-SDDOH Northern Pike 2008 5 0.080 0.080 0.080 0.080
NoAUID-FFCrookedL-SDDOH Yellow Perch 2008 5 0.040 0.040 0.040 0.040
NoAUID-FFHurricaneL-SDDOH Black Bullhead 2008 5 0.030 0.030 0.030 0.030
NoAUID-FFHurricaneL-SDDOH Northern Pike 2008 5 0.080 0.080 0.080 0.080
NoAUID-FFHurricaneL-SDDOH Yellow Perch 2008 5 0.050 0.050 0.050 0.050
SD-BS-L-DIAMOND_01 Black Bullhead 2008 5 0.040 0.040 0.040 0.040
SD-BS-L-DIAMOND_01 Walleye 2008 15 0.413 0.190 0.650 0.650
SD-BS-L-MADISON_01 Black Bullhead 2008 5 0.030 0.030 0.030 0.030
SD-BS-L-MADISON_01 Black Crappie 2008 5 0.030 0.030 0.030 0.030
SD-BS-L-MADISON_01 Bluegill 2008 5 0.020 0.020 0.020 0.020
SD-BS-L-MADISON_01 Yellow Perch 2008 5 0.020 0.020 0.020 0.020
SD-BS-L-PICKEREL_01 Black Bullhead 2008 5 0.040 0.040 0.040 0.040
SD-BS-L-PICKEREL_01 Bluegill 2008 5 0.060 0.060 0.060 0.060
SD-BS-L-PICKEREL_01 Rock Bass 2008 5 0.100 0.100 0.100 0.100
SD-BS-L-PICKEREL_01 Walleye 2008 5 0.100 0.100 0.100 0.100
SD-BS-L-PICKEREL_01 White Sucker 2008 5 0.020 0.020 0.020 0.020
SD-BS-L-SCHOOL_01 Black Bullhead 2008 5 0.050 0.050 0.050 0.050
SD-BS-L-SCHOOL_01 Northern Pike 2008 5 0.130 0.130 0.130 0.130
SD-BS-L-SCHOOL_01 Yellow Perch 2008 2 0.060 0.060 0.060 0.060
SD-BS-L-TWIN_02 Walleye 2008 30 0.965 0.610 1.620 1.450
SD-BS-L-WAUBAY_01 Northern Pike 2008 10 0.395 0.170 0.620 0.620
SD-BS-L-WAUBAY_01 Walleye 2008 15 0.130 0.110 0.150 0.150
SD-BS-L-WAUBAY_01 Yellow Perch 2008 15 0.093 0.060 0.140 0.140
SD-GR-L-PUDWELL_01 Black Crappie 2008 9 0.691 0.680 0.700 0.700
SD-GR-L-PUDWELL_01 Walleye 2008 11 1.147 1.020 1.230 1.230
SD-JA-L-MITCHELL_01 Black Crappie 2008 5 0.130 0.130 0.130 0.130
SD-JA-L-MITCHELL_01 Bluegill 2008 1 0.110 0.110 0.110 0.110
SD-JA-L-MITCHELL_01 Channel Catfish 2008 5 0.170 0.170 0.170 0.170
SD-JA-L-MITCHELL_01 Walleye 2008 5 0.150 0.150 0.150 0.150
SD-MI-L-HURLEY_01 Largemouth Bass 2008 23 0.793 0.500 0.900 0.900
SD-MI-L-ROOSEVELT_01 Largemouth Bass 2008 15 0.753 0.510 1.110 1.110
NoAUID-FFPiyasL-SDDOH Walleye 2009 5 0.140 0.140 0.140 0.140
NoAUID-FFPiyasL-SDDOH Yellow Perch 2009 5 0.040 0.040 0.040 0.040
SD-BS-L-HERMAN_01 Black Bullhead 2009 5 0.050 0.050 0.050 0.050
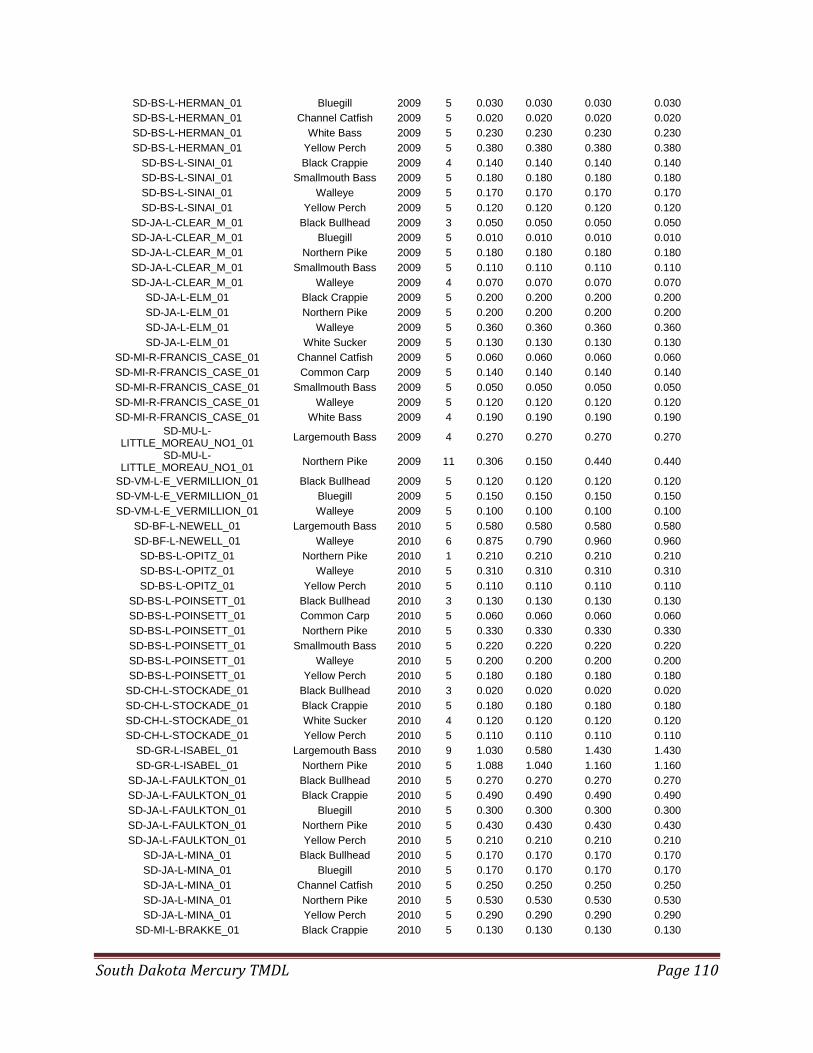
South Dakota Mercury TMDL Page 110
SD-BS-L-HERMAN_01 Bluegill 2009 5 0.030 0.030 0.030 0.030
SD-BS-L-HERMAN_01 Channel Catfish 2009 5 0.020 0.020 0.020 0.020
SD-BS-L-HERMAN_01 White Bass 2009 5 0.230 0.230 0.230 0.230
SD-BS-L-HERMAN_01 Yellow Perch 2009 5 0.380 0.380 0.380 0.380
SD-BS-L-SINAI_01 Black Crappie 2009 4 0.140 0.140 0.140 0.140
SD-BS-L-SINAI_01 Smallmouth Bass 2009 5 0.180 0.180 0.180 0.180
SD-BS-L-SINAI_01 Walleye 2009 5 0.170 0.170 0.170 0.170
SD-BS-L-SINAI_01 Yellow Perch 2009 5 0.120 0.120 0.120 0.120
SD-JA-L-CLEAR_M_01 Black Bullhead 2009 3 0.050 0.050 0.050 0.050
SD-JA-L-CLEAR_M_01 Bluegill 2009 5 0.010 0.010 0.010 0.010
SD-JA-L-CLEAR_M_01 Northern Pike 2009 5 0.180 0.180 0.180 0.180
SD-JA-L-CLEAR_M_01 Smallmouth Bass 2009 5 0.110 0.110 0.110 0.110
SD-JA-L-CLEAR_M_01 Walleye 2009 4 0.070 0.070 0.070 0.070
SD-JA-L-ELM_01 Black Crappie 2009 5 0.200 0.200 0.200 0.200
SD-JA-L-ELM_01 Northern Pike 2009 5 0.200 0.200 0.200 0.200
SD-JA-L-ELM_01 Walleye 2009 5 0.360 0.360 0.360 0.360
SD-JA-L-ELM_01 White Sucker 2009 5 0.130 0.130 0.130 0.130
SD-MI-R-FRANCIS_CASE_01 Channel Catfish 2009 5 0.060 0.060 0.060 0.060
SD-MI-R-FRANCIS_CASE_01 Common Carp 2009 5 0.140 0.140 0.140 0.140
SD-MI-R-FRANCIS_CASE_01 Smallmouth Bass 2009 5 0.050 0.050 0.050 0.050
SD-MI-R-FRANCIS_CASE_01 Walleye 2009 5 0.120 0.120 0.120 0.120
SD-MI-R-FRANCIS_CASE_01 White Bass 2009 4 0.190 0.190 0.190 0.190
SD-MU-L-LITTLE_MOREAU_NO1_01
Largemouth Bass 2009 4 0.270 0.270 0.270 0.270
SD-MU-L-LITTLE_MOREAU_NO1_01
Northern Pike 2009 11 0.306 0.150 0.440 0.440
SD-VM-L-E_VERMILLION_01 Black Bullhead 2009 5 0.120 0.120 0.120 0.120
SD-VM-L-E_VERMILLION_01 Bluegill 2009 5 0.150 0.150 0.150 0.150
SD-VM-L-E_VERMILLION_01 Walleye 2009 5 0.100 0.100 0.100 0.100
SD-BF-L-NEWELL_01 Largemouth Bass 2010 5 0.580 0.580 0.580 0.580
SD-BF-L-NEWELL_01 Walleye 2010 6 0.875 0.790 0.960 0.960
SD-BS-L-OPITZ_01 Northern Pike 2010 1 0.210 0.210 0.210 0.210
SD-BS-L-OPITZ_01 Walleye 2010 5 0.310 0.310 0.310 0.310
SD-BS-L-OPITZ_01 Yellow Perch 2010 5 0.110 0.110 0.110 0.110
SD-BS-L-POINSETT_01 Black Bullhead 2010 3 0.130 0.130 0.130 0.130
SD-BS-L-POINSETT_01 Common Carp 2010 5 0.060 0.060 0.060 0.060
SD-BS-L-POINSETT_01 Northern Pike 2010 5 0.330 0.330 0.330 0.330
SD-BS-L-POINSETT_01 Smallmouth Bass 2010 5 0.220 0.220 0.220 0.220
SD-BS-L-POINSETT_01 Walleye 2010 5 0.200 0.200 0.200 0.200
SD-BS-L-POINSETT_01 Yellow Perch 2010 5 0.180 0.180 0.180 0.180
SD-CH-L-STOCKADE_01 Black Bullhead 2010 3 0.020 0.020 0.020 0.020
SD-CH-L-STOCKADE_01 Black Crappie 2010 5 0.180 0.180 0.180 0.180
SD-CH-L-STOCKADE_01 White Sucker 2010 4 0.120 0.120 0.120 0.120
SD-CH-L-STOCKADE_01 Yellow Perch 2010 5 0.110 0.110 0.110 0.110
SD-GR-L-ISABEL_01 Largemouth Bass 2010 9 1.030 0.580 1.430 1.430
SD-GR-L-ISABEL_01 Northern Pike 2010 5 1.088 1.040 1.160 1.160
SD-JA-L-FAULKTON_01 Black Bullhead 2010 5 0.270 0.270 0.270 0.270
SD-JA-L-FAULKTON_01 Black Crappie 2010 5 0.490 0.490 0.490 0.490
SD-JA-L-FAULKTON_01 Bluegill 2010 5 0.300 0.300 0.300 0.300
SD-JA-L-FAULKTON_01 Northern Pike 2010 5 0.430 0.430 0.430 0.430
SD-JA-L-FAULKTON_01 Yellow Perch 2010 5 0.210 0.210 0.210 0.210
SD-JA-L-MINA_01 Black Bullhead 2010 5 0.170 0.170 0.170 0.170
SD-JA-L-MINA_01 Bluegill 2010 5 0.170 0.170 0.170 0.170
SD-JA-L-MINA_01 Channel Catfish 2010 5 0.250 0.250 0.250 0.250
SD-JA-L-MINA_01 Northern Pike 2010 5 0.530 0.530 0.530 0.530
SD-JA-L-MINA_01 Yellow Perch 2010 5 0.290 0.290 0.290 0.290
SD-MI-L-BRAKKE_01 Black Crappie 2010 5 0.130 0.130 0.130 0.130
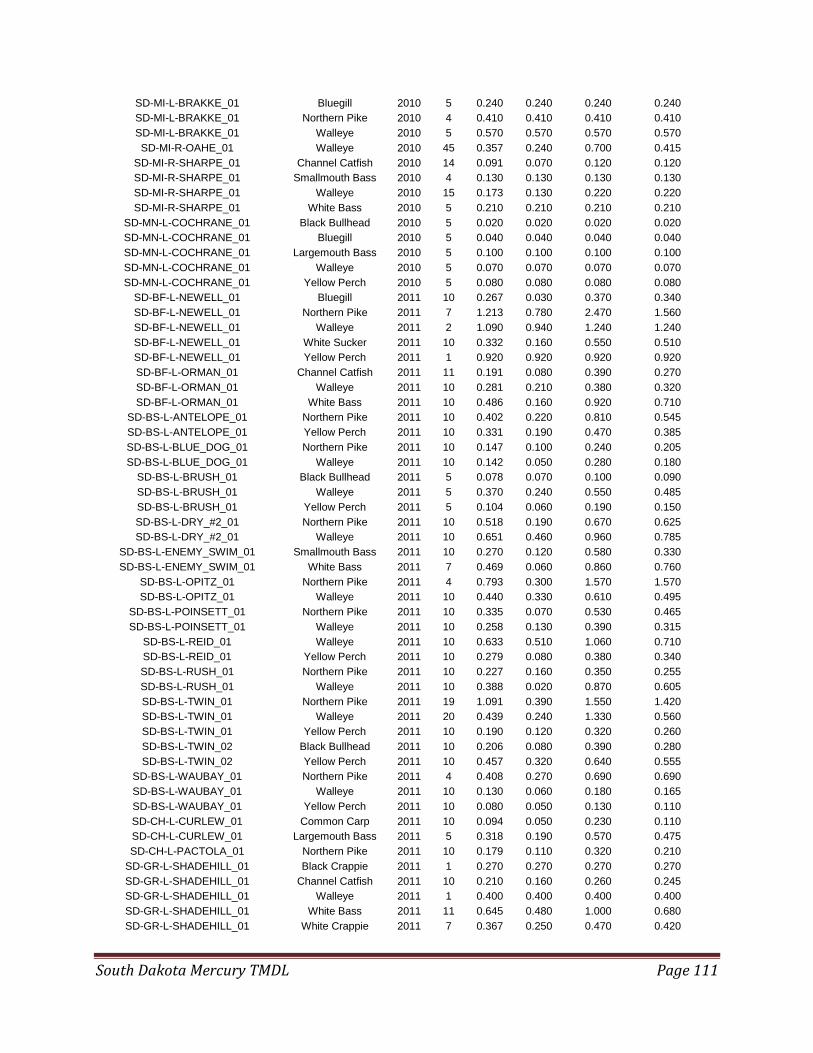
South Dakota Mercury TMDL Page 111
SD-MI-L-BRAKKE_01 Bluegill 2010 5 0.240 0.240 0.240 0.240
SD-MI-L-BRAKKE_01 Northern Pike 2010 4 0.410 0.410 0.410 0.410
SD-MI-L-BRAKKE_01 Walleye 2010 5 0.570 0.570 0.570 0.570
SD-MI-R-OAHE_01 Walleye 2010 45 0.357 0.240 0.700 0.415
SD-MI-R-SHARPE_01 Channel Catfish 2010 14 0.091 0.070 0.120 0.120
SD-MI-R-SHARPE_01 Smallmouth Bass 2010 4 0.130 0.130 0.130 0.130
SD-MI-R-SHARPE_01 Walleye 2010 15 0.173 0.130 0.220 0.220
SD-MI-R-SHARPE_01 White Bass 2010 5 0.210 0.210 0.210 0.210
SD-MN-L-COCHRANE_01 Black Bullhead 2010 5 0.020 0.020 0.020 0.020
SD-MN-L-COCHRANE_01 Bluegill 2010 5 0.040 0.040 0.040 0.040
SD-MN-L-COCHRANE_01 Largemouth Bass 2010 5 0.100 0.100 0.100 0.100
SD-MN-L-COCHRANE_01 Walleye 2010 5 0.070 0.070 0.070 0.070
SD-MN-L-COCHRANE_01 Yellow Perch 2010 5 0.080 0.080 0.080 0.080
SD-BF-L-NEWELL_01 Bluegill 2011 10 0.267 0.030 0.370 0.340
SD-BF-L-NEWELL_01 Northern Pike 2011 7 1.213 0.780 2.470 1.560
SD-BF-L-NEWELL_01 Walleye 2011 2 1.090 0.940 1.240 1.240
SD-BF-L-NEWELL_01 White Sucker 2011 10 0.332 0.160 0.550 0.510
SD-BF-L-NEWELL_01 Yellow Perch 2011 1 0.920 0.920 0.920 0.920
SD-BF-L-ORMAN_01 Channel Catfish 2011 11 0.191 0.080 0.390 0.270
SD-BF-L-ORMAN_01 Walleye 2011 10 0.281 0.210 0.380 0.320
SD-BF-L-ORMAN_01 White Bass 2011 10 0.486 0.160 0.920 0.710
SD-BS-L-ANTELOPE_01 Northern Pike 2011 10 0.402 0.220 0.810 0.545
SD-BS-L-ANTELOPE_01 Yellow Perch 2011 10 0.331 0.190 0.470 0.385
SD-BS-L-BLUE_DOG_01 Northern Pike 2011 10 0.147 0.100 0.240 0.205
SD-BS-L-BLUE_DOG_01 Walleye 2011 10 0.142 0.050 0.280 0.180
SD-BS-L-BRUSH_01 Black Bullhead 2011 5 0.078 0.070 0.100 0.090
SD-BS-L-BRUSH_01 Walleye 2011 5 0.370 0.240 0.550 0.485
SD-BS-L-BRUSH_01 Yellow Perch 2011 5 0.104 0.060 0.190 0.150
SD-BS-L-DRY_#2_01 Northern Pike 2011 10 0.518 0.190 0.670 0.625
SD-BS-L-DRY_#2_01 Walleye 2011 10 0.651 0.460 0.960 0.785
SD-BS-L-ENEMY_SWIM_01 Smallmouth Bass 2011 10 0.270 0.120 0.580 0.330
SD-BS-L-ENEMY_SWIM_01 White Bass 2011 7 0.469 0.060 0.860 0.760
SD-BS-L-OPITZ_01 Northern Pike 2011 4 0.793 0.300 1.570 1.570
SD-BS-L-OPITZ_01 Walleye 2011 10 0.440 0.330 0.610 0.495
SD-BS-L-POINSETT_01 Northern Pike 2011 10 0.335 0.070 0.530 0.465
SD-BS-L-POINSETT_01 Walleye 2011 10 0.258 0.130 0.390 0.315
SD-BS-L-REID_01 Walleye 2011 10 0.633 0.510 1.060 0.710
SD-BS-L-REID_01 Yellow Perch 2011 10 0.279 0.080 0.380 0.340
SD-BS-L-RUSH_01 Northern Pike 2011 10 0.227 0.160 0.350 0.255
SD-BS-L-RUSH_01 Walleye 2011 10 0.388 0.020 0.870 0.605
SD-BS-L-TWIN_01 Northern Pike 2011 19 1.091 0.390 1.550 1.420
SD-BS-L-TWIN_01 Walleye 2011 20 0.439 0.240 1.330 0.560
SD-BS-L-TWIN_01 Yellow Perch 2011 10 0.190 0.120 0.320 0.260
SD-BS-L-TWIN_02 Black Bullhead 2011 10 0.206 0.080 0.390 0.280
SD-BS-L-TWIN_02 Yellow Perch 2011 10 0.457 0.320 0.640 0.555
SD-BS-L-WAUBAY_01 Northern Pike 2011 4 0.408 0.270 0.690 0.690
SD-BS-L-WAUBAY_01 Walleye 2011 10 0.130 0.060 0.180 0.165
SD-BS-L-WAUBAY_01 Yellow Perch 2011 10 0.080 0.050 0.130 0.110
SD-CH-L-CURLEW_01 Common Carp 2011 10 0.094 0.050 0.230 0.110
SD-CH-L-CURLEW_01 Largemouth Bass 2011 5 0.318 0.190 0.570 0.475
SD-CH-L-PACTOLA_01 Northern Pike 2011 10 0.179 0.110 0.320 0.210
SD-GR-L-SHADEHILL_01 Black Crappie 2011 1 0.270 0.270 0.270 0.270
SD-GR-L-SHADEHILL_01 Channel Catfish 2011 10 0.210 0.160 0.260 0.245
SD-GR-L-SHADEHILL_01 Walleye 2011 1 0.400 0.400 0.400 0.400
SD-GR-L-SHADEHILL_01 White Bass 2011 11 0.645 0.480 1.000 0.680
SD-GR-L-SHADEHILL_01 White Crappie 2011 7 0.367 0.250 0.470 0.420
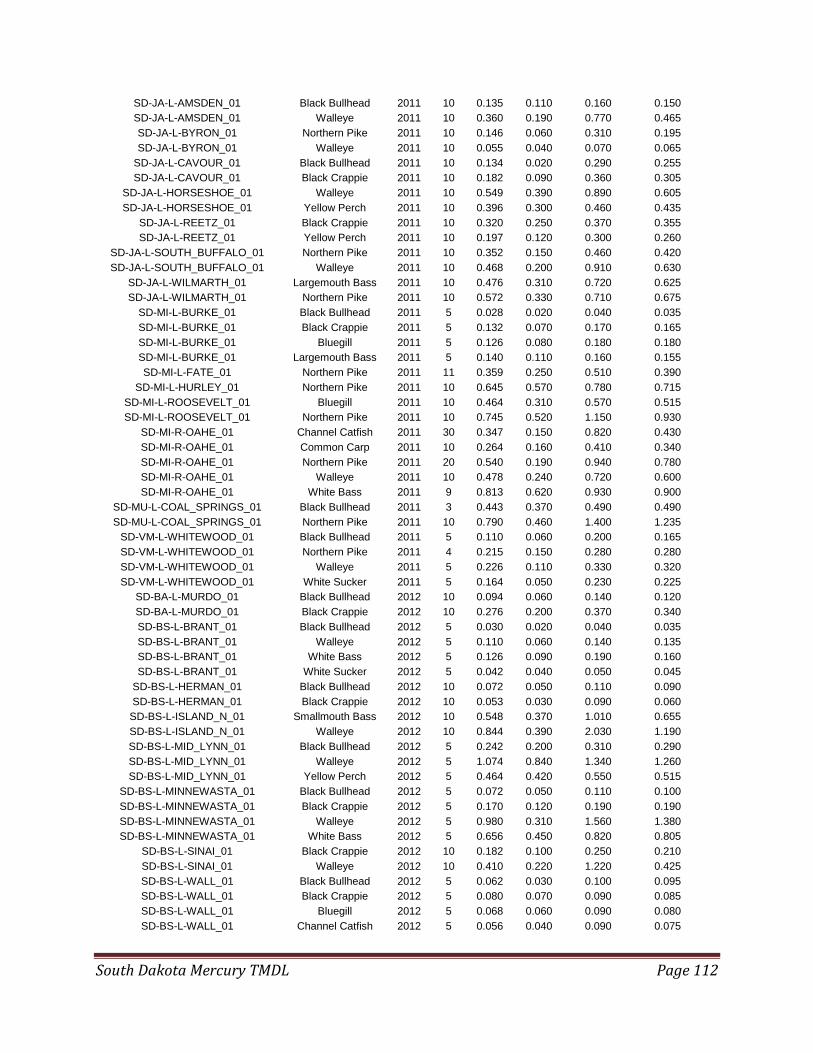
South Dakota Mercury TMDL Page 112
SD-JA-L-AMSDEN_01 Black Bullhead 2011 10 0.135 0.110 0.160 0.150
SD-JA-L-AMSDEN_01 Walleye 2011 10 0.360 0.190 0.770 0.465
SD-JA-L-BYRON_01 Northern Pike 2011 10 0.146 0.060 0.310 0.195
SD-JA-L-BYRON_01 Walleye 2011 10 0.055 0.040 0.070 0.065
SD-JA-L-CAVOUR_01 Black Bullhead 2011 10 0.134 0.020 0.290 0.255
SD-JA-L-CAVOUR_01 Black Crappie 2011 10 0.182 0.090 0.360 0.305
SD-JA-L-HORSESHOE_01 Walleye 2011 10 0.549 0.390 0.890 0.605
SD-JA-L-HORSESHOE_01 Yellow Perch 2011 10 0.396 0.300 0.460 0.435
SD-JA-L-REETZ_01 Black Crappie 2011 10 0.320 0.250 0.370 0.355
SD-JA-L-REETZ_01 Yellow Perch 2011 10 0.197 0.120 0.300 0.260
SD-JA-L-SOUTH_BUFFALO_01 Northern Pike 2011 10 0.352 0.150 0.460 0.420
SD-JA-L-SOUTH_BUFFALO_01 Walleye 2011 10 0.468 0.200 0.910 0.630
SD-JA-L-WILMARTH_01 Largemouth Bass 2011 10 0.476 0.310 0.720 0.625
SD-JA-L-WILMARTH_01 Northern Pike 2011 10 0.572 0.330 0.710 0.675
SD-MI-L-BURKE_01 Black Bullhead 2011 5 0.028 0.020 0.040 0.035
SD-MI-L-BURKE_01 Black Crappie 2011 5 0.132 0.070 0.170 0.165
SD-MI-L-BURKE_01 Bluegill 2011 5 0.126 0.080 0.180 0.180
SD-MI-L-BURKE_01 Largemouth Bass 2011 5 0.140 0.110 0.160 0.155
SD-MI-L-FATE_01 Northern Pike 2011 11 0.359 0.250 0.510 0.390
SD-MI-L-HURLEY_01 Northern Pike 2011 10 0.645 0.570 0.780 0.715
SD-MI-L-ROOSEVELT_01 Bluegill 2011 10 0.464 0.310 0.570 0.515
SD-MI-L-ROOSEVELT_01 Northern Pike 2011 10 0.745 0.520 1.150 0.930
SD-MI-R-OAHE_01 Channel Catfish 2011 30 0.347 0.150 0.820 0.430
SD-MI-R-OAHE_01 Common Carp 2011 10 0.264 0.160 0.410 0.340
SD-MI-R-OAHE_01 Northern Pike 2011 20 0.540 0.190 0.940 0.780
SD-MI-R-OAHE_01 Walleye 2011 10 0.478 0.240 0.720 0.600
SD-MI-R-OAHE_01 White Bass 2011 9 0.813 0.620 0.930 0.900
SD-MU-L-COAL_SPRINGS_01 Black Bullhead 2011 3 0.443 0.370 0.490 0.490
SD-MU-L-COAL_SPRINGS_01 Northern Pike 2011 10 0.790 0.460 1.400 1.235
SD-VM-L-WHITEWOOD_01 Black Bullhead 2011 5 0.110 0.060 0.200 0.165
SD-VM-L-WHITEWOOD_01 Northern Pike 2011 4 0.215 0.150 0.280 0.280
SD-VM-L-WHITEWOOD_01 Walleye 2011 5 0.226 0.110 0.330 0.320
SD-VM-L-WHITEWOOD_01 White Sucker 2011 5 0.164 0.050 0.230 0.225
SD-BA-L-MURDO_01 Black Bullhead 2012 10 0.094 0.060 0.140 0.120
SD-BA-L-MURDO_01 Black Crappie 2012 10 0.276 0.200 0.370 0.340
SD-BS-L-BRANT_01 Black Bullhead 2012 5 0.030 0.020 0.040 0.035
SD-BS-L-BRANT_01 Walleye 2012 5 0.110 0.060 0.140 0.135
SD-BS-L-BRANT_01 White Bass 2012 5 0.126 0.090 0.190 0.160
SD-BS-L-BRANT_01 White Sucker 2012 5 0.042 0.040 0.050 0.045
SD-BS-L-HERMAN_01 Black Bullhead 2012 10 0.072 0.050 0.110 0.090
SD-BS-L-HERMAN_01 Black Crappie 2012 10 0.053 0.030 0.090 0.060
SD-BS-L-ISLAND_N_01 Smallmouth Bass 2012 10 0.548 0.370 1.010 0.655
SD-BS-L-ISLAND_N_01 Walleye 2012 10 0.844 0.390 2.030 1.190
SD-BS-L-MID_LYNN_01 Black Bullhead 2012 5 0.242 0.200 0.310 0.290
SD-BS-L-MID_LYNN_01 Walleye 2012 5 1.074 0.840 1.340 1.260
SD-BS-L-MID_LYNN_01 Yellow Perch 2012 5 0.464 0.420 0.550 0.515
SD-BS-L-MINNEWASTA_01 Black Bullhead 2012 5 0.072 0.050 0.110 0.100
SD-BS-L-MINNEWASTA_01 Black Crappie 2012 5 0.170 0.120 0.190 0.190
SD-BS-L-MINNEWASTA_01 Walleye 2012 5 0.980 0.310 1.560 1.380
SD-BS-L-MINNEWASTA_01 White Bass 2012 5 0.656 0.450 0.820 0.805
SD-BS-L-SINAI_01 Black Crappie 2012 10 0.182 0.100 0.250 0.210
SD-BS-L-SINAI_01 Walleye 2012 10 0.410 0.220 1.220 0.425
SD-BS-L-WALL_01 Black Bullhead 2012 5 0.062 0.030 0.100 0.095
SD-BS-L-WALL_01 Black Crappie 2012 5 0.080 0.070 0.090 0.085
SD-BS-L-WALL_01 Bluegill 2012 5 0.068 0.060 0.090 0.080
SD-BS-L-WALL_01 Channel Catfish 2012 5 0.056 0.040 0.090 0.075
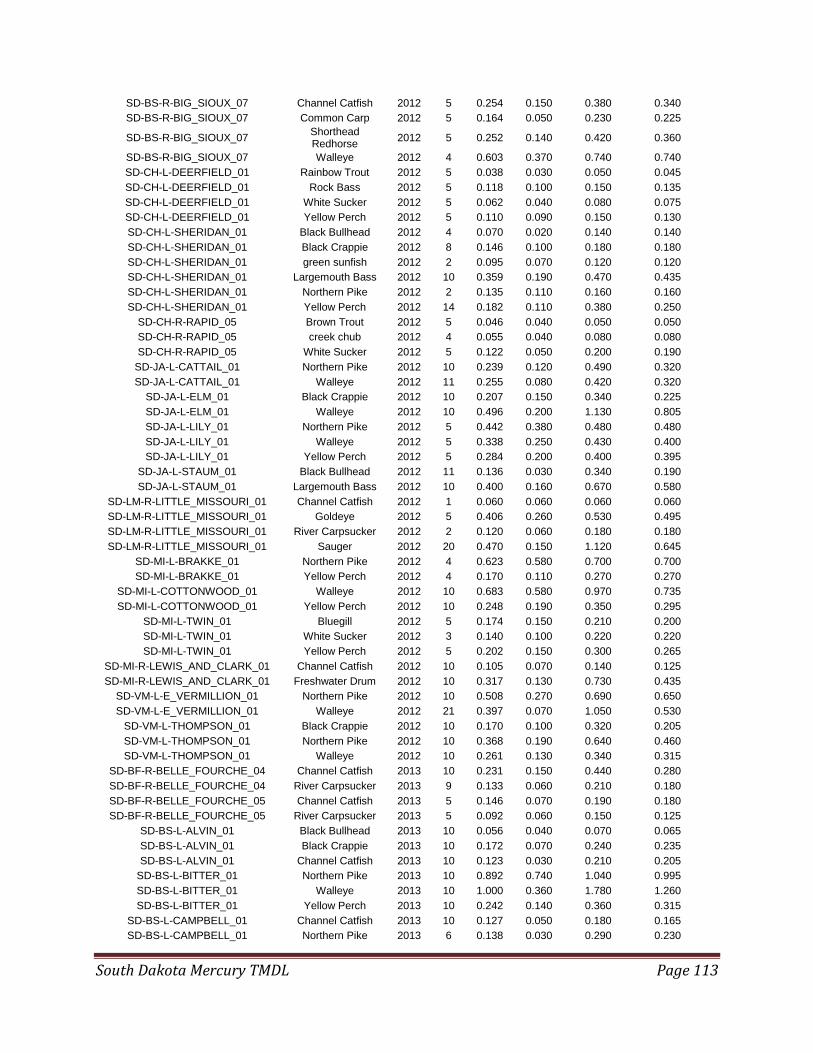
South Dakota Mercury TMDL Page 113
SD-BS-R-BIG_SIOUX_07 Channel Catfish 2012 5 0.254 0.150 0.380 0.340
SD-BS-R-BIG_SIOUX_07 Common Carp 2012 5 0.164 0.050 0.230 0.225
SD-BS-R-BIG_SIOUX_07 Shorthead Redhorse
2012 5 0.252 0.140 0.420 0.360
SD-BS-R-BIG_SIOUX_07 Walleye 2012 4 0.603 0.370 0.740 0.740
SD-CH-L-DEERFIELD_01 Rainbow Trout 2012 5 0.038 0.030 0.050 0.045
SD-CH-L-DEERFIELD_01 Rock Bass 2012 5 0.118 0.100 0.150 0.135
SD-CH-L-DEERFIELD_01 White Sucker 2012 5 0.062 0.040 0.080 0.075
SD-CH-L-DEERFIELD_01 Yellow Perch 2012 5 0.110 0.090 0.150 0.130
SD-CH-L-SHERIDAN_01 Black Bullhead 2012 4 0.070 0.020 0.140 0.140
SD-CH-L-SHERIDAN_01 Black Crappie 2012 8 0.146 0.100 0.180 0.180
SD-CH-L-SHERIDAN_01 green sunfish 2012 2 0.095 0.070 0.120 0.120
SD-CH-L-SHERIDAN_01 Largemouth Bass 2012 10 0.359 0.190 0.470 0.435
SD-CH-L-SHERIDAN_01 Northern Pike 2012 2 0.135 0.110 0.160 0.160
SD-CH-L-SHERIDAN_01 Yellow Perch 2012 14 0.182 0.110 0.380 0.250
SD-CH-R-RAPID_05 Brown Trout 2012 5 0.046 0.040 0.050 0.050
SD-CH-R-RAPID_05 creek chub 2012 4 0.055 0.040 0.080 0.080
SD-CH-R-RAPID_05 White Sucker 2012 5 0.122 0.050 0.200 0.190
SD-JA-L-CATTAIL_01 Northern Pike 2012 10 0.239 0.120 0.490 0.320
SD-JA-L-CATTAIL_01 Walleye 2012 11 0.255 0.080 0.420 0.320
SD-JA-L-ELM_01 Black Crappie 2012 10 0.207 0.150 0.340 0.225
SD-JA-L-ELM_01 Walleye 2012 10 0.496 0.200 1.130 0.805
SD-JA-L-LILY_01 Northern Pike 2012 5 0.442 0.380 0.480 0.480
SD-JA-L-LILY_01 Walleye 2012 5 0.338 0.250 0.430 0.400
SD-JA-L-LILY_01 Yellow Perch 2012 5 0.284 0.200 0.400 0.395
SD-JA-L-STAUM_01 Black Bullhead 2012 11 0.136 0.030 0.340 0.190
SD-JA-L-STAUM_01 Largemouth Bass 2012 10 0.400 0.160 0.670 0.580
SD-LM-R-LITTLE_MISSOURI_01 Channel Catfish 2012 1 0.060 0.060 0.060 0.060
SD-LM-R-LITTLE_MISSOURI_01 Goldeye 2012 5 0.406 0.260 0.530 0.495
SD-LM-R-LITTLE_MISSOURI_01 River Carpsucker 2012 2 0.120 0.060 0.180 0.180
SD-LM-R-LITTLE_MISSOURI_01 Sauger 2012 20 0.470 0.150 1.120 0.645
SD-MI-L-BRAKKE_01 Northern Pike 2012 4 0.623 0.580 0.700 0.700
SD-MI-L-BRAKKE_01 Yellow Perch 2012 4 0.170 0.110 0.270 0.270
SD-MI-L-COTTONWOOD_01 Walleye 2012 10 0.683 0.580 0.970 0.735
SD-MI-L-COTTONWOOD_01 Yellow Perch 2012 10 0.248 0.190 0.350 0.295
SD-MI-L-TWIN_01 Bluegill 2012 5 0.174 0.150 0.210 0.200
SD-MI-L-TWIN_01 White Sucker 2012 3 0.140 0.100 0.220 0.220
SD-MI-L-TWIN_01 Yellow Perch 2012 5 0.202 0.150 0.300 0.265
SD-MI-R-LEWIS_AND_CLARK_01 Channel Catfish 2012 10 0.105 0.070 0.140 0.125
SD-MI-R-LEWIS_AND_CLARK_01 Freshwater Drum 2012 10 0.317 0.130 0.730 0.435
SD-VM-L-E_VERMILLION_01 Northern Pike 2012 10 0.508 0.270 0.690 0.650
SD-VM-L-E_VERMILLION_01 Walleye 2012 21 0.397 0.070 1.050 0.530
SD-VM-L-THOMPSON_01 Black Crappie 2012 10 0.170 0.100 0.320 0.205
SD-VM-L-THOMPSON_01 Northern Pike 2012 10 0.368 0.190 0.640 0.460
SD-VM-L-THOMPSON_01 Walleye 2012 10 0.261 0.130 0.340 0.315
SD-BF-R-BELLE_FOURCHE_04 Channel Catfish 2013 10 0.231 0.150 0.440 0.280
SD-BF-R-BELLE_FOURCHE_04 River Carpsucker 2013 9 0.133 0.060 0.210 0.180
SD-BF-R-BELLE_FOURCHE_05 Channel Catfish 2013 5 0.146 0.070 0.190 0.180
SD-BF-R-BELLE_FOURCHE_05 River Carpsucker 2013 5 0.092 0.060 0.150 0.125
SD-BS-L-ALVIN_01 Black Bullhead 2013 10 0.056 0.040 0.070 0.065
SD-BS-L-ALVIN_01 Black Crappie 2013 10 0.172 0.070 0.240 0.235
SD-BS-L-ALVIN_01 Channel Catfish 2013 10 0.123 0.030 0.210 0.205
SD-BS-L-BITTER_01 Northern Pike 2013 10 0.892 0.740 1.040 0.995
SD-BS-L-BITTER_01 Walleye 2013 10 1.000 0.360 1.780 1.260
SD-BS-L-BITTER_01 Yellow Perch 2013 10 0.242 0.140 0.360 0.315
SD-BS-L-CAMPBELL_01 Channel Catfish 2013 10 0.127 0.050 0.180 0.165
SD-BS-L-CAMPBELL_01 Northern Pike 2013 6 0.138 0.030 0.290 0.230

South Dakota Mercury TMDL Page 114
SD-BS-L-CAMPBELL_01 White Bass 2013 10 0.137 0.110 0.230 0.155
SD-BS-L-CLEAR_D_01 Black Bullhead 2013 15 0.040 0.030 0.090 0.040
SD-BS-L-CLEAR_D_01 Walleye 2013 15 0.183 0.080 0.460 0.215
SD-BS-L-CLEAR_D_01 Yellow Perch 2013 15 0.055 0.030 0.090 0.070
SD-BS-L-DRY_01 Northern Pike 2013 10 0.272 0.070 0.380 0.325
SD-BS-L-DRY_01 Walleye 2013 10 0.137 0.070 0.240 0.195
SD-BS-L-DRY_01 Yellow Perch 2013 10 0.037 0.020 0.070 0.060
SD-BS-L-GOLDSMITH_01 Black Bullhead 2013 17 0.053 0.020 0.160 0.060
SD-BS-L-GOLDSMITH_01 Walleye 2013 25 0.189 0.050 0.650 0.300
SD-BS-L-GOLDSMITH_01 White Bass 2013 19 0.441 0.180 0.540 0.500
SD-BS-L-GOOSE_01 Black Bullhead 2013 16 0.122 0.070 0.190 0.160
SD-BS-L-GOOSE_01 Walleye 2013 18 0.452 0.220 0.700 0.620
SD-BS-L-GOOSE_01 Yellow Perch 2013 15 0.147 0.080 0.270 0.175
SD-BS-L-LARDY_01 Northern Pike 2013 15 0.483 0.330 0.960 0.550
SD-BS-L-LARDY_01 Walleye 2013 15 0.587 0.210 1.050 0.800
SD-BS-L-LARDY_01 Yellow Perch 2013 15 0.091 0.050 0.190 0.110
SD-BS-L-LONG_COD_01 Walleye 2013 15 0.713 0.180 1.110 0.970
SD-BS-L-LONG_COD_01 Yellow Perch 2013 15 0.240 0.130 0.390 0.340
SD-BS-L-MID_LYNN_01 Black Bullhead 2013 10 0.060 0.040 0.090 0.080
SD-BS-L-MID_LYNN_01 Walleye 2013 10 0.906 0.660 1.450 1.095
SD-BS-L-MID_LYNN_01 Yellow Perch 2013 10 0.430 0.190 0.720 0.590
SD-BS-L-MINNEWASTA_01 Northern Pike 2013 11 0.418 0.270 0.940 0.410
SD-BS-L-MINNEWASTA_01 Walleye 2013 9 0.312 0.220 0.600 0.320
SD-BS-L-SWAN_01 Northern Pike 2013 10 0.572 0.400 1.040 0.635
SD-BS-L-SWAN_01 Walleye 2013 10 0.711 0.440 1.150 1.010
SD-BS-L-SWAN_01 Yellow Perch 2013 9 0.267 0.150 0.340 0.320
SD-BS-L-W_OAKWOOD_01 Northern Pike 2013 10 0.107 0.030 0.270 0.180
SD-BS-L-W_OAKWOOD_01 Walleye 2013 8 0.088 0.030 0.280 0.100
SD-BS-L-W_OAKWOOD_01 White Sucker 2013 10 0.031 0.020 0.080 0.040
SD-CH-R-CHEYENNE_0? Bluegill 2013 5 0.038 0.020 0.070 0.055
SD-CH-R-CHEYENNE_0? Channel Catfish 2013 5 0.078 0.070 0.080 0.080
SD-CH-R-CHEYENNE_0? Largemouth Bass 2013 5 0.086 0.040 0.130 0.125
SD-CH-R-CHEYENNE_05 Bluegill 2013 10 0.038 0.020 0.060 0.055
SD-CH-R-CHEYENNE_05 Channel Catfish 2013 4 0.193 0.040 0.540 0.540
SD-CH-R-CHEYENNE_05 Largemouth Bass 2013 8 0.063 0.020 0.150 0.130
SD-GR-L-PUDWELL_01 Black Bullhead 2013 1 1.080 1.080 1.080 1.080
SD-GR-L-PUDWELL_01 Black Crappie 2013 9 0.540 0.300 0.990 0.700
SD-GR-L-PUDWELL_01 Largemouth Bass 2013 20 0.666 0.470 0.940 0.775
SD-GR-L-PUDWELL_01 Northern Pike 2013 10 0.511 0.340 0.690 0.610
SD-JA-L-CARTHAGE_01 Black Bullhead 2013 10 0.076 0.060 0.120 0.085
SD-JA-L-CARTHAGE_01 Channel Catfish 2013 10 0.174 0.040 0.530 0.235
SD-JA-L-COTTONWOOD_01 Black Crappie 2013 15 0.200 0.090 0.430 0.275
SD-JA-L-COTTONWOOD_01 Northern Pike 2013 15 0.463 0.300 0.680 0.525
SD-JA-L-COTTONWOOD_01 Walleye 2013 15 0.248 0.120 0.490 0.400
SD-JA-L-HENRY_01 Black Crappie 2013 14 0.169 0.120 0.330 0.180
SD-JA-L-HENRY_01 Common Carp 2013 5 0.082 0.060 0.130 0.105
SD-JA-L-HENRY_01 Largemouth Bass 2013 14 0.324 0.240 0.470 0.410
SD-JA-L-LOUISE_01 Black Bullhead 2013 10 0.258 0.080 0.660 0.570
SD-JA-L-LOUISE_01 Largemouth Bass 2013 20 0.599 0.420 0.800 0.715
SD-JA-L-LOUISE_01 Northern Pike 2013 10 0.350 0.260 0.470 0.420
SD-JA-L-RAVINE_01 Channel Catfish 2013 15 0.466 0.330 0.700 0.540
SD-JA-L-RAVINE_01 Common Carp 2013 15 0.147 0.040 0.300 0.205
SD-JA-L-RAVINE_01 Northern Pike 2013 9 0.310 0.150 0.400 0.400
SD-JA-R-JAMES_08 Channel Catfish 2013 12 0.407 0.150 1.130 0.590
SD-JA-R-JAMES_08 Northern Pike 2013 9 0.579 0.190 0.990 0.900
SD-JA-R-JAMES_08 Walleye 2013 10 0.519 0.140 0.890 0.720

South Dakota Mercury TMDL Page 115
SD-MN-L-ALICE_01 Northern Pike 2013 10 0.250 0.170 0.370 0.295
SD-MN-L-ALICE_01 Walleye 2013 10 0.341 0.240 0.830 0.360
SD-MN-L-ALICE_01 Yellow Perch 2013 10 0.159 0.030 0.250 0.245
SD-MU-L-LITTLE_MOREAU_NO1_01
Bluegill 2013 10 0.184 0.130 0.230 0.225
SD-MU-L-LITTLE_MOREAU_NO1_01
Northern Pike 2013 11 0.578 0.240 0.840 0.780
NoAUID-FFWhitewoodCr-SDDOH Brown Trout 2014 10 0.077 0.060 0.100 0.085
SD-BA-L-HAYES_01 Black Bullhead 2014 10 0.109 0.020 0.180 0.165
SD-BA-L-HAYES_01 Bluegill 2014 10 0.062 0.030 0.090 0.080
SD-BA-L-HAYES_01 Northern Pike 2014 7 0.273 0.160 0.410 0.370
SD-BA-L-WAGGONER_01 Bluegill 2014 10 0.065 0.020 0.140 0.110
SD-BA-L-WAGGONER_01 Largemouth Bass 2014 10 0.185 0.110 0.400 0.225
SD-BA-L-WAGGONER_01 Northern Pike 2014 4 0.108 0.050 0.190 0.190
SD-BS-L-ALBERT_01 black Bullhead 2014 15 0.099 0.040 0.130 0.125
SD-BS-L-ALBERT_01 Northern Pike 2014 15 0.378 0.170 0.690 0.475
SD-BS-L-ALBERT_01 Walleye 2014 13 0.360 0.130 0.650 0.430
SD-BS-L-CLEAR_H_01 Black Bullhead 2014 15 0.038 0.020 0.060 0.050
SD-BS-L-CLEAR_H_01 Walleye 2014 15 0.211 0.110 0.440 0.355
SD-BS-L-CLEAR_H_01 Yellow Perch 2014 15 0.044 0.030 0.070 0.050
SD-BS-L-KAMPESKA_01 Black Bullhead 2014 10 0.099 0.050 0.180 0.145
SD-BS-L-KAMPESKA_01 Walleye 2014 10 0.187 0.110 0.370 0.275
SD-BS-L-KAMPESKA_01 White Bass 2014 10 0.369 0.190 0.430 0.425
SD-BS-L-POINSETT_01 Black Bullhead 2014 15 0.099 0.030 0.160 0.135
SD-BS-L-POINSETT_01 Smallmouth Bass 2014 15 0.351 0.250 0.510 0.420
SD-BS-L-POINSETT_01 Walleye 2014 15 0.405 0.260 0.700 0.525
SD-BS-L-WAUBAY_01 Northern Pike 2014 15 0.403 0.150 0.740 0.530
SD-BS-L-WAUBAY_01 Walleye 2014 15 0.214 0.060 0.630 0.320
SD-BS-L-WAUBAY_01 Yellow Perch 2014 15 0.036 0.020 0.080 0.060
SD-CH-L-ANGOSTURA_01 Channel Catfish 2014 10 0.105 0.060 0.230 0.130
SD-CH-L-ANGOSTURA_01 Smallmouth Bass 2014 10 0.089 0.070 0.110 0.100
SD-CH-L-ANGOSTURA_01 Walleye 2014 10 0.072 0.040 0.130 0.100
SD-JA-L-HANSON_01 Black Crappie 2014 15 0.243 0.070 0.680 0.370
SD-JA-L-HANSON_01 Common Carp 2014 15 0.123 0.020 0.360 0.195
SD-JA-L-HANSON_01 Largemouth Bass 2014 11 0.446 0.130 0.760 0.650
SD-JA-L-HAZELDON_01 Black Bullhead 2014 20 0.055 0.020 0.190 0.060
SD-JA-L-HAZELDON_01 Walleye 2014 16 0.634 0.130 1.620 1.210
SD-JA-L-HAZELDON_01 Yellow Perch 2014 20 0.123 0.050 0.180 0.165
SD-JA-L-LYNN_01 Northern Pike 2014 5 0.828 0.740 0.940 0.920
SD-JA-L-LYNN_01 Walleye 2014 10 0.920 0.270 1.830 1.155
SD-JA-L-LYNN_01 Yellow Perch 2014 10 0.226 0.170 0.440 0.230
SD-JA-L-RICHMOND_01 Black Crappie 2014 10 0.184 0.100 0.340 0.255
SD-JA-L-RICHMOND_01 Bluegill 2014 10 0.270 0.100 0.400 0.370
SD-JA-L-RICHMOND_01 Walleye 2014 10 0.425 0.190 0.800 0.730
SD-MI-L-HIDDENWOOD_01 Black Bullhead 2014 24 0.085 0.030 0.160 0.120
SD-MI-L-HIDDENWOOD_01 White Sucker 2014 20 0.060 0.030 0.160 0.085
SD-MI-R-OAHE_01 Channel Catfish 2014 19 0.207 0.090 0.480 0.260
SD-MI-R-OAHE_01 Common Carp 2014 20 0.191 0.100 0.360 0.230
SD-MN-L-SUMMIT_01 Northern Pike 2014 20 0.381 0.280 0.540 0.440
SD-MN-L-SUMMIT_01 Walleye 2014 20 0.200 0.090 0.410 0.340
SD-MN-L-SUMMIT_01 Yellow Perch 2014 10 0.075 0.060 0.090 0.090
SD-VM-L-HENRY_01 Black Bullhead 2014 15 0.145 0.070 0.260 0.210
SD-VM-L-HENRY_01 Northern Pike 2014 15 0.435 0.150 0.990 0.645
SD-VM-L-HENRY_01 Walleye 2014 15 0.287 0.130 0.610 0.445
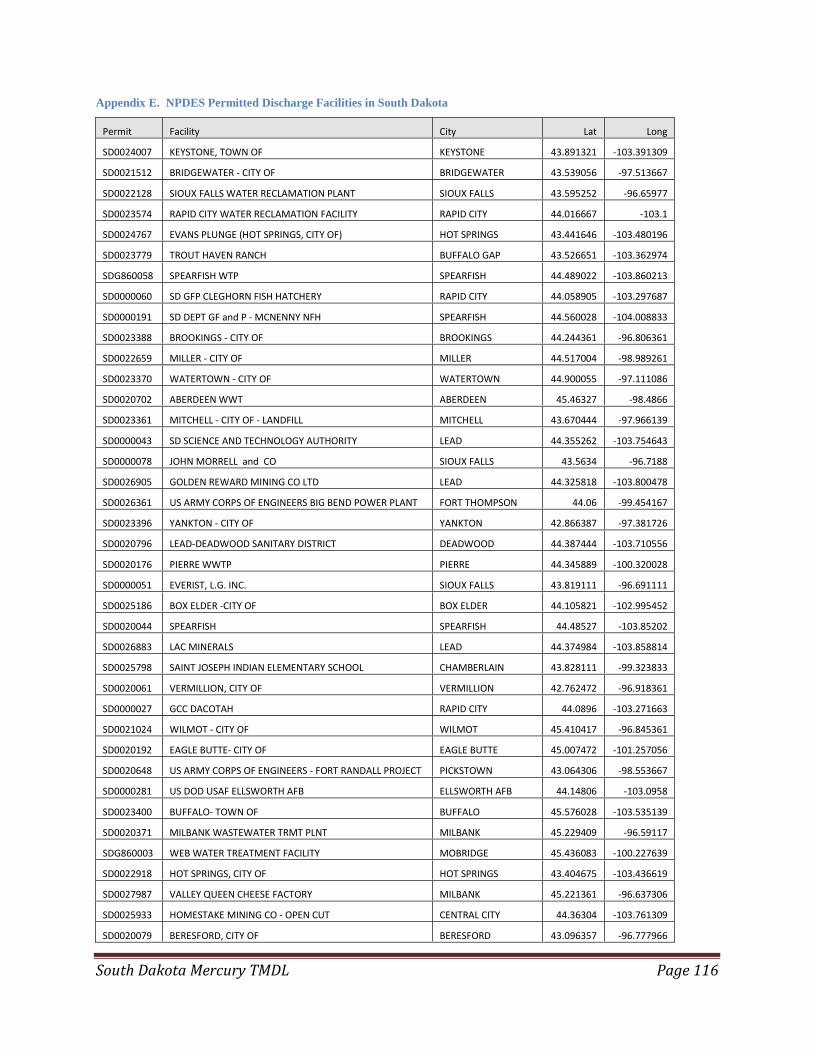
South Dakota Mercury TMDL Page 116
Appendix E. NPDES Permitted Discharge Facilities in South Dakota
Permit Facility City Lat Long
SD0024007 KEYSTONE, TOWN OF KEYSTONE 43.891321 -103.391309
SD0021512 BRIDGEWATER - CITY OF BRIDGEWATER 43.539056 -97.513667
SD0022128 SIOUX FALLS WATER RECLAMATION PLANT SIOUX FALLS 43.595252 -96.65977
SD0023574 RAPID CITY WATER RECLAMATION FACILITY RAPID CITY 44.016667 -103.1
SD0024767 EVANS PLUNGE (HOT SPRINGS, CITY OF) HOT SPRINGS 43.441646 -103.480196
SD0023779 TROUT HAVEN RANCH BUFFALO GAP 43.526651 -103.362974
SDG860058 SPEARFISH WTP SPEARFISH 44.489022 -103.860213
SD0000060 SD GFP CLEGHORN FISH HATCHERY RAPID CITY 44.058905 -103.297687
SD0000191 SD DEPT GF and P - MCNENNY NFH SPEARFISH 44.560028 -104.008833
SD0023388 BROOKINGS - CITY OF BROOKINGS 44.244361 -96.806361
SD0022659 MILLER - CITY OF MILLER 44.517004 -98.989261
SD0023370 WATERTOWN - CITY OF WATERTOWN 44.900055 -97.111086
SD0020702 ABERDEEN WWT ABERDEEN 45.46327 -98.4866
SD0023361 MITCHELL - CITY OF - LANDFILL MITCHELL 43.670444 -97.966139
SD0000043 SD SCIENCE AND TECHNOLOGY AUTHORITY LEAD 44.355262 -103.754643
SD0000078 JOHN MORRELL and CO SIOUX FALLS 43.5634 -96.7188
SD0026905 GOLDEN REWARD MINING CO LTD LEAD 44.325818 -103.800478
SD0026361 US ARMY CORPS OF ENGINEERS BIG BEND POWER PLANT FORT THOMPSON 44.06 -99.454167
SD0023396 YANKTON - CITY OF YANKTON 42.866387 -97.381726
SD0020796 LEAD-DEADWOOD SANITARY DISTRICT DEADWOOD 44.387444 -103.710556
SD0020176 PIERRE WWTP PIERRE 44.345889 -100.320028
SD0000051 EVERIST, L.G. INC. SIOUX FALLS 43.819111 -96.691111
SD0025186 BOX ELDER -CITY OF BOX ELDER 44.105821 -102.995452
SD0020044 SPEARFISH SPEARFISH 44.48527 -103.85202
SD0026883 LAC MINERALS LEAD 44.374984 -103.858814
SD0025798 SAINT JOSEPH INDIAN ELEMENTARY SCHOOL CHAMBERLAIN 43.828111 -99.323833
SD0020061 VERMILLION, CITY OF VERMILLION 42.762472 -96.918361
SD0000027 GCC DACOTAH RAPID CITY 44.0896 -103.271663
SD0021024 WILMOT - CITY OF WILMOT 45.410417 -96.845361
SD0020192 EAGLE BUTTE- CITY OF EAGLE BUTTE 45.007472 -101.257056
SD0020648 US ARMY CORPS OF ENGINEERS - FORT RANDALL PROJECT PICKSTOWN 43.064306 -98.553667
SD0000281 US DOD USAF ELLSWORTH AFB ELLSWORTH AFB 44.14806 -103.0958
SD0023400 BUFFALO- TOWN OF BUFFALO 45.576028 -103.535139
SD0020371 MILBANK WASTEWATER TRMT PLNT MILBANK 45.229409 -96.59117
SDG860003 WEB WATER TREATMENT FACILITY MOBRIDGE 45.436083 -100.227639
SD0022918 HOT SPRINGS, CITY OF HOT SPRINGS 43.404675 -103.436619
SD0027987 VALLEY QUEEN CHEESE FACTORY MILBANK 45.221361 -96.637306
SD0025933 HOMESTAKE MINING CO - OPEN CUT CENTRAL CITY 44.36304 -103.761309
SD0020079 BERESFORD, CITY OF BERESFORD 43.096357 -96.777966
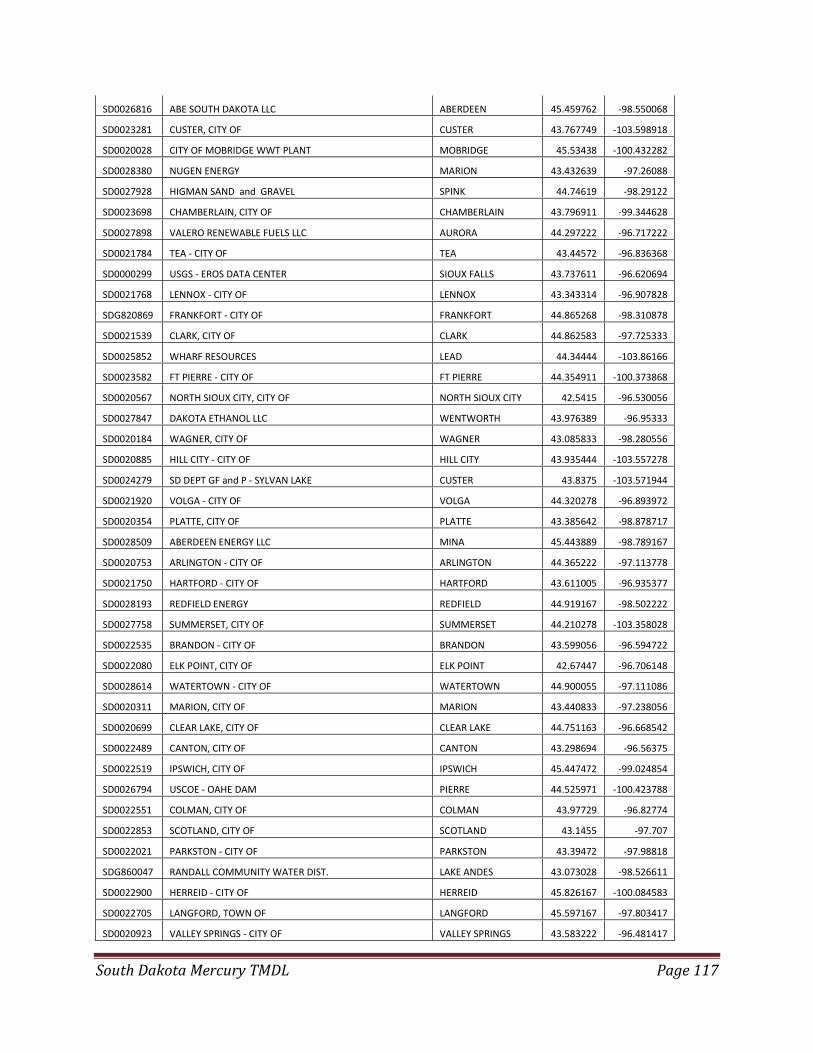
South Dakota Mercury TMDL Page 117
SD0026816 ABE SOUTH DAKOTA LLC ABERDEEN 45.459762 -98.550068
SD0023281 CUSTER, CITY OF CUSTER 43.767749 -103.598918
SD0020028 CITY OF MOBRIDGE WWT PLANT MOBRIDGE 45.53438 -100.432282
SD0028380 NUGEN ENERGY MARION 43.432639 -97.26088
SD0027928 HIGMAN SAND and GRAVEL SPINK 44.74619 -98.29122
SD0023698 CHAMBERLAIN, CITY OF CHAMBERLAIN 43.796911 -99.344628
SD0027898 VALERO RENEWABLE FUELS LLC AURORA 44.297222 -96.717222
SD0021784 TEA - CITY OF TEA 43.44572 -96.836368
SD0000299 USGS - EROS DATA CENTER SIOUX FALLS 43.737611 -96.620694
SD0021768 LENNOX - CITY OF LENNOX 43.343314 -96.907828
SDG820869 FRANKFORT - CITY OF FRANKFORT 44.865268 -98.310878
SD0021539 CLARK, CITY OF CLARK 44.862583 -97.725333
SD0025852 WHARF RESOURCES LEAD 44.34444 -103.86166
SD0023582 FT PIERRE - CITY OF FT PIERRE 44.354911 -100.373868
SD0020567 NORTH SIOUX CITY, CITY OF NORTH SIOUX CITY 42.5415 -96.530056
SD0027847 DAKOTA ETHANOL LLC WENTWORTH 43.976389 -96.95333
SD0020184 WAGNER, CITY OF WAGNER 43.085833 -98.280556
SD0020885 HILL CITY - CITY OF HILL CITY 43.935444 -103.557278
SD0024279 SD DEPT GF and P - SYLVAN LAKE CUSTER 43.8375 -103.571944
SD0021920 VOLGA - CITY OF VOLGA 44.320278 -96.893972
SD0020354 PLATTE, CITY OF PLATTE 43.385642 -98.878717
SD0028509 ABERDEEN ENERGY LLC MINA 45.443889 -98.789167
SD0020753 ARLINGTON - CITY OF ARLINGTON 44.365222 -97.113778
SD0021750 HARTFORD - CITY OF HARTFORD 43.611005 -96.935377
SD0028193 REDFIELD ENERGY REDFIELD 44.919167 -98.502222
SD0027758 SUMMERSET, CITY OF SUMMERSET 44.210278 -103.358028
SD0022535 BRANDON - CITY OF BRANDON 43.599056 -96.594722
SD0022080 ELK POINT, CITY OF ELK POINT 42.67447 -96.706148
SD0028614 WATERTOWN - CITY OF WATERTOWN 44.900055 -97.111086
SD0020311 MARION, CITY OF MARION 43.440833 -97.238056
SD0020699 CLEAR LAKE, CITY OF CLEAR LAKE 44.751163 -96.668542
SD0022489 CANTON, CITY OF CANTON 43.298694 -96.56375
SD0022519 IPSWICH, CITY OF IPSWICH 45.447472 -99.024854
SD0026794 USCOE - OAHE DAM PIERRE 44.525971 -100.423788
SD0022551 COLMAN, CITY OF COLMAN 43.97729 -96.82774
SD0022853 SCOTLAND, CITY OF SCOTLAND 43.1455 -97.707
SD0022021 PARKSTON - CITY OF PARKSTON 43.39472 -97.98818
SDG860047 RANDALL COMMUNITY WATER DIST. LAKE ANDES 43.073028 -98.526611
SD0022900 HERREID - CITY OF HERREID 45.826167 -100.084583
SD0022705 LANGFORD, TOWN OF LANGFORD 45.597167 -97.803417
SD0020923 VALLEY SPRINGS - CITY OF VALLEY SPRINGS 43.583222 -96.481417
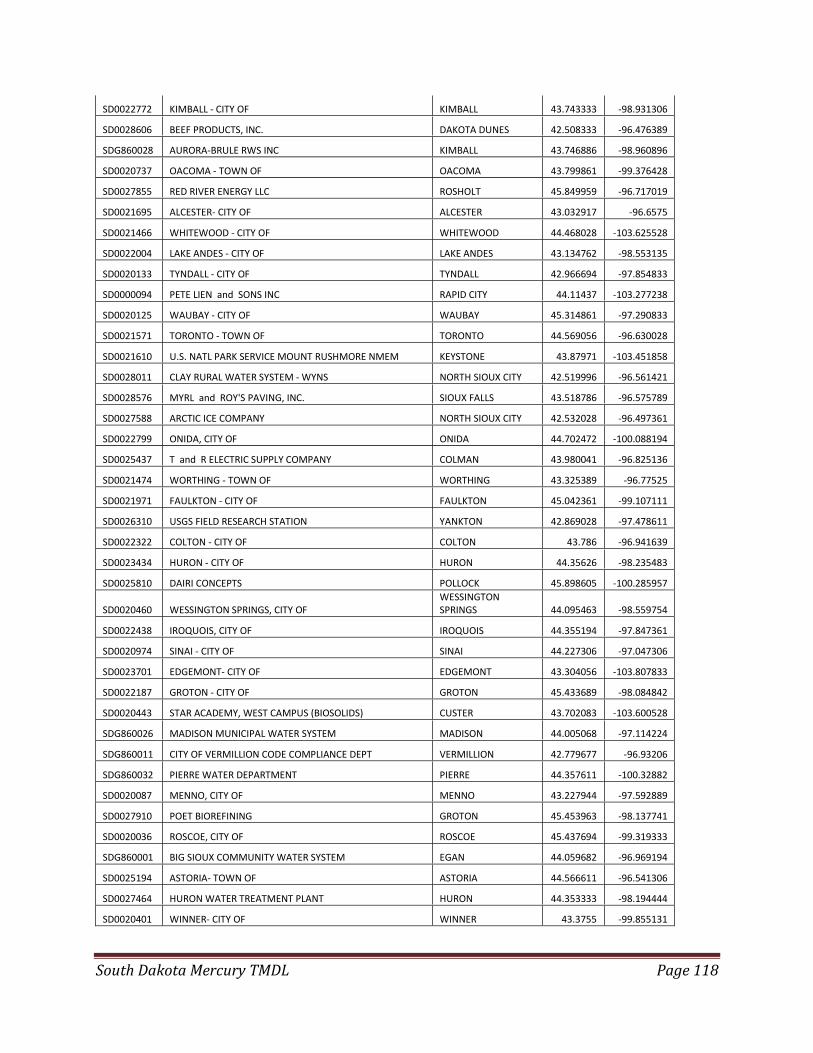
South Dakota Mercury TMDL Page 118
SD0022772 KIMBALL - CITY OF KIMBALL 43.743333 -98.931306
SD0028606 BEEF PRODUCTS, INC. DAKOTA DUNES 42.508333 -96.476389
SDG860028 AURORA-BRULE RWS INC KIMBALL 43.746886 -98.960896
SD0020737 OACOMA - TOWN OF OACOMA 43.799861 -99.376428
SD0027855 RED RIVER ENERGY LLC ROSHOLT 45.849959 -96.717019
SD0021695 ALCESTER- CITY OF ALCESTER 43.032917 -96.6575
SD0021466 WHITEWOOD - CITY OF WHITEWOOD 44.468028 -103.625528
SD0022004 LAKE ANDES - CITY OF LAKE ANDES 43.134762 -98.553135
SD0020133 TYNDALL - CITY OF TYNDALL 42.966694 -97.854833
SD0000094 PETE LIEN and SONS INC RAPID CITY 44.11437 -103.277238
SD0020125 WAUBAY - CITY OF WAUBAY 45.314861 -97.290833
SD0021571 TORONTO - TOWN OF TORONTO 44.569056 -96.630028
SD0021610 U.S. NATL PARK SERVICE MOUNT RUSHMORE NMEM KEYSTONE 43.87971 -103.451858
SD0028011 CLAY RURAL WATER SYSTEM - WYNS NORTH SIOUX CITY 42.519996 -96.561421
SD0028576 MYRL and ROY'S PAVING, INC. SIOUX FALLS 43.518786 -96.575789
SD0027588 ARCTIC ICE COMPANY NORTH SIOUX CITY 42.532028 -96.497361
SD0022799 ONIDA, CITY OF ONIDA 44.702472 -100.088194
SD0025437 T and R ELECTRIC SUPPLY COMPANY COLMAN 43.980041 -96.825136
SD0021474 WORTHING - TOWN OF WORTHING 43.325389 -96.77525
SD0021971 FAULKTON - CITY OF FAULKTON 45.042361 -99.107111
SD0026310 USGS FIELD RESEARCH STATION YANKTON 42.869028 -97.478611
SD0022322 COLTON - CITY OF COLTON 43.786 -96.941639
SD0023434 HURON - CITY OF HURON 44.35626 -98.235483
SD0025810 DAIRI CONCEPTS POLLOCK 45.898605 -100.285957
SD0020460 WESSINGTON SPRINGS, CITY OF WESSINGTON SPRINGS 44.095463 -98.559754
SD0022438 IROQUOIS, CITY OF IROQUOIS 44.355194 -97.847361
SD0020974 SINAI - CITY OF SINAI 44.227306 -97.047306
SD0023701 EDGEMONT- CITY OF EDGEMONT 43.304056 -103.807833
SD0022187 GROTON - CITY OF GROTON 45.433689 -98.084842
SD0020443 STAR ACADEMY, WEST CAMPUS (BIOSOLIDS) CUSTER 43.702083 -103.600528
SDG860026 MADISON MUNICIPAL WATER SYSTEM MADISON 44.005068 -97.114224
SDG860011 CITY OF VERMILLION CODE COMPLIANCE DEPT VERMILLION 42.779677 -96.93206
SDG860032 PIERRE WATER DEPARTMENT PIERRE 44.357611 -100.32882
SD0020087 MENNO, CITY OF MENNO 43.227944 -97.592889
SD0027910 POET BIOREFINING GROTON 45.453963 -98.137741
SD0020036 ROSCOE, CITY OF ROSCOE 45.437694 -99.319333
SDG860001 BIG SIOUX COMMUNITY WATER SYSTEM EGAN 44.059682 -96.969194
SD0025194 ASTORIA- TOWN OF ASTORIA 44.566611 -96.541306
SD0027464 HURON WATER TREATMENT PLANT HURON 44.353333 -98.194444
SD0020401 WINNER- CITY OF WINNER 43.3755 -99.855131
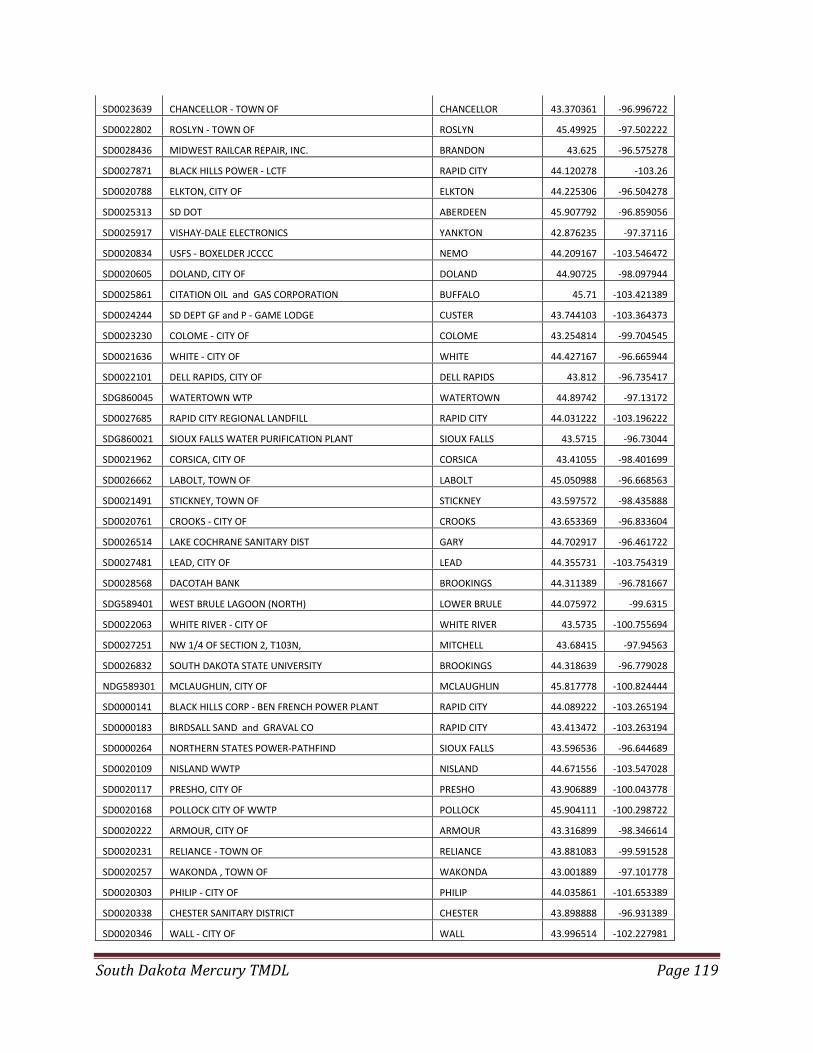
South Dakota Mercury TMDL Page 119
SD0023639 CHANCELLOR - TOWN OF CHANCELLOR 43.370361 -96.996722
SD0022802 ROSLYN - TOWN OF ROSLYN 45.49925 -97.502222
SD0028436 MIDWEST RAILCAR REPAIR, INC. BRANDON 43.625 -96.575278
SD0027871 BLACK HILLS POWER - LCTF RAPID CITY 44.120278 -103.26
SD0020788 ELKTON, CITY OF ELKTON 44.225306 -96.504278
SD0025313 SD DOT ABERDEEN 45.907792 -96.859056
SD0025917 VISHAY-DALE ELECTRONICS YANKTON 42.876235 -97.37116
SD0020834 USFS - BOXELDER JCCCC NEMO 44.209167 -103.546472
SD0020605 DOLAND, CITY OF DOLAND 44.90725 -98.097944
SD0025861 CITATION OIL and GAS CORPORATION BUFFALO 45.71 -103.421389
SD0024244 SD DEPT GF and P - GAME LODGE CUSTER 43.744103 -103.364373
SD0023230 COLOME - CITY OF COLOME 43.254814 -99.704545
SD0021636 WHITE - CITY OF WHITE 44.427167 -96.665944
SD0022101 DELL RAPIDS, CITY OF DELL RAPIDS 43.812 -96.735417
SDG860045 WATERTOWN WTP WATERTOWN 44.89742 -97.13172
SD0027685 RAPID CITY REGIONAL LANDFILL RAPID CITY 44.031222 -103.196222
SDG860021 SIOUX FALLS WATER PURIFICATION PLANT SIOUX FALLS 43.5715 -96.73044
SD0021962 CORSICA, CITY OF CORSICA 43.41055 -98.401699
SD0026662 LABOLT, TOWN OF LABOLT 45.050988 -96.668563
SD0021491 STICKNEY, TOWN OF STICKNEY 43.597572 -98.435888
SD0020761 CROOKS - CITY OF CROOKS 43.653369 -96.833604
SD0026514 LAKE COCHRANE SANITARY DIST GARY 44.702917 -96.461722
SD0027481 LEAD, CITY OF LEAD 44.355731 -103.754319
SD0028568 DACOTAH BANK BROOKINGS 44.311389 -96.781667
SDG589401 WEST BRULE LAGOON (NORTH) LOWER BRULE 44.075972 -99.6315
SD0022063 WHITE RIVER - CITY OF WHITE RIVER 43.5735 -100.755694
SD0027251 NW 1/4 OF SECTION 2, T103N, MITCHELL 43.68415 -97.94563
SD0026832 SOUTH DAKOTA STATE UNIVERSITY BROOKINGS 44.318639 -96.779028
NDG589301 MCLAUGHLIN, CITY OF MCLAUGHLIN 45.817778 -100.824444
SD0000141 BLACK HILLS CORP - BEN FRENCH POWER PLANT RAPID CITY 44.089222 -103.265194
SD0000183 BIRDSALL SAND and GRAVAL CO RAPID CITY 43.413472 -103.263194
SD0000264 NORTHERN STATES POWER-PATHFIND SIOUX FALLS 43.596536 -96.644689
SD0020109 NISLAND WWTP NISLAND 44.671556 -103.547028
SD0020117 PRESHO, CITY OF PRESHO 43.906889 -100.043778
SD0020168 POLLOCK CITY OF WWTP POLLOCK 45.904111 -100.298722
SD0020222 ARMOUR, CITY OF ARMOUR 43.316899 -98.346614
SD0020231 RELIANCE - TOWN OF RELIANCE 43.881083 -99.591528
SD0020257 WAKONDA , TOWN OF WAKONDA 43.001889 -97.101778
SD0020303 PHILIP - CITY OF PHILIP 44.035861 -101.653389
SD0020338 CHESTER SANITARY DISTRICT CHESTER 43.898888 -96.931389
SD0020346 WALL - CITY OF WALL 43.996514 -102.227981

South Dakota Mercury TMDL Page 120
SD0020389 WARNER WARNER 45.320361 -98.500917
SD0020486 MOUNT VERNON - CITY OF MT. VERNON 43.724382 -98.255885
SD0020494 NEWELL - CITY OF NEWELL 44.724167 -103.415278
SD0020524 ROSHOLT - TOWN OF ROSHOLT 45.875193 -96.725848
SD0020575 GETTYSBURG WWT FACILITIES GETTYSBURG 44.995167 -99.959639
SD0020613 HOWARD, CITY OF HOWARD 43.998722 -97.521194
SD0020672 MELLETTE , CITY OF MELLETTE 45.158989 -98.491404
SD0020818 MURDO - CITY OF MURDO 43.875389 -100.709472
SD0020826 SISSETON CITY OF SISSETON 45.688015 -96.997859
SD0020851 EUREKA, CITY OF EUREKA 45.758001 -99.651727
SD0020877 GLENHAM - TOWN OF GLENHAM 45.53025 -100.275556
SD0020931 NEW EFFINGTON, TOWN OF NEW EFFINGTON 45.8665 -96.918111
SD0020940 PARKER, CITY OF PARKER 43.408101 -97.124745
SD0020958 PLANKINTON - CITY OF PLANKINTON 43.718583 -98.466861
SD0020966 SALEM - CITY OF SALEM 43.72754 -97.38738
SD0020982 ST. LAWRENCE, TOWN OF ST. LAWRENCE 44.523083 -98.935389
SD0021016 WHITE LAKE - CITY OF WHITE LAKE 43.725493 -98.732065
SD0021547 CONDE, TOWN OF CONDE 45.162194 -98.100389
SD0021555 BRYANT- CITY OF BRYANT 44.583611 -97.4525
SD0021661 AURORA- CITY OF AURORA 44.279806 -96.696944
SD0021717 SELBY - CITY OF SELBY 45.500472 -100.040222
SD0021741 EMERY, CITY OF EMERY 43.613917 -97.614861
SD0021776 LETCHER - TOWN OF LETCHER 43.904028 -98.133556
SD0021806 CAVOUR - TOWN OF CAVOUR 44.367306 -98.0425
SD0021831 FLANDREAU, CITY OF FLANDREAU 44.032778 -96.615
SD0021989 HIGHMORE, CITY OF HIGHMORE 44.532361 -99.425472
SD0022047 SPRINGFIELD - CITY OF SPRINGFIELD 42.854204 -97.892625
SD0022110 FREEMAN - CITY OF FREEMAN 43.365167 -97.485694
SD0022144 ESTELLINE - CITY OF ESTELLINE 44.573577 -96.913951
SD0022152 FREDERICK- TOWN OF FREDERICK 45.828714 -98.508497
SD0022161 GAYVILLE, TOWN OF GAYVILLE 42.887611 -97.175194
SD0022179 GREGORY- CITY OF__________(E) GREGORY 43.201472 -99.421028
SD0022209 TABOR - TOWN OF TABOR 42.954429 -97.653206
SD0022276 ASHTON, CITY OF ASHTON 44.990028 -98.4825
SD0022284 BALTIC, CITY OF BALTIC 43.755806 -96.744583
SD0022314 CLAREMONT, TOWN OF CLAREMONT 45.669722 -98.008333
SD0022349 HERMOSA - TOWN OF HERMOSA 43.834222 -103.18175
SD0022357 KADOKA - CITY OF KADOKA 43.848528 -101.518611
SD0022373 LESTERVILLE - TOWN OF LESTERVILLE 43.037222 -97.6
SD0022403 TRIPP - CITY OF TRIPP 43.233361 -97.946056
SD0022454 IRENE - CITY OF IRENE 43.073917 -97.1615
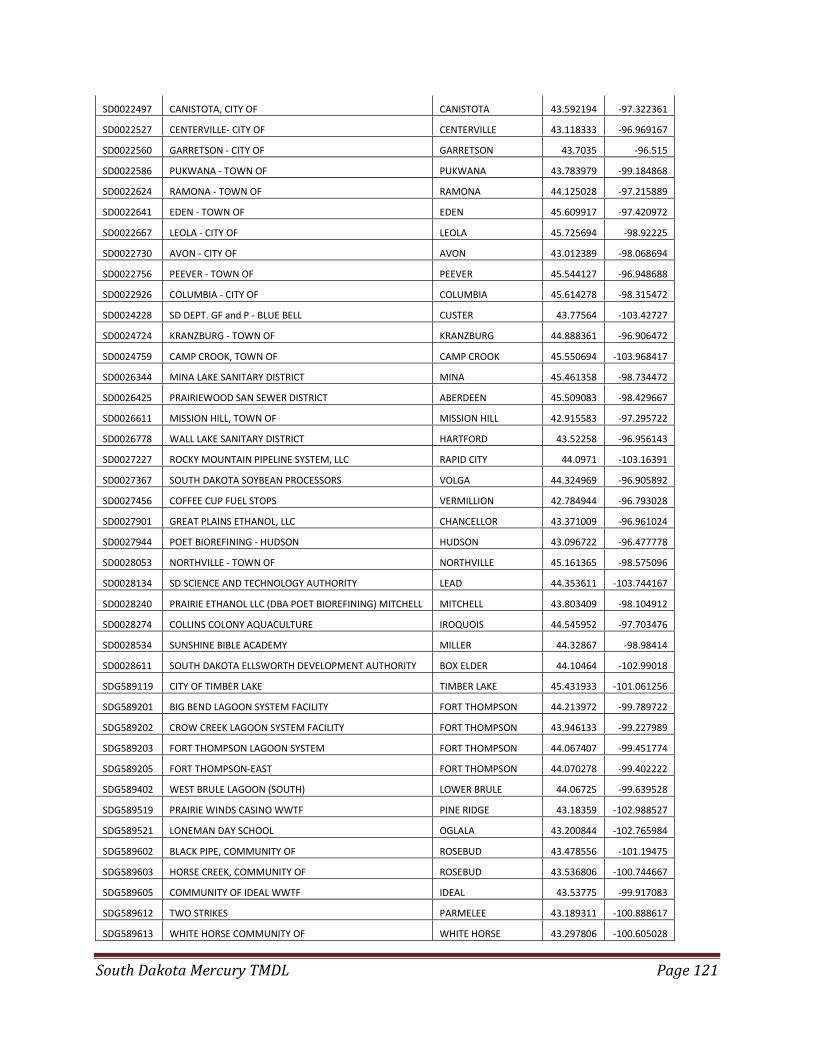
South Dakota Mercury TMDL Page 121
SD0022497 CANISTOTA, CITY OF CANISTOTA 43.592194 -97.322361
SD0022527 CENTERVILLE- CITY OF CENTERVILLE 43.118333 -96.969167
SD0022560 GARRETSON - CITY OF GARRETSON 43.7035 -96.515
SD0022586 PUKWANA - TOWN OF PUKWANA 43.783979 -99.184868
SD0022624 RAMONA - TOWN OF RAMONA 44.125028 -97.215889
SD0022641 EDEN - TOWN OF EDEN 45.609917 -97.420972
SD0022667 LEOLA - CITY OF LEOLA 45.725694 -98.92225
SD0022730 AVON - CITY OF AVON 43.012389 -98.068694
SD0022756 PEEVER - TOWN OF PEEVER 45.544127 -96.948688
SD0022926 COLUMBIA - CITY OF COLUMBIA 45.614278 -98.315472
SD0024228 SD DEPT. GF and P - BLUE BELL CUSTER 43.77564 -103.42727
SD0024724 KRANZBURG - TOWN OF KRANZBURG 44.888361 -96.906472
SD0024759 CAMP CROOK, TOWN OF CAMP CROOK 45.550694 -103.968417
SD0026344 MINA LAKE SANITARY DISTRICT MINA 45.461358 -98.734472
SD0026425 PRAIRIEWOOD SAN SEWER DISTRICT ABERDEEN 45.509083 -98.429667
SD0026611 MISSION HILL, TOWN OF MISSION HILL 42.915583 -97.295722
SD0026778 WALL LAKE SANITARY DISTRICT HARTFORD 43.52258 -96.956143
SD0027227 ROCKY MOUNTAIN PIPELINE SYSTEM, LLC RAPID CITY 44.0971 -103.16391
SD0027367 SOUTH DAKOTA SOYBEAN PROCESSORS VOLGA 44.324969 -96.905892
SD0027456 COFFEE CUP FUEL STOPS VERMILLION 42.784944 -96.793028
SD0027901 GREAT PLAINS ETHANOL, LLC CHANCELLOR 43.371009 -96.961024
SD0027944 POET BIOREFINING - HUDSON HUDSON 43.096722 -96.477778
SD0028053 NORTHVILLE - TOWN OF NORTHVILLE 45.161365 -98.575096
SD0028134 SD SCIENCE AND TECHNOLOGY AUTHORITY LEAD 44.353611 -103.744167
SD0028240 PRAIRIE ETHANOL LLC (DBA POET BIOREFINING) MITCHELL MITCHELL 43.803409 -98.104912
SD0028274 COLLINS COLONY AQUACULTURE IROQUOIS 44.545952 -97.703476
SD0028534 SUNSHINE BIBLE ACADEMY MILLER 44.32867 -98.98414
SD0028611 SOUTH DAKOTA ELLSWORTH DEVELOPMENT AUTHORITY BOX ELDER 44.10464 -102.99018
SDG589119 CITY OF TIMBER LAKE TIMBER LAKE 45.431933 -101.061256
SDG589201 BIG BEND LAGOON SYSTEM FACILITY FORT THOMPSON 44.213972 -99.789722
SDG589202 CROW CREEK LAGOON SYSTEM FACILITY FORT THOMPSON 43.946133 -99.227989
SDG589203 FORT THOMPSON LAGOON SYSTEM FORT THOMPSON 44.067407 -99.451774
SDG589205 FORT THOMPSON-EAST FORT THOMPSON 44.070278 -99.402222
SDG589402 WEST BRULE LAGOON (SOUTH) LOWER BRULE 44.06725 -99.639528
SDG589519 PRAIRIE WINDS CASINO WWTF PINE RIDGE 43.18359 -102.988527
SDG589521 LONEMAN DAY SCHOOL OGLALA 43.200844 -102.765984
SDG589602 BLACK PIPE, COMMUNITY OF ROSEBUD 43.478556 -101.19475
SDG589603 HORSE CREEK, COMMUNITY OF ROSEBUD 43.536806 -100.744667
SDG589605 COMMUNITY OF IDEAL WWTF IDEAL 43.53775 -99.917083
SDG589612 TWO STRIKES PARMELEE 43.189311 -100.888617
SDG589613 WHITE HORSE COMMUNITY OF WHITE HORSE 43.297806 -100.605028

South Dakota Mercury TMDL Page 122
SDG589803 LAKE TRAVERSE UTILITY COMMISSION AGENCY VILLAGE 45.566349 -97.056192
SDG589804 RED IRON HOUSING WWTP AGENCY VILLAGE 45.683083 -97.335583
SDG589805 VEBLEN FLATS HOUSING WWTP AGENCY VILLAGE 45.879333 -97.315056
SDG860066 CLARK RURAL WATER-KAMPESKA WTP CLARK 45.006667 -97.178611

South Dakota Mercury TMDL Page 123
Appendix F. Public Comments and EPA Review
EPA REGION 8 TMDL REVIEW FORM AND DECISION DOCUMENT
TMDL Document Info:
Document Name: South Dakota Mercury Total Maximum Daily Load
Submitted by: SD DENR
Date Received: September 18, 2015
Review Date: October 13, 2015
Reviewer: Peter Brumm
Rough Draft / Public Notice /
Final Draft?
Public Notice Draft
Notes:
Reviewers Final Recommendation(s) to EPA Administrator (used for final draft review only):
Approve
Partial Approval
Disapprove
Insufficient Information
Approval Notes to the Administrator:
This document provides a standard format for EPA Region 8 to provide comments to state
TMDL programs on TMDL documents submitted to EPA for either formal or informal review.
All TMDL documents are evaluated against the TMDL review elements identified in the
following 8 sections:
1. Problem Description
1.1. TMDL Document Submittal
1.2. Identification of the Waterbody, Impairments, and Study Boundaries
1.3. Water Quality Standards
2. Water Quality Target
3. Pollutant Source Analysis
South Dakota Mercury TMDL Page 124
4. TMDL Technical Analysis
4.1. Data Set Description
4.2. Waste Load Allocations (WLA)
4.3. Load Allocations (LA)
4.4. Margin of Safety (MOS)
4.5. Seasonality and variations in assimilative capacity
5. Public Participation
6. Monitoring Strategy
7. Restoration Strategy
8. Daily Loading Expression
Under Section 303(d) of the Clean Water Act, waterbodies that are not attaining one or more
water quality standard (WQS) are considered “impaired.” When the cause of the impairment is
determined to be a pollutant, a TMDL analysis is required to assess the appropriate maximum
allowable pollutant loading rate. A TMDL document consists of a technical analysis conducted
to: (1) assess the maximum pollutant loading rate that a waterbody is able to assimilate while
maintaining water quality standards; and (2) allocate that assimilative capacity among the known
sources of that pollutant. A well written TMDL document will describe a path forward that may
be used by those who implement the TMDL recommendations to attain and maintain WQS.
Each of the following eight sections describes the factors that EPA Region 8 staff considers
when reviewing TMDL documents. Also included in each section is a list of EPA’s review
elements relative to that section, a brief summary of the EPA reviewer’s findings, and the
reviewer’s comments and/or suggestions. Use of the verb “must” in this review form denotes
information that is required to be submitted because it relates to elements of the TMDL required
by the CWA and by regulation. Use of the term “should” below denotes information that is
generally necessary for EPA to determine if a submitted TMDL is approvable.
This review form is intended to ensure compliance with the Clean Water Act and that the
reviewed documents are technically sound and the conclusions are technically defensible.
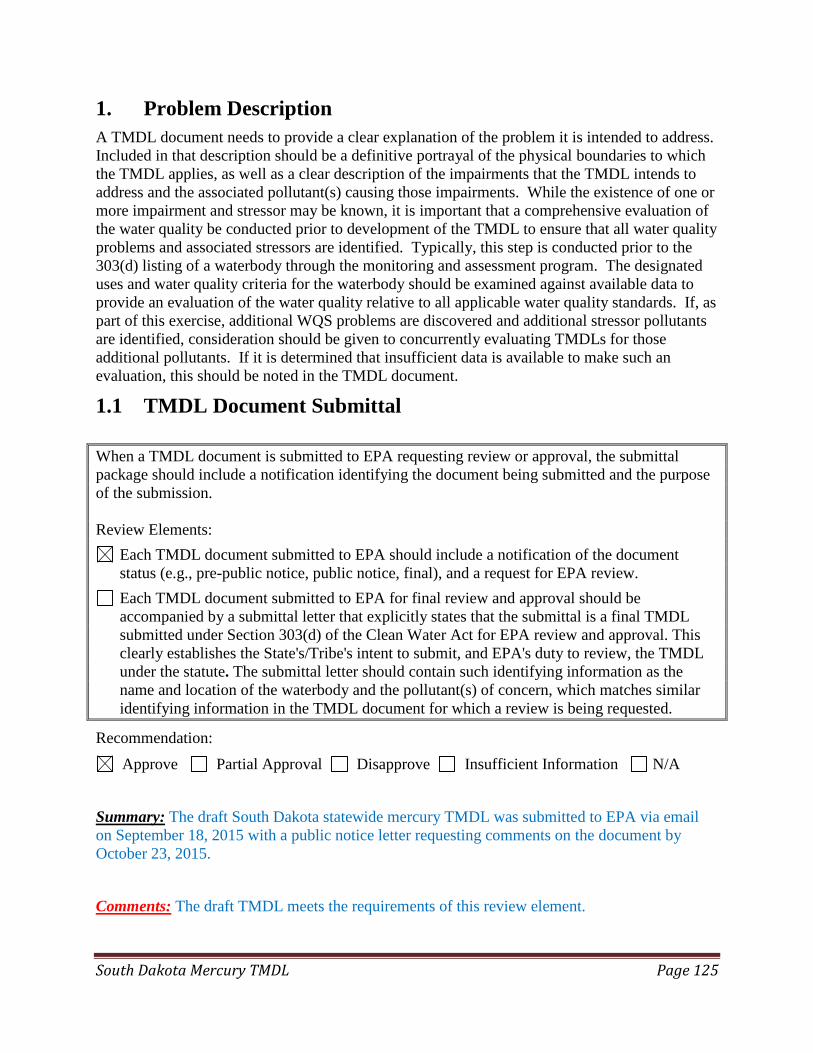
South Dakota Mercury TMDL Page 125
1. Problem Description
A TMDL document needs to provide a clear explanation of the problem it is intended to address.
Included in that description should be a definitive portrayal of the physical boundaries to which
the TMDL applies, as well as a clear description of the impairments that the TMDL intends to
address and the associated pollutant(s) causing those impairments. While the existence of one or
more impairment and stressor may be known, it is important that a comprehensive evaluation of
the water quality be conducted prior to development of the TMDL to ensure that all water quality
problems and associated stressors are identified. Typically, this step is conducted prior to the
303(d) listing of a waterbody through the monitoring and assessment program. The designated
uses and water quality criteria for the waterbody should be examined against available data to
provide an evaluation of the water quality relative to all applicable water quality standards. If, as
part of this exercise, additional WQS problems are discovered and additional stressor pollutants
are identified, consideration should be given to concurrently evaluating TMDLs for those
additional pollutants. If it is determined that insufficient data is available to make such an
evaluation, this should be noted in the TMDL document.
1.1 TMDL Document Submittal
When a TMDL document is submitted to EPA requesting review or approval, the submittal
package should include a notification identifying the document being submitted and the purpose
of the submission.
Review Elements:
Each TMDL document submitted to EPA should include a notification of the document
status (e.g., pre-public notice, public notice, final), and a request for EPA review.
Each TMDL document submitted to EPA for final review and approval should be
accompanied by a submittal letter that explicitly states that the submittal is a final TMDL
submitted under Section 303(d) of the Clean Water Act for EPA review and approval. This
clearly establishes the State's/Tribe's intent to submit, and EPA's duty to review, the TMDL
under the statute. The submittal letter should contain such identifying information as the
name and location of the waterbody and the pollutant(s) of concern, which matches similar
identifying information in the TMDL document for which a review is being requested.
Recommendation:
Approve Partial Approval Disapprove Insufficient Information N/A
Summary: The draft South Dakota statewide mercury TMDL was submitted to EPA via email
on September 18, 2015 with a public notice letter requesting comments on the document by
October 23, 2015.
Comments: The draft TMDL meets the requirements of this review element.
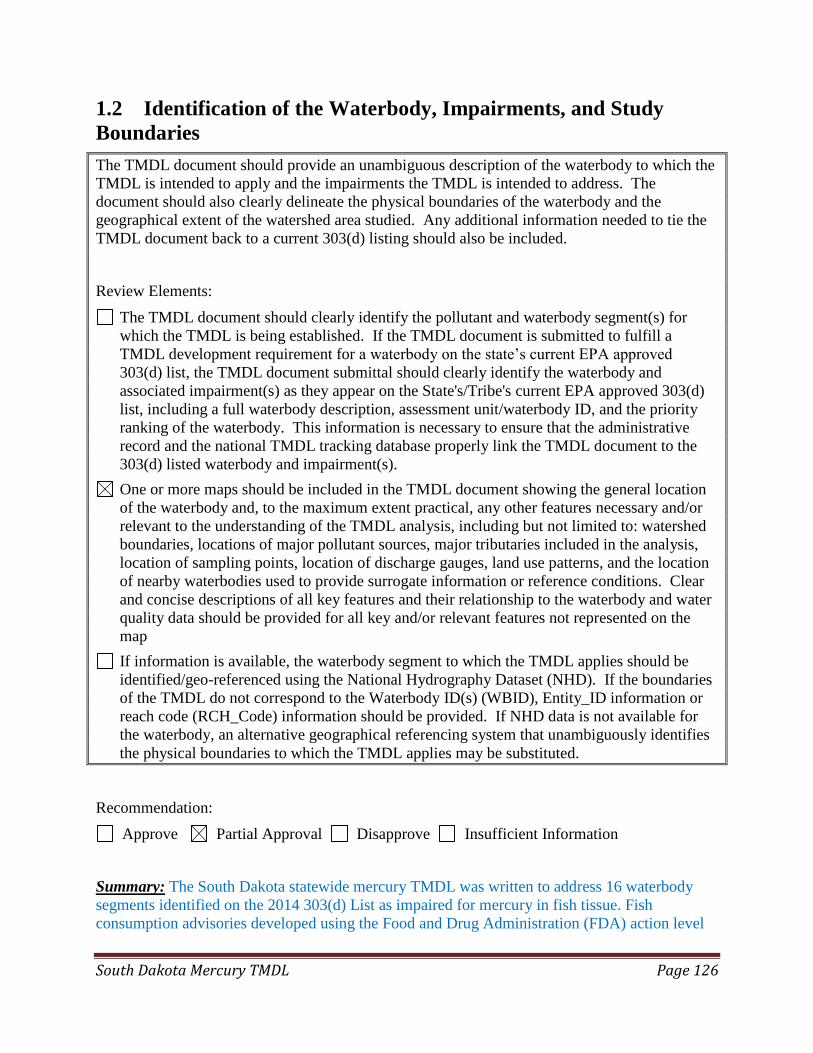
South Dakota Mercury TMDL Page 126
1.2 Identification of the Waterbody, Impairments, and Study
Boundaries
The TMDL document should provide an unambiguous description of the waterbody to which the
TMDL is intended to apply and the impairments the TMDL is intended to address. The
document should also clearly delineate the physical boundaries of the waterbody and the
geographical extent of the watershed area studied. Any additional information needed to tie the
TMDL document back to a current 303(d) listing should also be included.
Review Elements:
The TMDL document should clearly identify the pollutant and waterbody segment(s) for
which the TMDL is being established. If the TMDL document is submitted to fulfill a
TMDL development requirement for a waterbody on the state’s current EPA approved
303(d) list, the TMDL document submittal should clearly identify the waterbody and
associated impairment(s) as they appear on the State's/Tribe's current EPA approved 303(d)
list, including a full waterbody description, assessment unit/waterbody ID, and the priority
ranking of the waterbody. This information is necessary to ensure that the administrative
record and the national TMDL tracking database properly link the TMDL document to the
303(d) listed waterbody and impairment(s).
One or more maps should be included in the TMDL document showing the general location
of the waterbody and, to the maximum extent practical, any other features necessary and/or
relevant to the understanding of the TMDL analysis, including but not limited to: watershed
boundaries, locations of major pollutant sources, major tributaries included in the analysis,
location of sampling points, location of discharge gauges, land use patterns, and the location
of nearby waterbodies used to provide surrogate information or reference conditions. Clear
and concise descriptions of all key features and their relationship to the waterbody and water
quality data should be provided for all key and/or relevant features not represented on the
map
If information is available, the waterbody segment to which the TMDL applies should be
identified/geo-referenced using the National Hydrography Dataset (NHD). If the boundaries
of the TMDL do not correspond to the Waterbody ID(s) (WBID), Entity_ID information or
reach code (RCH_Code) information should be provided. If NHD data is not available for
the waterbody, an alternative geographical referencing system that unambiguously identifies
the physical boundaries to which the TMDL applies may be substituted.
Recommendation:
Approve Partial Approval Disapprove Insufficient Information
Summary: The South Dakota statewide mercury TMDL was written to address 16 waterbody
segments identified on the 2014 303(d) List as impaired for mercury in fish tissue. Fish
consumption advisories developed using the Food and Drug Administration (FDA) action level
South Dakota Mercury TMDL Page 127
of 1 mg/kg were the basis for the 16 existing listings and the geographic extent of these listed
waters is mapped in Figure 4 of the TMDL document (pg. 21).
South Dakota is in the process of adopting the EPA recommended 304(a) methylmercury
criterion of 0.3 mg/kg and does not have a defined or standardized assessment method for listing
mercury impairments at this time. The TMDL document identified another 72 waterbody
segments in Table 3 of the TMDL document (pg. 23) with at least one fish tissue concentration ≥
0.3 mg/kg methylmercury, but which the State has not yet determined to be impaired. The
document states, “If any of these waters are found to be impaired through the adoption and
application of the 0.3 mg/kg methylmercury criterion, this TMDL will be considered applicable.”
The geographic extent of some of these 72 additional waterbody segments is mapped in Figure 5
(pg. 24).
South Dakota determined that a single statewide TMDL was representative and appropriate for
the entire state after finding that atmospheric mercury deposition rates and methylmercury
concentrations did not significantly differ between geographic location and waterbody type (i.e.,
lakes vs. impoundments). A comparison of various water quality and watershed factors to
methylmercury concentrations found slight differences but identified reducing inputs through
addressing atmospheric mercury emissions as the only viable solution to resolving the State’s
mercury impairments (see Section 3.4 of the TMDL document).
Because the TMDL investigation found that atmospheric deposition was the most significant
contributor of mercury to South Dakota waters, and the loading scenario is occurring across the
entire state, South Dakota intends to revise the TMDL document in the future by broadening its
scope to include additional waterbody segments if monitoring data becomes available indicating
new mercury impairments. An excerpt from Section 1.3 of the TMDL document that outlines
this revision approach is provide below:
In summary, this TMDL may be applicable to additional waters of the state if:
It falls entirely within state jurisdiction,
If jurisdiction is shared, it may only be applied to those portions of the water
under South Dakotas’ jurisdiction,
The standard length fish tissue methylmercury concentrations does not exceed
0.878 mg/Kg,
There are no potential impacts from current or historic gold mining processes,
If it is a river or stream, NPDES discharges do not exceed permitted limits,
The TMDL will meet the water quality standards in the proposed water, and
The original TMDL assumptions (e.g., source contributions, loading capacity,
etc.) are still valid.

South Dakota Mercury TMDL Page 128
According to the process outlined in the draft TMDL, if a new waterbody segment meets all
seven of the conditions listed above, South Dakota may revise the original statewide mercury
TMDL to include the new water provided the State public notices the proposed revision, reviews
and addresses public comments, and obtains EPA approval.
Comments: As described above, the TMDL includes a list and a partial map of 72 waterbodies
for which the State has some data indicating elevated methylmercury concentrations in fish
tissue. The State has neither listed these 72 waters as impaired in its most recent 303(d) list, nor
identified these waters as “threatened” for 303(d) purposes. As a result, the purpose of including
these 72 unlisted waterbody segments in the TMDL document is unclear. As the draft TMDL
document is currently written, these 72 additional waterbody segments would not be part of
EPA’s TMDL approval action. If these waterbody segments are later identified as impaired
through a clearly defined and acceptable assessment method, additional information would be
needed before the TMDL could be considered applicable and EPA could make an approval
decision. Such necessary information would include, but is not limited to, evidence that there are
no mining related impacts to these waters, evidence that the TMDL is appropriate for riverine
waterbody types, a plan for how the TMDL would be implemented on shared jurisdictional
waters, and documentation of the public participation process followed for the TMDL revision.
SDDENR Response: Section 1.3 has been revised to include a listing methodology to be used in
the 2016IR. It also identifies impaired waters through the application of this methodology and
which waters the State expects the TMDL to be applicable to.

South Dakota Mercury TMDL Page 129
1.3 Water Quality Standards
TMDL documents should provide a complete description of the water quality standards for the
waterbodies addressed, including a listing of the designated uses and an indication of whether the
uses are being met, not being met, or not assessed. If a designated use was not assessed as part
of the TMDL analysis (or not otherwise recently assessed), the documents should provide a
reason for the lack of assessment (e.g., sufficient data was not available at this time to assess
whether or not this designated use was being met).
Water quality criteria (WQC) are established as a component of water quality standard at levels
considered necessary to protect the designated uses assigned to that waterbody. WQC identify
quantifiable targets and/or qualitative water quality goals which, if attained and maintained, are
intended to ensure that the designated uses for the waterbody are protected. TMDLs result in
maintaining and attaining water quality standards by determining the appropriate maximum
pollutant loading rate to meet water quality criteria, either directly, or through a surrogate
measurable target. The TMDL document should include a description of all applicable water
quality criteria for the impaired designated uses and address whether or not the criteria are being
attained, not attained, or not evaluated as part of the analysis. If the criteria were not evaluated
as part of the analysis, a reason should be cited (e.g. insufficient data were available to determine
if this water quality criterion is being attained).
Review Elements:
The TMDL must include a description of the applicable State/Tribal water quality standard,
including the designated use(s) of the waterbody, the applicable numeric or narrative water
quality criterion, and the anti-degradation policy. (40 C.F.R. §130.7(c)(1)).
The purpose of a TMDL analysis is to determine the assimilative capacity of the waterbody
that corresponds to the existing water quality standards for that waterbody, and to allocate
that assimilative capacity between the identified sources. Therefore, all TMDL documents
must be written to meet the existing water quality standards for that waterbody (CWA
§303(d)(1)(C)). Note: In some circumstances, the load reductions determined to be
necessary by the TMDL analysis may prove to be infeasible and may possibly indicate that
the existing water quality standards and/or assessment methodologies may be erroneous.
However, the TMDL must still be determined based on existing water quality standards.
Adjustments to water quality standards and/or assessment methodologies may be evaluated
separately, from the TMDL.
The TMDL document should describe the relationship between the pollutant of concern and
the water quality standard the pollutant load is intended to meet. This information is
necessary for EPA to evaluate whether or not attainment of the prescribed pollutant loadings
will result in attainment of the water quality standard in question.
If a standard includes multiple criteria for the pollutant of concern, the document should
demonstrate that the TMDL value will result in attainment of all related criteria for the
pollutant. For example, both acute and chronic values (if present in the WQS) should be
addressed in the document, including consideration of magnitude, frequency and duration
requirements.

South Dakota Mercury TMDL Page 130
Recommendation:
Approve Partial Approval Disapprove Insufficient Information
Summary: A discussion of water quality standards, including the topics of beneficial uses and
numeric criteria, is contained in Section 2.0 of the TMDL document. State regulations that
establish water quality standards in South Dakota are also referenced. Seven of the State’s eleven
beneficial uses, including various drinking water, stock water, and fish and wildlife propagation
use categories, have associated numeric water quality criteria for total mercury that range from
0.05 µg/L to 1.4 µg/L.
Because South Dakota chose to use 0.3 mg/kg methylmercury in fish tissue as the TMDL target,
an analysis was necessary to show that meeting the TMDL target would achieve water quality
standards and meet applicable water column criteria. This demonstration was performed
following EPA’s Guidance for Implementing the January 2001 Methylmercury Water Quality
Criterion (2010) and involved two steps. First, South Dakota converted the total methylmercury
fish tissue target into a total methylmercury water column concentration using the draft national
Bioaccumulation Factor (BAF) for the 4th
order tropic level. Then the State converted the total
methylmercury water column concentration into a total mercury water column concentration
using separate translators for lotic and lentic aquatic systems identified in EPA’s Water Quality
Criterion for the Protection of Human Health: Methylmercury (2001). The resulting
concentrations (lotic = 0.008 µg/L; lentic = 0.003 µg/L) indicated that the TMDL target is
protective of the most stringent water column criteria (0.050 µg/L) thereby demonstrating that
the TMDL was written to meet water quality standards.
The TMDL document includes a discussion of the global mercury cycle, the process of
methylation, routes of human exposure, and methylmercury’s capacity to bioaccumulate within
an individual and biomagnify within a food chain. Collectively, this background information
helps support the selection of a fish tissue methylmercury TMDL target intended to meet
mercury water quality standards.
Comments: The TMDL document should more clearly link numeric criteria to beneficial uses.
EPA recommends updating the list and table on page 28 of the TMDL document to more
clearly link beneficial uses to criteria. As currently written, the list within a list is hard to
follow and the table has no column or row headers. See Table 3 in The 2014 South Dakota
Integrated Report for Surface Water Quality Assessment for a more understandable presentation
of the same material.
The State submitted a water quality standards revision package to EPA on August 11, 2015. In
the standards package, South Dakota adopted the EPA recommended 304(a) methylmercury
criterion of 0.3 mg/kg. EPA is currently reviewing the revised water quality standards package.
South Dakota demonstrated in the TMDL document that meeting the methylmercury TMDL
target will simultaneously meet the State’s existing water column criteria.
SDDENR Response: The table on page 28 was modified.

South Dakota Mercury TMDL Page 131
2. Water Quality Targets
TMDL analyses establish numeric targets that are used to determine whether water quality
standards are being achieved. Quantified water quality targets or endpoints should be provided
to evaluate each listed pollutant/waterbody combination addressed by the TMDL, and should
represent achievement of applicable water quality standards and support of associated beneficial
uses. For pollutants with numeric water quality standards, the numeric criteria are generally used
as the water quality target. For pollutants with narrative standards, the narrative standard should
be translated into a measurable value. At a minimum, one target is required for each
pollutant/waterbody combination. It is generally desirable, however, to include several targets
that represent achievement of the standard and support of beneficial uses (e.g., for a sediment
impairment issue it may be appropriate to include a variety of targets representing water column
sediment such as TSS, embeddedness, stream morphology, up-slope conditions and a measure of
biota).
Review Elements:
The TMDL should identify a numeric water quality target(s) for each waterbody pollutant
combination. The TMDL target is a quantitative value used to measure whether or not the
applicable water quality standard is attained. Generally, the pollutant of concern and the
numeric water quality target are, respectively, the chemical causing the impairment and the
numeric criteria for that chemical (e.g., chromium) contained in the water quality standard.
Occasionally, the pollutant of concern is different from the parameter that is the subject of
the numeric water quality target (e.g., when the pollutant of concern is phosphorus and the
numeric water quality target is expressed as a numerical dissolved oxygen criterion). In
such cases, the TMDL should explain the linkage between the pollutant(s) of concern, and
express the quantitative relationship between the TMDL target and pollutant of concern. In
all cases, TMDL targets must represent the attainment of current water quality standards.
When a numeric TMDL target is established to ensure the attainment of a narrative water
quality criterion, the numeric target, the methodology used to determine the numeric target,
and the link between the pollutant of concern and the narrative water quality criterion should
all be described in the TMDL document. Any additional information supporting the numeric
target and linkage should also be included in the document.
Recommendation:
Approve Partial Approval Disapprove Insufficient Information
Summary: As described in Section 1.3 of this review form, South Dakota used 0.3 mg/kg
methylmercury in fish tissue as the TMDL target. In order to show that the TMDL was written to
meet water quality standards, South Dakota demonstrated that the methylmercury fish tissue
target will meet all existing, EPA-approved, numeric water quality criteria through the use of a
Bioaccumulation Factor (BAF) translation. The draft TMDL assumes steady-state conditions and
relies on the principle of proportionality to determine the reduction factor needed to meet the fish
tissue TMDL target. As explained in Section 3.3 of the TMDL document, South Dakota expects
that a reduction in mercury emissions will result in a proportional reduction in deposition,
mercury loading to waterways, and fish tissue methylmercury concentrations.
Comments: The draft TMDL meets the requirements of this review element.

South Dakota Mercury TMDL Page 132
3. Pollutant Source Analysis
A TMDL analysis is conducted when a pollutant load is known or suspected to be exceeding the
loading capacity of the waterbody. Logically then, a TMDL analysis should consider all sources
of the pollutant of concern in some manner. The detail provided in the source assessment step
drives the rigor of the pollutant load allocation. In other words, it is only possible to specifically
allocate quantifiable loads or load reductions to each identified source (or source category) when
the relative load contribution from each source has been estimated. Therefore, the pollutant load
from each identified source (or source category) should be specified and quantified. This may be
accomplished using site-specific monitoring data, modeling, or application of other assessment
techniques. If insufficient time or resources are available to accomplish this step, a
phased/adaptive management approach may be appropriate. The approach should be clearly
defined in the document.
Review Elements:
The TMDL should include an identification of the point and nonpoint sources of the pollutant
of concern, including the geographical location of the source(s) and the quantity of the
loading, e.g., lbs/per day. This information is necessary for EPA to evaluate the WLA, LA
and MOS components of the TMDL.
The level of detail provided in the source assessment should be commensurate with the
nature of the watershed and the nature of the pollutant being studied. Where it is possible to
separate natural background from nonpoint sources, the TMDL should include a description
of both the natural background loads and the nonpoint source loads.
Natural background loads should not be assumed to be the difference between the sum of
known and quantified anthropogenic sources and the existing in situ loads (e.g. measured in
stream) unless it can be demonstrated that the anthropogenic sources of the pollutant of
concern have been identified, characterized, and quantified.
The sampling data relied upon to discover, characterize, and quantify the pollutant sources
should be included in the document (e.g. a data appendix) along with a description of how
the data were analyzed to characterize and quantify the pollutant sources. A discussion of the
known deficiencies and/or gaps in the data set and their potential implications should also be
included.
Recommendation:
Approve Partial Approval Disapprove Insufficient Information
Summary: South Dakota investigated sources of mercury impairment through two
complementary approaches. The first involved partnering with the South Dakota School of
Mines and Technology to operate a network of in-state monitoring stations over a two year
period. The atmospheric mercury deposition data collected under this monitoring effort helped
the State estimate mercury deposition rates and helped inform the overall analysis by
highlighting geographical and seasonal patterns of deposition. This effort also addressed a data
gap where previous national studies had interpolated South Dakota deposition rates from

South Dakota Mercury TMDL Page 133
monitoring stations in neighboring states. Deposition monitoring results are provided in
Appendix B of the TMDL document.
As a second step, the State quantified specific sources and source categories contributing to
atmospheric mercury deposition by using the Regional Modeling System for Aerosols and
Deposition (REMSAD). REMSAD is a widely accepted, peer reviewed model developed by
EPA and used in numerous other statewide mercury TMDLs across the nation. Modeling runs
were conducted by EPA and provided to South Dakota for this TMDL analysis. The results
clearly indicated that statewide, the largest source of mercury (93%) either originates from
outside the modeling domain (continental U.S. plus parts of Canada and Mexico) or originates
within the modeling domain but is transported outside to become part of the global pool. In-state
emission sources were shown to account for only 0.12% of South Dakota’s total atmospheric
mercury deposition. The contribution of North American sources is presented in Figure 22 of the
TMDL document, and the contribution of in-state sources is summarized in Table 21 and Figure
23. The draft TMDL assumes that 30% of the total atmospheric mercury deposition is non-
anthropogenic in origin and represents natural background conditions. This characterization is in
line with other statewide mercury TMDLs and scientific literature. An analysis of NPDES point
sources was also conducted as described in Section 4.2 of this review form.
Comments: The draft TMDL meets the requirements of this review element.
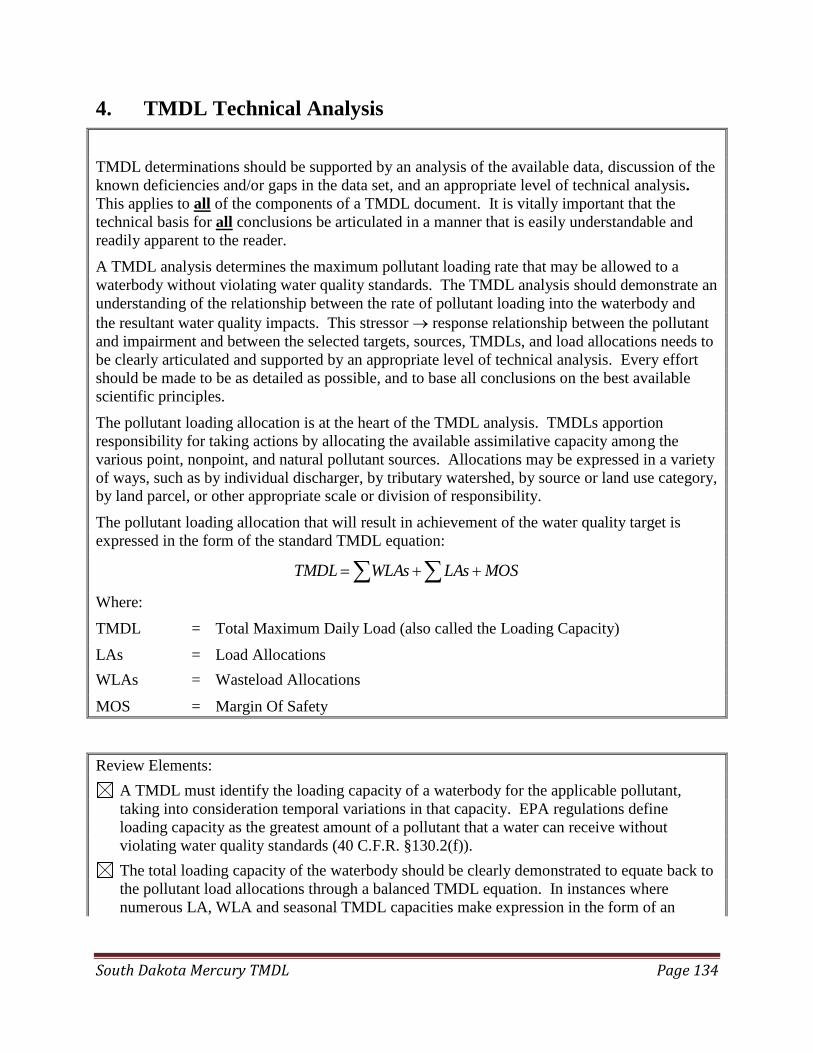
South Dakota Mercury TMDL Page 134
4. TMDL Technical Analysis
TMDL determinations should be supported by an analysis of the available data, discussion of the
known deficiencies and/or gaps in the data set, and an appropriate level of technical analysis.
This applies to all of the components of a TMDL document. It is vitally important that the
technical basis for all conclusions be articulated in a manner that is easily understandable and
readily apparent to the reader.
A TMDL analysis determines the maximum pollutant loading rate that may be allowed to a
waterbody without violating water quality standards. The TMDL analysis should demonstrate an
understanding of the relationship between the rate of pollutant loading into the waterbody and
the resultant water quality impacts. This stressor response relationship between the pollutant
and impairment and between the selected targets, sources, TMDLs, and load allocations needs to
be clearly articulated and supported by an appropriate level of technical analysis. Every effort
should be made to be as detailed as possible, and to base all conclusions on the best available
scientific principles.
The pollutant loading allocation is at the heart of the TMDL analysis. TMDLs apportion
responsibility for taking actions by allocating the available assimilative capacity among the
various point, nonpoint, and natural pollutant sources. Allocations may be expressed in a variety
of ways, such as by individual discharger, by tributary watershed, by source or land use category,
by land parcel, or other appropriate scale or division of responsibility.
The pollutant loading allocation that will result in achievement of the water quality target is
expressed in the form of the standard TMDL equation:
MOSLAsWLAsTMDL
Where:
TMDL = Total Maximum Daily Load (also called the Loading Capacity)
LAs = Load Allocations
WLAs = Wasteload Allocations
MOS = Margin Of Safety
Review Elements:
A TMDL must identify the loading capacity of a waterbody for the applicable pollutant,
taking into consideration temporal variations in that capacity. EPA regulations define
loading capacity as the greatest amount of a pollutant that a water can receive without
violating water quality standards (40 C.F.R. §130.2(f)).
The total loading capacity of the waterbody should be clearly demonstrated to equate back to
the pollutant load allocations through a balanced TMDL equation. In instances where
numerous LA, WLA and seasonal TMDL capacities make expression in the form of an
South Dakota Mercury TMDL Page 135
equation cumbersome, a table may be substituted as long as it is clear that the total TMDL
capacity equates to the sum of the allocations.
The TMDL document should describe the methodology and technical analysis used to
establish and quantify the cause-and-effect relationship between the numeric target and the
identified pollutant sources. In many instances, this method will be a water quality model.
It is necessary for EPA staff to be aware of any assumptions used in the technical analysis to
understand and evaluate the methodology used to derive the TMDL value and associated
loading allocations. Therefore, the TMDL document should contain a description of any
important assumptions (including the basis for those assumptions) made in developing the
TMDL, including but not limited to:
the spatial extent of the watershed in which the impaired waterbody is located and the
spatial extent of the TMDL technical analysis;
the distribution of land use in the watershed (e.g., urban, forested, agriculture);
a presentation of relevant information affecting the characterization of the pollutant of
concern and its allocation to sources such as population characteristics, wildlife
resources, industrial activities etc…;
present and future growth trends, if taken into consideration in determining the
TMDL and preparing the TMDL document (e.g., the TMDL could include the design
capacity of an existing or planned wastewater treatment facility);
an explanation and analytical basis for expressing the TMDL through surrogate
measures, if applicable. Surrogate measures are parameters such as percent fines and
turbidity for sediment impairments; chlorophyll a and phosphorus loadings for excess
algae; length of riparian buffer; or number of acres of best management practices.
The TMDL document should contain documentation supporting the TMDL analysis,
including an inventory of the data set used, a description of the methodology used to analyze
the data, a discussion of strengths and weaknesses in the analytical process, and the results
from any water quality modeling used. This information is necessary for EPA to review the
loading capacity determination, and the associated load, wasteload, and margin of safety
allocations.
TMDLs must take critical conditions (e.g., steam flow, loading, and water quality
parameters, seasonality, etc…) into account as part of the analysis of loading capacity (40
C.F.R. §130.7(c)(1) ). TMDLs should define applicable critical conditions and describe the
approach used to determine both point and nonpoint source loadings under such critical
conditions. In particular, the document should discuss the approach used to compute and
allocate nonpoint source loadings, e.g., meteorological conditions and land use distribution.
Where both nonpoint sources and NPDES permitted point sources are included in the TMDL
loading allocation, and attainment of the TMDL target depends on reductions in the nonpoint
source loads, the TMDL document must include a demonstration that nonpoint source
loading reductions needed to implement the load allocations are actually practicable [40 CFR
130.2(i) and 122.44(d)].
Recommendation:
Approve Partial Approval Disapprove Insufficient Information

South Dakota Mercury TMDL Page 136
Summary: Due to the statewide nature of this TMDL, the loading capacity was developed at the
statewide scale, however, the TMDL is still written to meet water quality standards in individual
waters. The State demonstrated this by relating the loading capacity back to numeric water
quality criteria. Conservative decisions made throughout the process, such as selecting the 90th
percentile standard length fish tissue concentration for reduction factor purposes, result in a
statewide TMDL that may be more protective than necessary to meet water quality standards in
some waters.
The TMDL capacity clearly equates to the sum of the allocations and can be simplified as:
Implicit MOS (0 kg/yr) + WLA (2.53 kg/yr) + LA (592.79 kg/yr) = TMDL (595.32 kg/yr). This
balanced TMDL equation, additional source category breakouts, and derivation steps are
included in Section 10.0 of the TMDL document.
Comments: The draft TMDL meets the requirements of this review element.
4.1 Data Set Description
TMDL documents should include a thorough description and summary of all available water
quality data that are relevant to the water quality assessment and TMDL analysis. An inventory
of the data used for the TMDL analysis should be provided to document, for the record, the data
used in decision making. This also provides the reader with the opportunity to independently
review the data. The TMDL analysis should make use of all readily available data for the
waterbody under analysis unless the TMDL writer determines that the data are not relevant or
appropriate. For relevant data that were known but rejected, an explanation of why the data were
not utilized should be provided (e.g., samples exceeded holding times, data collected prior to a
specific date were not considered timely, etc…).
Review Elements:
TMDL documents should include a thorough description and summary of all available water
quality data that are relevant to the water quality assessment and TMDL analysis such that
the water quality impairments are clearly defined and linked to the impaired beneficial uses
and appropriate water quality criteria.
The TMDL document submitted should be accompanied by the data set utilized during the
TMDL analysis. If possible, it is preferred that the data set be provided in an electronic
format and referenced in the document. If electronic submission of the data is not possible,
the data set may be included as an appendix to the document.
Recommendation:
Approve Partial Approval Disapprove Insufficient Information
Summary: The majority of information used during the TMDL analysis is included as
appendices to the TMDL document. Appendix B contains figures displaying mercury deposition
results from each of the 10 deposition monitoring stations installed throughout the state. South
Dakota relied upon this information to calculate the existing statewide atmospheric mercury
deposition load. Appendix C contains regression equations and standard length fish tissue
concentrations listed individually for each waterbody and year that data is available. South
South Dakota Mercury TMDL Page 137
Dakota used this standard length fish tissue concentration dataset to derive the TMDL reduction
goal. Finally, Appendix D summarizes the individual fish tissue dataset collected from 1994-
2014.
Comments: The sites identified in Appendix C and D, and the data associated with those sites,
are not easily related back to waterbody segments or assessment units. For example, some sites
listed in the appendices do not match waterbody names provided in the 2014 Integrated Report
and the appendices do not identify assessment unit IDs (AUIDs). EPA recommends adding
AUIDs to the data tables in Appendix C and D, and using consistent waterbody names
between the TMDL document and the Integrated Report. Additionally, while Appendix D
summarizes the fish tissue dataset, the TMDL does not provide the complete dataset of
individual fish tissue samples. EPA recommends the TMDL include the complete dataset of
individual fish tissue methylmercury samples. If the individual fish tissue sample dataset is
too large to easily include as an appendix, it should be provided electronically or noted that it is
available by request.
SDDENR Response: This TMDL utilized all available fish tissue data from within the state.
Some of the data was collected as a part of research projects from small private rearing and
hatching ponds as well as fish hatcheries that are not included in the state Integrated Report. The
data for these sites was included in the appendix and in lieu of an AUID, those sites state
“NOAUID” followed by the site name. Any dataset used in South Dakotas TMDLs can be
provided upon request.
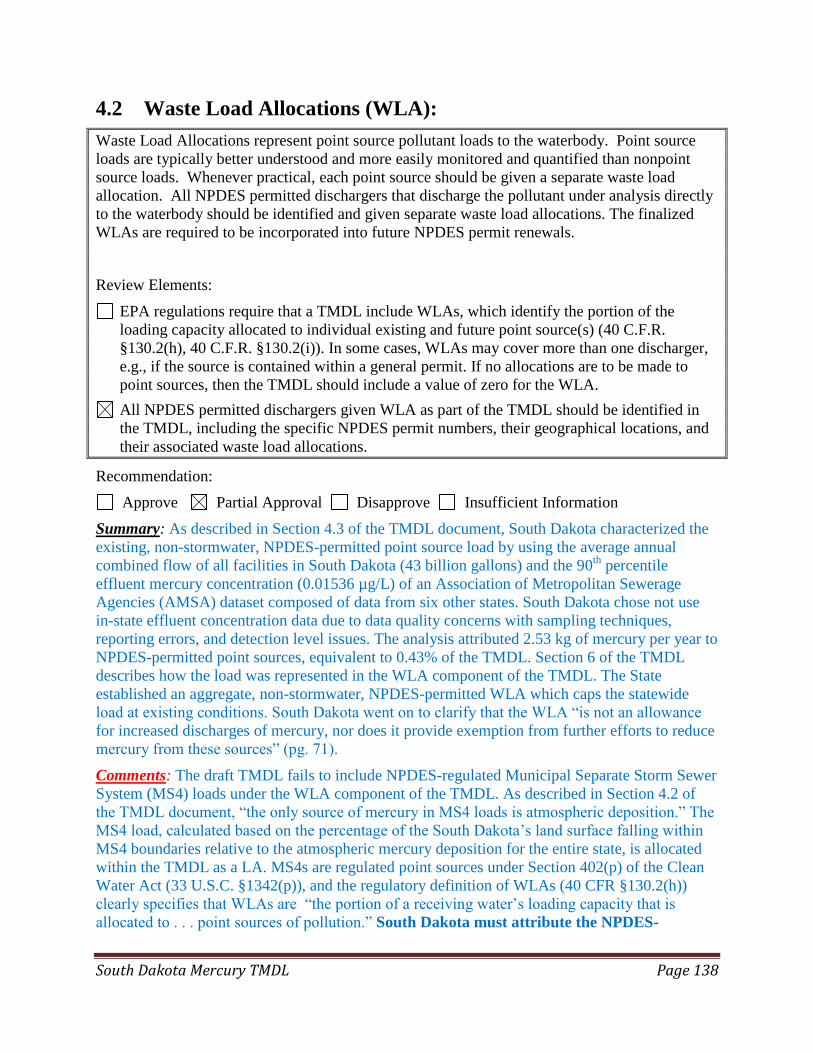
South Dakota Mercury TMDL Page 138
4.2 Waste Load Allocations (WLA):
Waste Load Allocations represent point source pollutant loads to the waterbody. Point source
loads are typically better understood and more easily monitored and quantified than nonpoint
source loads. Whenever practical, each point source should be given a separate waste load
allocation. All NPDES permitted dischargers that discharge the pollutant under analysis directly
to the waterbody should be identified and given separate waste load allocations. The finalized
WLAs are required to be incorporated into future NPDES permit renewals.
Review Elements:
EPA regulations require that a TMDL include WLAs, which identify the portion of the
loading capacity allocated to individual existing and future point source(s) (40 C.F.R.
§130.2(h), 40 C.F.R. §130.2(i)). In some cases, WLAs may cover more than one discharger,
e.g., if the source is contained within a general permit. If no allocations are to be made to
point sources, then the TMDL should include a value of zero for the WLA.
All NPDES permitted dischargers given WLA as part of the TMDL should be identified in
the TMDL, including the specific NPDES permit numbers, their geographical locations, and
their associated waste load allocations.
Recommendation:
Approve Partial Approval Disapprove Insufficient Information
Summary: As described in Section 4.3 of the TMDL document, South Dakota characterized the
existing, non-stormwater, NPDES-permitted point source load by using the average annual
combined flow of all facilities in South Dakota (43 billion gallons) and the 90th
percentile
effluent mercury concentration (0.01536 µg/L) of an Association of Metropolitan Sewerage
Agencies (AMSA) dataset composed of data from six other states. South Dakota chose not use
in-state effluent concentration data due to data quality concerns with sampling techniques,
reporting errors, and detection level issues. The analysis attributed 2.53 kg of mercury per year to
NPDES-permitted point sources, equivalent to 0.43% of the TMDL. Section 6 of the TMDL
describes how the load was represented in the WLA component of the TMDL. The State
established an aggregate, non-stormwater, NPDES-permitted WLA which caps the statewide
load at existing conditions. South Dakota went on to clarify that the WLA “is not an allowance
for increased discharges of mercury, nor does it provide exemption from further efforts to reduce
mercury from these sources” (pg. 71).
Comments: The draft TMDL fails to include NPDES-regulated Municipal Separate Storm Sewer
System (MS4) loads under the WLA component of the TMDL. As described in Section 4.2 of
the TMDL document, “the only source of mercury in MS4 loads is atmospheric deposition.” The
MS4 load, calculated based on the percentage of the South Dakota’s land surface falling within
MS4 boundaries relative to the atmospheric mercury deposition for the entire state, is allocated
within the TMDL as a LA. MS4s are regulated point sources under Section 402(p) of the Clean
Water Act (33 U.S.C. §1342(p)), and the regulatory definition of WLAs (40 CFR §130.2(h))
clearly specifies that WLAs are “the portion of a receiving water’s loading capacity that is
allocated to . . . point sources of pollution.” South Dakota must attribute the NPDES-
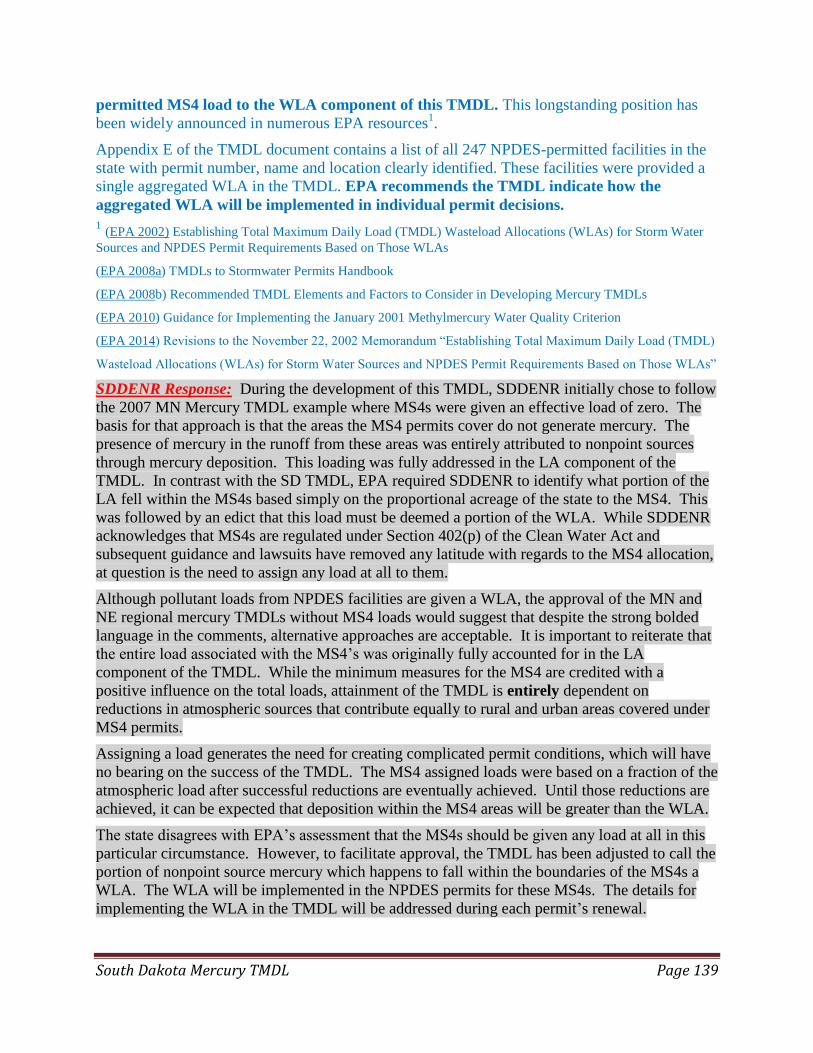
South Dakota Mercury TMDL Page 139
permitted MS4 load to the WLA component of this TMDL. This longstanding position has
been widely announced in numerous EPA resources1.
Appendix E of the TMDL document contains a list of all 247 NPDES-permitted facilities in the
state with permit number, name and location clearly identified. These facilities were provided a
single aggregated WLA in the TMDL. EPA recommends the TMDL indicate how the
aggregated WLA will be implemented in individual permit decisions.
1 (EPA 2002) Establishing Total Maximum Daily Load (TMDL) Wasteload Allocations (WLAs) for Storm Water
Sources and NPDES Permit Requirements Based on Those WLAs
(EPA 2008a) TMDLs to Stormwater Permits Handbook
(EPA 2008b) Recommended TMDL Elements and Factors to Consider in Developing Mercury TMDLs
(EPA 2010) Guidance for Implementing the January 2001 Methylmercury Water Quality Criterion
(EPA 2014) Revisions to the November 22, 2002 Memorandum “Establishing Total Maximum Daily Load (TMDL)
Wasteload Allocations (WLAs) for Storm Water Sources and NPDES Permit Requirements Based on Those WLAs”
SDDENR Response: During the development of this TMDL, SDDENR initially chose to follow
the 2007 MN Mercury TMDL example where MS4s were given an effective load of zero. The
basis for that approach is that the areas the MS4 permits cover do not generate mercury. The
presence of mercury in the runoff from these areas was entirely attributed to nonpoint sources
through mercury deposition. This loading was fully addressed in the LA component of the
TMDL. In contrast with the SD TMDL, EPA required SDDENR to identify what portion of the
LA fell within the MS4s based simply on the proportional acreage of the state to the MS4. This
was followed by an edict that this load must be deemed a portion of the WLA. While SDDENR
acknowledges that MS4s are regulated under Section 402(p) of the Clean Water Act and
subsequent guidance and lawsuits have removed any latitude with regards to the MS4 allocation,
at question is the need to assign any load at all to them.
Although pollutant loads from NPDES facilities are given a WLA, the approval of the MN and
NE regional mercury TMDLs without MS4 loads would suggest that despite the strong bolded
language in the comments, alternative approaches are acceptable. It is important to reiterate that
the entire load associated with the MS4’s was originally fully accounted for in the LA
component of the TMDL. While the minimum measures for the MS4 are credited with a
positive influence on the total loads, attainment of the TMDL is entirely dependent on
reductions in atmospheric sources that contribute equally to rural and urban areas covered under
MS4 permits.
Assigning a load generates the need for creating complicated permit conditions, which will have
no bearing on the success of the TMDL. The MS4 assigned loads were based on a fraction of the
atmospheric load after successful reductions are eventually achieved. Until those reductions are
achieved, it can be expected that deposition within the MS4 areas will be greater than the WLA.
The state disagrees with EPA’s assessment that the MS4s should be given any load at all in this
particular circumstance. However, to facilitate approval, the TMDL has been adjusted to call the
portion of nonpoint source mercury which happens to fall within the boundaries of the MS4s a
WLA. The WLA will be implemented in the NPDES permits for these MS4s. The details for
implementing the WLA in the TMDL will be addressed during each permit’s renewal.
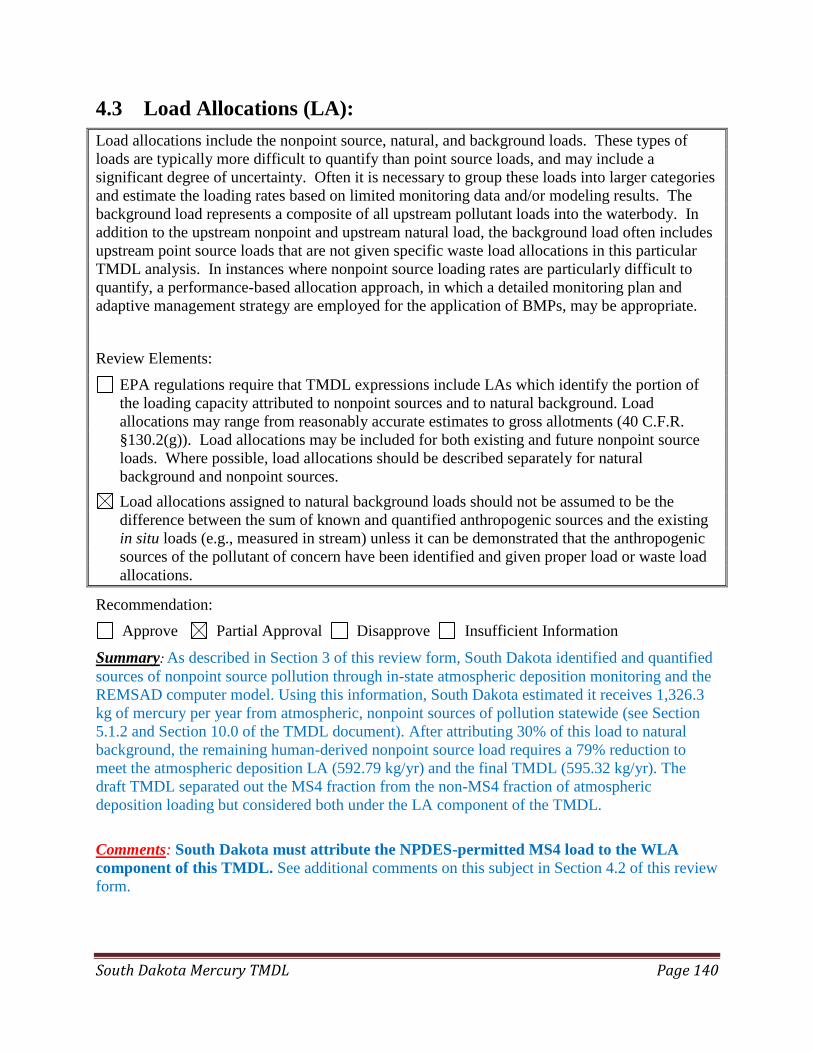
South Dakota Mercury TMDL Page 140
4.3 Load Allocations (LA):
Load allocations include the nonpoint source, natural, and background loads. These types of
loads are typically more difficult to quantify than point source loads, and may include a
significant degree of uncertainty. Often it is necessary to group these loads into larger categories
and estimate the loading rates based on limited monitoring data and/or modeling results. The
background load represents a composite of all upstream pollutant loads into the waterbody. In
addition to the upstream nonpoint and upstream natural load, the background load often includes
upstream point source loads that are not given specific waste load allocations in this particular
TMDL analysis. In instances where nonpoint source loading rates are particularly difficult to
quantify, a performance-based allocation approach, in which a detailed monitoring plan and
adaptive management strategy are employed for the application of BMPs, may be appropriate.
Review Elements:
EPA regulations require that TMDL expressions include LAs which identify the portion of
the loading capacity attributed to nonpoint sources and to natural background. Load
allocations may range from reasonably accurate estimates to gross allotments (40 C.F.R.
§130.2(g)). Load allocations may be included for both existing and future nonpoint source
loads. Where possible, load allocations should be described separately for natural
background and nonpoint sources.
Load allocations assigned to natural background loads should not be assumed to be the
difference between the sum of known and quantified anthropogenic sources and the existing
in situ loads (e.g., measured in stream) unless it can be demonstrated that the anthropogenic
sources of the pollutant of concern have been identified and given proper load or waste load
allocations.
Recommendation:
Approve Partial Approval Disapprove Insufficient Information
Summary: As described in Section 3 of this review form, South Dakota identified and quantified
sources of nonpoint source pollution through in-state atmospheric deposition monitoring and the
REMSAD computer model. Using this information, South Dakota estimated it receives 1,326.3
kg of mercury per year from atmospheric, nonpoint sources of pollution statewide (see Section
5.1.2 and Section 10.0 of the TMDL document). After attributing 30% of this load to natural
background, the remaining human-derived nonpoint source load requires a 79% reduction to
meet the atmospheric deposition LA (592.79 kg/yr) and the final TMDL (595.32 kg/yr). The
draft TMDL separated out the MS4 fraction from the non-MS4 fraction of atmospheric
deposition loading but considered both under the LA component of the TMDL.
Comments: South Dakota must attribute the NPDES-permitted MS4 load to the WLA
component of this TMDL. See additional comments on this subject in Section 4.2 of this review
form.
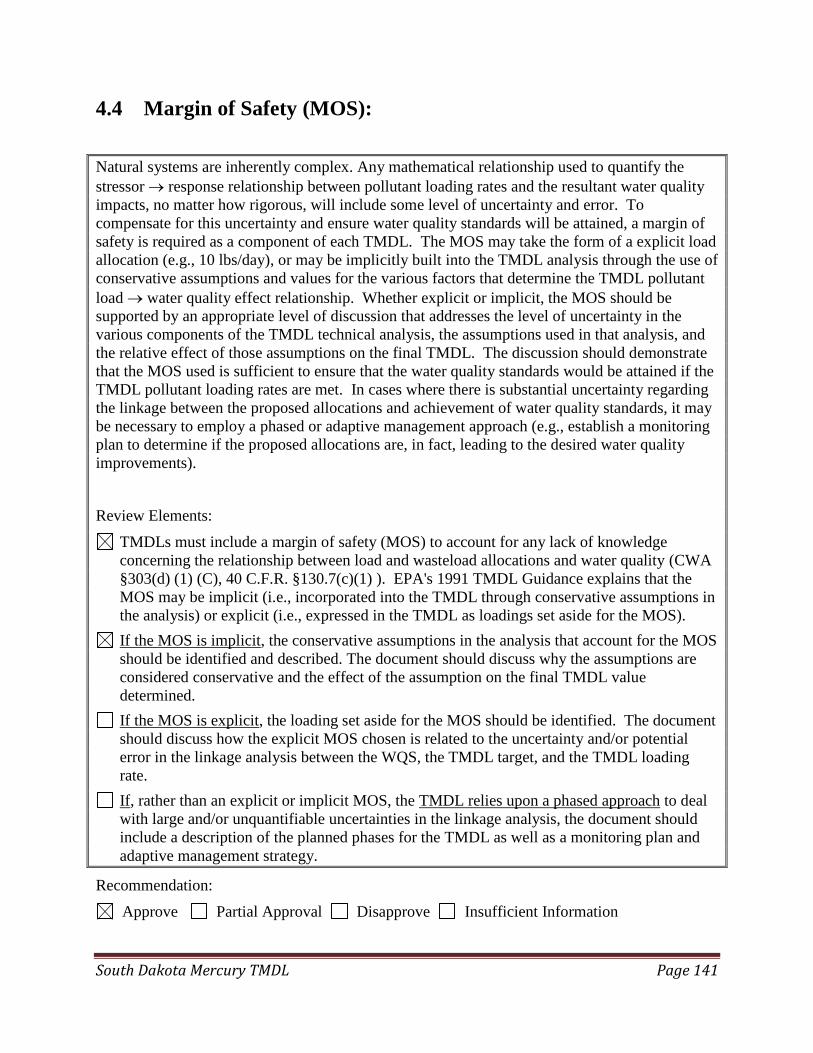
South Dakota Mercury TMDL Page 141
4.4 Margin of Safety (MOS):
Natural systems are inherently complex. Any mathematical relationship used to quantify the
stressor response relationship between pollutant loading rates and the resultant water quality
impacts, no matter how rigorous, will include some level of uncertainty and error. To
compensate for this uncertainty and ensure water quality standards will be attained, a margin of
safety is required as a component of each TMDL. The MOS may take the form of a explicit load
allocation (e.g., 10 lbs/day), or may be implicitly built into the TMDL analysis through the use of
conservative assumptions and values for the various factors that determine the TMDL pollutant
load water quality effect relationship. Whether explicit or implicit, the MOS should be
supported by an appropriate level of discussion that addresses the level of uncertainty in the
various components of the TMDL technical analysis, the assumptions used in that analysis, and
the relative effect of those assumptions on the final TMDL. The discussion should demonstrate
that the MOS used is sufficient to ensure that the water quality standards would be attained if the
TMDL pollutant loading rates are met. In cases where there is substantial uncertainty regarding
the linkage between the proposed allocations and achievement of water quality standards, it may
be necessary to employ a phased or adaptive management approach (e.g., establish a monitoring
plan to determine if the proposed allocations are, in fact, leading to the desired water quality
improvements).
Review Elements:
TMDLs must include a margin of safety (MOS) to account for any lack of knowledge
concerning the relationship between load and wasteload allocations and water quality (CWA
§303(d) (1) (C), 40 C.F.R. §130.7(c)(1) ). EPA's 1991 TMDL Guidance explains that the
MOS may be implicit (i.e., incorporated into the TMDL through conservative assumptions in
the analysis) or explicit (i.e., expressed in the TMDL as loadings set aside for the MOS).
If the MOS is implicit, the conservative assumptions in the analysis that account for the MOS
should be identified and described. The document should discuss why the assumptions are
considered conservative and the effect of the assumption on the final TMDL value
determined.
If the MOS is explicit, the loading set aside for the MOS should be identified. The document
should discuss how the explicit MOS chosen is related to the uncertainty and/or potential
error in the linkage analysis between the WQS, the TMDL target, and the TMDL loading
rate.
If, rather than an explicit or implicit MOS, the TMDL relies upon a phased approach to deal
with large and/or unquantifiable uncertainties in the linkage analysis, the document should
include a description of the planned phases for the TMDL as well as a monitoring plan and
adaptive management strategy.
Recommendation:
Approve Partial Approval Disapprove Insufficient Information

South Dakota Mercury TMDL Page 142
Summary: South Dakota used an implicit margin of safety for this TMDL. As described in
Section 8.0 of the TMDL document, the TMDL incorporated conservative approaches at
numerous steps of the TMDL development such as:
Resampling waters with elevated fish tissue methylmercury concentrations more
frequently than other waters. As a result, the fish tissue dataset is biased to egregiously
impaired waters and the statewide TMDL’s reduction factor is potentially greater than
necessary for many waters.
Focusing target attainment within a top predator species (walleye) where methylmercury
concentrations and bioaccumulation rates are highest. This protects all other fish species.
Selecting the 90th
percentile standard length fish concentration to represent existing
conditions overestimates the loading reductions needed for many waters.
Comparing fish tissue analyzed for total mercury concentration directly to the
methylmercury TMDL target for listing decisions and TMDL calculations. This affords a
level of protection because measurements of total mercury include other forms of
mercury in addition to methylmercury.
Setting allocations without accounting for reductions in sulfur emissions realized under
the Clean Air Act which is expected to affect sulfate-reducing bacteria and lower
methylation rates.
Comments: The draft TMDL meets the requirements of this review element.
South Dakota Mercury TMDL Page 143
4.5 Seasonality and variations in assimilative capacity:
The TMDL relationship is a factor of both the loading rate of the pollutant to the waterbody and
the amount of pollutant the waterbody can assimilate and still attain water quality standards.
Water quality standards often vary based on seasonal considerations. Therefore, it is appropriate
that the TMDL analysis consider seasonal variations, such as critical flow periods (high flow,
low flow), when establishing TMDLs, targets, and allocations.
Review Elements:
The statute and regulations require that a TMDL be established with consideration of
seasonal variations. The TMDL must describe the method chosen for including seasonal
variability as a factor. (CWA §303(d)(1)(C), 40 C.F.R. §130.7(c)(1) ).
Recommendation:
Approve Partial Approval Disapprove Insufficient Information
Summary: Critical conditions and seasonal variation are summarized in Section 9.0 of the
TMDL document. South Dakota supported a monitoring network of mercury deposition stations
across the state for multiple years to explore temporal and geospatial differences in mercury
deposition. Results indicated a positive relationship between deposition and precipitation, and an
average annual deposition rate of 6.64 µg/m2
with a range of 3.43 - 9.13 µg/m2. South Dakota
reviewed atmospheric mercury deposition patterns and the fish tissue dataset, and decided that a
single statewide TMDL was representative and appropriate for the entire state. The TMDL is
presented in both an annual and daily loading expression. The use of a fish tissue concentration
for a TMDL target inherently includes a seasonality component because tissue concentrations are
the product of bioaccumulation throughout a fish’s lifespan.
South Dakota also investigated various water quality and watershed factors in Section 3.4 of the
TMDL document and found that while Secchi depth, wetland abundance, and lake level
variability affected methylation rates, the only viable solution to resolving mercury impairments
is to control emissions and reduce inputs from atmospheric deposition. Additionally, sediment
cores from ten lakes were reviewed for insight into mercury loading trends but no conclusions
were drawn. The results indicated that mercury concentrations in upper lakebed sediments was
highly variable.
Comments: The draft TMDL meets the requirements of this review element.
South Dakota Mercury TMDL Page 144
5. Public Participation
EPA regulations require that the establishment of TMDLs be conducted in a process open to the
public, and that the public be afforded an opportunity to participate. To meaningfully participate
in the TMDL process it is necessary that stakeholders, including members of the general public,
be able to understand the problem and the proposed solution. TMDL documents should include
language that explains the issues to the general public in understandable terms, as well as
provides additional detailed technical information for the scientific community. Notifications or
solicitations for comments regarding the TMDL should be made available to the general public,
widely circulated, and clearly identify the product as a TMDL and the fact that it will be
submitted to EPA for review. When the final TMDL is submitted to EPA for approval, a copy of
the comments received by the state and the state responses to those comments should be included
with the document.
Review Elements:
The TMDL must include a description of the public participation process used during the
development of the TMDL (40 C.F.R. §130.7(c)(1)(ii) ).
TMDLs submitted to EPA for review and approval should include a summary of significant
comments and the State's/Tribe's responses to those comments.
Recommendation:
Approve Partial Approval Disapprove Insufficient Information
Summary: Section 13.0 of the TMDL document states that the document will be updated to
reflect the media outlets used to announce the public comment period and indicates that the final
document will include responses to public comments. In the current draft TMDL document,
Section 13 highlights resources the general public may use to find more information on fish
consumption advisories.
Comments: EPA expects the final TMDL to include a full description of the public participation
process such as where the document was public noticed, what time period it was public noticed,
and what process was used to submit public comments.
SDDENR Response: This section has been updated to reflect the public outreach conducted by
SDDENR. No comments or inquiries were received outside of those provided by EPA.

South Dakota Mercury TMDL Page 145
6. Monitoring Strategy
TMDLs may have significant uncertainty associated with the selection of appropriate numeric
targets and estimates of source loadings and assimilative capacity. In these cases, a phased
TMDL approach may be necessary. For Phased TMDLs, it is EPA’s expectation that a
monitoring plan will be included as a component of the TMDL document to articulate the means
by which the TMDL will be evaluated in the field, and to provide for future supplemental data
that will address any uncertainties that may exist when the document is prepared.
Review Elements:
When a TMDL involves both NPDES permitted point source(s) and nonpoint source(s)
allocations, and attainment of the TMDL target depends on reductions in the nonpoint source
loads, the TMDL document should include a monitoring plan that describes the additional
data to be collected to determine if the load reductions provided for in the TMDL are
occurring.
Under certain circumstances, a phased TMDL approach may be utilized when limited
existing data are relied upon to develop a TMDL, and the State believes that the use of
additional data or data based on better analytical techniques would likely increase the
accuracy of the TMDL load calculation and merit development of a second phase TMDL.
EPA recommends that a phased TMDL document or its implementation plan include a
monitoring plan and a scheduled timeframe for revision of the TMDL. These elements would
not be an intrinsic part of the TMDL and would not be approved by EPA, but may be
necessary to support a rationale for approving the TMDL.
http://www.epa.gov/owow/tmdl/tmdl_clarification_letter.pdf
Recommendation:
Approve Partial Approval Disapprove Insufficient Information
Summary: Section 12.0 of the TMDL document identifies and describes three monitoring
categories to address data gaps and evaluate progress towards meeting the TMDL target. The
three categories of mercury monitoring are atmospheric deposition, fish tissue, and water
column.
Comments: South Dakota chose to use mercury concentrations from a 1999 AMSA study to
represent the existing, non-stormwater, NPDES-permitted load instead of using in-state effluent
data due to concerns with the South Dakota dataset (see Section 4.2 of this review form). As
noted on page 80 of the TMDL document, “Improved water column monitoring at NPDES
facilities is necessary to better characterize their contributions to the total mercury load in the
state.” EPA agrees with this statement and encourages additional monitoring to better
characterize the point source load.
SDDENR Response: Of primary concern with the data was the use of testing methods with
insufficient resolution to capture the low levels of mercury potentially present. Section 12.3
elaborates in greater detail the changes that will help address this issue.

South Dakota Mercury TMDL Page 146
7. Restoration Strategy
The overall purpose of the TMDL analysis is to determine what actions are necessary to ensure
that the pollutant load in a waterbody does not result in water quality impairment. Adding
additional detail regarding the proposed approach for the restoration of water quality is not
currently a regulatory requirement, but is considered a value added component of a TMDL
document. During the TMDL analytical process, information is often gained that may serve to
point restoration efforts in the right direction and help ensure that resources are spent in the most
efficient manner possible. For example, watershed models used to analyze the linkage between
the pollutant loading rates and resultant water quality impacts might also be used to conduct
“what if” scenarios to help direct BMP installations to locations that provide the greatest
pollutant reductions. Once a TMDL has been written and approved, it is often the responsibility
of other water quality programs to see that it is implemented. The level of quality and detail
provided in the restoration strategy will greatly influence the future success in achieving the
needed pollutant load reductions.
Review Elements:
EPA is not required to and does not approve TMDL implementation plans. However, in
cases where a WLA is dependent upon the achievement of a LA, “reasonable assurance” is
required to demonstrate the necessary LA called for in the document is practicable). A
discussion of the BMPs (or other load reduction measures) that are to be relied upon to
achieve the LA(s), and programs and funding sources that will be relied upon to implement
the load reductions called for in the document, may be included in the
implementation/restoration section of the TMDL document to support a demonstration of
“reasonable assurance”.
Recommendation:
Approve Partial Approval Disapprove Insufficient Information
Summary: The TMDL loading analysis showed that nonpoint sources outside of South Dakota
account for over 99% of the mercury loading to state waterbodies. As a result, the TMDL
requires all reductions to occur through the LA and stresses the importance of national and
international regulatory controls on mercury emissions such as the U.S. Mercury Air Toxics
Standards Rule and the United Nations Minamata Convention Agreement. South Dakota also
highlighted recent emission reductions observed at two South Dakota coal power plants (Ben
French and SDSU) and in-state efforts to recycle mercury-containing solid waste products and
avoid releases of mercury from these products into the environment.
Comments:

South Dakota Mercury TMDL Page 147
8. Daily Loading Expression
The goal of a TMDL analysis is to determine what actions are necessary to attain and maintain
WQS. The appropriate averaging period that corresponds to this goal will vary depending on the
pollutant and the nature of the waterbody under analysis. When selecting an appropriate
averaging period for a TMDL analysis, primary concern should be given to the nature of the
pollutant in question and the achievement of the underlying WQS. However, recent federal
appeals court decisions have pointed out that the title TMDL implies a “daily” loading rate.
While the most appropriate averaging period to be used for developing a TMDL analysis may
vary according to the pollutant, a daily loading rate can provide a more practical indication of
whether or not the overall needed load reductions are being achieved. When limited monitoring
resources are available, a daily loading target that takes into account the natural variability of the
system can serve as a useful indicator for whether or not the overall load reductions are likely to
be met. Therefore, a daily expression of the required pollutant loading rate is a required element
in all TMDLs, in addition to any other load averaging periods that may have been used to
conduct the TMDL analysis. The level of effort spent to develop the daily load indicator should
be based on the overall utility it can provide as an indicator for the total load reductions needed.
Review Elements:
The document should include an expression of the TMDL in terms of a daily load. However,
the TMDL may also be expressed in temporal terms other than daily (e.g., an annual or
monthly load). If the document expresses the TMDL in additional “non-daily” terms the
document should explain why it is appropriate or advantageous to express the TMDL in the
additional unit of measurement chosen.
Recommendation:
Approve Partial Approval Disapprove Insufficient Information
Summary: South Dakota presented the statewide mercury TMDL as both an annual and a daily
loading expression. The document notes that an annual load is most appropriate due to
characteristics of the pollutant (i.e., mercury levels in fish represent bioaccumulation over longer
period of time, impairments are often long-term and persistent, etc.) and because setting loads at
a yearly timescale incorporates the seasonal precipitation patterns that influence atmospheric
mercury deposition. South Dakota used the TSD method to derive a total maximum daily load
from the annual load.
Comments: The equation on page 75 of the TMDL document used to derive a daily load is
incorrect. EPA recommends South Dakota correct the error in the daily loading calculation.
SDDENR Response: The equation and results were corrected.