south dakota projected industry employment trends to...
TRANSCRIPT
South Dakota projected industry employment trends to 2020
From the July 2012 South Dakota e-Labor Bulletin
The 2010-2020 round of South Dakota worker projections by class of worker and industry were recently completed by the Labor Market Information Center (LMIC). Historical time-series data and state and national economic trends were used as variables in various statistical models to project workforce levels. (A general assumption is made that no major catastrophic events or natural disasters that would significantly affect economic activities of these industries will occur during the projection period.)
A look at which types of industries are growing, and which are not, provides a synopsis of the economy as a whole. The general outlook for South Dakota is characterized by job growth in the coming decade as our state recovers from the recession. On the national level, many ponder whether the nation will experience a double-dip recession and a stagnated economy or just show slow but continued growth. Any of these situations couldaffect South Dakota's projected outlook.
From 2010 to 2020, the total number of workers in South Dakota is projected to increase by 41,145 (or 8.9 percent) to a total of 504,120 workers. On the national level, the total employment level is expected to increase by 20.5 million jobs (or 14 percent). The national growth rate is quite a bit higher than South Dakota's rate as the U.S. was hit quite a bit harder with job losses during the recession. Therefore, the national projections include a higher rate to account for recovery from the recession. Referencing the official recession period as determined by the National Bureau of Economic Research (NBER), which is December 2007 through June 2009, the seasonally adjusted nonfarm worker level on a national basis was roughly 7.5 million jobs (5.4 percent). Despite the official end of the recession, non-farm employment declined by another 1.2 million until reaching a trough in February 2010.
During the official recession period, South Dakota lost 4,400 jobs (1.1 percent). However, as the recession hit South Dakota a bit later than the nation as a whole, between the recessionary peak and trough for our state, there was a seasonally adjusted loss of approximately 7,800 workers (1.9 percent).
The South Dakota projections include three categories of workers:
Nonfarm self-employed and unpaid family workers
Agriculture and related workers (farm employment)
Nonfarm wage and salaried workers
The nonfarm wage and salaried workers category includes only those wage and salaried workers who are covered under the South Dakota Unemployment Insurance program and those who work for non-profit organizations, such as private colleges and religious organizations. This category is the major component in South Dakota making up 86.9 percent of the workforce. The nonfarm wage and salaried workers category is also projected to grow the most to 9.9 percent by 2020.
July 2012
Labor Market Information Center SD Department of Labor & Regulation
South Dakota e-Labor Bulletin July 2012
Page 1 of 25
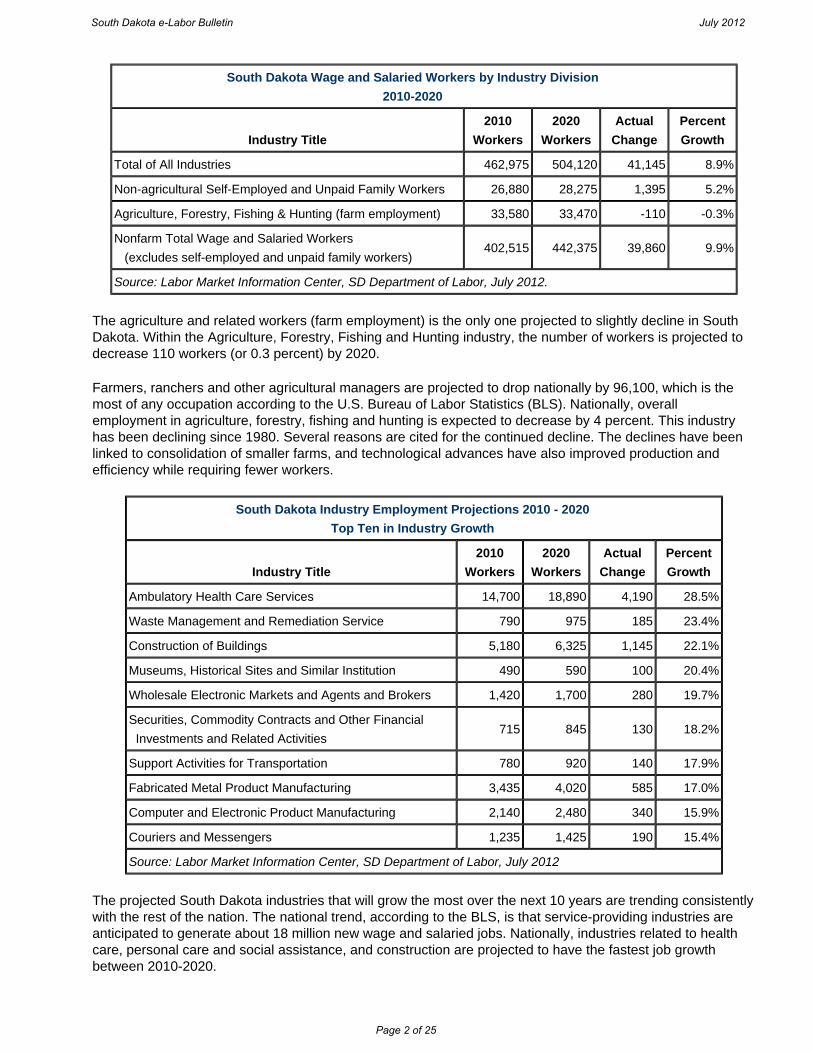
The agriculture and related workers (farm employment) is the only one projected to slightly decline in South Dakota. Within the Agriculture, Forestry, Fishing and Hunting industry, the number of workers is projected to decrease 110 workers (or 0.3 percent) by 2020.
Farmers, ranchers and other agricultural managers are projected to drop nationally by 96,100, which is the most of any occupation according to the U.S. Bureau of Labor Statistics (BLS). Nationally, overall employment in agriculture, forestry, fishing and hunting is expected to decrease by 4 percent. This industry has been declining since 1980. Several reasons are cited for the continued decline. The declines have been linked to consolidation of smaller farms, and technological advances have also improved production and efficiency while requiring fewer workers.
The projected South Dakota industries that will grow the most over the next 10 years are trending consistently with the rest of the nation. The national trend, according to the BLS, is that service-providing industries are anticipated to generate about 18 million new wage and salaried jobs. Nationally, industries related to health care, personal care and social assistance, and construction are projected to have the fastest job growth between 2010-2020.
South Dakota Wage and Salaried Workers by Industry Division
2010-2020
Industry Title
2010
Workers
2020
Workers
Actual
Change
Percent
Growth
Total of All Industries 462,975 504,120 41,145 8.9%
Non-agricultural Self-Employed and Unpaid Family Workers 26,880 28,275 1,395 5.2%
Agriculture, Forestry, Fishing & Hunting (farm employment) 33,580 33,470 -110 -0.3%
Nonfarm Total Wage and Salaried Workers
(excludes self-employed and unpaid family workers)402,515 442,375 39,860 9.9%
Source: Labor Market Information Center, SD Department of Labor, July 2012.
South Dakota Industry Employment Projections 2010 - 2020
Top Ten in Industry Growth
Industry Title
2010
Workers
2020
Workers
Actual
Change
Percent
Growth
Ambulatory Health Care Services 14,700 18,890 4,190 28.5%
Waste Management and Remediation Service 790 975 185 23.4%
Construction of Buildings 5,180 6,325 1,145 22.1%
Museums, Historical Sites and Similar Institution 490 590 100 20.4%
Wholesale Electronic Markets and Agents and Brokers 1,420 1,700 280 19.7%
Securities, Commodity Contracts and Other Financial
Investments and Related Activities715 845 130 18.2%
Support Activities for Transportation 780 920 140 17.9%
Fabricated Metal Product Manufacturing 3,435 4,020 585 17.0%
Computer and Electronic Product Manufacturing 2,140 2,480 340 15.9%
Couriers and Messengers 1,235 1,425 190 15.4%
Source: Labor Market Information Center, SD Department of Labor, July 2012
South Dakota e-Labor Bulletin July 2012
Page 2 of 25

Ambulatory Health Care Services
In South Dakota, the number of workers employed in the Ambulatory Health Care Services subsector is projected to increase by 4,190 workers (or 28.5 percent) over the next 10 years. The aging population and advancements in medical technologies will help ensure continued worker growth within the health care services industry, especially for hospitals. This subsector belongs to the Health Care and Social Assistance industry which is expected to grow nationally by 5.7 million new jobs (or 33 percent). The continuing shift from inpatient care to outpatient treatment will boost worker growth in health practitioner offices as well. Nursing and residential care facilities are also expected to have strong growth due to South Dakota's growing elderly population and extended life expectancies.
Waste Management and Remediation Service
The Waste Management and Remediation Services industry in South Dakota is projected to increase by 185 workers (or 23.4 percent) by 2020. Nationally, this subsector is expected to grow 35 percent by 2020. This subsector group is engaged in the collection, treatment, and disposal of waste materials. Growth in this industry is driven by the need for seasonal and temporary workers. Another factor driving the growth of this category is an increasing population and privatization of waste collection services.
Construction of Buildings
The Construction industry in South Dakota is projected to increase worker levels by 1,145 (or 22.1 percent). The 22.1 percent growth is actually much lower than historical patterns due to the recession's toll on the industry in 2009 to 2010. Nationally, the Construction and Extraction industry is projected to grow 22 percent, adding about 1.4 million new jobs over the 2010-2020 period. Job growth will result from increased construction of homes and office buildings, as well as from remodeling projects and the repair and replacement of the nation's infrastructure. Even if the South Dakota and national economies do not experience robust growth in the next 10 years, the continued shifts in county populations from internal migration will keep construction demand up to some degree.
Museums, Historical Sites and Similar Institution
Worker levels in the Museums, Historical Sites and Similar Institutions industry are projected to increase by 100 workers (or 20.4 percent). The growth of this subsector in South Dakota is driven by the retirement of more baby boomers. With the increased retirement rates of the baby boomers, travel and other leisure activities will also increase. This increase will also impact other businesses including casinos, golf courses and amusement establishments.
Wholesale Electronic Markets and Agents and Brokers
The number of Wholesale Electronic Markets and Agents and Brokers is projecting an increase of 280 workers (or 19.7 percent) over the next 10 years in South Dakota. Nationally, according to the BLS, this subsector is expected to see the most growth of the wholesale industry, adding 342,100 new jobs. The Wholesale Trade industry as a whole is nationally projected to add 744,100 jobs (14 percent). Wholesale trade involves businesses providing goods and services to other businesses, not consumers. As long as there is expansion in other industries, there will also be expansion in wholesale trade.
Securities, Commodity Contracts and Other Financial Investments and Related Activities
This subsector of the Finance and Insurance industry is projected to increase by 130 workers (or 18.2 percent) by 2020 in South Dakota. This subsector is primarily engaged in underwriting securities, acting as agents between buyers and sellers of securities and commodities, or providing a securities and commodities exchange service. On a national level, employment in securities, commodity contracts and other financial investments and related activities is expected to expand 25 percent by 2020. Growth is driven by the wide range of financial assets available for trade, the number of baby boomers reaching retirement age and seeking advice on retirement options, and the globalization of securities markets.
South Dakota e-Labor Bulletin July 2012
Page 3 of 25

Support Activities for Transportation
The worker levels in this subsector are projected to increase by 140 workers (or 17.9 percent) in South Dakota by 2020. The Support Activities for Transportation subsector services may be provided to transportation carrier establishments or to the general public. Services such as air traffic control, marine cargo handling and motor vehicle towing are included in this subsector. As the economy grows and the demand for goods increases, truck drivers will be needed to transport those goods to businesses and consumers. Employment of laborers and hand, freight, stock and material movers will increase as these workers and support activities increasingly are needed to work in more warehouses because of an expected rise in consumer spending.
Fabricated Metal Product Manufacturing
Fabricated Metal Product Manufacturing is projected to add 585 workers in South Dakota (or 17.0 percent) over the next 10 years. Industries in the Fabricated Metal Product Manufacturing subsector transform metal into intermediate or end products, other than machinery, computers and electronics, and metal furniture or treating metals and metal formed products fabricated elsewhere. South Dakota's business-friendly environment is rated as one of the best in the nation, which helps the expansion of the manufacturing industry and its subsectors. Nationally, overall employment in manufacturing is projected to decline by 1 percent, however, for the Fabricated Metal Products subsector is expected to grow 12 percent, creating 151,600 new jobs.
Computer and Electronic Product Manufacturing
The number of workers in the Computer and Electronic Product Manufacturing subsector is projected to increase by 340 workers (or 15.9 percent) in South Dakota through 2020. The Computer and Electronic Product Manufacturing subsector comprises of establishments that manufacture computers, computer peripherals, communications equipment and similar electronic products. In South Dakota all the categories under the Computer and Electronic Product Manufacturing are projected to grow. Specifically, the Navigational, Measuring, Electromedical, and Control Instruments Manufacturing is projected to increase 49.4 percent. Nationally, this Manufacturing subsector is expected to decline by 14 percent with a loss of 156,800 jobs.
Couriers and Messengers
The Couriers and Messengers subsector of Transportation and Warehousing industry is projecting to add 190 workers (or 15.4 percent) in South Dakota by 2020. This subsector is comprised of providing intercity and/or local delivery of parcels. As the economy is expected to grow through 2020, the demand for goods will increase as well. If the economy continues to see steady growth, the Transportation and Warehousing industries will follow.
(continued on next page)
South Dakota e-Labor Bulletin July 2012
Page 4 of 25

The industries declining or with a slow growth trend are a result of several factors. Some of the industries that are declining in South Dakota have been due to advances in technology, changes in business practices and other factors. According to the BLS, production occupations are projected to lose 77,300 jobs by 2020 nationally. Also, 11 of the 20 fastest declining occupations are in the production occupational group.
Private Households
The Private Households subsector falls under the Other Services (except Public Administration) industry. This industry is projecting a decrease of 50 workers (or 7.5 percent) by 2020 in South Dakota. The Private Households subsector includes households that employ workers on or about the premises in activities primarily concerned with the operation of the household. The recession likely impacted the Private Households industry, as some families could no longer afford the luxury of staff to assist with household duties. Another reason for the decline is related to the aging population; as the population ages and children grow up, there is less demand for house maids and helpers. Preliminary findings provided by Mike McCurry, South Dakota state demographer (Rural Life/Census Data Center, Department of Sociology and Rural Studies, South Dakota State University) are projecting a decline in persons ages 5 to 19 through 2020 and ages 55 plus are projected to have the highest levels of growth through 2020 in South Dakota.
Telecommunications
The Telecommunications subsector is projected to decrease by 105 workers (or 3.5 percent) over the next 10 years. The Telecommunications subsector is primarily engaged in operating, and/or providing access to facilities for the transmission of voice, data, text, sound and video. The major reason for the decline in South Dakota in this subsector is due to the advancements in technology. As the Telecommunications subsector becomes more technologically advanced and efficient, a smaller workforce is required.
Broadcasting (except Internet)
The worker levels in the Broadcasting (except Internet) subsector are projected to decrease by 30 workers (or 2.7 percent) by 2020. This subsector includes establishments that create content or acquire the right to distribute content and subsequently broadcast the content. Nationally, the trend for this subsector is also on
South Dakota Industry Employment Projections 2010 - 2020
Declining & Slowest Growing Industries
Industry Title
2010
Workers
2020
Workers
Actual
Change
Percent
Growth
Private Households 670 620 -50 -7.5%
Telecommunications 3,020 2,915 -105 -3.5%
Broadcasting (except Internet) 1,130 1,100 -30 -2.7%
Agriculture, Forestry, Fishing and Hunting 33,580 33,470 -110 -0.3%
Federal Government 11,935 12,015 80 0.7%
Publishing Industries 1,705 1,725 20 1.2%
Religious, Grantmaking, Civic, Professional and
Similar Organizations9,050 9,240 190 2.1%
Gasoline Stations 5,860 5,985 125 2.1%
Truck Transportation 5,055 5,215 160 3.2%
Food Manufacturing 7,715 7,975 260 3.4%
Source: Labor Market Information Center, SD Department of Labor, July 2012
South Dakota e-Labor Bulletin July 2012
Page 5 of 25

the decline. Much of this trend is attributed to the decrease in circulation caused by the rise of available information on the Internet.
Agriculture, Forestry, Fishing and Hunting
Worker levels in the Agriculture, Forestry, Fishing and Hunting subsector are projected to decrease slightly to 110 workers (or 0.3 percent). This subsector's slight decline through 2020 is mostly attributed to the advancement in technology and needing fewer workers due to more technologically advanced equipment. Another impacting force on this sector is the rising costs of production and consolidation of smaller farms.
Federal Government
The Federal Government subsector in South Dakota is projected to have a slight increase of 80 workers (or 0.7 percent) through 2020. The growth in government employment will be dampened by budgetary constraints and the outsourcing of government jobs to the private sector. Nationally, according to the BLS, federal government employment, including jobs in the Postal Service, is expected to decline by 13 percent. Looking only at postal services in South Dakota, both private and government workers, employment levels are expected to decrease by 155 workers (or 7.2 percent).
Publishing Industries
The number of workers employed in the Publishing Industries subsector is projected to add 20 workers (or 1.2 percent) in South Dakota. This subsector of the Information industry comprises of establishments engaged in the publishing of newspapers, magazines, other periodicals and books, as well as database and software publishing. The main reason for the slow growth of the Publishing subsector is due to the Internet. The information and availability of content on the Internet causes less demand for newspapers and other published materials. However, the projected growth is more contributed from the Software Publishers and Motion Picture and Video industries.
Religious, Grantmaking, Civic, Professional and Similar Organizations
Worker levels in the Religious, Grantmaking, Civic, Professional and Similar Organizations subsector is projected to slightly increase by 190 workers (2.1 percent). This subsector of Other Services (except Public Administration) is comprised of group establishments that organize and promote religious activities, support various causes through grantmaking, advocate various political and social causes and promote the interest of their members. The slow growth trend in this subsector can be attributed to the economic recovery. In the recovery phase of the recession, there will likely be more individuals to once again donate to charitable and social establishments, which will boost employment in this sector.
Gasoline Stations
Worker levels in the Gasoline Stations subsector are projected to increase by 125 workers (or 2.1 percent) through 2020. The Gasoline Stations subsector is part of the Retail Trade industry. Gasoline stations continue to add more services, such as car washes, gourmet coffees restaurants, and automobile services. This subsector includes establishments retailing automotive fuels and automotive oils and retailing these products in combination with convenience store items. A reason for the expected slow employment growth is likely related to market saturation - there seems to be one on every other corner.
Truck Transportation
The Truck Transportation subsector falls under the Transportation and Warehousing industry. This subsector is projected to slightly increase by 160 workers (or 3.2 percent) through 2020. The Truck Transportation subsector provides over-the-road transportation of cargo using motor vehicles, such as trucks and tractor
South Dakota e-Labor Bulletin July 2012
Page 6 of 25

tailor. The slow growth of this subsector is related to the continued recovery of the economy and suppressed demand for freight transportation and other goods.
Food Manufacturing
Worker levels in the Food Manufacturing subsector are projected to increase by 260 workers (or 3.4 percent) by 2020. This subsector transforms livestock and agricultural products into products for intermediate or final consumption. South Dakota has a business-friendly environment, including policies and tax structures which are attractive to manufacturers. Although there are a limited number of companies within this subsector, expansion is expected through the year 2020.
Overview of the labor market in June
Labor Supply
The number of South Dakotans who would be available to staff a new or expanding business, or South Dakota's labor supply, was estimated at 80,110 in June 2012. Included in this labor supply are those who currently hold jobs (and would like to change) and those who, for a variety of reasons, do not have jobs.
The following map shows labor supply estimates by county.
South Dakota Labor Supply June 2012
South Dakota e-Labor Bulletin July 2012
Page 7 of 25
Labor Force
This data is seasonally adjusted.
Preliminary estimates show the June 2012 South Dakota labor force decreasing over the month, with the level of employed decreasing by 1,200 (0.3 percent). The level of unemployed remained stable
Nationally, the number of unemployed persons (12.7 million) was essentially unchanged in June, and the unemployment rate held at 8.2 percent.
South Dakota's June 2012 labor force of 446,000 increased compared to the June 2011 level. The level of unemployed decreased by 1,900 (9.1 percent) to 19,000; the level of employed increased by 2,800 persons (0.7 percent).
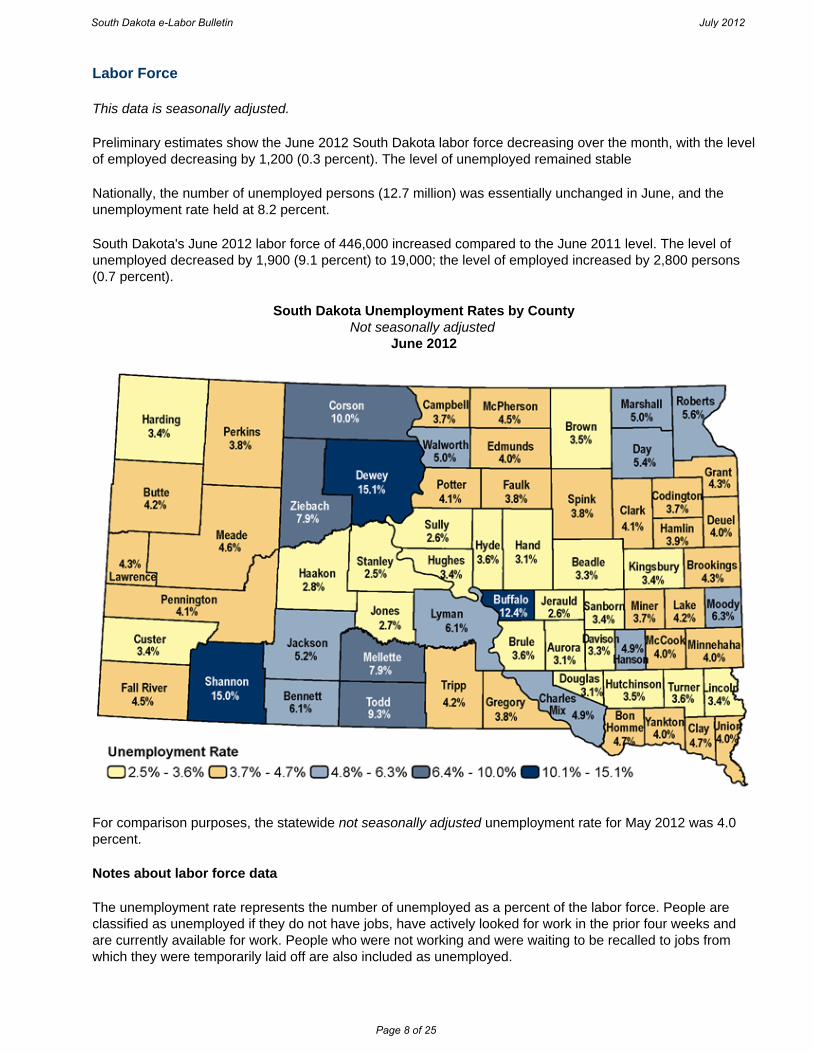
South Dakota Unemployment Rates by County Not seasonally adjusted
June 2012
For comparison purposes, the statewide not seasonally adjusted unemployment rate for May 2012 was 4.0 percent.
Notes about labor force data
The unemployment rate represents the number of unemployed as a percent of the labor force. People are classified as unemployed if they do not have jobs, have actively looked for work in the prior four weeks and are currently available for work. People who were not working and were waiting to be recalled to jobs from which they were temporarily laid off are also included as unemployed.
South Dakota e-Labor Bulletin July 2012
Page 8 of 25
Labor force estimates for South Dakota are produced by the Labor Market Information Center in cooperation with the U.S. Bureau of Labor Statistics. The concepts and definitions underlying the labor force data come from the Current Population Survey (CPS), the household survey which is the official measure of the labor force for the nation. The statewide estimate of the number of nonfarm jobs is a component of the model used to produce the labor force estimates. Other data used in this model include the number of continued unemployment insurance claims and survey data from the Current Population Survey (CPS) which is specific to the state.
Although state specific data is used in the production of the labor force estimates for South Dakota, the state monthly model estimates are controlled in "real time" to sum to national monthly labor force estimates from the CPS. Therefore, variation in the estimates of the employed and unemployed are somewhat controlled by what is happening nationally.
South Dakota Nonfarm Wage & Salaried Workers by Industry
This data is not seasonally adjusted.
Over-the-month comparisons
Based on a monthly survey of South Dakota establishments, preliminary estimates show the total nonfarm wage and salaried worker level is 421,400. Compared to the May 2012 estimate of 412,600, the worker level increased by 8,800 (2.1 percent) over the month, largely due to typical seasonal increases.
Leisure and hospitality had a large over-the-month increase (up 4,800 or 11.3 percent). This growth is typical and over the summer months. Trade, transportation and utilities had an increase of 1,600 (1.9 percent).
Mining, logging and construction had a 600 worker (or 2.8 percent) increase over the month. Construction worker numbers typically rise during the summer season.
Other industries showing over-the-month seasonal increases include retail trade (800 workers or 1.6 percent), professional and business services (700 workers or 2.4 percent) and wholesale trade (600 workers or 3.1 percent).
Over-the-year comparisons
Total nonfarm wage and salaried workers increased by 4,500 (1.1 percent) when comparing the June 2012 worker level of 421,400 to the June 2011 level of 416,900.
Industries adding the most workers included trade, transportation and utilities, educational and health services and professional and business services.
Trade, transportation and utilities had an increase of 1,900 workers (2.3 percent).
Educational and health services showed an over-the-year gain of 1,500 workers (2.3 percent). This growth was shared by several subsectors within this industry. South Dakota health care worker numbers continue to show growth.
Professional and business services increased by 1,200 workers (4.1 percent). The other industries that had notable increases over the year were retail trade (1,100 workers or 2.2 percent) and manufacturing (1,100 workers or 2.8 percent).
South Dakota e-Labor Bulletin July 2012
Page 9 of 25

South Dakota Nonfarm Worker Levels
Not Seasonally Adjusted
Industries June 2012 May 2012 June 2011
% Chg Last Month
% ChgLast Year
Statewide Total 421,400 412,600 416,900 2.1 1.1
Total Private 342,400 333,400 337,000 2.7 1.6
Goods Producing 62,900 61,900 62,800 1.6 0.2
Service Providing 358,500 350,700 354,100 2.2 1.2
Private Service Providing 279,500 271,500 274,200 2.9 1.9
Mining/Logging/Construction 22,300 21,700 23,300 2.8 -4.3
Manufacturing 40,600 40,200 39,500 1.0 2.8
Trade/Transportation/Utilities 84,600 83,000 82,700 1.9 2.3
Wholesale Trade 20,000 19,400 19,300 3.1 3.6
Retail Trade 51,800 51,000 50,700 1.6 2.2
Transportation/Warehousing/Utilities 12,800 12,600 12,700 1.6 0.8
Information 6,100 6,100 6,400 0.0 -4.7
Financial Activities 28,700 28,200 28,200 1.8 1.8
Professional Business Services 30,200 29,500 29,000 2.4 4.1
Educational/Health Services 67,000 67,000 65,500 0.0 2.3
Educational Services 7,400 7,900 7,100 -6.3 4.2
Health Care/Social Assistance 59,600 59,100 58,400 0.8 2.1
Leisure/Hospitality 47,200 42,400 46,500 11.3 1.5
Other Services 15,700 15,300 15,900 2.6 -1.3
Government 79,000 79,200 79,900 -0.3 -1.1
Federal 11,600 11,400 11,800 1.8 -1.7
State 17,700 18,600 17,600 -4.8 0.6
State Education 7,000 9,000 7,200 -22.2 -2.8
Local 49,700 49,200 50,500 1.0 -1.6
Local Education 24,600 26,400 25,300 -6.8 -2.8
2012 data is preliminary and subject to revision. Data may not sum to totals because of rounding.
Produced in cooperation with the US Bureau of Labor Statistics.
South Dakota e-Labor Bulletin July 2012
Page 10 of 25

Rapid City Metropolitan Statistical Area Nonfarm Worker Levels
Not Seasonally Adjusted
Industries June 2012 May 2012 June 2011
% Chg Last Month
% ChgLast Year
TOTAL 64,500 62,400 64,700 3.4 -0.3
Total Private 53,900 51,600 52,800 4.5 2.1
Goods Producing 7,300 7,200 7,300 1.4 0.0
Service Providing 57,200 55,200 57,400 3.6 -0.3
Private Service Providing 46,600 44,400 45,500 5.0 2.4
Mining/Logging/Construction 4,700 4,600 4,700 2.2 0.0
Manufacturing 2,600 2,600 2,600 0.0 0.0
Trade/Transportation/Utilities 13,300 12,900 13,000 3.1 2.3
-Wholesale Trade 2,100 2,100 2,100 0.0 0.0
-Retail Trade 9,400 9,100 9,100 3.3 3.3
-Transportation/Warehousing/Utilities 1,800 1,700 1,800 5.9 0.0
Information 900 900 900 0.0 0.0
Financial Activities 3,800 3,800 3,800 0.0 0.0
Professional/Business Services 5,200 5,100 5,000 2.0 4.0
Educational/Health Services 10,400 10,300 10,100 1.0 3.0
Leisure/Hospitality 10,100 8,600 9,900 17.4 2.0
Other Services 2,900 2,800 2,800 3.6 3.6
Government 10,600 10,800 11,900 -1.9 -10.9
2012 data is preliminary and subject to revision. Data may not sum to totals because of rounding.
Seasonally adjusted nonfarm data has been revised for years 1990-2011.
Produced in cooperation with the US Bureau of Labor Statistics.
South Dakota e-Labor Bulletin July 2012
Page 11 of 25

Sioux Falls Metropolitan Statistical Area Nonfarm Worker Levels
Not Seasonally Adjusted
Industries June 2012 May 2012 June 2011
% Chg Last Month
% ChgLast Year
TOTAL 140,300 138,700 138,200 1.2 1.5
Total Private 127,200 125,800 124,700 1.1 2.0
Goods Producing 19,000 19,000 19,700 0.0 -3.6
Service Providing 121,300 119,700 118,500 1.3 2.4
Private Service Providing 108,200 106,800 105,000 1.3 3.0
Mining/Logging/Construction 6,500 6,600 7,200 -1.5 -9.7
Manufacturing 12,500 12,400 12,500 0.8 0.0
Trade/Transportation/Utilities 30,100 29,800 29,100 1.0 3.4
-Wholesale Trade 7,300 7,200 7,100 1.4 2.8
-Retail Trade 17,700 17,600 17,000 0.6 4.1
-Transportation/Warehousing/Utilities 5,100 5,000 5,000 2.0 2.0
Information 2,800 2,800 2,900 0.0 -3.4
Financial Activities 14,800 14,700 15,100 0.7 -2.0
Professional/Business Services 13,300 12,800 12,100 3.9 9.9
Educational/Health Services 28,600 28,600 27,400 0.0 4.4
Leisure/Hospitality 13,800 13,300 13,600 3.8 1.5
Other Services 4,800 4,800 4,800 0.0 0.0
Government 13,100 12,900 13,500 1.6 -3.0
2012 data is preliminary and subject to revision. Data may not sum to totals because of rounding.
Not seasonally adjusted nonfarm data has been revised for years 2010 and 2011.
Produced in cooperation with the US Bureau of Labor Statistics.
South Dakota e-Labor Bulletin July 2012
Page 12 of 25
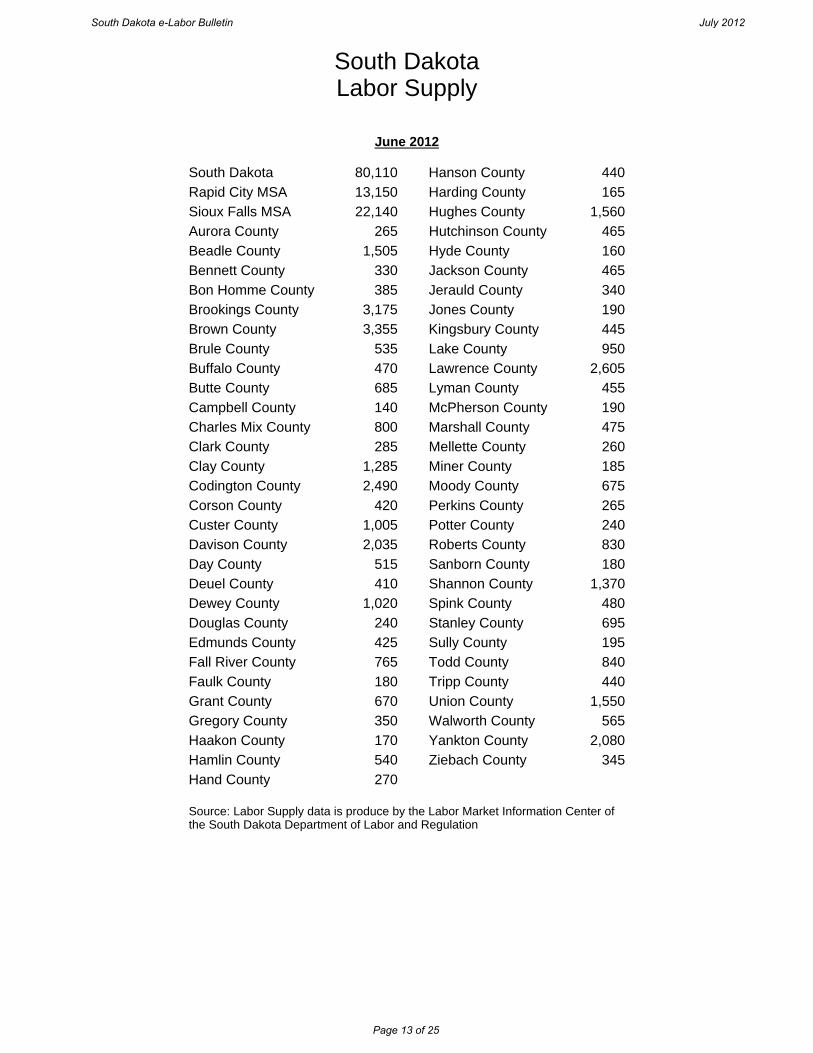
South Dakota Labor Supply
June 2012
South Dakota 80,110 Hanson County 440
Rapid City MSA 13,150 Harding County 165
Sioux Falls MSA 22,140 Hughes County 1,560
Aurora County 265 Hutchinson County 465
Beadle County 1,505 Hyde County 160
Bennett County 330 Jackson County 465
Bon Homme County 385 Jerauld County 340
Brookings County 3,175 Jones County 190
Brown County 3,355 Kingsbury County 445
Brule County 535 Lake County 950
Buffalo County 470 Lawrence County 2,605
Butte County 685 Lyman County 455
Campbell County 140 McPherson County 190
Charles Mix County 800 Marshall County 475
Clark County 285 Mellette County 260
Clay County 1,285 Miner County 185
Codington County 2,490 Moody County 675
Corson County 420 Perkins County 265
Custer County 1,005 Potter County 240
Davison County 2,035 Roberts County 830
Day County 515 Sanborn County 180
Deuel County 410 Shannon County 1,370
Dewey County 1,020 Spink County 480
Douglas County 240 Stanley County 695
Edmunds County 425 Sully County 195
Fall River County 765 Todd County 840
Faulk County 180 Tripp County 440
Grant County 670 Union County 1,550
Gregory County 350 Walworth County 565
Haakon County 170 Yankton County 2,080
Hamlin County 540 Ziebach County 345
Hand County 270 Source: Labor Supply data is produce by the Labor Market Information Center of the South Dakota Department of Labor and Regulation
South Dakota e-Labor Bulletin July 2012
Page 13 of 25

United States & South Dakota Seasonally Adjusted Labor Force
June 2012*
June 2011
Areas Labor Force Employment Unemployment Rate Labor Force Employment Unemployment Rate
United States 155,163,000 142,415,000 12,749,000 8.2% 153,409,000 139,385,000 14,024,000 9.1%
South Dakota 446,000 426,900 19,000 4.3% 445,100 424,100 20,900 4.7%
Produced in cooperation with the US Bureau of Labor Statistics.
South Dakota e-Labor Bulletin July 2012
Page 14 of 25

South Dakota & Counties Not Seasonally Adjusted Labor Force
June 2012
June 2011
Areas Labor Force Employment Unemployment Rate Labor Force Employment Unemployment Rate
SOUTH DAKOTA 454,475 435,190 19,285 4.2 453,570 432,890 20,680 4.6
Aurora County 1,700 1,650 50 3.1 1,615 1,560 55 3.5
Beadle County 10,255 9,915 340 3.3 10,200 9,845 355 3.5
Bennett County 1,435 1,350 85 6.1 1,395 1,310 85 6.0
Bon Homme County 3,130 2,985 145 4.7 3,130 2,955 175 5.6
Brookings County 18,420 17,635 785 4.3 18,445 17,580 865 4.7
Brown County 21,555 20,795 760 3.5 21,395 20,600 795 3.7
Brule County 2,980 2,875 105 3.6 3,015 2,900 115 3.8
Buffalo County 570 500 70 12.4 555 465 90 16.5
Butte County 5,440 5,210 230 4.2 5,485 5,245 240 4.4
Campbell County 885 850 35 3.7 875 840 35 3.9
Charles Mix County 4,445 4,230 215 4.9 4,475 4,260 215 4.8
Clark County 2,020 1,940 80 4.1 1,940 1,855 85 4.3
Clay County 6,995 6,665 330 4.7 6,975 6,645 330 4.7
Codington County 16,515 15,905 610 3.7 16,465 15,790 675 4.1
Corson County 1,495 1,345 150 10.0 1,445 1,310 135 9.3
Custer County 5,680 5,485 195 3.4 5,685 5,485 200 3.5
Davison County 11,660 11,280 380 3.3 11,635 11,195 440 3.8
Day County 2,915 2,760 155 5.4 2,955 2,780 175 6.0
Deuel County 2,780 2,670 110 4.0 2,760 2,650 110 4.0
Dewey County 2,785 2,365 420 15.1 2,820 2,410 410 14.6
Douglas County 1,910 1,850 60 3.1 1,920 1,850 70 3.6
Edmunds County 2,045 1,965 80 4.0 2,030 1,945 85 4.3
Fall River County 3,915 3,740 175 4.5 3,990 3,815 175 4.4
Faulk County 1,240 1,195 45 3.8 1,215 1,170 45 3.8
Grant County 4,125 3,950 175 4.3 4,235 4,045 190 4.4
Gregory County 2,460 2,365 95 3.8 2,460 2,365 95 3.9
Haakon County 1,195 1,160 35 2.8 1,180 1,140 40 3.3
Hamlin County 3,010 2,890 120 3.9 2,990 2,870 120 4.0
Hand County 2,015 1,955 60 3.1 1,935 1,870 65 3.3
Hanson County 1,855 1,765 90 4.9 1,835 1,750 85 4.6
Harding County 920 890 30 3.4 870 835 35 4.1
Hughes County 10,550 10,195 355 3.4 10,575 10,195 380 3.6
Hutchinson County 4,020 3,880 140 3.5 3,965 3,820 145 3.7
Hyde County 800 770 30 3.6 780 755 25 3.5
Jackson County 1,445 1,370 75 5.2 1,430 1,345 85 6.1
Jerauld County 1,610 1,570 40 2.6 1,570 1,525 45 2.8
Jones County 805 785 20 2.7 805 785 20 2.5
Kingsbury County 3,185 3,080 105 3.4 3,075 2,950 125 4.0
Lake County 6,515 6,240 275 4.2 6,490 6,190 300 4.6
Lawrence County 13,220 12,650 570 4.3 13,645 13,050 595 4.4
Lincoln County 25,815 24,935 880 3.4 25,545 24,610 935 3.7
Lyman County 2,080 1,955 125 6.1 2,085 1,955 130 6.3
McCook County 2,795 2,685 110 4.0 2,770 2,650 120 4.3
McPherson County 1,190 1,135 55 4.5 1,180 1,130 50 4.1
Marshall County 2,320 2,205 115 5.0 2,255 2,130 125 5.6
Meade County 13,135 12,530 605 4.6 13,230 12,585 645 4.9
South Dakota e-Labor Bulletin July 2012
Page 15 of 25

Mellette County 915 845 70 7.9 880 825 55 6.2
Miner County 1,205 1,160 45 3.7 1,170 1,115 55 4.9
Minnehaha County 98,995 94,995 4,000 4.0 98,175 93,770 4,405 4.5
Moody County 4,045 3,790 255 6.3 4,145 3,840 305 7.3
Pennington County 56,400 54,095 2,305 4.1 56,780 54,335 2,445 4.3
Perkins County 1,625 1,565 60 3.8 1,630 1,565 65 4.0
Potter County 1,310 1,255 55 4.1 1,340 1,275 65 4.7
Roberts County 4,950 4,675 275 5.6 4,910 4,590 320 6.5
Sanborn County 1,435 1,385 50 3.4 1,430 1,375 55 4.0
Shannon County 3,785 3,220 565 15.0 3,820 3,235 585 15.3
Spink County 3,460 3,325 135 3.8 3,575 3,440 135 3.7
Stanley County 2,075 2,025 50 2.5 2,095 2,025 70 3.4
Sully County 1,110 1,080 30 2.6 1,100 1,070 30 2.9
Todd County 3,665 3,325 340 9.3 3,755 3,445 310 8.3
Tripp County 3,055 2,925 130 4.2 3,015 2,890 125 4.2
Turner County 4,375 4,220 155 3.6 4,325 4,165 160 3.7
Union County 8,375 8,045 330 4.0 8,095 7,705 390 4.8
Walworth County 2,740 2,605 135 5.0 2,800 2,650 150 5.3
Yankton County 11,990 11,510 480 4.0 12,060 11,510 550 4.6
Ziebach County 1,105 1,020 85 7.9 1,125 1,035 90 7.9
The South Dakota labor force statistics are produced by the LMIC in cooperation with the U.S. Bureau of Labor Statistics.
South Dakota e-Labor Bulletin July 2012
Page 16 of 25

South Dakota Areas Not Seasonally Adjusted Labor Force
June 2012*
June 2011
Areas Labor Force Employment Unemployment Rate Labor Force Employment Unemployment Rate
Rapid City MSA 69,535 66,625 2,910 4.2 70,010 66,920 3,090 4.4
Sioux Falls MSA 131,985 126,835 5,150 3.9 130,820 125,200 5,620 4.3
Aberdeen MiSA 23,600 22,760 840 3.6 23,430 22,550 880 3.8
Brookings MiSA 18,420 17,635 785 4.3 18,445 17,580 865 4.7
Huron MiSA 10,255 9,915 340 3.3 10,200 9,845 355 3.5
Mitchell MiSA 13,515 13,045 470 3.5 13,470 12,945 525 3.9
Pierre MiSA 12,630 12,225 405 3.2 12,675 12,225 450 3.6
Spearfish MiSA 13,220 12,650 570 4.3 13,645 13,050 595 4.4
Vermillion MiSA 6,995 6,665 330 4.7 6,975 6,645 330 4.7
Watertown MiSA 19,520 18,795 725 3.7 19,450 18,660 790 4.1
Yankton MiSA 11,990 11,510 480 4.0 12,060 11,510 550 4.6
Dewey-Ziebach LMA 3,895 3,385 510 13.1 3,945 3,445 500 12.7
The South Dakota labor force statistics are produced by the LMIC in cooperation with the U.S. Bureau of Labor Statistics.
Statewide and Substate labor force data for 2007- 2011 has been revised.
South Dakota e-Labor Bulletin July 2012
Page 17 of 25
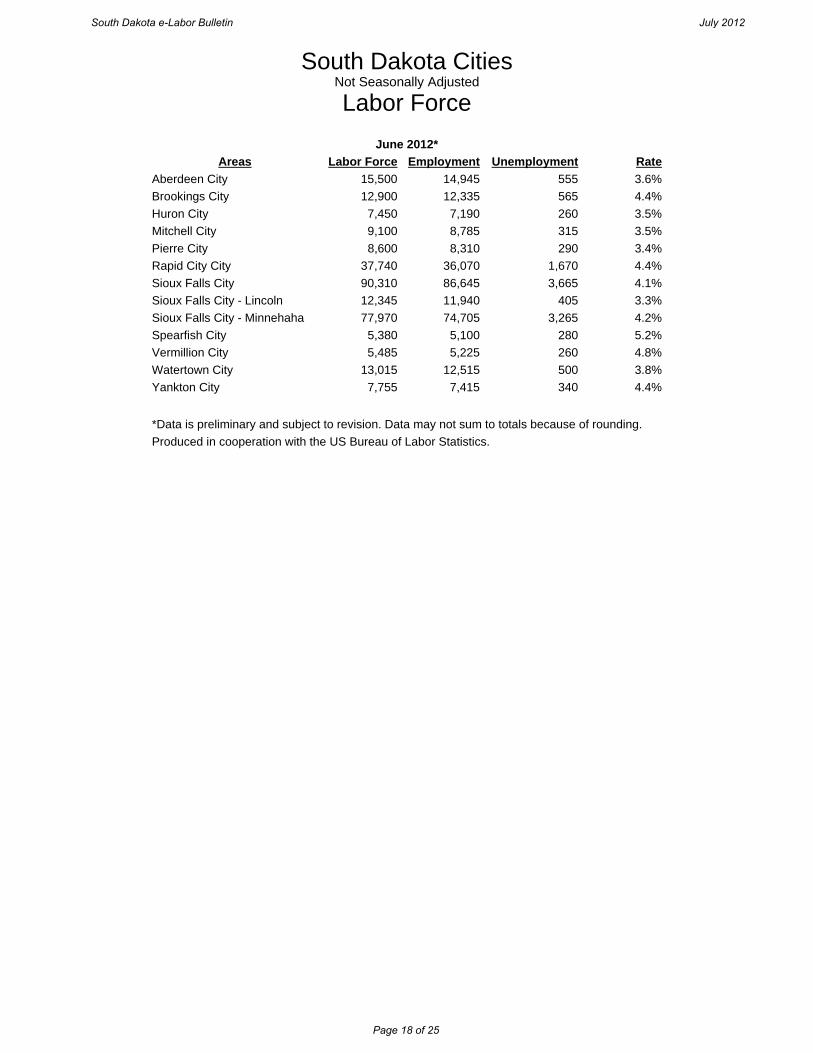
South Dakota Cities Not Seasonally Adjusted Labor Force
June 2012*
Areas Labor Force Employment Unemployment Rate
Aberdeen City 15,500 14,945 555 3.6%
Brookings City 12,900 12,335 565 4.4%
Huron City 7,450 7,190 260 3.5%
Mitchell City 9,100 8,785 315 3.5%
Pierre City 8,600 8,310 290 3.4%
Rapid City City 37,740 36,070 1,670 4.4%
Sioux Falls City 90,310 86,645 3,665 4.1%
Sioux Falls City - Lincoln 12,345 11,940 405 3.3%
Sioux Falls City - Minnehaha 77,970 74,705 3,265 4.2%
Spearfish City 5,380 5,100 280 5.2%
Vermillion City 5,485 5,225 260 4.8%
Watertown City 13,015 12,515 500 3.8%
Yankton City 7,755 7,415 340 4.4%
*Data is preliminary and subject to revision. Data may not sum to totals because of rounding.
Produced in cooperation with the US Bureau of Labor Statistics.
South Dakota e-Labor Bulletin July 2012
Page 18 of 25

South Dakota Annualized Pay of Covered Workers
January 2011 to December 2011* Statewide $35,413 Hutchinson County $27,864
Rapid City MSA $34,570 Hyde County $32,702
Sioux Falls MSA $39,516 Jackson County $26,280
Aurora County $27,715 Jerauld County $29,698
Beadle County $32,917 Jones County $23,014
Bennett County $26,622 Kingsbury County $29,148
Bon Homme County $27,440 Lake County $32,328
Brookings County $35,916 Lawrence County $29,637
Brown County $35,177 Lincoln County $38,368
Brule County $25,828 Lyman County $25,690
Buffalo County $34,875 McCook County $28,254
Butte County $28,467 McPherson County $24,215
Campbell County $27,410 Marshall County $31,373
Charles Mix County $27,534 Meade County $33,959
Clark County $27,162 Mellette County $22,915
Clay County $31,331 Miner County $28,832
Codington County $34,443 Minnehaha County $40,009
Corson County $30,845 Moody County $32,625
Custer County $29,523 Pennington County $34,650
Davison County $32,392 Perkins County $26,109
Day County $26,832 Potter County $28,336
Deuel County $34,279 Roberts County $28,374
Dewey County $31,616 Sanborn County $26,576
Douglas County $27,988 Shannon County $36,451
Edmunds County $30,603 Spink County $30,281
Fall River County $32,927 Stanley County $28,412
Faulk County $28,933 Sully County $28,588
Grant County $32,625 Todd County $30,988
Gregory County $24,730 Tripp County $28,053
Haakon County $30,684 Turner County $28,411
Hamlin County $28,688 Union County $45,579
Hand County $27,345 Walworth County $27,192
Hanson County $29,944 Yankton County $34,330
Harding County $32,788 Ziebach County $32,795
Hughes County $35,791 *This data is updated quarterly.
Source: Produced by the SD Department of Labor and Regulation, LMIC,in cooperation with the U.S. Bureau of Labor Statistics
South Dakota e-Labor Bulletin July 2012
Page 19 of 25

South Dakota Local Office Activities
July 2011 - June 2012
July 2010 - June 2011
% Chg Last Year
Activities
Job Seekers 90,689 95,172 -4.7%
Entered Employments 30,580 30,913 -1.1%
Job Openings Received 82,232 70,245 17.1% Source: Produced by Workforce Services and the South Dakota Department of Labor and Regulation
South Dakota e-Labor Bulletin July 2012
Page 20 of 25

South Dakota Department of Labor And Regulation
Unemployment Insurance Activities
June2012
May2012
June 2011
% ChgLast Month
% ChgLast Year
Unemployment Insurance Activities
Initial Claims 1,291 1,542 1,562 -16.3% -17.3%
Weeks Claimed 4,363 8,865 10,453 -50.8% -58.3%
Amount of Benefit Payments $1,628,887 $1,831,173 $2,095,990 -11.0% -22.3%
Unemployment Trust Fund Balance $41,730,700 $42,386,174 $28,212,514 -1.5% 47.9% Source: Produced by the South Dakota Department of Labor and Regulation, Unemployment Insurance Division
South Dakota e-Labor Bulletin July 2012
Page 21 of 25
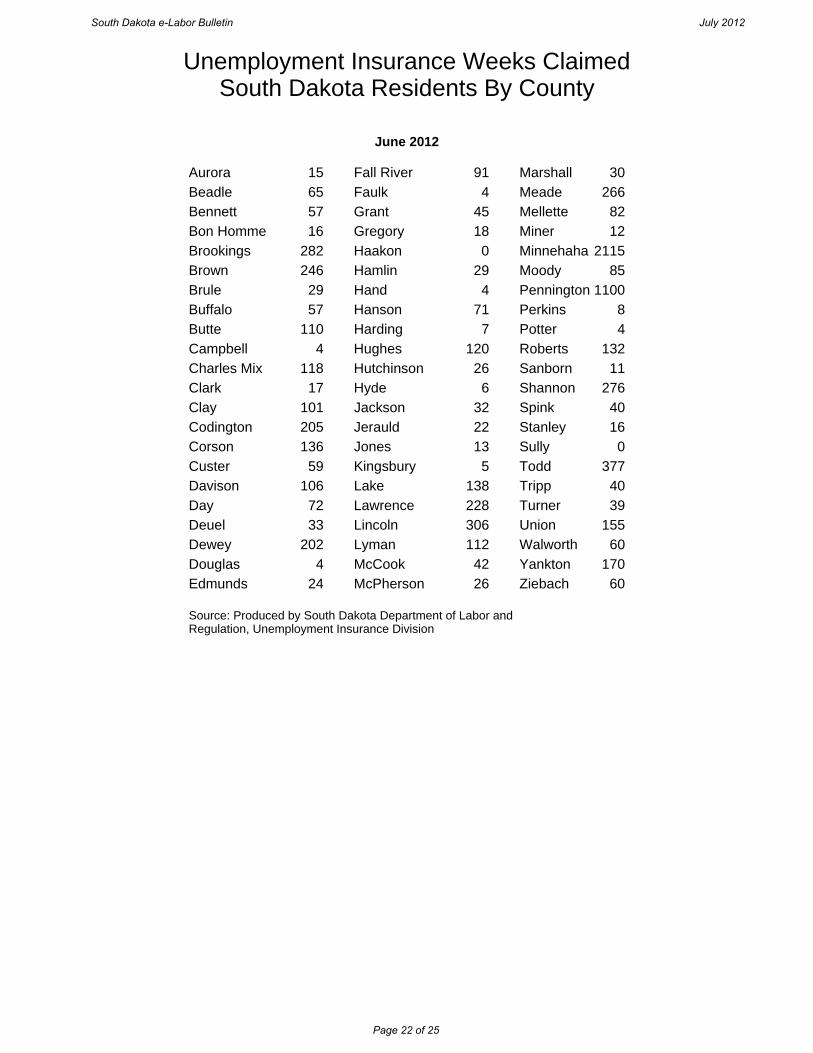
Unemployment Insurance Weeks Claimed South Dakota Residents By County
June 2012
Aurora 15 Fall River 91 Marshall 30
Beadle 65 Faulk 4 Meade 266
Bennett 57 Grant 45 Mellette 82
Bon Homme 16 Gregory 18 Miner 12
Brookings 282 Haakon 0 Minnehaha 2115
Brown 246 Hamlin 29 Moody 85
Brule 29 Hand 4 Pennington 1100
Buffalo 57 Hanson 71 Perkins 8
Butte 110 Harding 7 Potter 4
Campbell 4 Hughes 120 Roberts 132
Charles Mix 118 Hutchinson 26 Sanborn 11
Clark 17 Hyde 6 Shannon 276
Clay 101 Jackson 32 Spink 40
Codington 205 Jerauld 22 Stanley 16
Corson 136 Jones 13 Sully 0
Custer 59 Kingsbury 5 Todd 377
Davison 106 Lake 138 Tripp 40
Day 72 Lawrence 228 Turner 39
Deuel 33 Lincoln 306 Union 155
Dewey 202 Lyman 112 Walworth 60
Douglas 4 McCook 42 Yankton 170
Edmunds 24 McPherson 26 Ziebach 60 Source: Produced by South Dakota Department of Labor and Regulation, Unemployment Insurance Division
South Dakota e-Labor Bulletin July 2012
Page 22 of 25

National Economic Indicators
June2012
May 2012
June2011
% Chg Last Month
% Chg Last Year
Consumer Price Index 229.5 229.8 225.7 -0.1% 1.7%
Nonfarm Payroll Employment 134.1 133.7 132.3 0.3% 1.4%
Privately Owned Housing Starts 760 711 615 6.9% 23.6%
Bank Prime Loan Rate 3.25 3.25 3.25 0.0% 0.0% Source: Consumer Price Index data produced by the U.S. Bureau of Labor Statistics Nonfarm Payroll Employment data produced by the U.S. Bureau of Labor Statistics Privately Owned Housing Starts data produced by the U.S. Census Bureau Bank Prime Loan Rate data produced by the Federal Reserve Bank
South Dakota e-Labor Bulletin July 2012
Page 23 of 25
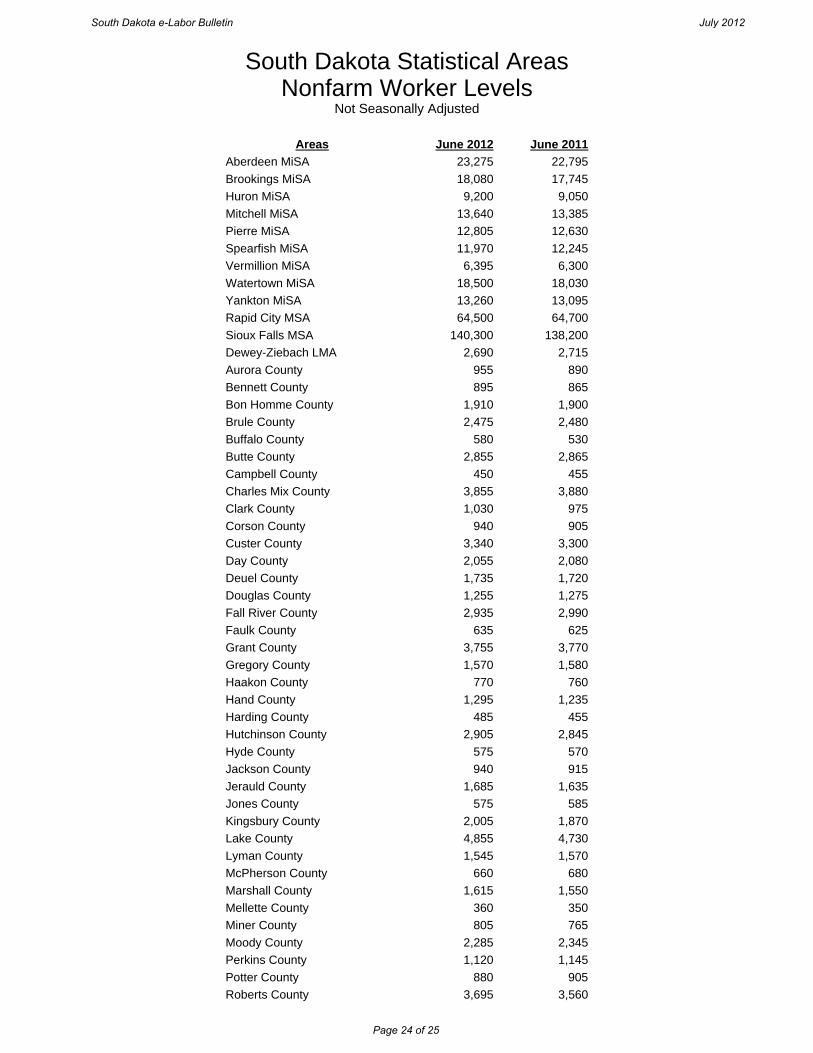
South Dakota Statistical Areas Nonfarm Worker Levels
Not Seasonally Adjusted
Areas June 2012 June 2011
Aberdeen MiSA 23,275 22,795
Brookings MiSA 18,080 17,745
Huron MiSA 9,200 9,050
Mitchell MiSA 13,640 13,385
Pierre MiSA 12,805 12,630
Spearfish MiSA 11,970 12,245
Vermillion MiSA 6,395 6,300
Watertown MiSA 18,500 18,030
Yankton MiSA 13,260 13,095
Rapid City MSA 64,500 64,700
Sioux Falls MSA 140,300 138,200
Dewey-Ziebach LMA 2,690 2,715
Aurora County 955 890
Bennett County 895 865
Bon Homme County 1,910 1,900
Brule County 2,475 2,480
Buffalo County 580 530
Butte County 2,855 2,865
Campbell County 450 455
Charles Mix County 3,855 3,880
Clark County 1,030 975
Corson County 940 905
Custer County 3,340 3,300
Day County 2,055 2,080
Deuel County 1,735 1,720
Douglas County 1,255 1,275
Fall River County 2,935 2,990
Faulk County 635 625
Grant County 3,755 3,770
Gregory County 1,570 1,580
Haakon County 770 760
Hand County 1,295 1,235
Harding County 485 455
Hutchinson County 2,905 2,845
Hyde County 575 570
Jackson County 940 915
Jerauld County 1,685 1,635
Jones County 575 585
Kingsbury County 2,005 1,870
Lake County 4,855 4,730
Lyman County 1,545 1,570
McPherson County 660 680
Marshall County 1,615 1,550
Mellette County 360 350
Miner County 805 765
Moody County 2,285 2,345
Perkins County 1,120 1,145
Potter County 880 905
Roberts County 3,695 3,560
South Dakota e-Labor Bulletin July 2012
Page 24 of 25

Sanborn County 700 700
Shannon County 3,865 3,800
Spink County 2,425 2,560
Sully County 550 545
Todd County 3,185 3,265
Tripp County 2,205 2,180
Union County 9,190 8,985
Walworth County 2,395 2,435
2012 data is preliminary and subject to revision. Data may not sum to totals because of rounding.
Not seasonally adjusted nonfarm data has been revised for years 2010 and 2011.
Seasonally adjusted nonfarm data has been revised for years 1990-2011.
South Dakota e-Labor Bulletin July 2012
Page 25 of 25