south florida real estate review - the alliance 2010 colliers south... · south florida real estate...
TRANSCRIPT
YEAR END 2010
Accelerating success.
SOUTH FLORIDAREAL ESTATE REVIEW
This document has been prepared by Colliers International for advertising and general information only. Colliers International makes no guarantees, representations or warranties of any kind, expressed or implied, regarding the information including, but not limited to, warranties of content, accuracy and reliability. Any interested party should undertake their own inquiries as to the accuracy of the information. Colliers International excludes unequivocally all inferred or implied terms, conditions and warranties arising out of this document and excludes all liability for loss and damages arising there from. This publication is the copyrighted property of Colliers International and/or its licensor(s).
©2011. All rights reserved.
Contact: Crystal Proenza—[email protected] | Research: Alex Morcate—[email protected]
Letter from Leadership 3Executive Summary 4
TABLE OF CONTENTS
Office Market 5Industrial Market 8Retail Market 10
MIAMI-DADE COUNTY
SOUTH FLORIDA REAL ESTATE REVIEW
SOUTH FLORIDA COMMERCIAL REAL ESTATE REVIEW | YEAR END 2010
Office Market 12Industrial Market 15Retail Market 17
BROWARD COUNTY
Office Market 19Industrial Market 21Retail Market 23
PALM BEACH COUNTY
Colliers International South Florida Team 25
COMPANY INFORMATION

Dear Valued Client,
As we continue to hear more positive news about the market and the economy we are pleased to close out another year of the down cycle in South Florida. This year has been filled with changes, challenges and ultimately success stories. We regard these changes and successes as the new footings of our foundation; a foundation reinforced by a stronger network, stronger clients and a stronger commitment to exceed expectations and prepare for tomorrow’s needs.
At the start of 2010 we announced our rebranding to Colliers International South Florida, a sign of our commitment to grow our local presence by leveraging our international platform. We facilitated a change in mentality from one of surviving the market to one of operations, accelerating client success and forward-looking opportunity. During the last 24 months, our leasing division continued to move the company forward with a tremendous volume of business. We also surveyed the market and identified the needs of our clients and positioned ourselves as the premier distressed real estate service provider, adding to our reputation as a top brokerage and management firm. We celebrated our successes and embraced our role within the market, seeing a marketed increase in transaction volume compared to 2009.
As we’ve continued to reshape the face of Colliers International South Florida, we’ve made strategic additions to our team, each aware of the synergies associated with becoming a member of one of the premier commercial real estate firms in the world. As they say, “success breeds success.” Our team is that much more prepared to meet the needs of the market.
We look back at the last year with satisfaction that we’ve weathered the downturn. We look at today with confidence that we have assembled the best team, under the best brand, to meet the needs of our clients. We look ahead at the next 12 to 18 months with optimism that we will implement our vision of knowing our market intimately and providing extraordinary service.
Sincerely,
DONNA ABOOD MICHAEL T. FAY THOMAS D. WOOD, JR.Chief Executive Officer President Chief Operating [email protected] [email protected] [email protected]
The Colliers International South Florida Commercial Real Estate Review provides market data for the Tri-County area, highlighting the office, industrial and retail markets.
P. 3 | COLLIERS INTERNATIONAL
SOUTH FLORIDA COMMERCIAL REAL ESTATE REVIEW | YEAR END 2010
Contact: Crystal Proenza—[email protected] | Research: Alex Morcate—[email protected]
If there is one thing we can all agree on it’s that, with 2010 behind us, we are that much closer to the end of what will always be known as one of the worst real estate down cycles of our recent history. South Florida has weathered the storm so far and it appears as if the clouds are clearing up ahead for almost every property type. Miami-Dade County saw improvement across the board. Vacancies are trending lower, net absorption has been consistently positive and average asking rental rates are leveling off. As we move North the trend becomes less defined though. Broward County is mostly neutral, with industrial product showing the only signs of real direction towards recovery. Palm Beach County remains mixed with industrial showing positive signs, office remaining neutral and retail continuing to slide. Overall, the real winner of 2010 was industrial product, which saw improvement across each county and most of the major submarkets. At the other end of the spectrum, retail remains the most challenged. Office space, surprisingly, has started to show signs of life, supported by inter-market movement and the occasional headline new lease transaction. Overall, we remain optimistic that 2011 will bring more opportunities on the leasing side as most signs are now pointing in the right direction: not down. However, we expect to continue to see weakness in the defaults in the CMBS mortgage market for the next 24-36 months.
• Across the tri-county area unemployment has improved, however so slightly. The rate has trended near 12% since the summer of 2010. Unfortunately, Miami, which is the largest of the three counties, saw a rise to close out the year at just above 13%.
• Volume across every major passenger industry saw year-over-year increases, some breaking long-standing records. Miami International Airport recorded the most annual passenger traffic since 1997. The Port of Miami saw double digit year-over-year growth, recording the best October ever. Port Everglades recorded similar news during March.
• Consumer confidence throughout the state ended the year flat when compared year-over-year but saw marketed improvements from the lows of the summer and recorded an unexpected 10% increase to start 2011 off with a bang.
South Florida Market Overall Executive Summary
MARKET INDICATORS
Q4 2010
MIAMI-DADE OFFICE
BROWARD OFFICE —
PALM BEACH OFFICE —
MIAMI-DADE INDUSTRIAL
BROWARD INDUSTRIAL
PALM BEACH INDUSTRIAL
MIAMI-DADE RETAIL
BROWARD RETAIL —
PALM BEACH RETAIL
SOUTH FLORIDA COMMERCIAL REAL ESTATE REVIEW | YEAR END 2010
COLLIERS INTERNATIONAL | P. 4 Contact: Crystal Proenza—[email protected] | Research: Alex Morcate—[email protected]
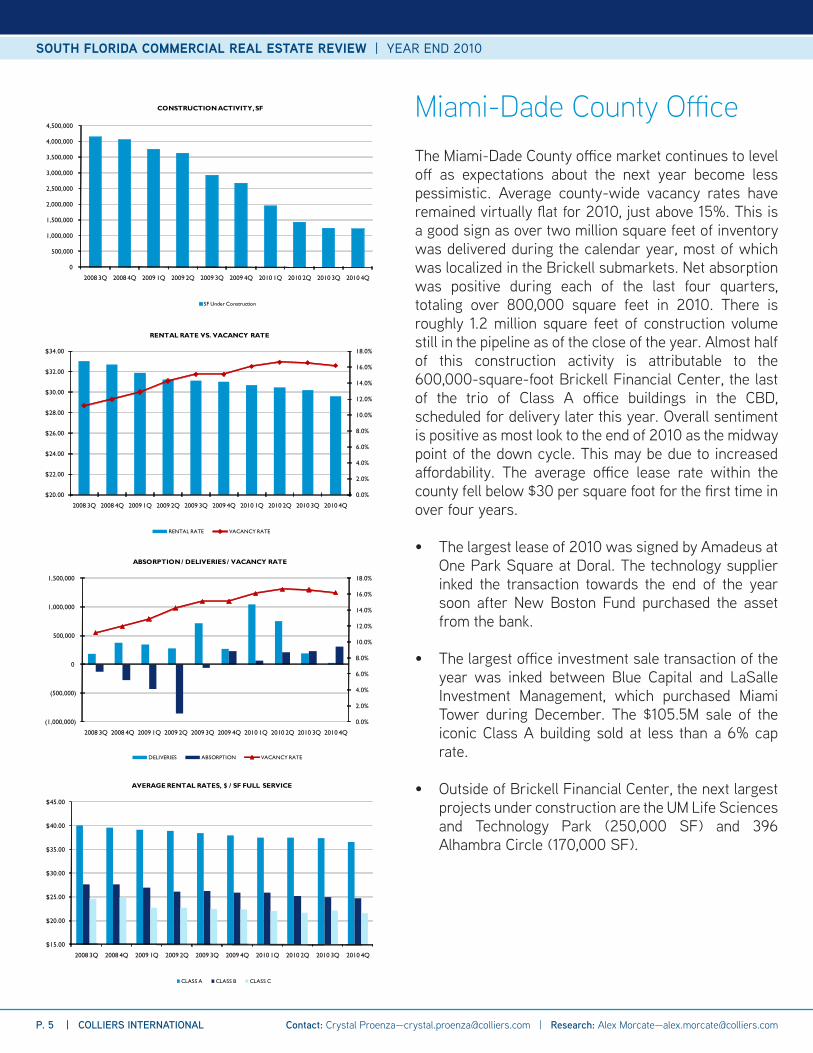
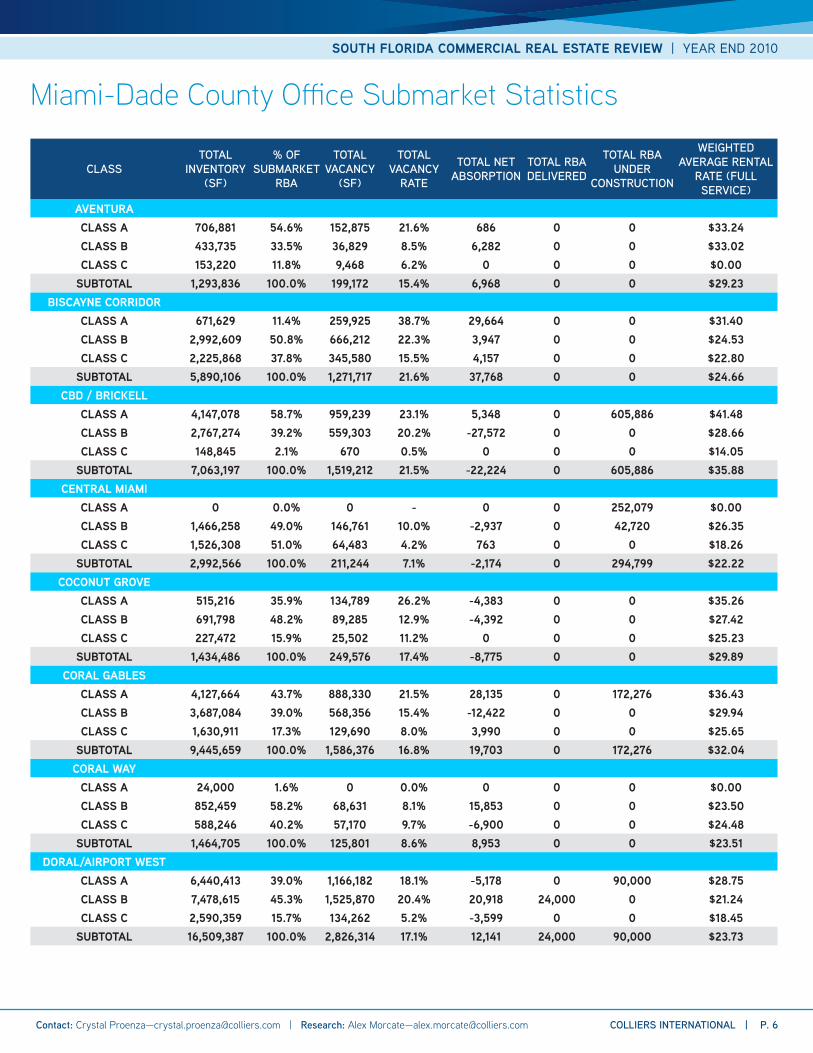
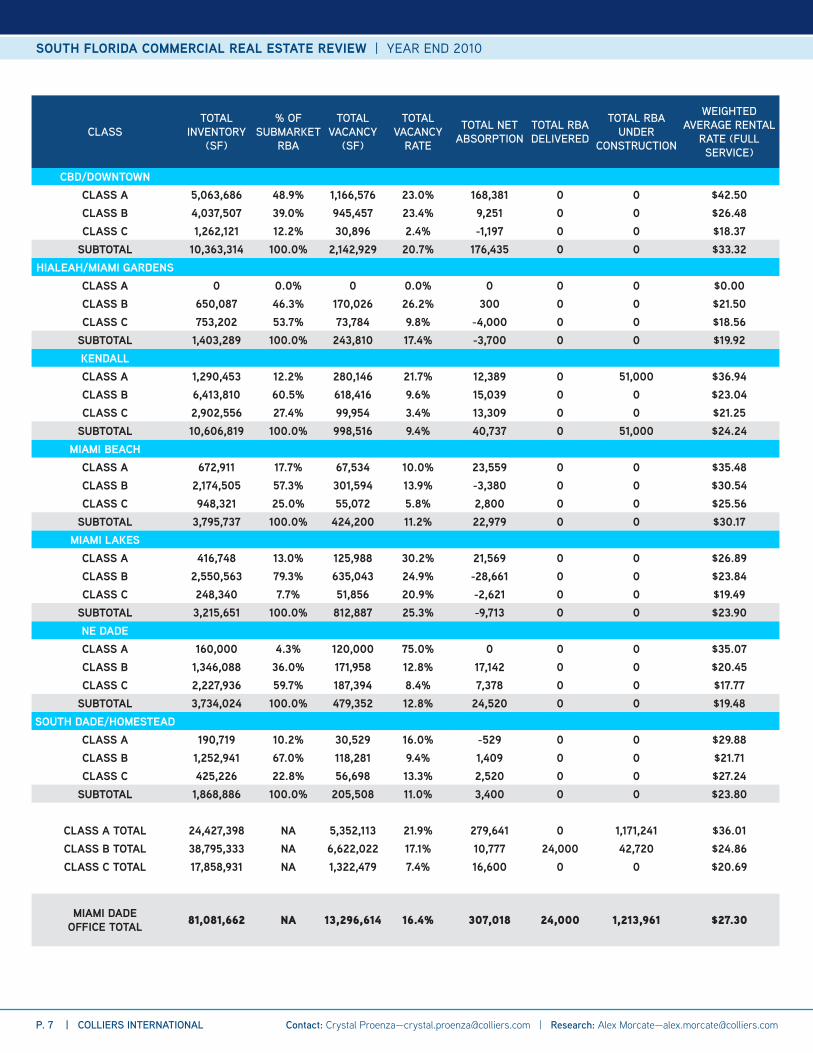
The Miami-Dade County office market continues to level off as expectations about the next year become less pessimistic. Average county-wide vacancy rates have remained virtually flat for 2010, just above 15%. This is a good sign as over two million square feet of inventory was delivered during the calendar year, most of which was localized in the Brickell submarkets. Net absorption was positive during each of the last four quarters, totaling over 800,000 square feet in 2010. There is roughly 1.2 million square feet of construction volume still in the pipeline as of the close of the year. Almost half of this construction activity is attributable to the 600,000-square-foot Brickell Financial Center, the last of the trio of Class A office buildings in the CBD, scheduled for delivery later this year. Overall sentiment is positive as most look to the end of 2010 as the midway point of the down cycle. This may be due to increased affordability. The average office lease rate within the county fell below $30 per square foot for the first time in over four years.
• The largest lease of 2010 was signed by Amadeus at One Park Square at Doral. The technology supplier inked the transaction towards the end of the year soon after New Boston Fund purchased the asset from the bank.
• The largest office investment sale transaction of the year was inked between Blue Capital and LaSalle Investment Management, which purchased Miami Tower during December. The $105.5M sale of the iconic Class A building sold at less than a 6% cap rate.
• Outside of Brickell Financial Center, the next largest projects under construction are the UM Life Sciences and Technology Park (250,000 SF) and 396 Alhambra Circle (170,000 SF).
Miami-Dade County Office
0
500,000
1,000,000
1,500,000
2,000,000
2,500,000
3,000,000
3,500,000
4,000,000
4,500,000
2008 3Q 2008 4Q 2009 1Q 2009 2Q 2009 3Q 2009 4Q 2010 1Q 2010 2Q 2010 3Q 2010 4Q
CONSTRUCTION ACTIVITY, SF
SF Under Construction
0.0%
2.0%
4.0%
6.0%
8.0%
10.0%
12.0%
14.0%
16.0%
18.0%
$20.00
$22.00
$24.00
$26.00
$28.00
$30.00
$32.00
$34.00
2008 3Q 2008 4Q 2009 1Q 2009 2Q 2009 3Q 2009 4Q 2010 1Q 2010 2Q 2010 3Q 2010 4Q
RENTAL RATE VS. VACANCY RATE
RENTAL RATE VACANCY RATE
0.0%
2.0%
4.0%
6.0%
8.0%
10.0%
12.0%
14.0%
16.0%
18.0%
(1,000,000)
(500,000)
0
500,000
1,000,000
1,500,000
2008 3Q 2008 4Q 2009 1Q 2009 2Q 2009 3Q 2009 4Q 2010 1Q 2010 2Q 2010 3Q 2010 4Q
ABSORPTION / DELIVERIES / VACANCY RATE
DELIVERIES ABSORPTION VACANCY RATE
$15.00
$20.00
$25.00
$30.00
$35.00
$40.00
$45.00
2008 3Q 2008 4Q 2009 1Q 2009 2Q 2009 3Q 2009 4Q 2010 1Q 2010 2Q 2010 3Q 2010 4Q
AVERAGE RENTAL RATES, $ / SF FULL SERVICE
CLASS A CLASS B CLASS C
P. 5 | COLLIERS INTERNATIONAL
SOUTH FLORIDA COMMERCIAL REAL ESTATE REVIEW | YEAR END 2010
Contact: Crystal Proenza—[email protected] | Research: Alex Morcate—[email protected]
Miami-Dade County Office Submarket Statistics
CLASSTOTAL
INVENTORY (SF)
% OF SUBMARKET
RBA
TOTAL VACANCY
(SF)
TOTAL VACANCY
RATE
TOTAL NET ABSORPTION
TOTAL RBA DELIVERED
TOTAL RBA UNDER
CONSTRUCTION
WEIGHTED AVERAGE RENTAL
RATE (FULL SERVICE)
AVENTURACLASS A 706,881 54.6% 152,875 21.6% 686 0 0 $33.24CLASS B 433,735 33.5% 36,829 8.5% 6,282 0 0 $33.02CLASS C 153,220 11.8% 9,468 6.2% 0 0 0 $0.00
SUBTOTAL 1,293,836 100.0% 199,172 15.4% 6,968 0 0 $29.23BISCAYNE CORRIDOR
CLASS A 671,629 11.4% 259,925 38.7% 29,664 0 0 $31.40CLASS B 2,992,609 50.8% 666,212 22.3% 3,947 0 0 $24.53CLASS C 2,225,868 37.8% 345,580 15.5% 4,157 0 0 $22.80
SUBTOTAL 5,890,106 100.0% 1,271,717 21.6% 37,768 0 0 $24.66CBD / BRICKELL
CLASS A 4,147,078 58.7% 959,239 23.1% 5,348 0 605,886 $41.48CLASS B 2,767,274 39.2% 559,303 20.2% -27,572 0 0 $28.66CLASS C 148,845 2.1% 670 0.5% 0 0 0 $14.05
SUBTOTAL 7,063,197 100.0% 1,519,212 21.5% -22,224 0 605,886 $35.88CENTRAL MIAMI
CLASS A 0 0.0% 0 - 0 0 252,079 $0.00CLASS B 1,466,258 49.0% 146,761 10.0% -2,937 0 42,720 $26.35CLASS C 1,526,308 51.0% 64,483 4.2% 763 0 0 $18.26
SUBTOTAL 2,992,566 100.0% 211,244 7.1% -2,174 0 294,799 $22.22COCONUT GROVE
CLASS A 515,216 35.9% 134,789 26.2% -4,383 0 0 $35.26CLASS B 691,798 48.2% 89,285 12.9% -4,392 0 0 $27.42CLASS C 227,472 15.9% 25,502 11.2% 0 0 0 $25.23
SUBTOTAL 1,434,486 100.0% 249,576 17.4% -8,775 0 0 $29.89CORAL GABLES
CLASS A 4,127,664 43.7% 888,330 21.5% 28,135 0 172,276 $36.43CLASS B 3,687,084 39.0% 568,356 15.4% -12,422 0 0 $29.94CLASS C 1,630,911 17.3% 129,690 8.0% 3,990 0 0 $25.65
SUBTOTAL 9,445,659 100.0% 1,586,376 16.8% 19,703 0 172,276 $32.04CORAL WAY
CLASS A 24,000 1.6% 0 0.0% 0 0 0 $0.00CLASS B 852,459 58.2% 68,631 8.1% 15,853 0 0 $23.50CLASS C 588,246 40.2% 57,170 9.7% -6,900 0 0 $24.48
SUBTOTAL 1,464,705 100.0% 125,801 8.6% 8,953 0 0 $23.51DORAL/AIRPORT WEST
CLASS A 6,440,413 39.0% 1,166,182 18.1% -5,178 0 90,000 $28.75CLASS B 7,478,615 45.3% 1,525,870 20.4% 20,918 24,000 0 $21.24CLASS C 2,590,359 15.7% 134,262 5.2% -3,599 0 0 $18.45
SUBTOTAL 16,509,387 100.0% 2,826,314 17.1% 12,141 24,000 90,000 $23.73
SOUTH FLORIDA COMMERCIAL REAL ESTATE REVIEW | YEAR END 2010
COLLIERS INTERNATIONAL | P. 6 Contact: Crystal Proenza—[email protected] | Research: Alex Morcate—[email protected]
CLASSTOTAL
INVENTORY (SF)
% OF SUBMARKET
RBA
TOTAL VACANCY
(SF)
TOTAL VACANCY
RATE
TOTAL NET ABSORPTION
TOTAL RBA DELIVERED
TOTAL RBA UNDER
CONSTRUCTION
WEIGHTED AVERAGE RENTAL
RATE (FULL SERVICE)
CBD/DOWNTOWNCLASS A 5,063,686 48.9% 1,166,576 23.0% 168,381 0 0 $42.50CLASS B 4,037,507 39.0% 945,457 23.4% 9,251 0 0 $26.48CLASS C 1,262,121 12.2% 30,896 2.4% -1,197 0 0 $18.37
SUBTOTAL 10,363,314 100.0% 2,142,929 20.7% 176,435 0 0 $33.32HIALEAH/MIAMI GARDENS
CLASS A 0 0.0% 0 0.0% 0 0 0 $0.00CLASS B 650,087 46.3% 170,026 26.2% 300 0 0 $21.50CLASS C 753,202 53.7% 73,784 9.8% -4,000 0 0 $18.56
SUBTOTAL 1,403,289 100.0% 243,810 17.4% -3,700 0 0 $19.92KENDALLCLASS A 1,290,453 12.2% 280,146 21.7% 12,389 0 51,000 $36.94CLASS B 6,413,810 60.5% 618,416 9.6% 15,039 0 0 $23.04CLASS C 2,902,556 27.4% 99,954 3.4% 13,309 0 0 $21.25
SUBTOTAL 10,606,819 100.0% 998,516 9.4% 40,737 0 51,000 $24.24MIAMI BEACH
CLASS A 672,911 17.7% 67,534 10.0% 23,559 0 0 $35.48CLASS B 2,174,505 57.3% 301,594 13.9% -3,380 0 0 $30.54CLASS C 948,321 25.0% 55,072 5.8% 2,800 0 0 $25.56
SUBTOTAL 3,795,737 100.0% 424,200 11.2% 22,979 0 0 $30.17MIAMI LAKES
CLASS A 416,748 13.0% 125,988 30.2% 21,569 0 0 $26.89CLASS B 2,550,563 79.3% 635,043 24.9% -28,661 0 0 $23.84CLASS C 248,340 7.7% 51,856 20.9% -2,621 0 0 $19.49
SUBTOTAL 3,215,651 100.0% 812,887 25.3% -9,713 0 0 $23.90NE DADECLASS A 160,000 4.3% 120,000 75.0% 0 0 0 $35.07CLASS B 1,346,088 36.0% 171,958 12.8% 17,142 0 0 $20.45CLASS C 2,227,936 59.7% 187,394 8.4% 7,378 0 0 $17.77
SUBTOTAL 3,734,024 100.0% 479,352 12.8% 24,520 0 0 $19.48SOUTH DADE/HOMESTEAD
CLASS A 190,719 10.2% 30,529 16.0% -529 0 0 $29.88CLASS B 1,252,941 67.0% 118,281 9.4% 1,409 0 0 $21.71CLASS C 425,226 22.8% 56,698 13.3% 2,520 0 0 $27.24
SUBTOTAL 1,868,886 100.0% 205,508 11.0% 3,400 0 0 $23.80
CLASS A TOTAL 24,427,398 NA 5,352,113 21.9% 279,641 0 1,171,241 $36.01CLASS B TOTAL 38,795,333 NA 6,622,022 17.1% 10,777 24,000 42,720 $24.86CLASS C TOTAL 17,858,931 NA 1,322,479 7.4% 16,600 0 0 $20.69
MIAMI DADE OFFICE TOTAL 81,081,662 NA 13,296,614 16.4% 307,018 24,000 1,213,961 $27.30
P. 7 | COLLIERS INTERNATIONAL
SOUTH FLORIDA COMMERCIAL REAL ESTATE REVIEW | YEAR END 2010
Contact: Crystal Proenza—[email protected] | Research: Alex Morcate—[email protected]
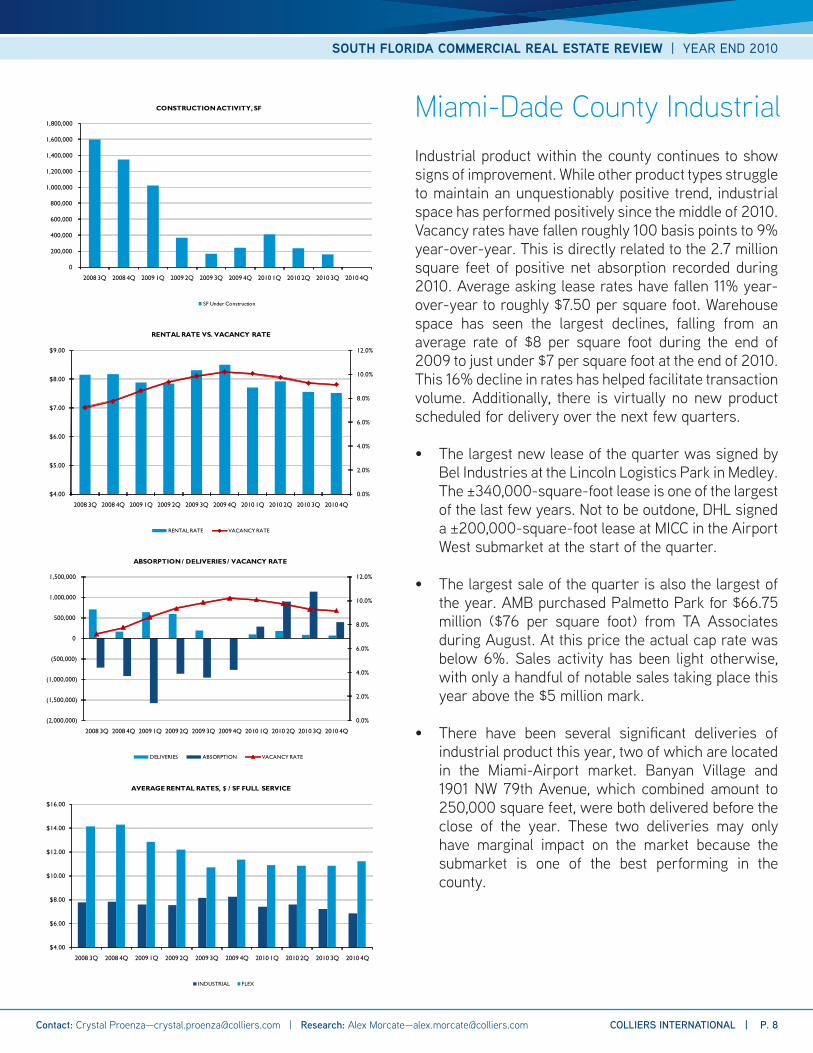
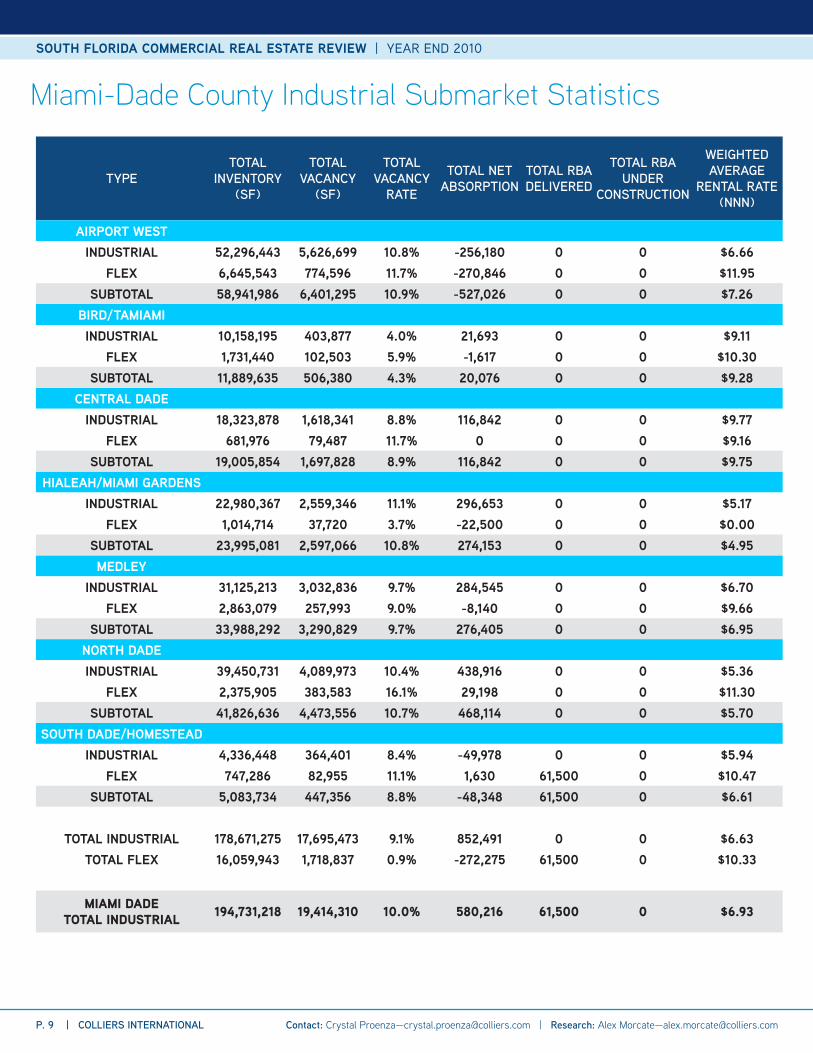
Industrial product within the county continues to show signs of improvement. While other product types struggle to maintain an unquestionably positive trend, industrial space has performed positively since the middle of 2010. Vacancy rates have fallen roughly 100 basis points to 9% year-over-year. This is directly related to the 2.7 million square feet of positive net absorption recorded during 2010. Average asking lease rates have fallen 11% year-over-year to roughly $7.50 per square foot. Warehouse space has seen the largest declines, falling from an average rate of $8 per square foot during the end of 2009 to just under $7 per square foot at the end of 2010. This 16% decline in rates has helped facilitate transaction volume. Additionally, there is virtually no new product scheduled for delivery over the next few quarters.
• The largest new lease of the quarter was signed by Bel Industries at the Lincoln Logistics Park in Medley. The ±340,000-square-foot lease is one of the largest of the last few years. Not to be outdone, DHL signed a ±200,000-square-foot lease at MICC in the Airport West submarket at the start of the quarter.
• The largest sale of the quarter is also the largest of the year. AMB purchased Palmetto Park for $66.75 million ($76 per square foot) from TA Associates during August. At this price the actual cap rate was below 6%. Sales activity has been light otherwise, with only a handful of notable sales taking place this year above the $5 million mark.
• There have been several significant deliveries of industrial product this year, two of which are located in the Miami-Airport market. Banyan Village and 1901 NW 79th Avenue, which combined amount to 250,000 square feet, were both delivered before the close of the year. These two deliveries may only have marginal impact on the market because the submarket is one of the best performing in the county.
Miami-Dade County Industrial
0
200,000
400,000
600,000
800,000
1,000,000
1,200,000
1,400,000
1,600,000
1,800,000
2008 3Q 2008 4Q 2009 1Q 2009 2Q 2009 3Q 2009 4Q 2010 1Q 2010 2Q 2010 3Q 2010 4Q
CONSTRUCTION ACTIVITY, SF
SF Under Construction
0.0%
2.0%
4.0%
6.0%
8.0%
10.0%
12.0%
$4.00
$5.00
$6.00
$7.00
$8.00
$9.00
2008 3Q 2008 4Q 2009 1Q 2009 2Q 2009 3Q 2009 4Q 2010 1Q 2010 2Q 2010 3Q 2010 4Q
RENTAL RATE VS. VACANCY RATE
RENTAL RATE VACANCY RATE
0.0%
2.0%
4.0%
6.0%
8.0%
10.0%
12.0%
(2,000,000)
(1,500,000)
(1,000,000)
(500,000)
0
500,000
1,000,000
1,500,000
2008 3Q 2008 4Q 2009 1Q 2009 2Q 2009 3Q 2009 4Q 2010 1Q 2010 2Q 2010 3Q 2010 4Q
ABSORPTION / DELIVERIES / VACANCY RATE
DELIVERIES ABSORPTION VACANCY RATE
$4.00
$6.00
$8.00
$10.00
$12.00
$14.00
$16.00
2008 3Q 2008 4Q 2009 1Q 2009 2Q 2009 3Q 2009 4Q 2010 1Q 2010 2Q 2010 3Q 2010 4Q
AVERAGE RENTAL RATES, $ / SF FULL SERVICE
INDUSTRIAL FLEX
SOUTH FLORIDA COMMERCIAL REAL ESTATE REVIEW | YEAR END 2010
COLLIERS INTERNATIONAL | P. 8 Contact: Crystal Proenza—[email protected] | Research: Alex Morcate—[email protected]
TYPETOTAL
INVENTORY (SF)
TOTAL VACANCY
(SF)
TOTAL VACANCY
RATE
TOTAL NET ABSORPTION
TOTAL RBA DELIVERED
TOTAL RBA UNDER
CONSTRUCTION
WEIGHTED AVERAGE
RENTAL RATE (NNN)
AIRPORT WESTINDUSTRIAL 52,296,443 5,626,699 10.8% -256,180 0 0 $6.66
FLEX 6,645,543 774,596 11.7% -270,846 0 0 $11.95SUBTOTAL 58,941,986 6,401,295 10.9% -527,026 0 0 $7.26
BIRD/TAMIAMIINDUSTRIAL 10,158,195 403,877 4.0% 21,693 0 0 $9.11
FLEX 1,731,440 102,503 5.9% -1,617 0 0 $10.30SUBTOTAL 11,889,635 506,380 4.3% 20,076 0 0 $9.28
CENTRAL DADEINDUSTRIAL 18,323,878 1,618,341 8.8% 116,842 0 0 $9.77
FLEX 681,976 79,487 11.7% 0 0 0 $9.16SUBTOTAL 19,005,854 1,697,828 8.9% 116,842 0 0 $9.75
HIALEAH/MIAMI GARDENSINDUSTRIAL 22,980,367 2,559,346 11.1% 296,653 0 0 $5.17
FLEX 1,014,714 37,720 3.7% -22,500 0 0 $0.00SUBTOTAL 23,995,081 2,597,066 10.8% 274,153 0 0 $4.95MEDLEY
INDUSTRIAL 31,125,213 3,032,836 9.7% 284,545 0 0 $6.70FLEX 2,863,079 257,993 9.0% -8,140 0 0 $9.66
SUBTOTAL 33,988,292 3,290,829 9.7% 276,405 0 0 $6.95NORTH DADEINDUSTRIAL 39,450,731 4,089,973 10.4% 438,916 0 0 $5.36
FLEX 2,375,905 383,583 16.1% 29,198 0 0 $11.30SUBTOTAL 41,826,636 4,473,556 10.7% 468,114 0 0 $5.70
SOUTH DADE/HOMESTEADINDUSTRIAL 4,336,448 364,401 8.4% -49,978 0 0 $5.94
FLEX 747,286 82,955 11.1% 1,630 61,500 0 $10.47SUBTOTAL 5,083,734 447,356 8.8% -48,348 61,500 0 $6.61
TOTAL INDUSTRIAL 178,671,275 17,695,473 9.1% 852,491 0 0 $6.63TOTAL FLEX 16,059,943 1,718,837 0.9% -272,275 61,500 0 $10.33
MIAMI DADE TOTAL INDUSTRIAL 194,731,218 19,414,310 10.0% 580,216 61,500 0 $6.93
Miami-Dade County Industrial Submarket Statistics
P. 9 | COLLIERS INTERNATIONAL
SOUTH FLORIDA COMMERCIAL REAL ESTATE REVIEW | YEAR END 2010
Contact: Crystal Proenza—[email protected] | Research: Alex Morcate—[email protected]
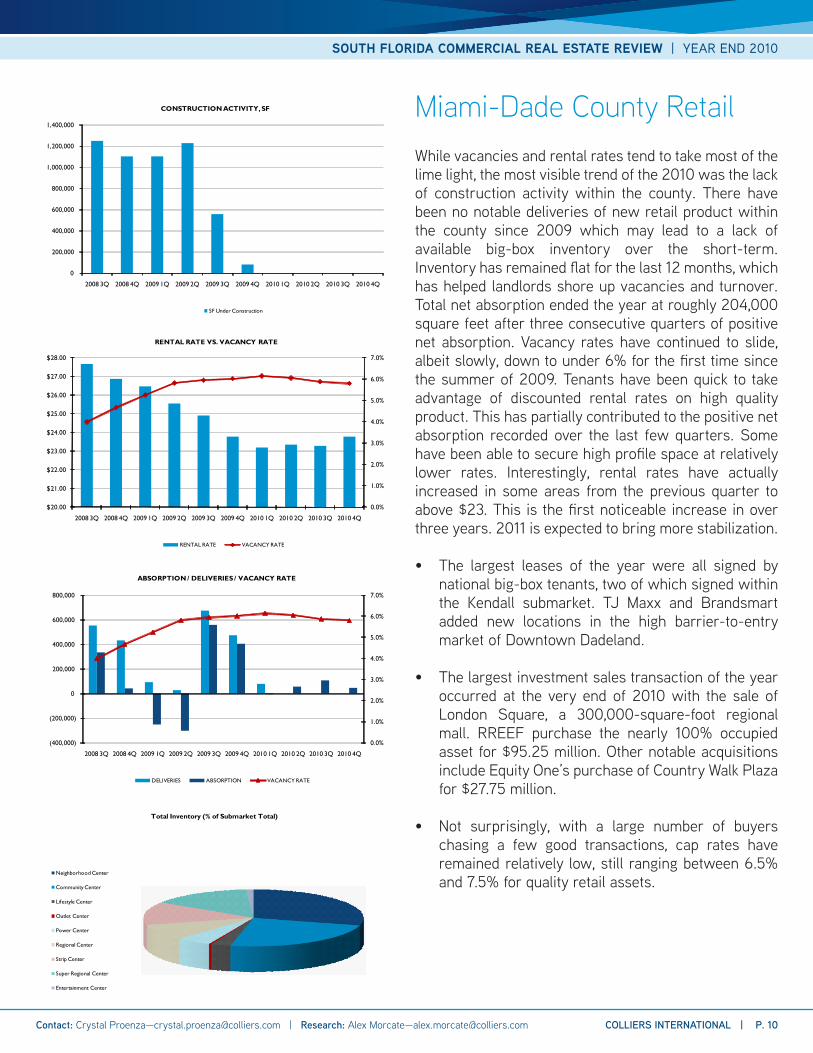
While vacancies and rental rates tend to take most of the lime light, the most visible trend of the 2010 was the lack of construction activity within the county. There have been no notable deliveries of new retail product within the county since 2009 which may lead to a lack of available big-box inventory over the short-term. Inventory has remained flat for the last 12 months, which has helped landlords shore up vacancies and turnover. Total net absorption ended the year at roughly 204,000 square feet after three consecutive quarters of positive net absorption. Vacancy rates have continued to slide, albeit slowly, down to under 6% for the first time since the summer of 2009. Tenants have been quick to take advantage of discounted rental rates on high quality product. This has partially contributed to the positive net absorption recorded over the last few quarters. Some have been able to secure high profile space at relatively lower rates. Interestingly, rental rates have actually increased in some areas from the previous quarter to above $23. This is the first noticeable increase in over three years. 2011 is expected to bring more stabilization.
• The largest leases of the year were all signed by national big-box tenants, two of which signed within the Kendall submarket. TJ Maxx and Brandsmart added new locations in the high barrier-to-entry market of Downtown Dadeland.
• The largest investment sales transaction of the year occurred at the very end of 2010 with the sale of London Square, a 300,000-square-foot regional mall. RREEF purchase the nearly 100% occupied asset for $95.25 million. Other notable acquisitions include Equity One’s purchase of Country Walk Plaza for $27.75 million.
• Not surprisingly, with a large number of buyers chasing a few good transactions, cap rates have remained relatively low, still ranging between 6.5% and 7.5% for quality retail assets.
Miami-Dade County Retail
0
200,000
400,000
600,000
800,000
1,000,000
1,200,000
1,400,000
2008 3Q 2008 4Q 2009 1Q 2009 2Q 2009 3Q 2009 4Q 2010 1Q 2010 2Q 2010 3Q 2010 4Q
CONSTRUCTION ACTIVITY, SF
SF Under Construction
0.0%
1.0%
2.0%
3.0%
4.0%
5.0%
6.0%
7.0%
$20.00
$21.00
$22.00
$23.00
$24.00
$25.00
$26.00
$27.00
$28.00
2008 3Q 2008 4Q 2009 1Q 2009 2Q 2009 3Q 2009 4Q 2010 1Q 2010 2Q 2010 3Q 2010 4Q
RENTAL RATE VS. VACANCY RATE
RENTAL RATE VACANCY RATE
0.0%
1.0%
2.0%
3.0%
4.0%
5.0%
6.0%
7.0%
(400,000)
(200,000)
0
200,000
400,000
600,000
800,000
2008 3Q 2008 4Q 2009 1Q 2009 2Q 2009 3Q 2009 4Q 2010 1Q 2010 2Q 2010 3Q 2010 4Q
ABSORPTION / DELIVERIES / VACANCY RATE
DELIVERIES ABSORPTION VACANCY RATE
Total Inventory (% of Submarket Total)
Neighborhood Center
Community Center
Lifestyle Center
Outlet Center
Power Center
Regional Center
Strip Center
Super Regional Center
Entertainment Center
SOUTH FLORIDA COMMERCIAL REAL ESTATE REVIEW | YEAR END 2010
COLLIERS INTERNATIONAL | P. 10 Contact: Crystal Proenza—[email protected] | Research: Alex Morcate—[email protected]
TYPETOTAL
INVENTORY (SF)
TOTAL VACANCY (SF)
TOTAL VACANCY
RATE
TOTAL NET ABSORPTION
TOTAL RBA DELIVERED
TOTAL RBA UNDER
CONSTRUCTION
WEIGHTED AVERAGE
RENTAL RATE (NNN)
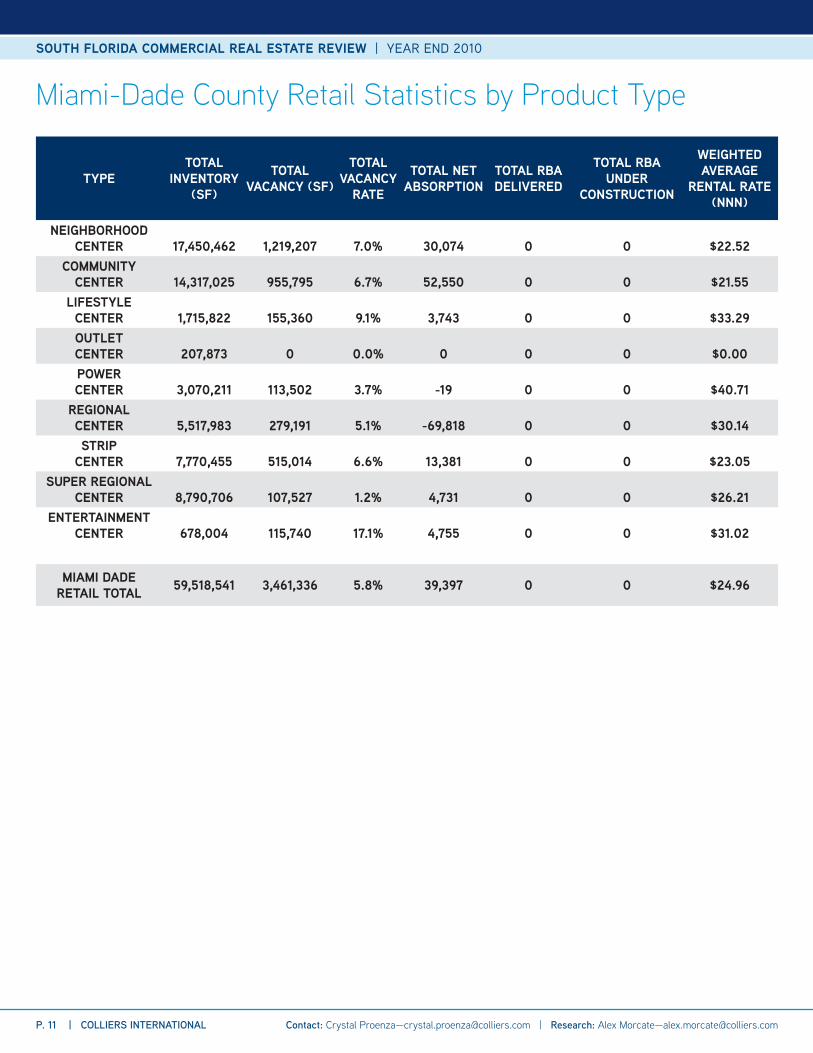
NEIGHBORHOOD CENTER 17,450,462 1,219,207 7.0% 30,074 0 0 $22.52
COMMUNITY CENTER 14,317,025 955,795 6.7% 52,550 0 0 $21.55
LIFESTYLE CENTER 1,715,822 155,360 9.1% 3,743 0 0 $33.29OUTLET CENTER 207,873 0 0.0% 0 0 0 $0.00POWER CENTER 3,070,211 113,502 3.7% -19 0 0 $40.71
REGIONAL CENTER 5,517,983 279,191 5.1% -69,818 0 0 $30.14STRIP
CENTER 7,770,455 515,014 6.6% 13,381 0 0 $23.05SUPER REGIONAL
CENTER 8,790,706 107,527 1.2% 4,731 0 0 $26.21ENTERTAINMENT
CENTER 678,004 115,740 17.1% 4,755 0 0 $31.02
MIAMI DADE RETAIL TOTAL 59,518,541 3,461,336 5.8% 39,397 0 0 $24.96
Miami-Dade County Retail Statistics by Product Type
P. 11 | COLLIERS INTERNATIONAL
SOUTH FLORIDA COMMERCIAL REAL ESTATE REVIEW | YEAR END 2010
Contact: Crystal Proenza—[email protected] | Research: Alex Morcate—[email protected]
0
100,000
200,000
300,000
400,000
500,000
600,000
700,000
2008 3Q 2008 4Q 2009 1Q 2009 2Q 2009 3Q 2009 4Q 2010 1Q 2010 2Q 2010 3Q 2010 4Q
CONSTRUCTION ACTIVITY, SF
SF Under Construction
0.0%
2.0%
4.0%
6.0%
8.0%
10.0%
12.0%
14.0%
16.0%
$22.00
$24.00
$26.00
$28.00
2008 3Q 2008 4Q 2009 1Q 2009 2Q 2009 3Q 2009 4Q 2010 1Q 2010 2Q 2010 3Q 2010 4Q
RENTAL RATE VS. VACANCY RATE
RENTAL RATE VACANCY RATE
0.0%
2.0%
4.0%
6.0%
8.0%
10.0%
12.0%
14.0%
16.0%
(500,000)
(400,000)
(300,000)
(200,000)
(100,000)
0
100,000
200,000
300,000
2008 3Q 2008 4Q 2009 1Q 2009 2Q 2009 3Q 2009 4Q 2010 1Q 2010 2Q 2010 3Q 2010 4Q
ABSORPTION / DELIVERIES / VACANCY RATE
DELIVERIES ABSORPTION VACANCY RATE
$10.00
$15.00
$20.00
$25.00
$30.00
$35.00
2008 3Q 2008 4Q 2009 1Q 2009 2Q 2009 3Q 2009 4Q 2010 1Q 2010 2Q 2010 3Q 2010 4Q
AVERAGE RENTAL RATES, $ / SF FULL SERVICE
CLASS A CLASS B CLASS C
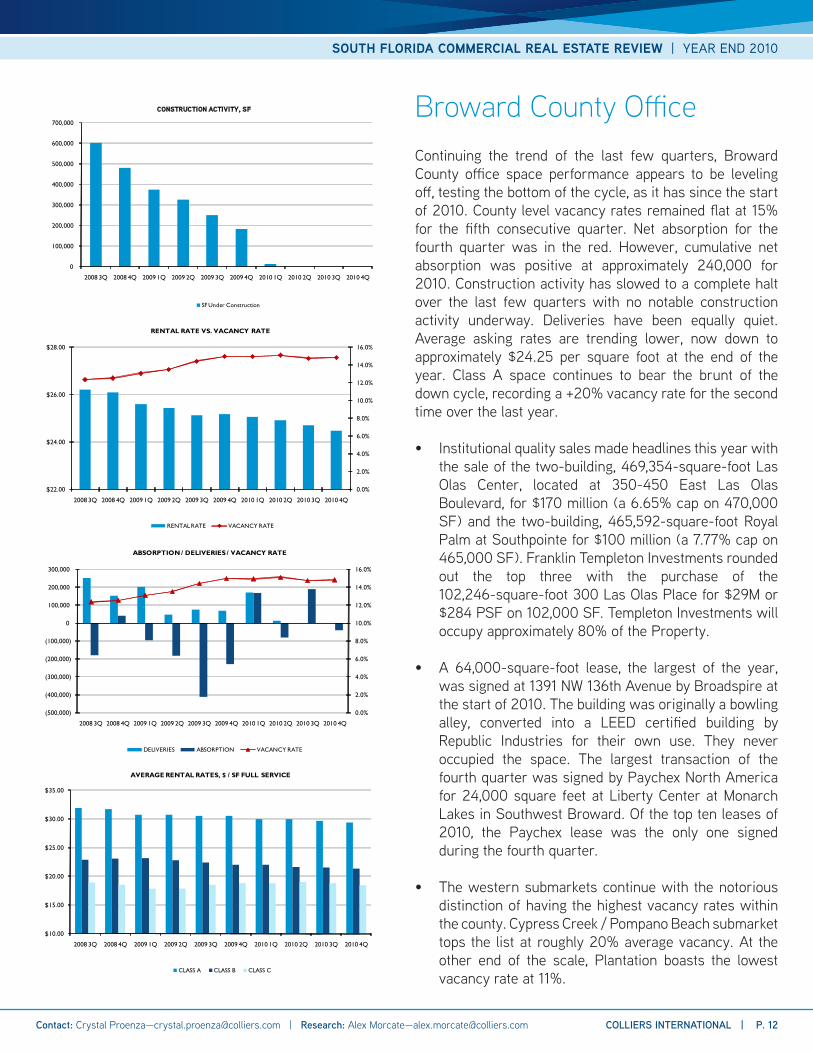
Continuing the trend of the last few quarters, Broward County office space performance appears to be leveling off, testing the bottom of the cycle, as it has since the start of 2010. County level vacancy rates remained flat at 15% for the fifth consecutive quarter. Net absorption for the fourth quarter was in the red. However, cumulative net absorption was positive at approximately 240,000 for 2010. Construction activity has slowed to a complete halt over the last few quarters with no notable construction activity underway. Deliveries have been equally quiet. Average asking rates are trending lower, now down to approximately $24.25 per square foot at the end of the year. Class A space continues to bear the brunt of the down cycle, recording a +20% vacancy rate for the second time over the last year.
• Institutional quality sales made headlines this year with the sale of the two-building, 469,354-square-foot Las Olas Center, located at 350-450 East Las Olas Boulevard, for $170 million (a 6.65% cap on 470,000 SF) and the two-building, 465,592-square-foot Royal Palm at Southpointe for $100 million (a 7.77% cap on 465,000 SF). Franklin Templeton Investments rounded out the top three with the purchase of the 102,246-square-foot 300 Las Olas Place for $29M or $284 PSF on 102,000 SF. Templeton Investments will occupy approximately 80% of the Property.
• A 64,000-square-foot lease, the largest of the year, was signed at 1391 NW 136th Avenue by Broadspire at the start of 2010. The building was originally a bowling alley, converted into a LEED certified building by Republic Industries for their own use. They never occupied the space. The largest transaction of the fourth quarter was signed by Paychex North America for 24,000 square feet at Liberty Center at Monarch Lakes in Southwest Broward. Of the top ten leases of 2010, the Paychex lease was the only one signed during the fourth quarter.
• The western submarkets continue with the notorious distinction of having the highest vacancy rates within the county. Cypress Creek / Pompano Beach submarket tops the list at roughly 20% average vacancy. At the other end of the scale, Plantation boasts the lowest vacancy rate at 11%.
Broward County Office
SOUTH FLORIDA COMMERCIAL REAL ESTATE REVIEW | YEAR END 2010
COLLIERS INTERNATIONAL | P. 12 Contact: Crystal Proenza—[email protected] | Research: Alex Morcate—[email protected]
Broward County Office Submarket Statistics
CLASSTOTAL
INVENTORY (SF)
% OF SUBMARKET
RBA
TOTAL VACANCY
(SF)
TOTAL VACANCY
RATE
TOTAL NET ABSORPTION
TOTAL RBA DELIVERED
TOTAL RBA UNDER
CONSTRUCTION
WEIGHTED AVERAGE RENTAL
RATE (FULL SERVICE)
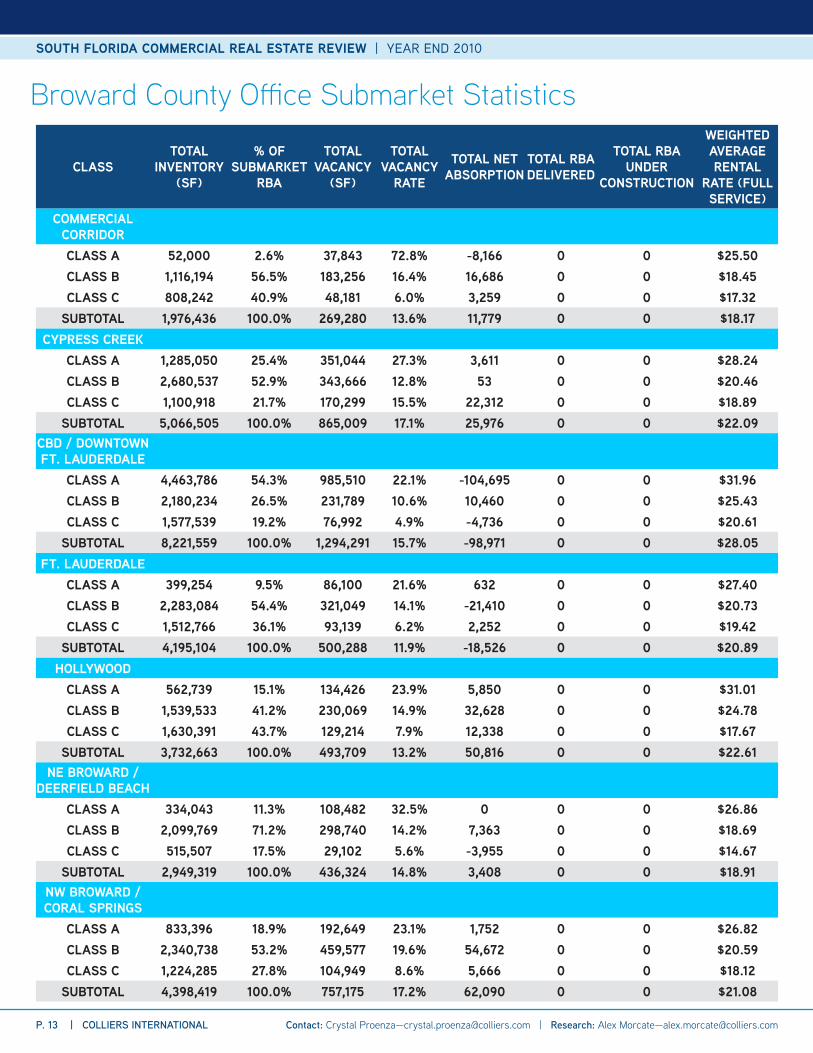
COMMERCIAL CORRIDORCLASS A 52,000 2.6% 37,843 72.8% -8,166 0 0 $25.50CLASS B 1,116,194 56.5% 183,256 16.4% 16,686 0 0 $18.45CLASS C 808,242 40.9% 48,181 6.0% 3,259 0 0 $17.32
SUBTOTAL 1,976,436 100.0% 269,280 13.6% 11,779 0 0 $18.17CYPRESS CREEK
CLASS A 1,285,050 25.4% 351,044 27.3% 3,611 0 0 $28.24CLASS B 2,680,537 52.9% 343,666 12.8% 53 0 0 $20.46CLASS C 1,100,918 21.7% 170,299 15.5% 22,312 0 0 $18.89
SUBTOTAL 5,066,505 100.0% 865,009 17.1% 25,976 0 0 $22.09CBD / DOWNTOWN FT. LAUDERDALE
CLASS A 4,463,786 54.3% 985,510 22.1% -104,695 0 0 $31.96CLASS B 2,180,234 26.5% 231,789 10.6% 10,460 0 0 $25.43CLASS C 1,577,539 19.2% 76,992 4.9% -4,736 0 0 $20.61
SUBTOTAL 8,221,559 100.0% 1,294,291 15.7% -98,971 0 0 $28.05FT. LAUDERDALE
CLASS A 399,254 9.5% 86,100 21.6% 632 0 0 $27.40CLASS B 2,283,084 54.4% 321,049 14.1% -21,410 0 0 $20.73CLASS C 1,512,766 36.1% 93,139 6.2% 2,252 0 0 $19.42
SUBTOTAL 4,195,104 100.0% 500,288 11.9% -18,526 0 0 $20.89HOLLYWOOD
CLASS A 562,739 15.1% 134,426 23.9% 5,850 0 0 $31.01CLASS B 1,539,533 41.2% 230,069 14.9% 32,628 0 0 $24.78CLASS C 1,630,391 43.7% 129,214 7.9% 12,338 0 0 $17.67
SUBTOTAL 3,732,663 100.0% 493,709 13.2% 50,816 0 0 $22.61NE BROWARD /
DEERFIELD BEACHCLASS A 334,043 11.3% 108,482 32.5% 0 0 0 $26.86CLASS B 2,099,769 71.2% 298,740 14.2% 7,363 0 0 $18.69CLASS C 515,507 17.5% 29,102 5.6% -3,955 0 0 $14.67
SUBTOTAL 2,949,319 100.0% 436,324 14.8% 3,408 0 0 $18.91NW BROWARD / CORAL SPRINGS
CLASS A 833,396 18.9% 192,649 23.1% 1,752 0 0 $26.82CLASS B 2,340,738 53.2% 459,577 19.6% 54,672 0 0 $20.59CLASS C 1,224,285 27.8% 104,949 8.6% 5,666 0 0 $18.12
SUBTOTAL 4,398,419 100.0% 757,175 17.2% 62,090 0 0 $21.08
P. 13 | COLLIERS INTERNATIONAL
SOUTH FLORIDA COMMERCIAL REAL ESTATE REVIEW | YEAR END 2010
Contact: Crystal Proenza—[email protected] | Research: Alex Morcate—[email protected]
CLASSTOTAL
INVENTORY (SF)
% OF SUBMARKET
RBA
TOTAL VACANCY
(SF)
TOTAL VACANCY
RATE
TOTAL NET ABSORPTION
TOTAL RBA DELIVERED
TOTAL RBA UNDER
CONSTRUCTION
WEIGHTED AVERAGE RENTAL
RATE (FULL SERVICE)
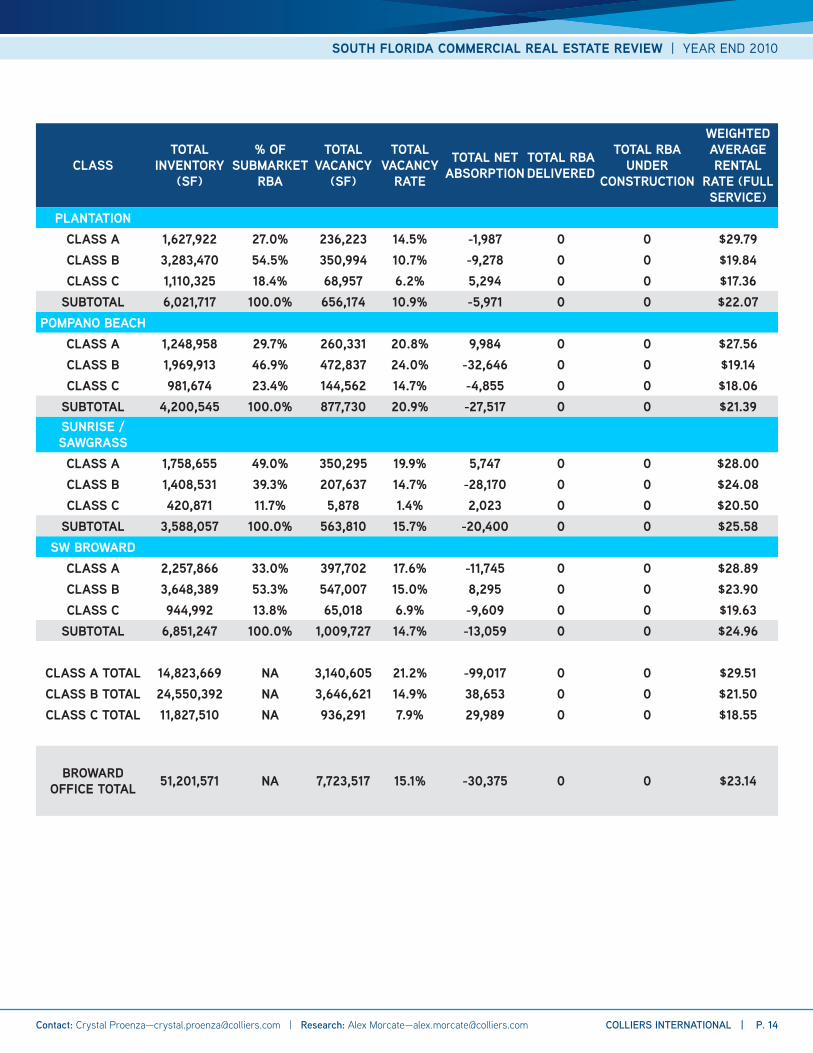
PLANTATIONCLASS A 1,627,922 27.0% 236,223 14.5% -1,987 0 0 $29.79CLASS B 3,283,470 54.5% 350,994 10.7% -9,278 0 0 $19.84CLASS C 1,110,325 18.4% 68,957 6.2% 5,294 0 0 $17.36
SUBTOTAL 6,021,717 100.0% 656,174 10.9% -5,971 0 0 $22.07POMPANO BEACH
CLASS A 1,248,958 29.7% 260,331 20.8% 9,984 0 0 $27.56CLASS B 1,969,913 46.9% 472,837 24.0% -32,646 0 0 $19.14CLASS C 981,674 23.4% 144,562 14.7% -4,855 0 0 $18.06
SUBTOTAL 4,200,545 100.0% 877,730 20.9% -27,517 0 0 $21.39SUNRISE / SAWGRASSCLASS A 1,758,655 49.0% 350,295 19.9% 5,747 0 0 $28.00CLASS B 1,408,531 39.3% 207,637 14.7% -28,170 0 0 $24.08CLASS C 420,871 11.7% 5,878 1.4% 2,023 0 0 $20.50
SUBTOTAL 3,588,057 100.0% 563,810 15.7% -20,400 0 0 $25.58SW BROWARD
CLASS A 2,257,866 33.0% 397,702 17.6% -11,745 0 0 $28.89CLASS B 3,648,389 53.3% 547,007 15.0% 8,295 0 0 $23.90CLASS C 944,992 13.8% 65,018 6.9% -9,609 0 0 $19.63
SUBTOTAL 6,851,247 100.0% 1,009,727 14.7% -13,059 0 0 $24.96
CLASS A TOTAL 14,823,669 NA 3,140,605 21.2% -99,017 0 0 $29.51CLASS B TOTAL 24,550,392 NA 3,646,621 14.9% 38,653 0 0 $21.50CLASS C TOTAL 11,827,510 NA 936,291 7.9% 29,989 0 0 $18.55
BROWARD OFFICE TOTAL 51,201,571 NA 7,723,517 15.1% -30,375 0 0 $23.14
SOUTH FLORIDA COMMERCIAL REAL ESTATE REVIEW | YEAR END 2010
COLLIERS INTERNATIONAL | P. 14 Contact: Crystal Proenza—[email protected] | Research: Alex Morcate—[email protected]
0
100,000
200,000
300,000
400,000
500,000
600,000
700,000
800,000
900,000
1,000,000
2008 3Q 2008 4Q 2009 1Q 2009 2Q 2009 3Q 2009 4Q 2010 1Q 2010 2Q 2010 3Q 2010 4Q
CONSTRUCTION ACTIVITY, SF
SF Under Construction
0.0%
2.0%
4.0%
6.0%
8.0%
10.0%
12.0%
$5.00
$6.00
$7.00
$8.00
$9.00
2008 3Q 2008 4Q 2009 1Q 2009 2Q 2009 3Q 2009 4Q 2010 1Q 2010 2Q 2010 3Q 2010 4Q
RENTAL RATE VS. VACANCY RATE
RENTAL RATE VACANCY RATE
0.0%
2.0%
4.0%
6.0%
8.0%
10.0%
12.0%
(1,200,000)
(1,000,000)
(800,000)
(600,000)
(400,000)
(200,000)
0
200,000
400,000
600,000
2008 3Q 2008 4Q 2009 1Q 2009 2Q 2009 3Q 2009 4Q 2010 1Q 2010 2Q 2010 3Q 2010 4Q
ABSORPTION / DELIVERIES / VACANCY RATE
DELIVERIES ABSORPTION VACANCY RATE
$5.00
$6.00
$7.00
$8.00
$9.00
$10.00
$11.00
$12.00
$13.00
2008 3Q 2008 4Q 2009 1Q 2009 2Q 2009 3Q 2009 4Q 2010 1Q 2010 2Q 2010 3Q 2010 4Q
AVERAGE RENTAL RATES, $ / SF FULL SERVICE
INDUSTRIAL FLEX
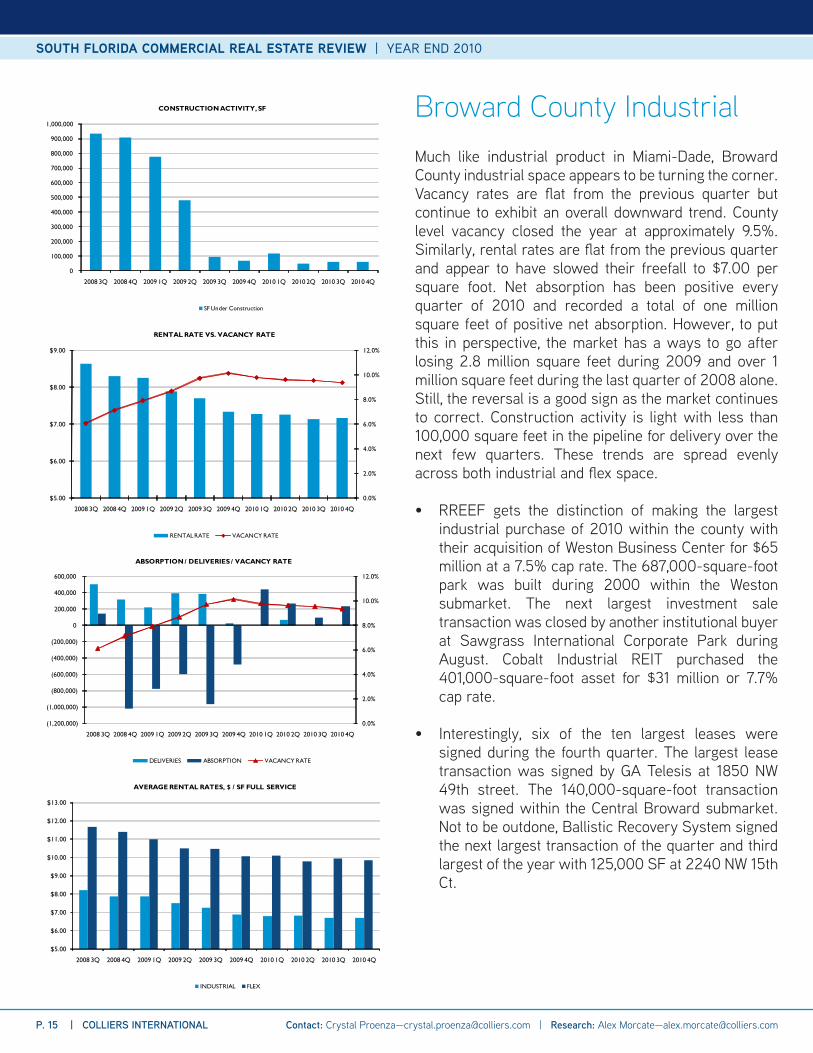
Much like industrial product in Miami-Dade, Broward County industrial space appears to be turning the corner. Vacancy rates are flat from the previous quarter but continue to exhibit an overall downward trend. County level vacancy closed the year at approximately 9.5%. Similarly, rental rates are flat from the previous quarter and appear to have slowed their freefall to $7.00 per square foot. Net absorption has been positive every quarter of 2010 and recorded a total of one million square feet of positive net absorption. However, to put this in perspective, the market has a ways to go after losing 2.8 million square feet during 2009 and over 1 million square feet during the last quarter of 2008 alone. Still, the reversal is a good sign as the market continues to correct. Construction activity is light with less than 100,000 square feet in the pipeline for delivery over the next few quarters. These trends are spread evenly across both industrial and flex space.
• RREEF gets the distinction of making the largest industrial purchase of 2010 within the county with their acquisition of Weston Business Center for $65 million at a 7.5% cap rate. The 687,000-square-foot park was built during 2000 within the Weston submarket. The next largest investment sale transaction was closed by another institutional buyer at Sawgrass International Corporate Park during August. Cobalt Industrial REIT purchased the 401,000-square-foot asset for $31 million or 7.7% cap rate.
• Interestingly, six of the ten largest leases were signed during the fourth quarter. The largest lease transaction was signed by GA Telesis at 1850 NW 49th street. The 140,000-square-foot transaction was signed within the Central Broward submarket. Not to be outdone, Ballistic Recovery System signed the next largest transaction of the quarter and third largest of the year with 125,000 SF at 2240 NW 15th Ct.
Broward County Industrial
P. 15 | COLLIERS INTERNATIONAL
SOUTH FLORIDA COMMERCIAL REAL ESTATE REVIEW | YEAR END 2010
Contact: Crystal Proenza—[email protected] | Research: Alex Morcate—[email protected]
Broward County Industrial Submarket Statistics
TYPETOTAL
INVENTORY (SF)
TOTAL VACANCY (SF)
TOTAL VACANCY
RATE
TOTAL NET ABSORPTION
TOTAL RBA DELIVERED
TOTAL RBA UNDER
WEIGHTED AVERAGE RENTAL
RATE (NNN)
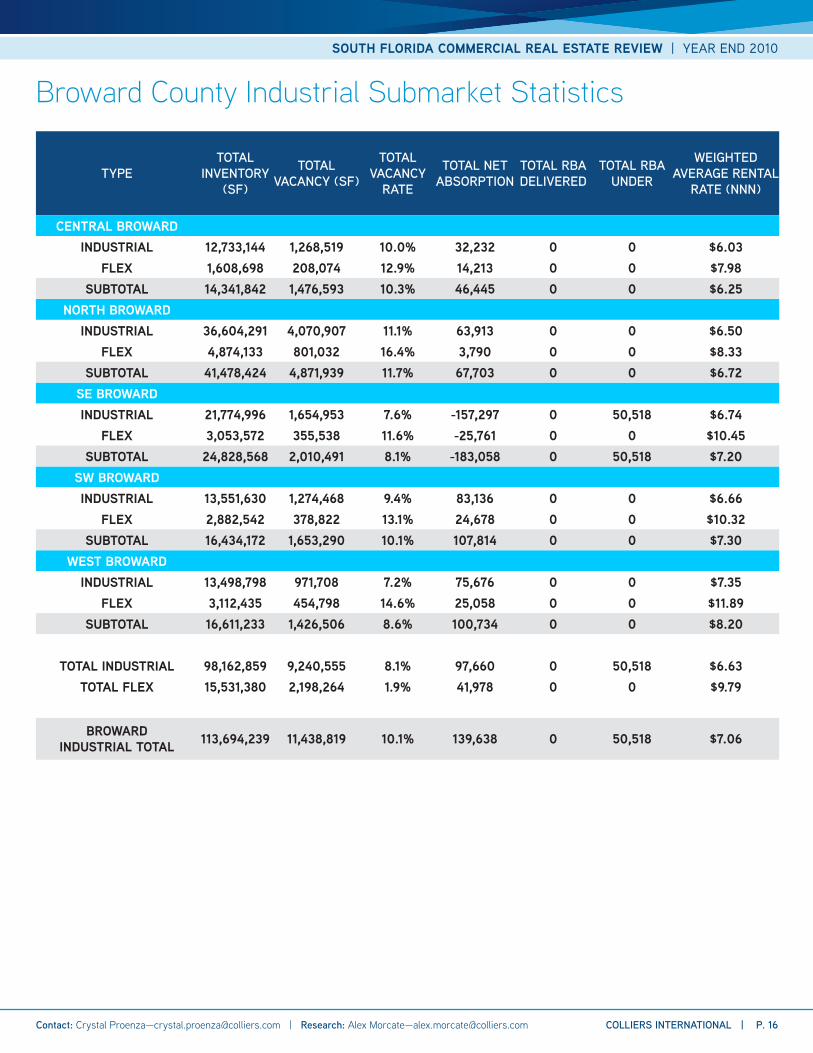
CENTRAL BROWARDINDUSTRIAL 12,733,144 1,268,519 10.0% 32,232 0 0 $6.03
FLEX 1,608,698 208,074 12.9% 14,213 0 0 $7.98SUBTOTAL 14,341,842 1,476,593 10.3% 46,445 0 0 $6.25
NORTH BROWARDINDUSTRIAL 36,604,291 4,070,907 11.1% 63,913 0 0 $6.50
FLEX 4,874,133 801,032 16.4% 3,790 0 0 $8.33SUBTOTAL 41,478,424 4,871,939 11.7% 67,703 0 0 $6.72
SE BROWARDINDUSTRIAL 21,774,996 1,654,953 7.6% -157,297 0 50,518 $6.74
FLEX 3,053,572 355,538 11.6% -25,761 0 0 $10.45SUBTOTAL 24,828,568 2,010,491 8.1% -183,058 0 50,518 $7.20
SW BROWARDINDUSTRIAL 13,551,630 1,274,468 9.4% 83,136 0 0 $6.66
FLEX 2,882,542 378,822 13.1% 24,678 0 0 $10.32SUBTOTAL 16,434,172 1,653,290 10.1% 107,814 0 0 $7.30
WEST BROWARDINDUSTRIAL 13,498,798 971,708 7.2% 75,676 0 0 $7.35
FLEX 3,112,435 454,798 14.6% 25,058 0 0 $11.89SUBTOTAL 16,611,233 1,426,506 8.6% 100,734 0 0 $8.20
TOTAL INDUSTRIAL 98,162,859 9,240,555 8.1% 97,660 0 50,518 $6.63TOTAL FLEX 15,531,380 2,198,264 1.9% 41,978 0 0 $9.79
BROWARD INDUSTRIAL TOTAL 113,694,239 11,438,819 10.1% 139,638 0 50,518 $7.06
SOUTH FLORIDA COMMERCIAL REAL ESTATE REVIEW | YEAR END 2010
COLLIERS INTERNATIONAL | P. 16 Contact: Crystal Proenza—[email protected] | Research: Alex Morcate—[email protected]
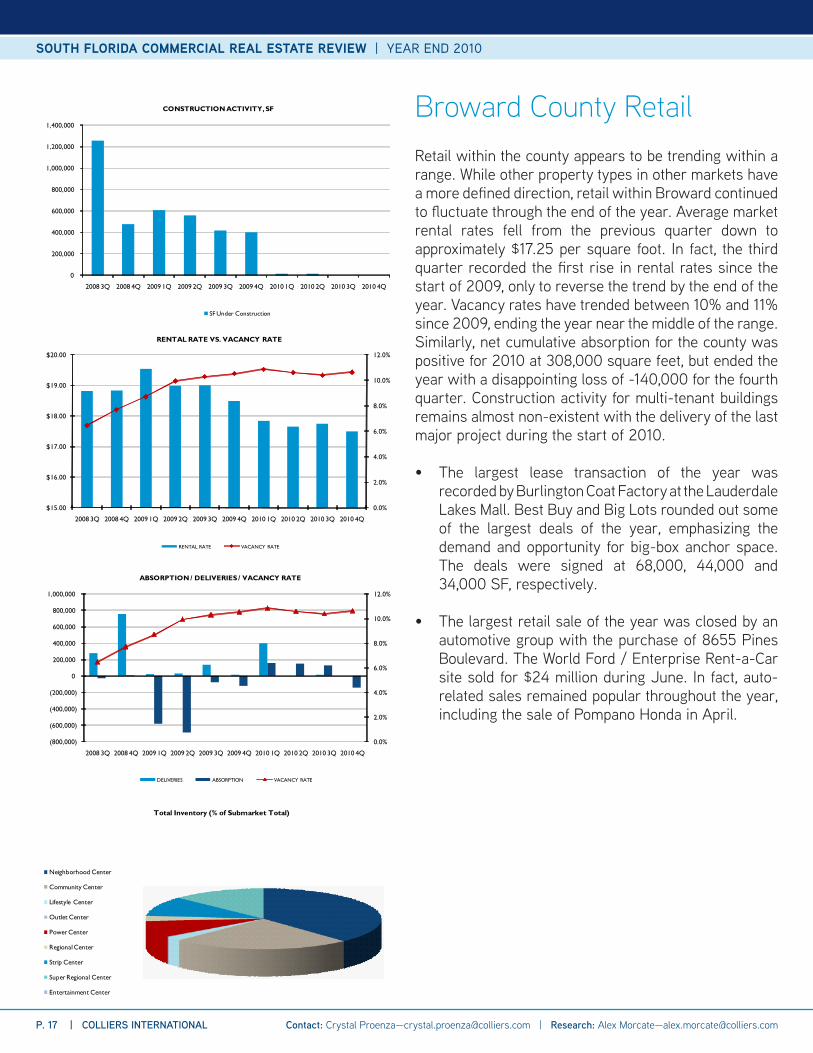
Retail within the county appears to be trending within a range. While other property types in other markets have a more defined direction, retail within Broward continued to fluctuate through the end of the year. Average market rental rates fell from the previous quarter down to approximately $17.25 per square foot. In fact, the third quarter recorded the first rise in rental rates since the start of 2009, only to reverse the trend by the end of the year. Vacancy rates have trended between 10% and 11% since 2009, ending the year near the middle of the range. Similarly, net cumulative absorption for the county was positive for 2010 at 308,000 square feet, but ended the year with a disappointing loss of -140,000 for the fourth quarter. Construction activity for multi-tenant buildings remains almost non-existent with the delivery of the last major project during the start of 2010.
• The largest lease transaction of the year was recorded by Burlington Coat Factory at the Lauderdale Lakes Mall. Best Buy and Big Lots rounded out some of the largest deals of the year, emphasizing the demand and opportunity for big-box anchor space. The deals were signed at 68,000, 44,000 and 34,000 SF, respectively.
• The largest retail sale of the year was closed by an automotive group with the purchase of 8655 Pines Boulevard. The World Ford / Enterprise Rent-a-Car site sold for $24 million during June. In fact, auto-related sales remained popular throughout the year, including the sale of Pompano Honda in April.
Broward County Retail
0
200,000
400,000
600,000
800,000
1,000,000
1,200,000
1,400,000
2008 3Q 2008 4Q 2009 1Q 2009 2Q 2009 3Q 2009 4Q 2010 1Q 2010 2Q 2010 3Q 2010 4Q
CONSTRUCTION ACTIVITY, SF
SF Under Construction
0.0%
2.0%
4.0%
6.0%
8.0%
10.0%
12.0%
$15.00
$16.00
$17.00
$18.00
$19.00
$20.00
2008 3Q 2008 4Q 2009 1Q 2009 2Q 2009 3Q 2009 4Q 2010 1Q 2010 2Q 2010 3Q 2010 4Q
RENTAL RATE VS. VACANCY RATE
RENTAL RATE VACANCY RATE
0.0%
2.0%
4.0%
6.0%
8.0%
10.0%
12.0%
(800,000)
(600,000)
(400,000)
(200,000)
0
200,000
400,000
600,000
800,000
1,000,000
2008 3Q 2008 4Q 2009 1Q 2009 2Q 2009 3Q 2009 4Q 2010 1Q 2010 2Q 2010 3Q 2010 4Q
ABSORPTION / DELIVERIES / VACANCY RATE
DELIVERIES ABSORPTION VACANCY RATE
Total Inventory (% of Submarket Total)
Neighborhood Center
Community Center
Lifestyle Center
Outlet Center
Power Center
Regional Center
Strip Center
Super Regional Center
Entertainment Center
P. 17 | COLLIERS INTERNATIONAL
SOUTH FLORIDA COMMERCIAL REAL ESTATE REVIEW | YEAR END 2010
Contact: Crystal Proenza—[email protected] | Research: Alex Morcate—[email protected]
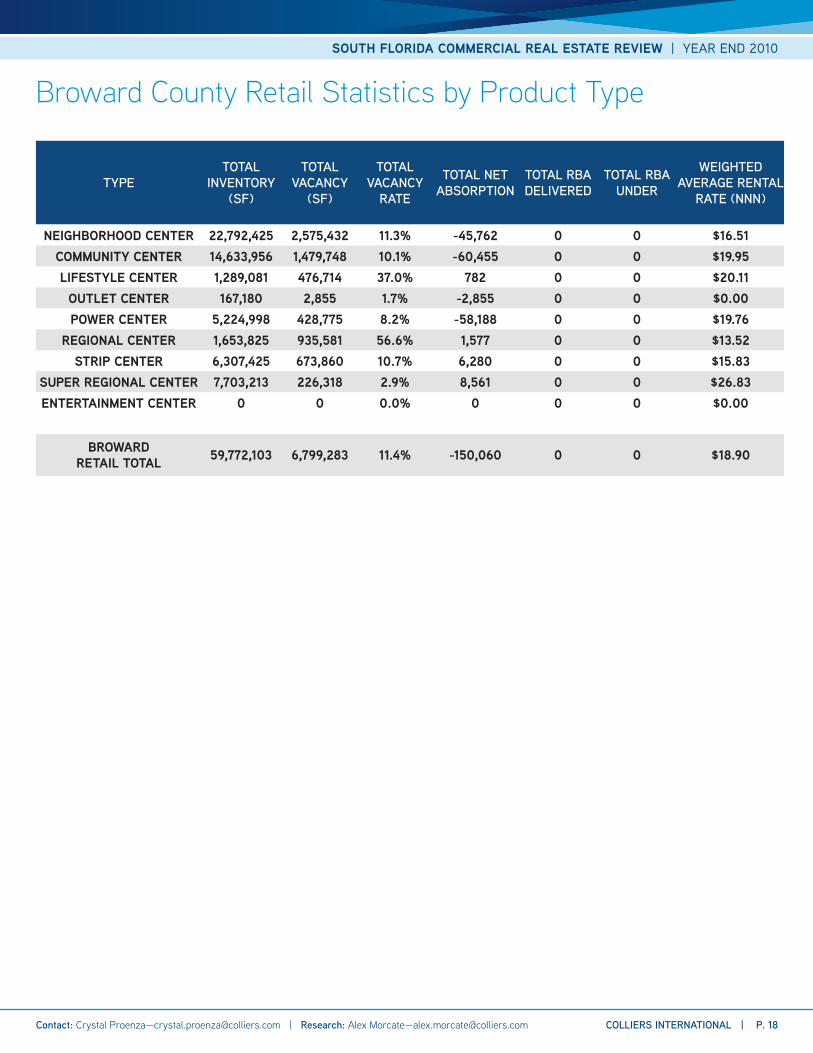
Broward County Retail Statistics by Product Type
TYPETOTAL
INVENTORY (SF)
TOTAL VACANCY
(SF)
TOTAL VACANCY
RATE
TOTAL NET ABSORPTION
TOTAL RBA DELIVERED
TOTAL RBA UNDER
WEIGHTED AVERAGE RENTAL
RATE (NNN)
NEIGHBORHOOD CENTER 22,792,425 2,575,432 11.3% -45,762 0 0 $16.51COMMUNITY CENTER 14,633,956 1,479,748 10.1% -60,455 0 0 $19.95LIFESTYLE CENTER 1,289,081 476,714 37.0% 782 0 0 $20.11
OUTLET CENTER 167,180 2,855 1.7% -2,855 0 0 $0.00POWER CENTER 5,224,998 428,775 8.2% -58,188 0 0 $19.76
REGIONAL CENTER 1,653,825 935,581 56.6% 1,577 0 0 $13.52STRIP CENTER 6,307,425 673,860 10.7% 6,280 0 0 $15.83
SUPER REGIONAL CENTER 7,703,213 226,318 2.9% 8,561 0 0 $26.83ENTERTAINMENT CENTER 0 0 0.0% 0 0 0 $0.00
BROWARD RETAIL TOTAL 59,772,103 6,799,283 11.4% -150,060 0 0 $18.90
SOUTH FLORIDA COMMERCIAL REAL ESTATE REVIEW | YEAR END 2010
COLLIERS INTERNATIONAL | P. 18 Contact: Crystal Proenza—[email protected] | Research: Alex Morcate—[email protected]
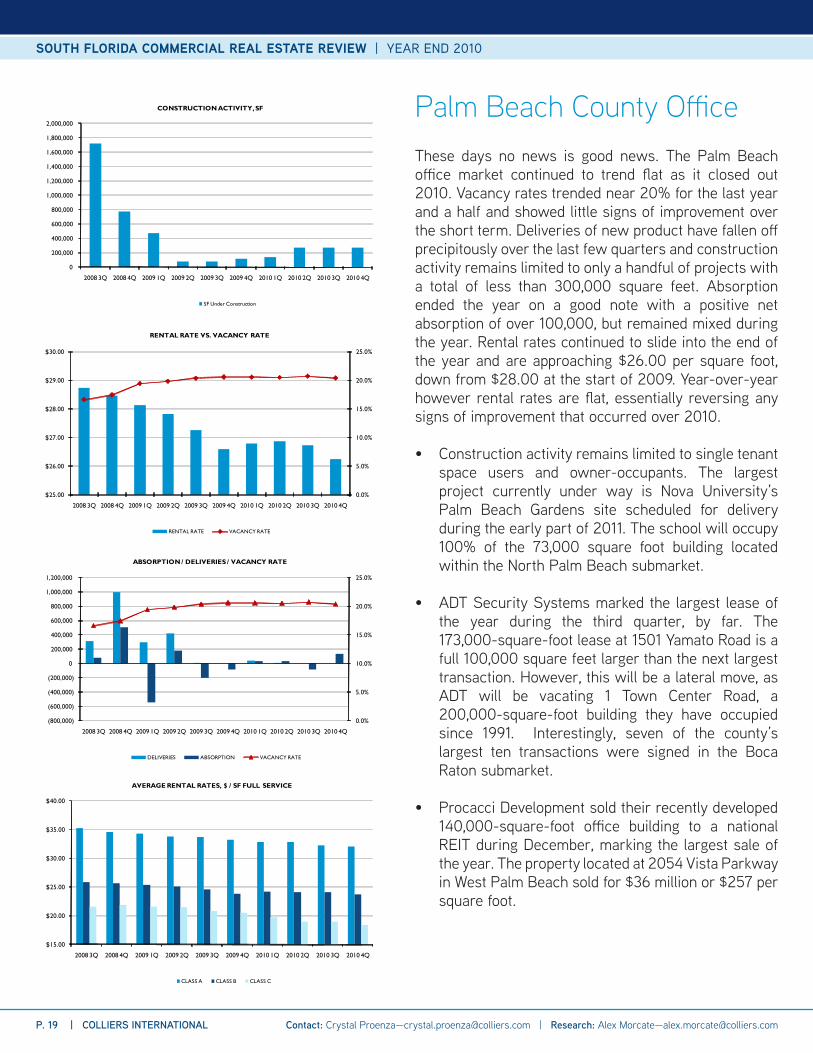
These days no news is good news. The Palm Beach office market continued to trend flat as it closed out 2010. Vacancy rates trended near 20% for the last year and a half and showed little signs of improvement over the short term. Deliveries of new product have fallen off precipitously over the last few quarters and construction activity remains limited to only a handful of projects with a total of less than 300,000 square feet. Absorption ended the year on a good note with a positive net absorption of over 100,000, but remained mixed during the year. Rental rates continued to slide into the end of the year and are approaching $26.00 per square foot, down from $28.00 at the start of 2009. Year-over-year however rental rates are flat, essentially reversing any signs of improvement that occurred over 2010.
• Construction activity remains limited to single tenant space users and owner-occupants. The largest project currently under way is Nova University’s Palm Beach Gardens site scheduled for delivery during the early part of 2011. The school will occupy 100% of the 73,000 square foot building located within the North Palm Beach submarket.
• ADT Security Systems marked the largest lease of the year during the third quarter, by far. The 173,000-square-foot lease at 1501 Yamato Road is a full 100,000 square feet larger than the next largest transaction. However, this will be a lateral move, as ADT will be vacating 1 Town Center Road, a 200,000-square-foot building they have occupied since 1991. Interestingly, seven of the county’s largest ten transactions were signed in the Boca Raton submarket.
• Procacci Development sold their recently developed 140,000-square-foot office building to a national REIT during December, marking the largest sale of the year. The property located at 2054 Vista Parkway in West Palm Beach sold for $36 million or $257 per square foot.
Palm Beach County Office
0
200,000
400,000
600,000
800,000
1,000,000
1,200,000
1,400,000
1,600,000
1,800,000
2,000,000
2008 3Q 2008 4Q 2009 1Q 2009 2Q 2009 3Q 2009 4Q 2010 1Q 2010 2Q 2010 3Q 2010 4Q
CONSTRUCTION ACTIVITY, SF
SF Under Construction
0.0%
5.0%
10.0%
15.0%
20.0%
25.0%
$25.00
$26.00
$27.00
$28.00
$29.00
$30.00
2008 3Q 2008 4Q 2009 1Q 2009 2Q 2009 3Q 2009 4Q 2010 1Q 2010 2Q 2010 3Q 2010 4Q
RENTAL RATE VS. VACANCY RATE
RENTAL RATE VACANCY RATE
0.0%
5.0%
10.0%
15.0%
20.0%
25.0%
(800,000)
(600,000)
(400,000)
(200,000)
0
200,000
400,000
600,000
800,000
1,000,000
1,200,000
2008 3Q 2008 4Q 2009 1Q 2009 2Q 2009 3Q 2009 4Q 2010 1Q 2010 2Q 2010 3Q 2010 4Q
ABSORPTION / DELIVERIES / VACANCY RATE
DELIVERIES ABSORPTION VACANCY RATE
$15.00
$20.00
$25.00
$30.00
$35.00
$40.00
2008 3Q 2008 4Q 2009 1Q 2009 2Q 2009 3Q 2009 4Q 2010 1Q 2010 2Q 2010 3Q 2010 4Q
AVERAGE RENTAL RATES, $ / SF FULL SERVICE
CLASS A CLASS B CLASS C
P. 19 | COLLIERS INTERNATIONAL
SOUTH FLORIDA COMMERCIAL REAL ESTATE REVIEW | YEAR END 2010
Contact: Crystal Proenza—[email protected] | Research: Alex Morcate—[email protected]
CLASS TOTAL INVENTORY (SF)
% OF TOTAL MARKET RBA
TOTAL VACANCY
(SF)
TOTAL VACANCY RATE
TOTAL NET ABSORPTION
TOTAL RBA DELIVERED
TOTAL RBA UNDER CONSTRUCTION
WEIGHTED AVERAGE RENTAL
RATE (FULL SERVICE)
BOCA RATON
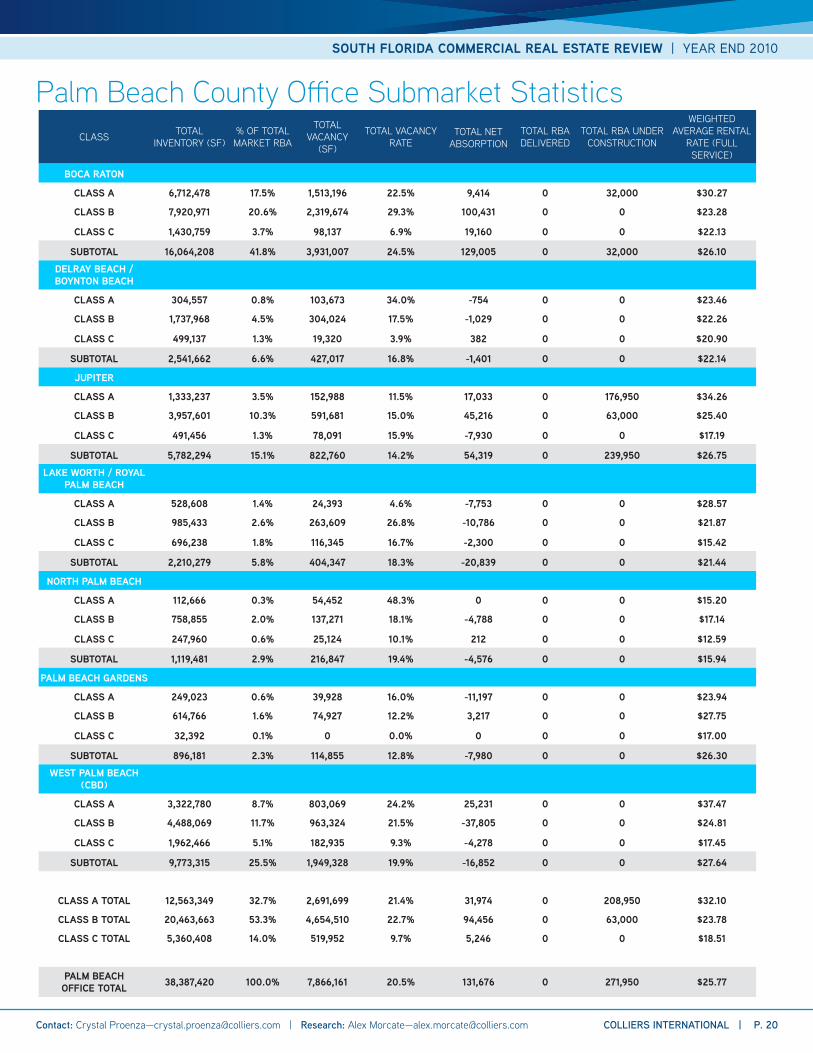
CLASS A 6,712,478 17.5% 1,513,196 22.5% 9,414 0 32,000 $30.27
CLASS B 7,920,971 20.6% 2,319,674 29.3% 100,431 0 0 $23.28
CLASS C 1,430,759 3.7% 98,137 6.9% 19,160 0 0 $22.13
SUBTOTAL 16,064,208 41.8% 3,931,007 24.5% 129,005 0 32,000 $26.10DELRAY BEACH / BOYNTON BEACH
CLASS A 304,557 0.8% 103,673 34.0% -754 0 0 $23.46
CLASS B 1,737,968 4.5% 304,024 17.5% -1,029 0 0 $22.26
CLASS C 499,137 1.3% 19,320 3.9% 382 0 0 $20.90
SUBTOTAL 2,541,662 6.6% 427,017 16.8% -1,401 0 0 $22.14
JUPITER
CLASS A 1,333,237 3.5% 152,988 11.5% 17,033 0 176,950 $34.26
CLASS B 3,957,601 10.3% 591,681 15.0% 45,216 0 63,000 $25.40
CLASS C 491,456 1.3% 78,091 15.9% -7,930 0 0 $17.19
SUBTOTAL 5,782,294 15.1% 822,760 14.2% 54,319 0 239,950 $26.75LAKE WORTH / ROYAL
PALM BEACH
CLASS A 528,608 1.4% 24,393 4.6% -7,753 0 0 $28.57
CLASS B 985,433 2.6% 263,609 26.8% -10,786 0 0 $21.87
CLASS C 696,238 1.8% 116,345 16.7% -2,300 0 0 $15.42
SUBTOTAL 2,210,279 5.8% 404,347 18.3% -20,839 0 0 $21.44
NORTH PALM BEACH
CLASS A 112,666 0.3% 54,452 48.3% 0 0 0 $15.20
CLASS B 758,855 2.0% 137,271 18.1% -4,788 0 0 $17.14
CLASS C 247,960 0.6% 25,124 10.1% 212 0 0 $12.59
SUBTOTAL 1,119,481 2.9% 216,847 19.4% -4,576 0 0 $15.94
PALM BEACH GARDENS
CLASS A 249,023 0.6% 39,928 16.0% -11,197 0 0 $23.94
CLASS B 614,766 1.6% 74,927 12.2% 3,217 0 0 $27.75
CLASS C 32,392 0.1% 0 0.0% 0 0 0 $17.00
SUBTOTAL 896,181 2.3% 114,855 12.8% -7,980 0 0 $26.30WEST PALM BEACH
(CBD)
CLASS A 3,322,780 8.7% 803,069 24.2% 25,231 0 0 $37.47
CLASS B 4,488,069 11.7% 963,324 21.5% -37,805 0 0 $24.81
CLASS C 1,962,466 5.1% 182,935 9.3% -4,278 0 0 $17.45
SUBTOTAL 9,773,315 25.5% 1,949,328 19.9% -16,852 0 0 $27.64
CLASS A TOTAL 12,563,349 32.7% 2,691,699 21.4% 31,974 0 208,950 $32.10
CLASS B TOTAL 20,463,663 53.3% 4,654,510 22.7% 94,456 0 63,000 $23.78
CLASS C TOTAL 5,360,408 14.0% 519,952 9.7% 5,246 0 0 $18.51
PALM BEACH OFFICE TOTAL 38,387,420 100.0% 7,866,161 20.5% 131,676 0 271,950 $25.77
Palm Beach County Office Submarket Statistics
SOUTH FLORIDA COMMERCIAL REAL ESTATE REVIEW | YEAR END 2010
COLLIERS INTERNATIONAL | P. 20 Contact: Crystal Proenza—[email protected] | Research: Alex Morcate—[email protected]
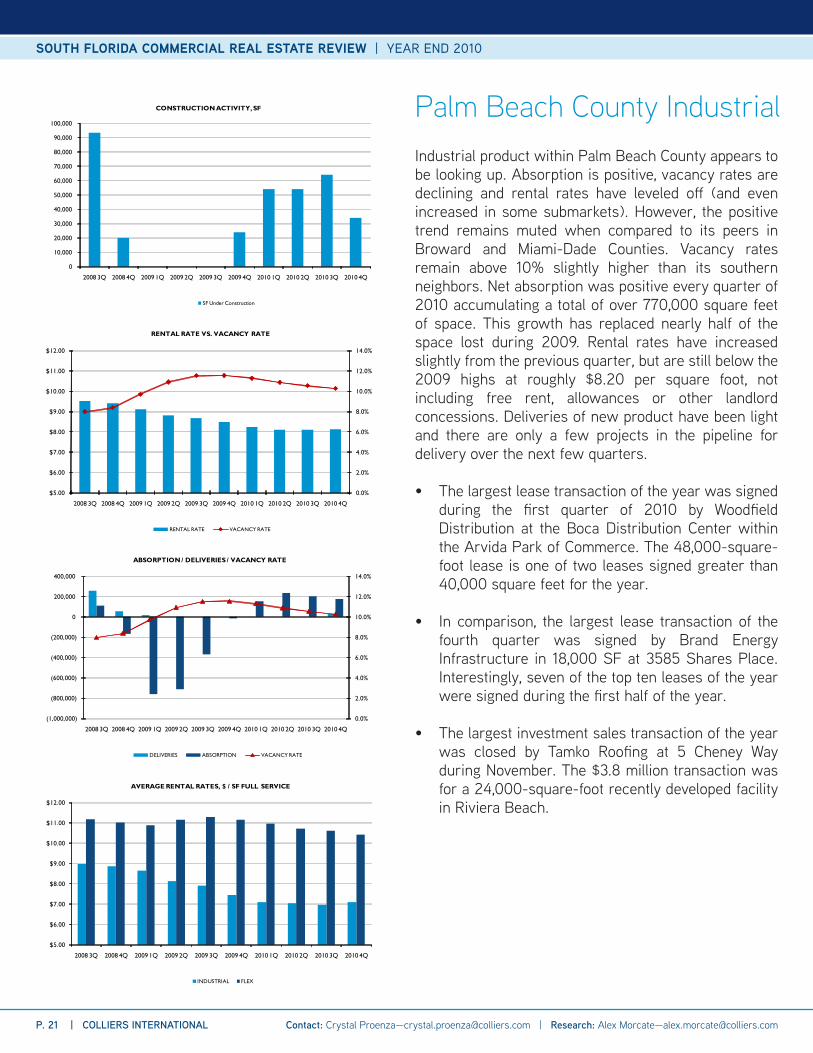
Industrial product within Palm Beach County appears to be looking up. Absorption is positive, vacancy rates are declining and rental rates have leveled off (and even increased in some submarkets). However, the positive trend remains muted when compared to its peers in Broward and Miami-Dade Counties. Vacancy rates remain above 10% slightly higher than its southern neighbors. Net absorption was positive every quarter of 2010 accumulating a total of over 770,000 square feet of space. This growth has replaced nearly half of the space lost during 2009. Rental rates have increased slightly from the previous quarter, but are still below the 2009 highs at roughly $8.20 per square foot, not including free rent, allowances or other landlord concessions. Deliveries of new product have been light and there are only a few projects in the pipeline for delivery over the next few quarters.
• The largest lease transaction of the year was signed during the first quarter of 2010 by Woodfield Distribution at the Boca Distribution Center within the Arvida Park of Commerce. The 48,000-square-foot lease is one of two leases signed greater than 40,000 square feet for the year.
• In comparison, the largest lease transaction of the fourth quarter was signed by Brand Energy Infrastructure in 18,000 SF at 3585 Shares Place. Interestingly, seven of the top ten leases of the year were signed during the first half of the year.
• The largest investment sales transaction of the year was closed by Tamko Roofing at 5 Cheney Way during November. The $3.8 million transaction was for a 24,000-square-foot recently developed facility in Riviera Beach.
Palm Beach County Industrial
0
10,000
20,000
30,000
40,000
50,000
60,000
70,000
80,000
90,000
100,000
2008 3Q 2008 4Q 2009 1Q 2009 2Q 2009 3Q 2009 4Q 2010 1Q 2010 2Q 2010 3Q 2010 4Q
CONSTRUCTION ACTIVITY, SF
SF Under Construction
0.0%
2.0%
4.0%
6.0%
8.0%
10.0%
12.0%
14.0%
$5.00
$6.00
$7.00
$8.00
$9.00
$10.00
$11.00
$12.00
2008 3Q 2008 4Q 2009 1Q 2009 2Q 2009 3Q 2009 4Q 2010 1Q 2010 2Q 2010 3Q 2010 4Q
RENTAL RATE VS. VACANCY RATE
RENTAL RATE VACANCY RATE
0.0%
2.0%
4.0%
6.0%
8.0%
10.0%
12.0%
14.0%
(1,000,000)
(800,000)
(600,000)
(400,000)
(200,000)
0
200,000
400,000
2008 3Q 2008 4Q 2009 1Q 2009 2Q 2009 3Q 2009 4Q 2010 1Q 2010 2Q 2010 3Q 2010 4Q
ABSORPTION / DELIVERIES / VACANCY RATE
DELIVERIES ABSORPTION VACANCY RATE
$5.00
$6.00
$7.00
$8.00
$9.00
$10.00
$11.00
$12.00
2008 3Q 2008 4Q 2009 1Q 2009 2Q 2009 3Q 2009 4Q 2010 1Q 2010 2Q 2010 3Q 2010 4Q
AVERAGE RENTAL RATES, $ / SF FULL SERVICE
INDUSTRIAL FLEX
P. 21 | COLLIERS INTERNATIONAL
SOUTH FLORIDA COMMERCIAL REAL ESTATE REVIEW | YEAR END 2010
Contact: Crystal Proenza—[email protected] | Research: Alex Morcate—[email protected]
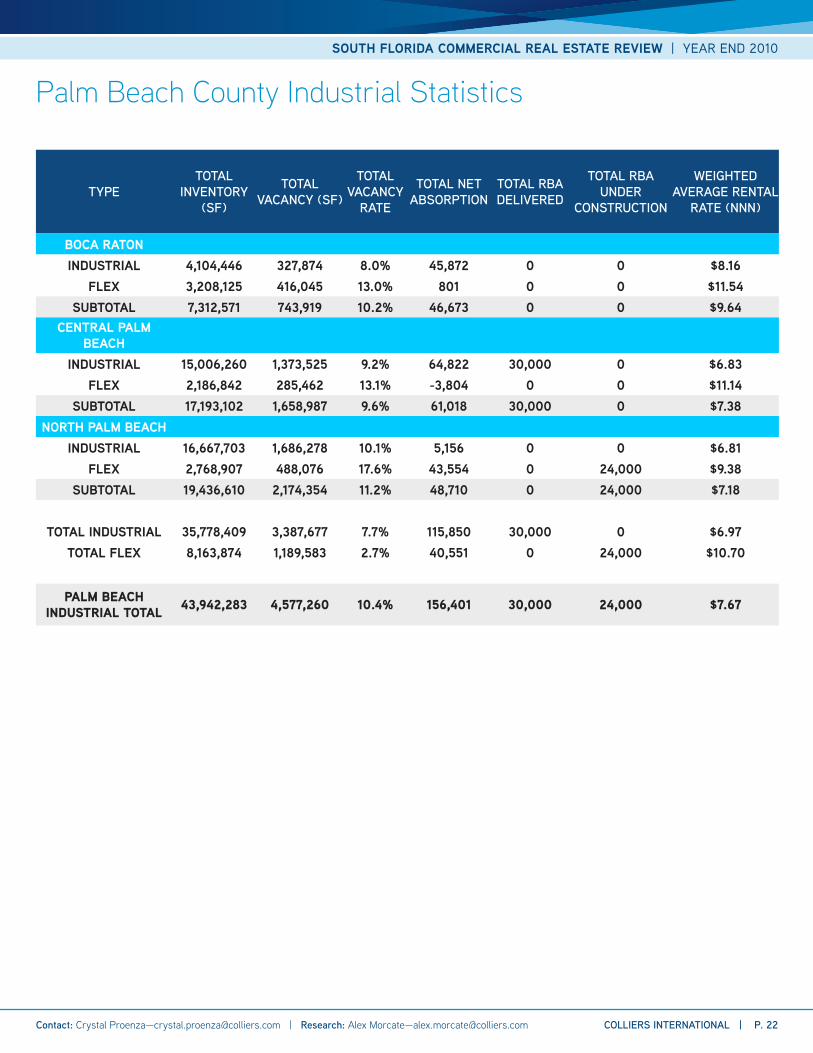
Palm Beach County Industrial Statistics
TYPETOTAL
INVENTORY (SF)
TOTAL VACANCY (SF)
TOTAL VACANCY
RATE
TOTAL NET ABSORPTION
TOTAL RBA DELIVERED
TOTAL RBA UNDER
CONSTRUCTION
WEIGHTED AVERAGE RENTAL
RATE (NNN)
BOCA RATONINDUSTRIAL 4,104,446 327,874 8.0% 45,872 0 0 $8.16
FLEX 3,208,125 416,045 13.0% 801 0 0 $11.54SUBTOTAL 7,312,571 743,919 10.2% 46,673 0 0 $9.64
CENTRAL PALM BEACH
INDUSTRIAL 15,006,260 1,373,525 9.2% 64,822 30,000 0 $6.83FLEX 2,186,842 285,462 13.1% -3,804 0 0 $11.14
SUBTOTAL 17,193,102 1,658,987 9.6% 61,018 30,000 0 $7.38NORTH PALM BEACH
INDUSTRIAL 16,667,703 1,686,278 10.1% 5,156 0 0 $6.81FLEX 2,768,907 488,076 17.6% 43,554 0 24,000 $9.38
SUBTOTAL 19,436,610 2,174,354 11.2% 48,710 0 24,000 $7.18
TOTAL INDUSTRIAL 35,778,409 3,387,677 7.7% 115,850 30,000 0 $6.97TOTAL FLEX 8,163,874 1,189,583 2.7% 40,551 0 24,000 $10.70
PALM BEACH INDUSTRIAL TOTAL 43,942,283 4,577,260 10.4% 156,401 30,000 24,000 $7.67
SOUTH FLORIDA COMMERCIAL REAL ESTATE REVIEW | YEAR END 2010
COLLIERS INTERNATIONAL | P. 22 Contact: Crystal Proenza—[email protected] | Research: Alex Morcate—[email protected]
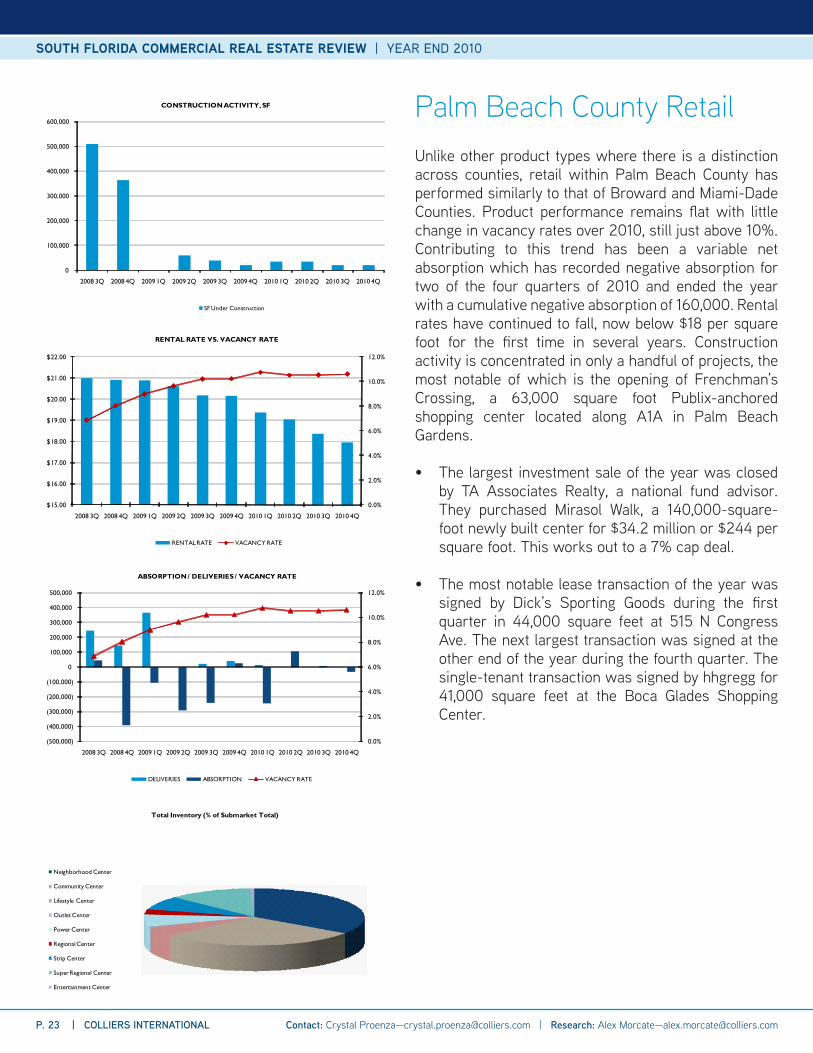
Unlike other product types where there is a distinction across counties, retail within Palm Beach County has performed similarly to that of Broward and Miami-Dade Counties. Product performance remains flat with little change in vacancy rates over 2010, still just above 10%. Contributing to this trend has been a variable net absorption which has recorded negative absorption for two of the four quarters of 2010 and ended the year with a cumulative negative absorption of 160,000. Rental rates have continued to fall, now below $18 per square foot for the first time in several years. Construction activity is concentrated in only a handful of projects, the most notable of which is the opening of Frenchman’s Crossing, a 63,000 square foot Publix-anchored shopping center located along A1A in Palm Beach Gardens.
• The largest investment sale of the year was closed by TA Associates Realty, a national fund advisor. They purchased Mirasol Walk, a 140,000-square-foot newly built center for $34.2 million or $244 per square foot. This works out to a 7% cap deal.
• The most notable lease transaction of the year was signed by Dick’s Sporting Goods during the first quarter in 44,000 square feet at 515 N Congress Ave. The next largest transaction was signed at the other end of the year during the fourth quarter. The single-tenant transaction was signed by hhgregg for 41,000 square feet at the Boca Glades Shopping Center.
Palm Beach County Retail
0
100,000
200,000
300,000
400,000
500,000
600,000
2008 3Q 2008 4Q 2009 1Q 2009 2Q 2009 3Q 2009 4Q 2010 1Q 2010 2Q 2010 3Q 2010 4Q
CONSTRUCTION ACTIVITY, SF
SF Under Construction
0.0%
2.0%
4.0%
6.0%
8.0%
10.0%
12.0%
$15.00
$16.00
$17.00
$18.00
$19.00
$20.00
$21.00
$22.00
2008 3Q 2008 4Q 2009 1Q 2009 2Q 2009 3Q 2009 4Q 2010 1Q 2010 2Q 2010 3Q 2010 4Q
RENTAL RATE VS. VACANCY RATE
RENTAL RATE VACANCY RATE
0.0%
2.0%
4.0%
6.0%
8.0%
10.0%
12.0%
(500,000)
(400,000)
(300,000)
(200,000)
(100,000)
0
100,000
200,000
300,000
400,000
500,000
2008 3Q 2008 4Q 2009 1Q 2009 2Q 2009 3Q 2009 4Q 2010 1Q 2010 2Q 2010 3Q 2010 4Q
ABSORPTION / DELIVERIES / VACANCY RATE
DELIVERIES ABSORPTION VACANCY RATE
Total Inventory (% of Submarket Total)
Neighborhood Center
Community Center
Lifestyle Center
Outlet Center
Power Center
Regional Center
Strip Center
Super Regional Center
Entertainment Center
P. 23 | COLLIERS INTERNATIONAL
SOUTH FLORIDA COMMERCIAL REAL ESTATE REVIEW | YEAR END 2010
Contact: Crystal Proenza—[email protected] | Research: Alex Morcate—[email protected]
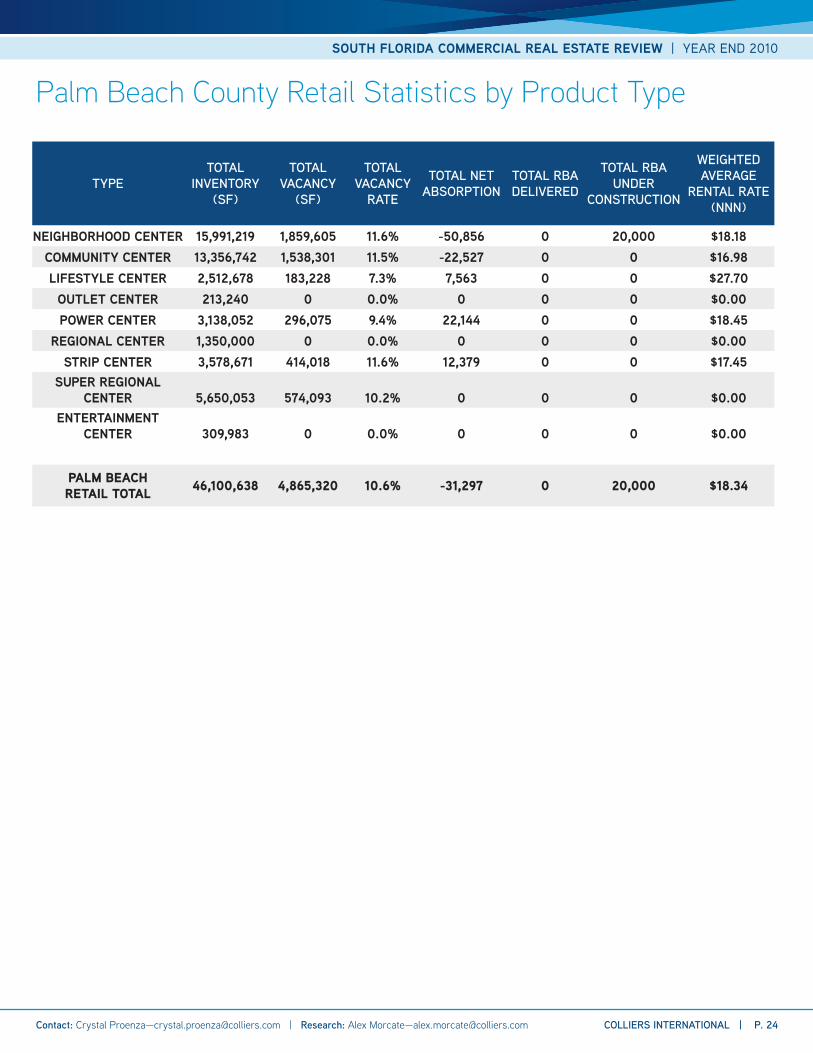
Palm Beach County Retail Statistics by Product Type
TYPETOTAL
INVENTORY (SF)
TOTAL VACANCY
(SF)
TOTAL VACANCY
RATE
TOTAL NET ABSORPTION
TOTAL RBA DELIVERED
TOTAL RBA UNDER
CONSTRUCTION
WEIGHTED AVERAGE
RENTAL RATE (NNN)
NEIGHBORHOOD CENTER 15,991,219 1,859,605 11.6% -50,856 0 20,000 $18.18COMMUNITY CENTER 13,356,742 1,538,301 11.5% -22,527 0 0 $16.98LIFESTYLE CENTER 2,512,678 183,228 7.3% 7,563 0 0 $27.70
OUTLET CENTER 213,240 0 0.0% 0 0 0 $0.00POWER CENTER 3,138,052 296,075 9.4% 22,144 0 0 $18.45
REGIONAL CENTER 1,350,000 0 0.0% 0 0 0 $0.00STRIP CENTER 3,578,671 414,018 11.6% 12,379 0 0 $17.45
SUPER REGIONAL CENTER 5,650,053 574,093 10.2% 0 0 0 $0.00
ENTERTAINMENT CENTER 309,983 0 0.0% 0 0 0 $0.00
PALM BEACH RETAIL TOTAL 46,100,638 4,865,320 10.6% -31,297 0 20,000 $18.34
SOUTH FLORIDA COMMERCIAL REAL ESTATE REVIEW | YEAR END 2010
COLLIERS INTERNATIONAL | P. 24 Contact: Crystal Proenza—[email protected] | Research: Alex Morcate—[email protected]

Colliers International South Florida Team
Carol Ellis-CutlerSenior Vice President - [email protected]
David C. Metalonis, CCIMSenior Vice President [email protected]
Jay A. Ziv, CCIM, SIORSenior Vice President – [email protected]
John K. CrottySenior Vice President – [email protected]
Randy OlenExecutive Vice President - [email protected]
Michael T. [email protected]
Stephen NostrandManaging [email protected]
Achikam YogevSenior Vice [email protected]
Alison PagesSenior Vice [email protected]
Bill Cutler, CPM, RPASenior Vice [email protected]
Christian Johannsen, CCIMSenior Vice [email protected]
Claire HolashSenior Commercial [email protected]
Clinton M. CaseySenior Commercial [email protected]
Jeff ResnickCommercial [email protected]
Joe AboodOffice Leasing [email protected]
Kathy Perez-GurriSenior Commercial [email protected]
Kevin G. KowalskiSenior Vice [email protected]
Kris WagnerSenior Commercial [email protected]
Lawrence H. StocktonSenior Vice [email protected]
Lee WheelerSenior Vice [email protected]
Matthew AndersonOffice Leasing [email protected]
Mia StierheimSenior Vice [email protected]
Owen G. ConeSenior [email protected]
Pani RoshaniCommercial [email protected]
Peyton MooreCommercial [email protected]
Robert R. Listokin, SIORSenior Vice [email protected]
Ronald W. OsborneVice [email protected]
Rosemarie RiveraCommercial [email protected]
Sal Bonsignore, CCIMSenior Commercial [email protected]
Susan M. Traino, CPA, CCIMVice [email protected]
Ted HarrisVice [email protected]
Xavier CossardCommercial [email protected]
RECEIVERSHIPBruce KassmanReceiver / Executive Vice [email protected]
PRINCIPALS
PARTNERS
BROKER TEAM
Donna AboodChief Executive [email protected]
Thomas D. Wood, Jr.Chief Operating [email protected]
Colliers InternationalSouth FloridaCommercial Real Estate Services95 Merrick Way, Suite 380Miami, FL 33129TEL +1 305 446 0011FAX +1 305 446 1907
480 offices in 61 countries
• $1.6 billion in annual revenue• 1.4 billion square feet under management• Over 15,000 professionals
Accelerating success.