southeast asia wheat foods industry€¦ · noodles 20% 580 cookies & crackers 20% 580 pasta 4%...
TRANSCRIPT

Southeast Asia
Wheat Foods Industry
North Asia Marketing Conference
August 2018
Matt Weimar
Regional Vice President - South Asia
(ASEAN, Sub-Continent, Oceania)
Senior Advisor - Asia
Prepared and Edited by
Joe Sowers
Regional Vice President
Philippines and South Korea

ASEAN GDPPPP(trillion int.
dollars) Real growth rate forecast
GDP
2018 2013 2014 2015 2016 2017 2018
Indonesia 3.243 5.6 5.0 4.9 5.0 5.2 5.4
Thailand 1.229 2.8 0.9 2.9 3.2 3.1 4.1
Malaysia 0.926 5.5 6.0 5.0 4.2 5.0 5.3
Philippines 0.875 7.1 6.1 6.1 6.9 6.7 6.8
Vietnam 0.644 5.2 6.0 6.7 6.1 6.7 6.8
Singapore 0.514 4.7 3.6 1.9 2.0 2.4 3.0
Myanmar 0.331 8.4 8.7 7.3 6.5 6.7 5.9
Source: CIA World Factbook/World Bank

ASEAN Population Growth
Population 2018
(millions)Growth Rate Median age
Indonesia 260,581 0.9% 29.9
Philippines 104,256 1.6% 23.4
Vietnam 96,160 0.9% 30.1
Thailand 68,414 0.3% 37.2
Burma 55,124 0.9% 28.6
Malaysia 31,382 1.4% 27.8
Cambodia/Laos 22,697 1.7% 27.6
Singapore 5,889 1.9% 34.3
Source: CIA World Factbook
Japan 126,451 (0.2%) 46.9
South Korea 51,181 0.5% 41.2
Taiwan 23,508 0.2% 40.2

Philippines Age Pyramid
90%

Philippines/Japan Age Pyramids
90%60%

Growing Prosperity and Urbanization Shifts Appetites
Per Capita Wheat Consumption for Food Use
5
10
15
20
25
30
35
kg/capita Indonesia Thailand Vietnam
Source: USDA/Euromonitor
Up 228%
Up 139%
Up 121% from 1993

0
5
10
15
20
25
30
07/08 08/09 09/10 10/11 11/12 12/13 13/14 14/15 15/16 16/17 17/18 18/19
mill
ion
met
ric
ton
s
ASEAN Wheat Imports
Source: USDA
14.9 MMT
28.8 MMT
12.3 MMT

0
5
10
15
20
25
30
07/08 08/09 09/10 10/11 11/12 12/13 13/14 14/15 15/16 16/17 17/18 18/19
feed
food
ASEAN Food and Feed Wheat Use
Source: USDA
77%7.8 MMT
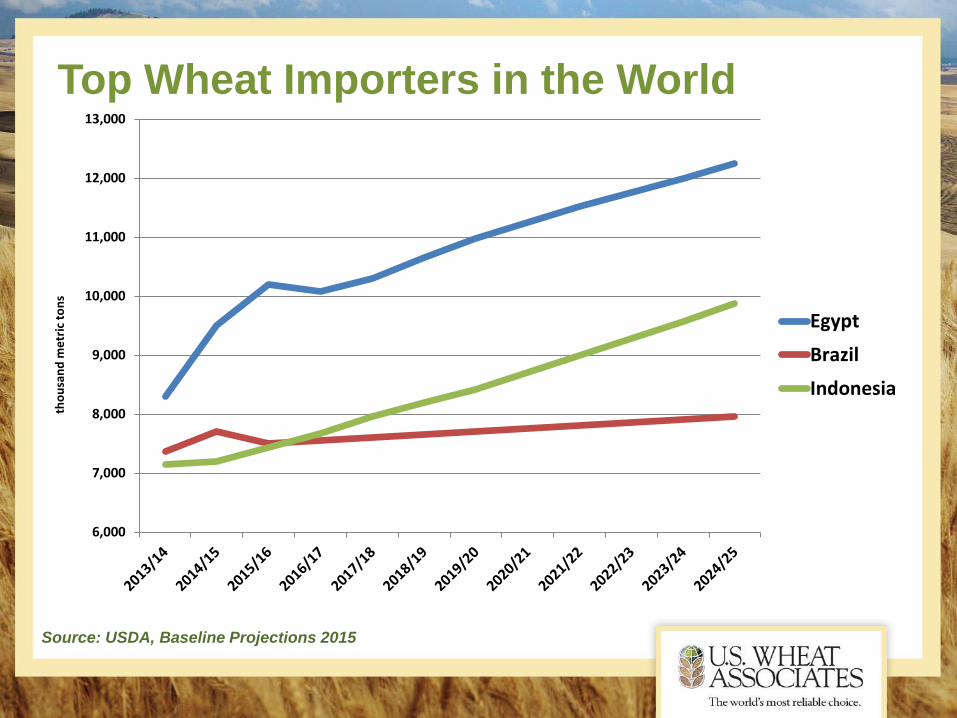
Top Wheat Importers in the World
6,000
7,000
8,000
9,000
10,000
11,000
12,000
13,000
tho
usa
nd
me
tric
to
ns
Egypt
Brazil
Indonesia
Source: USDA, Baseline Projections 2015

Source: USDA: Production, Supply and Distribution
5
6
7
8
9
10
11
12
13
07/08 08/09 09/10 10/11 11/12 12/13 13/14 14/15 15/16 16/17 17/18
mill
ion
met
ric
ton
s
Indonesia Egypt Brazil Algeria
Top Wheat Importers in the World

Source: USDA: Production, Supply and Distribution
5
6
7
8
9
10
11
12
13
07/08 08/09 09/10 10/11 11/12 12/13 13/14 14/15 15/16 16/17 17/18
mill
ion
met
ric
ton
s
Indonesia Egypt Brazil Algeria
Top Wheat Importers in the World
0
2
4
6
8
10
12
14
07/08 08/09 09/10 10/11 11/12 12/13 13/14 14/15 15/16 16/17 17/18 18/19
mill
ion
met
ric
ton
s
feed
food
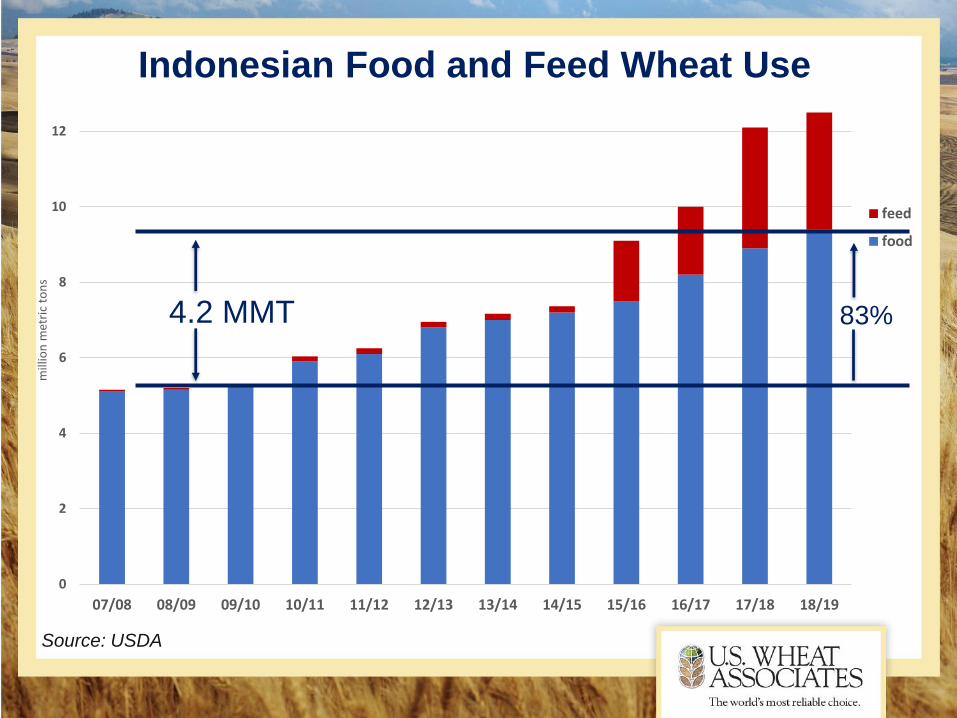
Indonesian Food and Feed Wheat Use
Source: USDA
83%4.2 MMT

1970-98

Bogasari, 50%
Others, 10%Nutridon, 2%
WINA, 3%
Panganmas, 3%
Bungasari, 5%
Sriboga, 5%
Pundi Kencana, 6%
Eastern Pearl, 7%
Cerestar, 10%CY 17 actuals
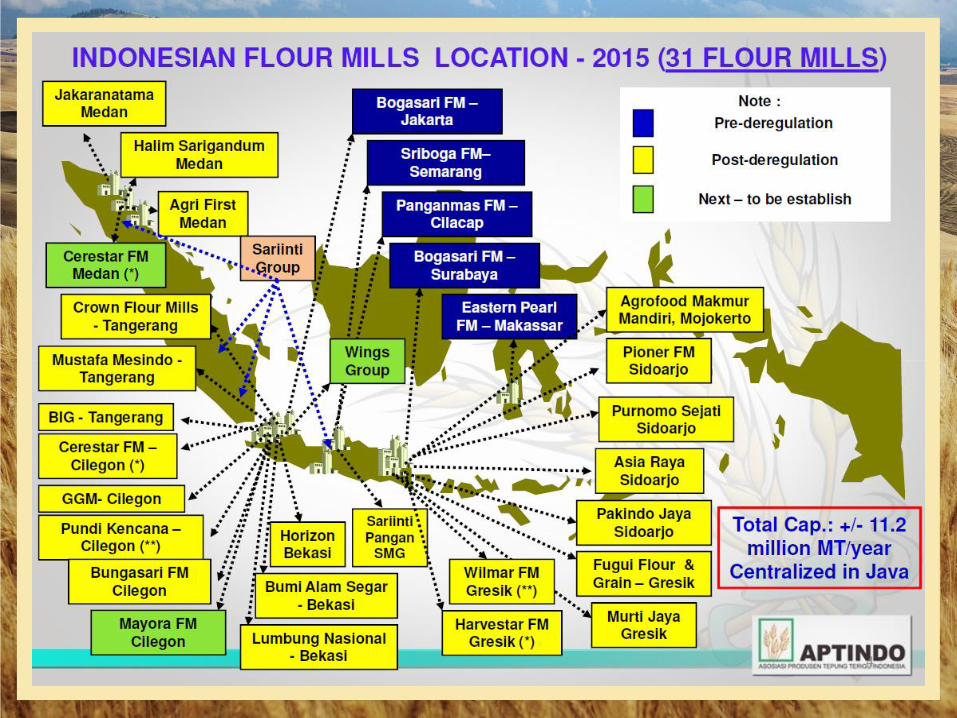
Indonesian Mills• Single mill with ~ 50% market share
– Bogasari also has interest in Eastern Pearl
– Market making price power
• 50% of flour sold at negative margin
• Several balance sheets are weak
– Feed wheat is saving the weakest
– Keeping flour prices low
• 8.8 MMT milling wheat in MY17/18
– 79% utilization
Source: Aptindo
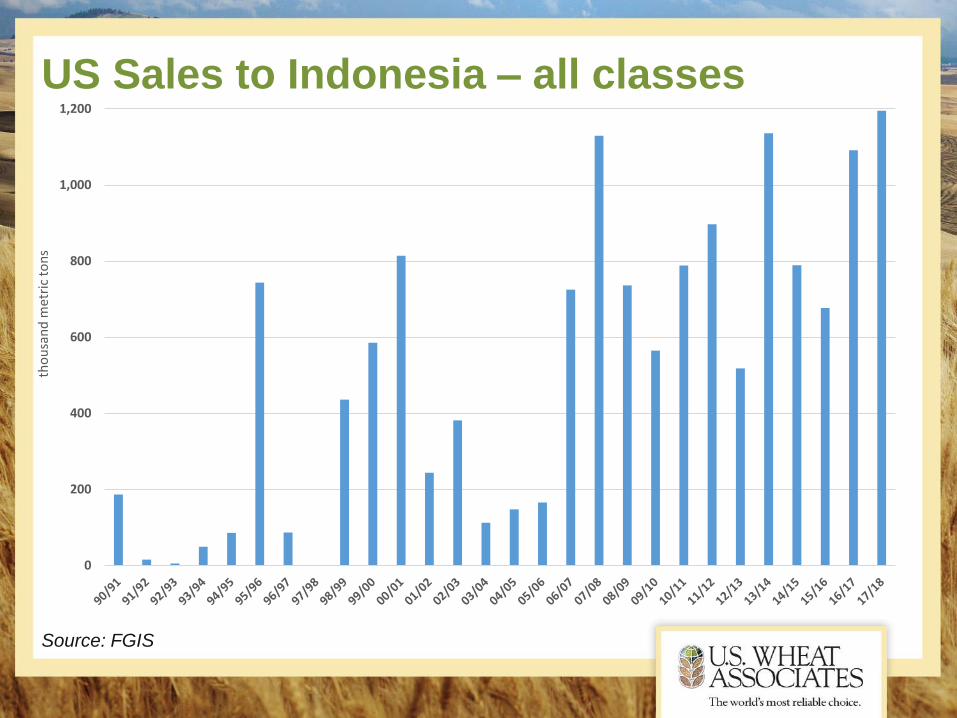
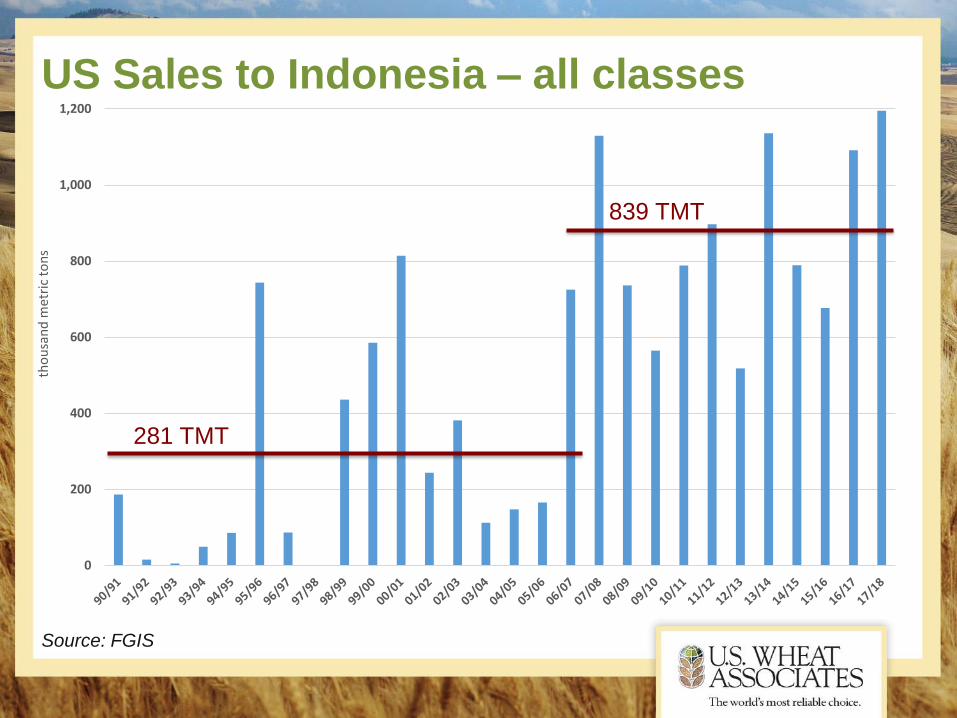
US Sales to Indonesia – all classes
Source: FGIS
0
200
400
600
800
1,000
1,200
tho
usa
nd
met
ric
ton
s
US Sales to Indonesia – all classes
Source: FGIS
0
200
400
600
800
1,000
1,200
tho
usa
nd
met
ric
ton
s
281 TMT
839 TMT

US Sales to Indonesia – by class
-
200
400
600
800
1,000
1,200
2017/182015/162013/142011/122009/102007/08
tho
usa
nd
me
tric
to
ns
SRW
HRW
SW
HRS
Source: USDA Export Sales

8.2 MMT wheat marketSME Ind. HH
1,000 metric tons
5,330 2,460 410
Noodles 1,812 2,140 - 48%
Biscuit/conf. 800 246 - 13%
Baked goods 2,399 74 - 30%
others 320 - 410 9%
share TMT
Australia 47% 3,854
Canada 20% 1,640
Black Sea 15% 1,230
US 13% 1,066
others 5% 410

20
SMALL MEDIUM ENTERPRISE (SME)
BAKERY
• Mixers


Top 10 Customers for U.S. Wheat5-year average
0.0
0.5
1.0
1.5
2.0
2.5
3.0
3.5
MM
T
Source: USDA FAS Export sales data
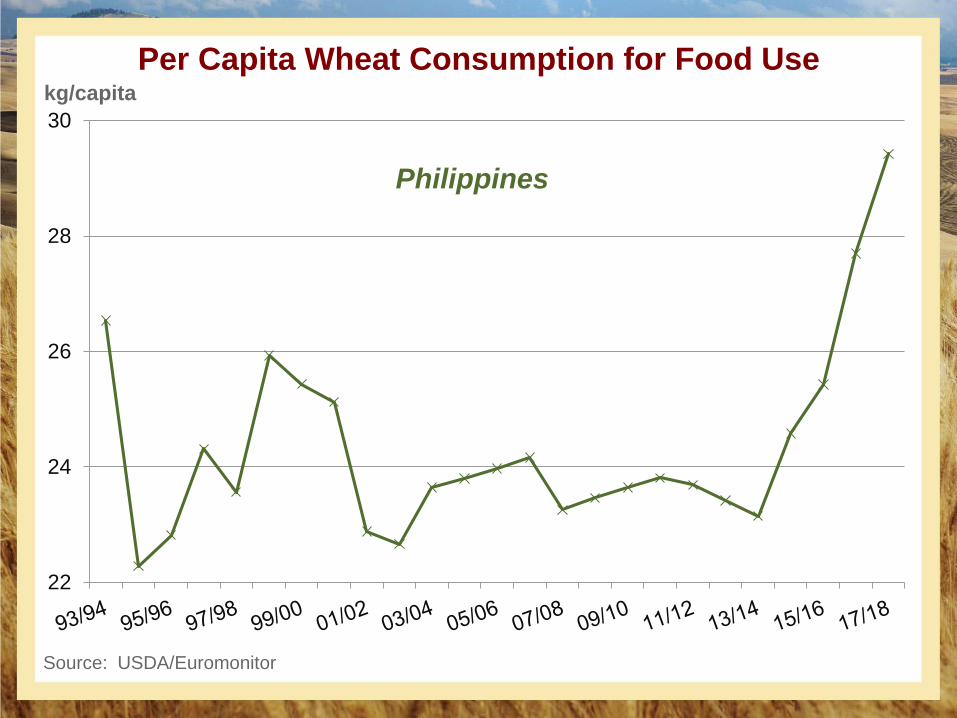
Per Capita Wheat Consumption for Food Use
22
24
26
28
30
kg/capita
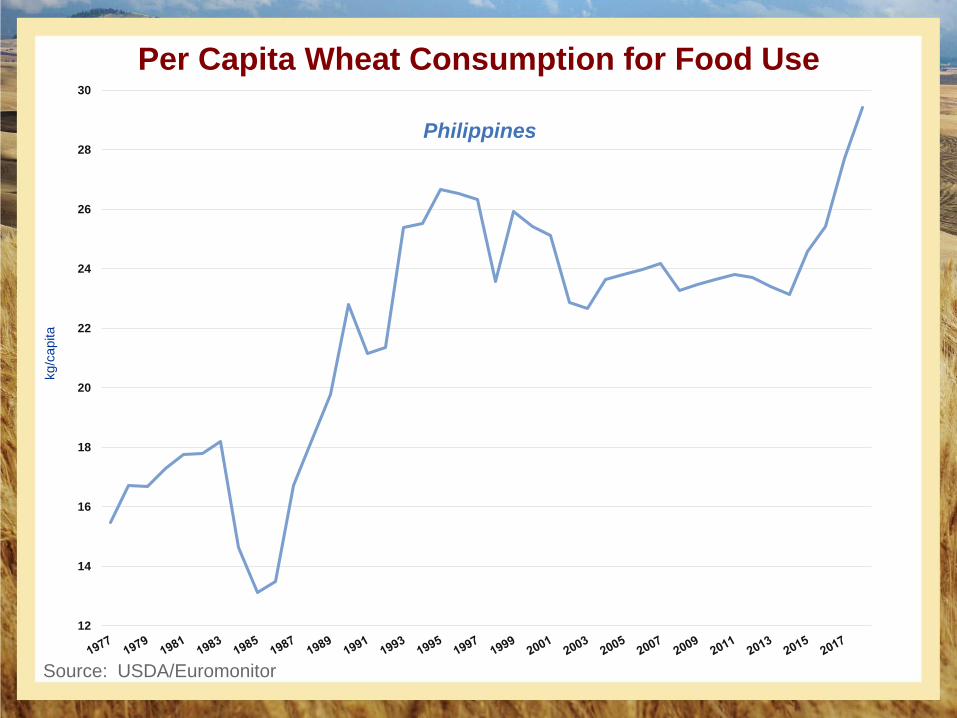
Philippines
Source: USDA/Euromonitor
12
14
16
18
20
22
24
26
28
30
kg/c
apita
Philippines
Per Capita Wheat Consumption for Food Use
Source: USDA/Euromonitor
-10
-8
-6
-4
-2
0
2
4
6
8
10
12
14
16
18
20
22
24
26
28
30
% g
row
th
kg/c
apita
Philippines
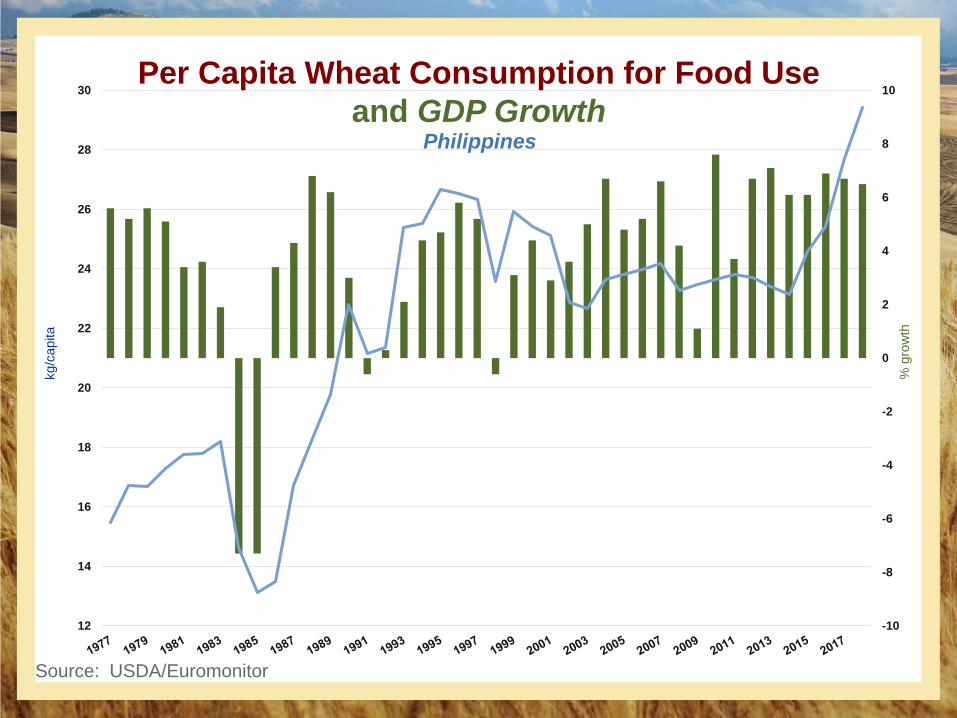
Per Capita Wheat Consumption for Food Use
and GDP Growth
Source: USDA/Euromonitor

Philippines: New Capital of Call Centers
• $70 billion - 8% of GDP
• 1.5 million employees• Companies shift facilities from
India to the Philippines
• Proficient English, preferred
accent and customer service
aptitude
• Fast paced, 24/7, commuting
lifestyle

Source: USDA/Euromonitor kg/person/year
100
110
120
130
140
150
160
170
1997 1998 1999 2000 2001 2002 2003 2004 2005 2006 2007 2008 2009 2010 2011 2012 2013 2014 2015 2016 2017 2018
Philippines Indonesia
Per capita rice consumption

- 50 100 150 200 250 300
Vietnam
Thailand
Philippines
Indonesia
Japan
Brazil
Malaysia
South Korea
Singapore
Mexico
Taiwan
India
China
United States
Iraq
Australia
Canada
Iran
Egypt
Kazakhstan
Wheat Food UseSelected countries
Source: USDA/Euromonitor kg/person/year

- 50 100 150 200 250 300
Vietnam
Thailand
Philippines
Indonesia
Japan
Brazil
Malaysia
South Korea
Singapore
Mexico
Taiwan
India
China
United States
Iraq
Australia
Canada
Iran
Egypt
Kazakhstan
Wheat Food UseSelected countries
kg/person/yearSource: USDA/Euromonitor
-
500
1,000
1,500
2,000
2,500
3,000
2017/182015/162013/142011/122009/102007/08
tho
usa
nd
me
tric
to
ns
SRW
HRW
SW
HRS
Source: USDA Export Sales
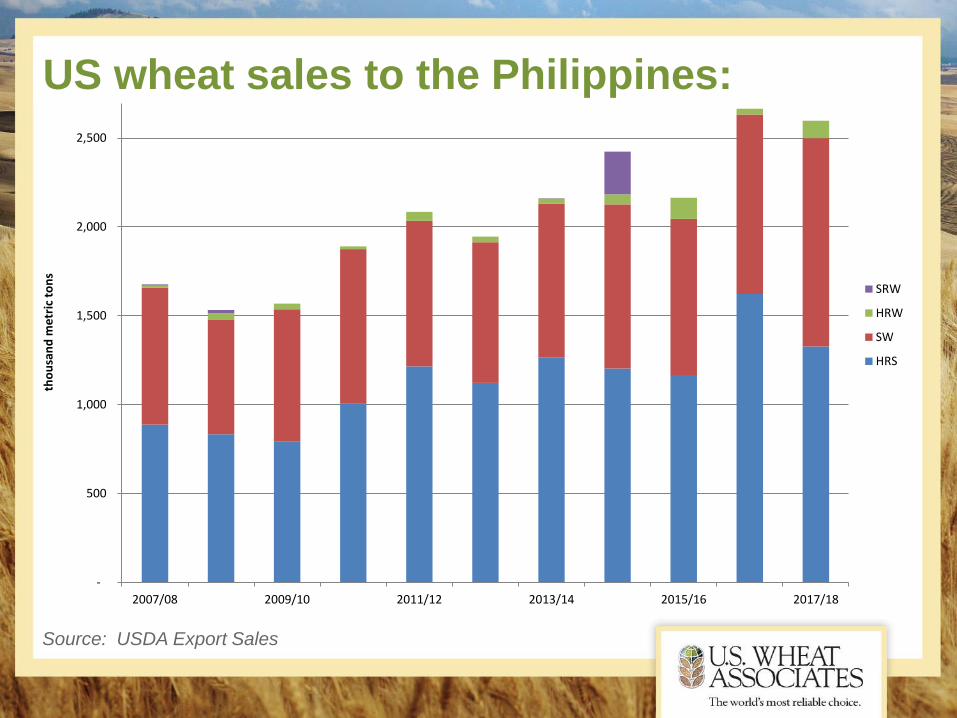
US wheat sales to the Philippines:

US wheat sales to the Philippines:
2010/11 through 17/18: 91% average market share
91%
8%1%
Market Share of Philippine Milling Wheat Imports
US Canada Australia
Source: Philippine Census

Philippine Wheat Foods Use
% of total use1,000 MT
(wheat equivalent)
Bakery products* 50% 1,450
Noodles 20% 580
Cookies & Crackers 20% 580
Pasta 4% 120
Others 6% 175
*bakery products detail % of bakery segment
Pan de Sal and derivatives 35% 500
Loaf bread 30% 450
Buns and rolls 20% 300
Cakes and Pastries 10% 150
Chinese products (sio pao) 5% 70
Source: Industry sources
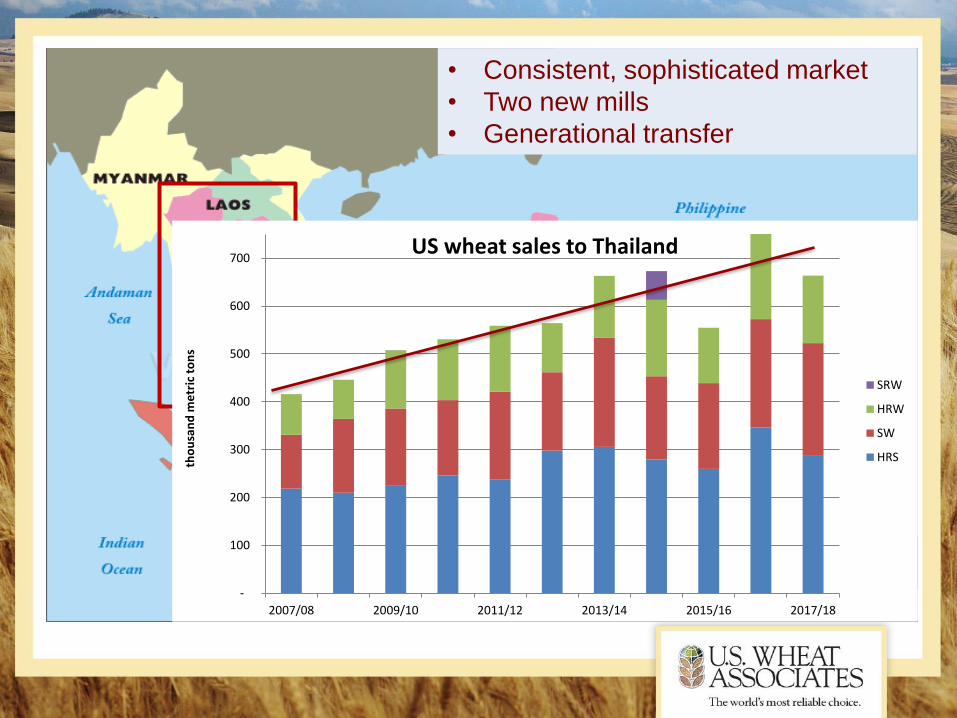
• Consistent, sophisticated market
• Two new mills
• Generational transfer
-
100
200
300
400
500
600
700
2017/182015/162013/142011/122009/102007/08
tho
usa
nd
me
tric
to
ns
US wheat sales to Thailand
SRW
HRW
SW
HRS

• Strong economic growth
• Fast food penetration
• New import infrastructure and mills
• Noodle consumption strong
• US wheat blocked from Dec.’16 – Aug.’17
• Tariff disadvantage to Australia now TPP
disadvantage to Canada
-
50
100
150
200
250
300
2017/182015/162013/142011/122009/102007/08
tho
usa
nd
me
tric
to
ns
US wheat sales to Vietnam
SRW
HRW
SW
HRS

• Home to regional milling companies
• Subsidized “GP” flour – 40% of market
– 1 kg bags only
• GOM maintains informal price control
10
-
50
100
150
200
250
300
350
2017/182015/162013/142011/122009/102007/08
tho
usa
nd
me
tric
to
ns
US wheat sales to Malaysia
SRW
HRW
SW
HRS

Southeast Asia Flour Milling Industry
Philippines 8%
Indonesia 40%
Vietnam 50%
Malaysia 15%
Thailand 5%
- Capacity Change from 2001 through 2011
Annual Regional Milling Capacity Increases by 3 MMT from 2001-2011

Southeast Asia Flour Milling Industry
Philippines 8%
Indonesia 40%
Vietnam 50%
Malaysia 15%
Thailand 5% +39%+40%
+34%
+39%
+0%
Myanmar 109%
- Capacity Change from 2012 through 2018
Annual Regional Milling Capacity Increases by 3 MMT from 2001-2011
and an additional 7 MMT from 2012-2018
Regional milling use up 10.4 MMT from 2001-2018

0
1,000
2,000
3,000
4,000
5,000
6,000
2017/182015/162013/142011/122009/102007/08
tho
usa
nd
me
tric
to
ns
SRW
HRW
SW
HRS
US wheat sales to South Asia