southeastern pennsylvania transportation...
TRANSCRIPT
Southeastern Pennsylvania Transportation Authority
Jeffrey D. Knueppel, PE Assistant General Manager and Chief Engineer
Laura J. Zale Senior Asset Management Analyst
AECOM
Robert Peskin, Aaron Kozuki, and Adrian Merceron
April 18, 2012
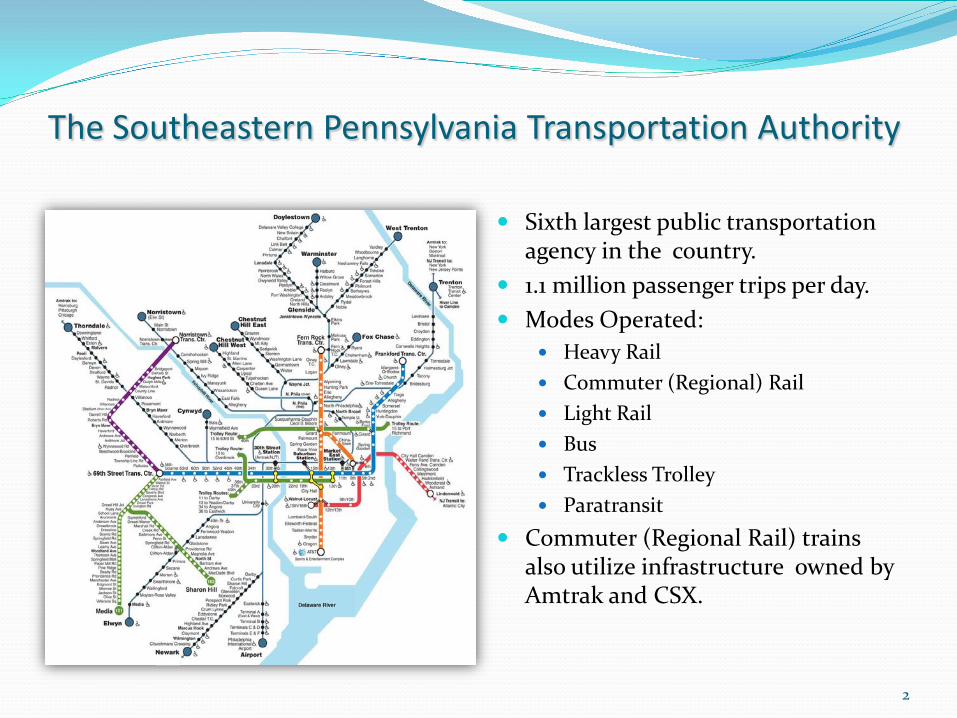
Sixth largest public transportation agency in the country.
1.1 million passenger trips per day. Modes Operated:
Heavy Rail Commuter (Regional) Rail Light Rail Bus Trackless Trolley Paratransit
Commuter (Regional Rail) trains also utilize infrastructure owned by Amtrak and CSX.
2
The Southeastern Pennsylvania Transportation Authority
Operating Territory Infrastructure (All Modes)
3
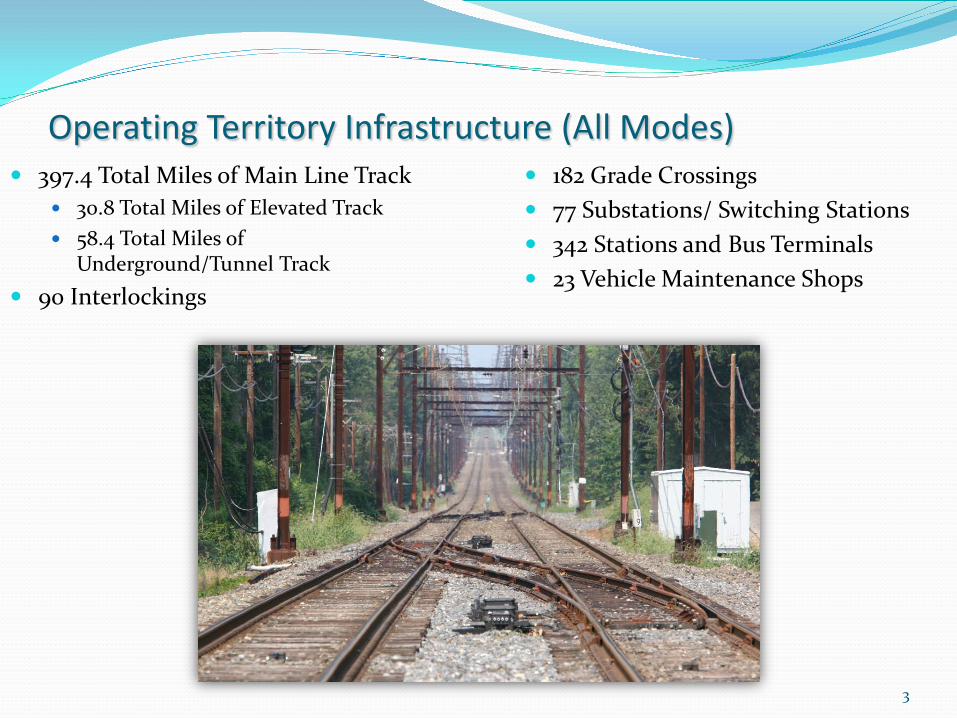
397.4 Total Miles of Main Line Track 30.8 Total Miles of Elevated Track 58.4 Total Miles of
Underground/Tunnel Track 90 Interlockings
182 Grade Crossings 77 Substations/ Switching Stations 342 Stations and Bus Terminals 23 Vehicle Maintenance Shops
4
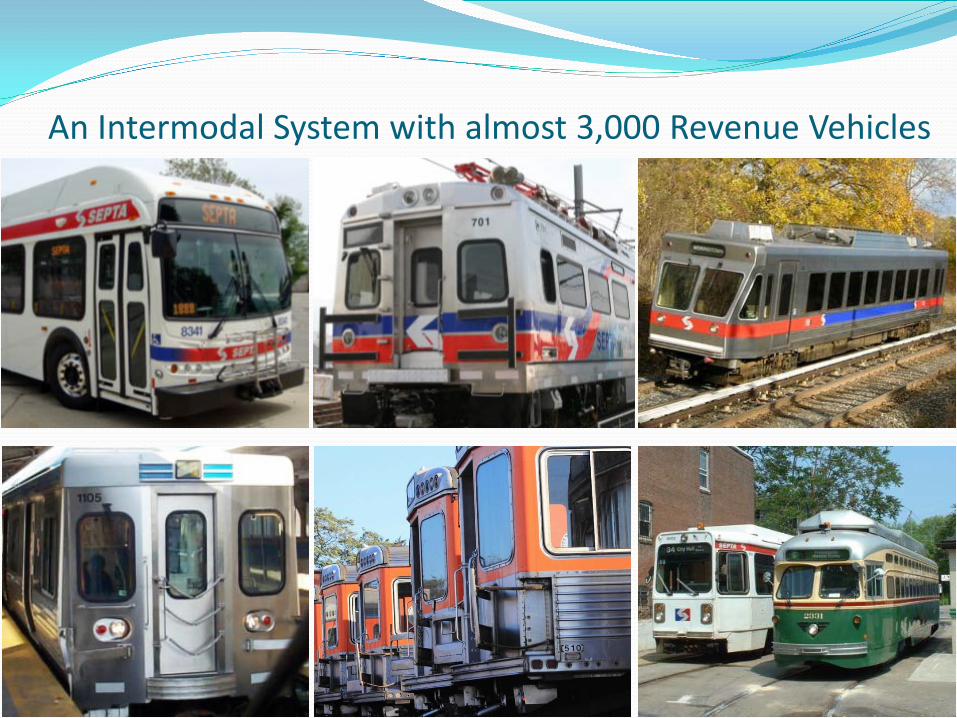
An Intermodal System with almost 3,000 Revenue Vehicles
Infrastructure Origins
5
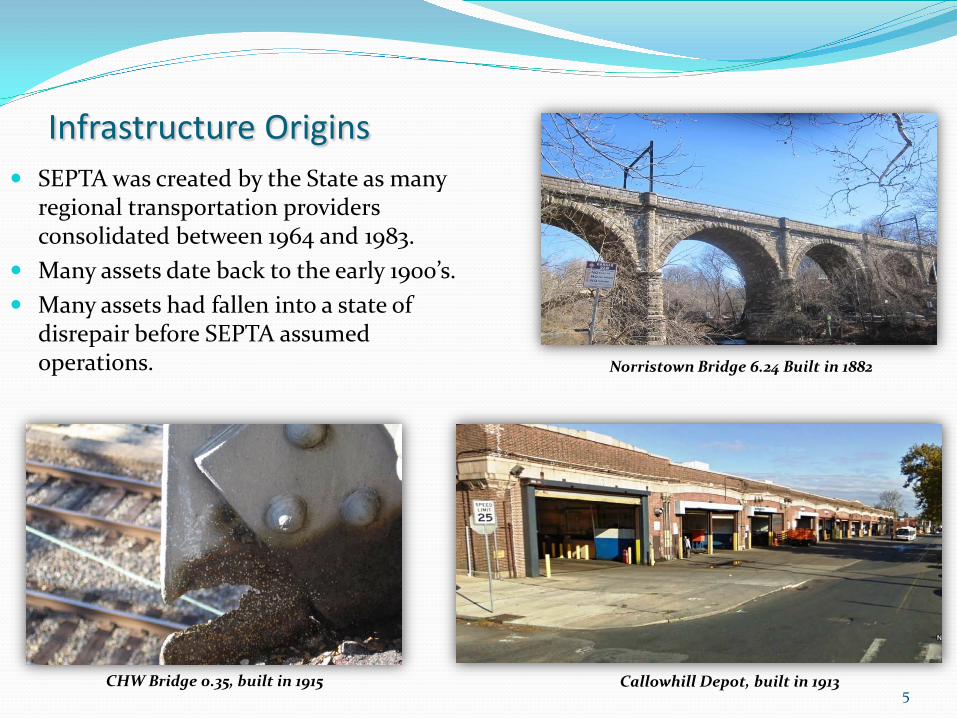
SEPTA was created by the State as many regional transportation providers consolidated between 1964 and 1983.
Many assets date back to the early 1900’s. Many assets had fallen into a state of
disrepair before SEPTA assumed operations.
Callowhill Depot, built in 1913 CHW Bridge 0.35, built in 1915
Norristown Bridge 6.24 Built in 1882
Working towards SGR is a Core Business Goal.
6
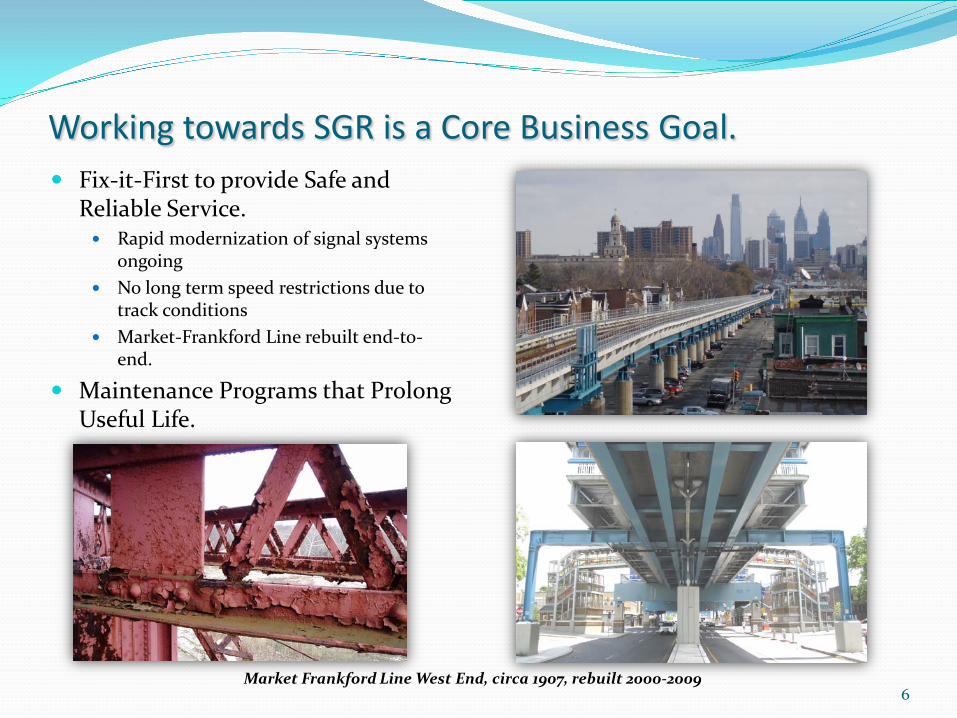
Fix-it-First to provide Safe and Reliable Service. Rapid modernization of signal systems
ongoing No long term speed restrictions due to
track conditions Market-Frankford Line rebuilt end-to-
end.
Maintenance Programs that Prolong Useful Life.
Market Frankford Line West End, circa 1907, rebuilt 2000-2009
Maintaining a Legacy System while Stretching Capital Dollars
7
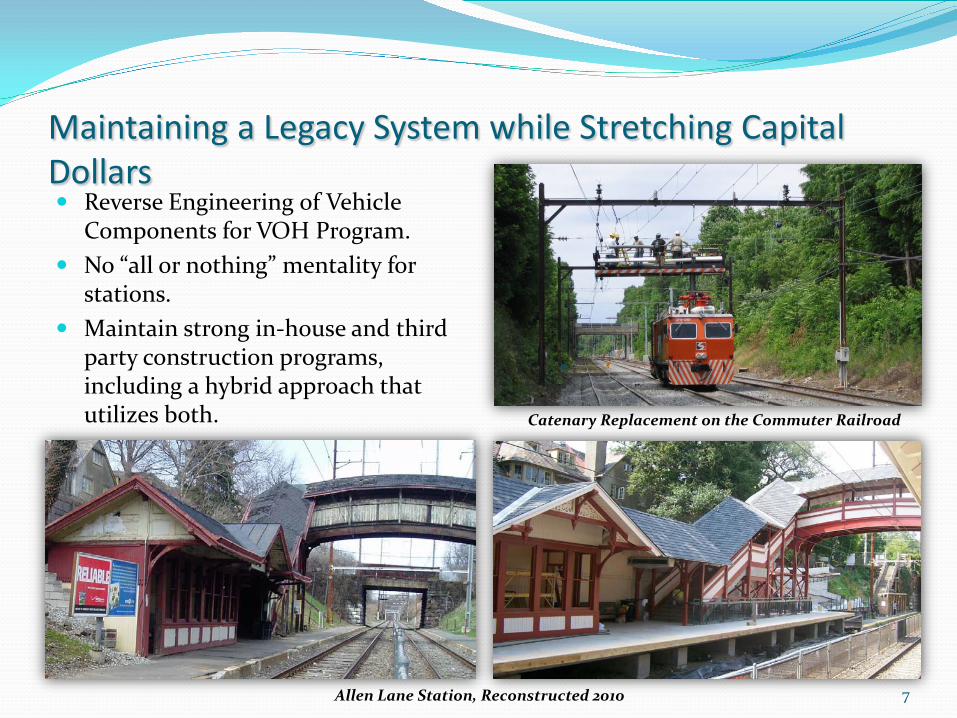
Reverse Engineering of Vehicle Components for VOH Program.
No “all or nothing” mentality for stations.
Maintain strong in-house and third party construction programs, including a hybrid approach that utilizes both.
Allen Lane Station, Reconstructed 2010
Catenary Replacement on the Commuter Railroad
8
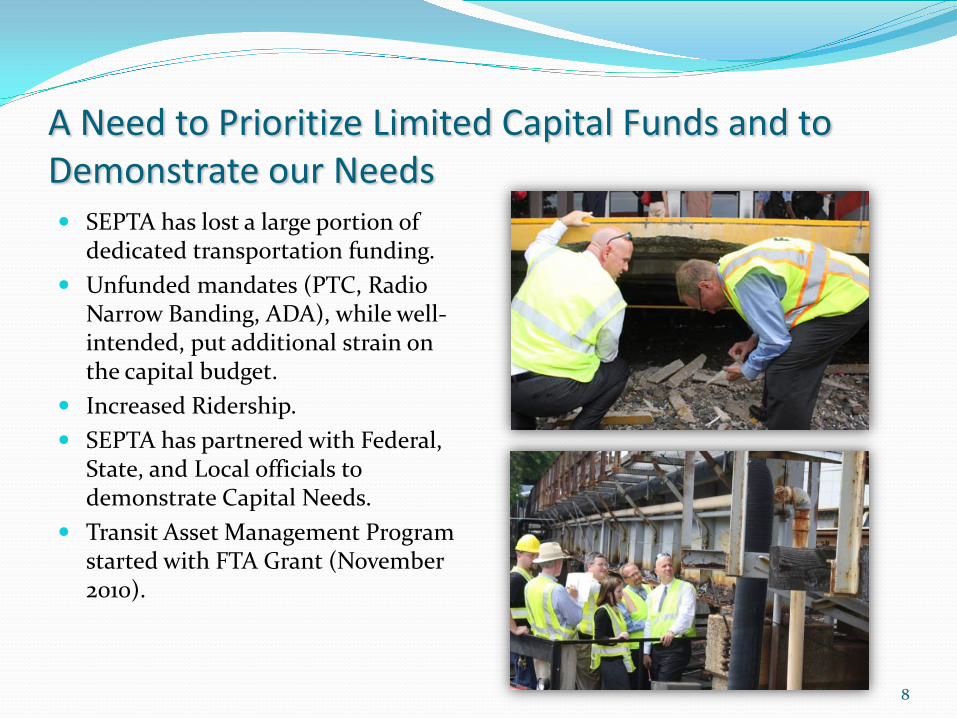
A Need to Prioritize Limited Capital Funds and to Demonstrate our Needs SEPTA has lost a large portion of
dedicated transportation funding. Unfunded mandates (PTC, Radio
Narrow Banding, ADA), while well-intended, put additional strain on the capital budget.
Increased Ridership. SEPTA has partnered with Federal,
State, and Local officials to demonstrate Capital Needs.
Transit Asset Management Program started with FTA Grant (November 2010).
9
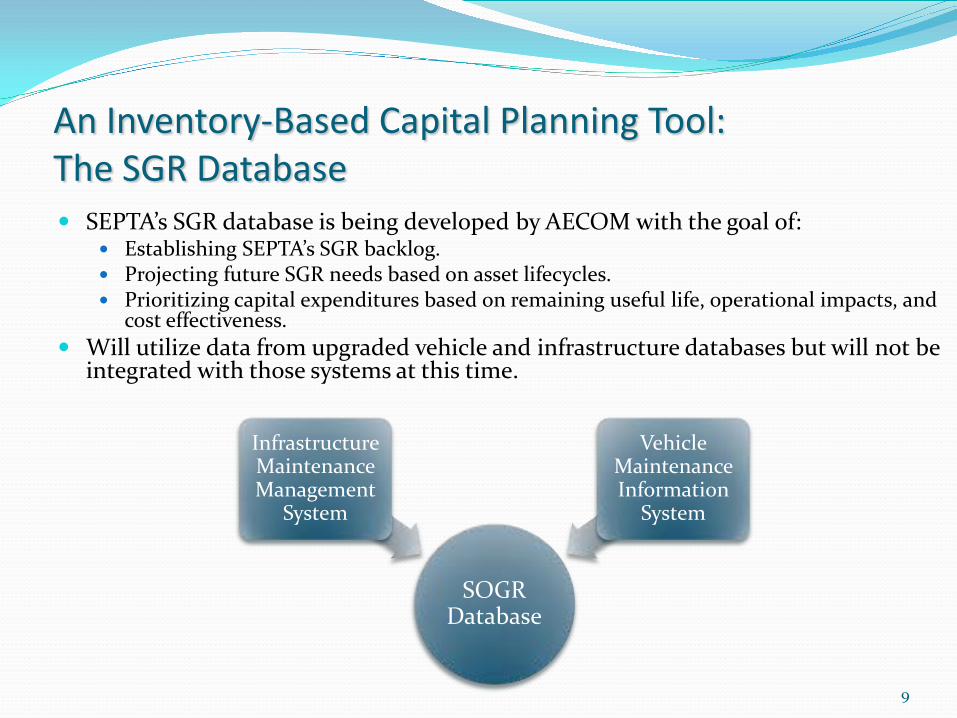
An Inventory-Based Capital Planning Tool: The SGR Database SEPTA’s SGR database is being developed by AECOM with the goal of:
Establishing SEPTA’s SGR backlog. Projecting future SGR needs based on asset lifecycles. Prioritizing capital expenditures based on remaining useful life, operational impacts, and
cost effectiveness. Will utilize data from upgraded vehicle and infrastructure databases but will not be
integrated with those systems at this time.
SOGR Database
Infrastructure Maintenance Management
System
Vehicle Maintenance Information
System
10
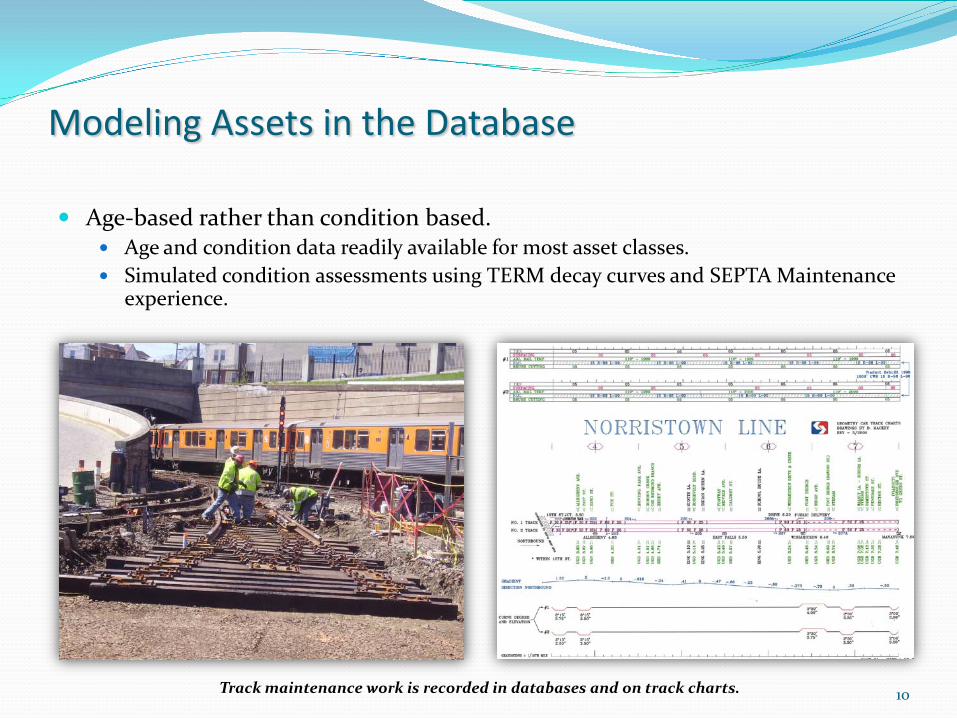
Modeling Assets in the Database Age-based rather than condition based.
Age and condition data readily available for most asset classes. Simulated condition assessments using TERM decay curves and SEPTA Maintenance
experience.
Track maintenance work is recorded in databases and on track charts.
11
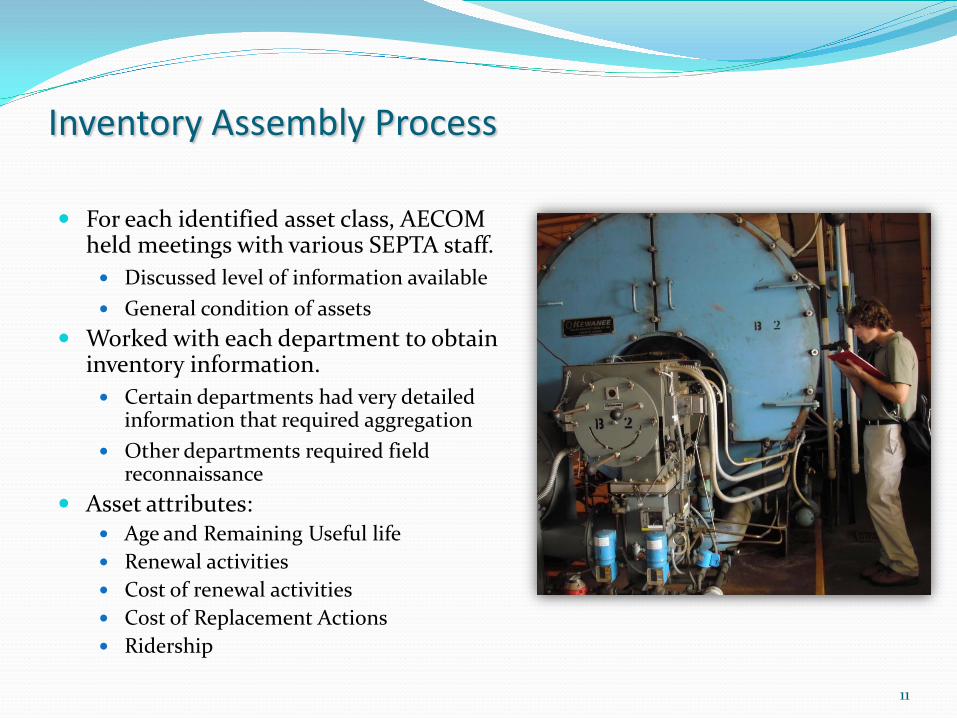
Inventory Assembly Process For each identified asset class, AECOM
held meetings with various SEPTA staff. Discussed level of information available General condition of assets
Worked with each department to obtain inventory information. Certain departments had very detailed
information that required aggregation Other departments required field
reconnaissance Asset attributes:
Age and Remaining Useful life Renewal activities Cost of renewal activities Cost of Replacement Actions Ridership

12
TRACK
COMMUTER (RRD)
TRANSIT (BSS, MFSE, SS, NHSL, MSHL)
EMBEDDED TRACK (STREET)
RAIL
TIES & SURFACING
INTERLOCKINGS
AT-GRADE HIGHWAY X-INGS
SHOPS AND YARDS
RAIL
TIES & SURFACING
DFF
RAIL
INTERSECTIONS (SPECIAL TRACKWORK)
LOOPS
SHOPS AND YARDS INTERLOCKINGS
3RD RAIL
SHOPS AND YARDS
Renewal Activities
Using Maintenance Data to Generate the Inventory
AT-GRADE HIGHWAY X-INGS
13
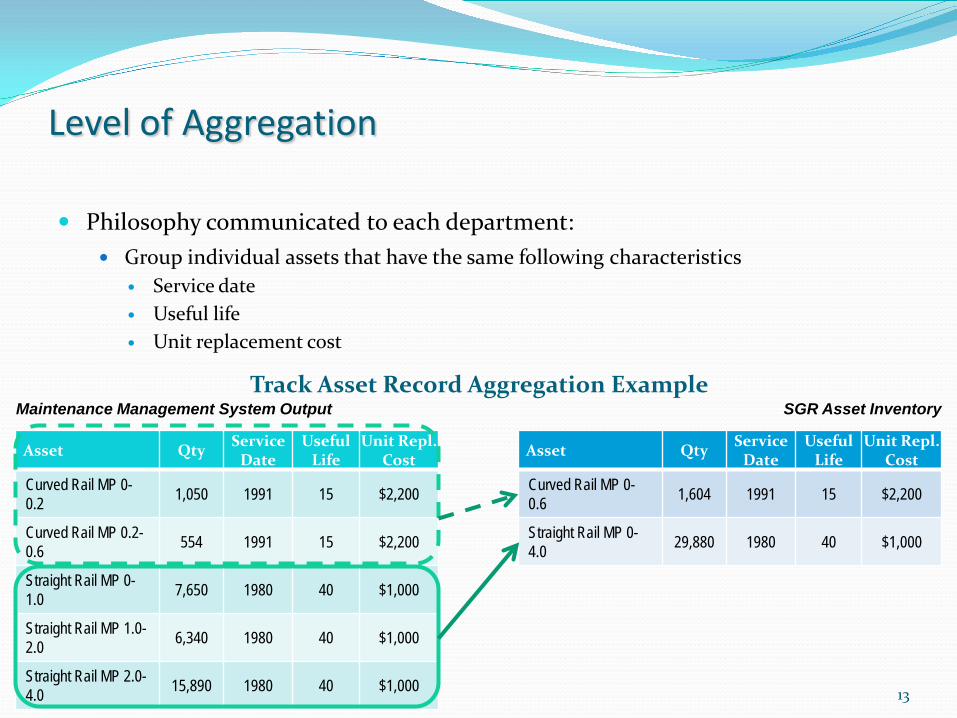
Level of Aggregation Philosophy communicated to each department:
Group individual assets that have the same following characteristics Service date Useful life Unit replacement cost
Asset Qty Service Date
Useful Life
Unit Repl. Cost
Curved Rail MP 0-0.2 1,050 1991 15 $2,200
Curved Rail MP 0.2-0.6 554 1991 15 $2,200
Straight Rail MP 0-1.0 7,650 1980 40 $1,000
Straight Rail MP 1.0-2.0 6,340 1980 40 $1,000
Straight Rail MP 2.0-4.0 15,890 1980 40 $1,000
Asset Qty Service Date
Useful Life
Unit Repl. Cost
Curved Rail MP 0-0.6 1,604 1991 15 $2,200
Straight Rail MP 0-4.0 29,880 1980 40 $1,000
Track Asset Record Aggregation Example Maintenance Management System Output SGR Asset Inventory
14
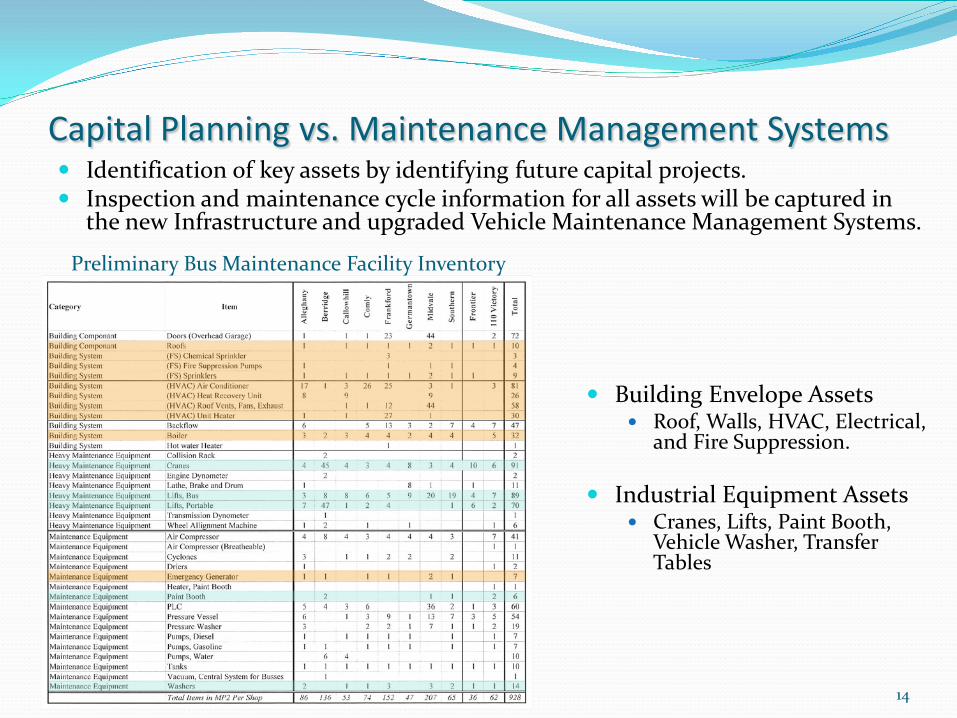
Capital Planning vs. Maintenance Management Systems Identification of key assets by identifying future capital projects. Inspection and maintenance cycle information for all assets will be captured in
the new Infrastructure and upgraded Vehicle Maintenance Management Systems.
Building Envelope Assets Roof, Walls, HVAC, Electrical,
and Fire Suppression.
Industrial Equipment Assets Cranes, Lifts, Paint Booth,
Vehicle Washer, Transfer Tables
Preliminary Bus Maintenance Facility Inventory
15
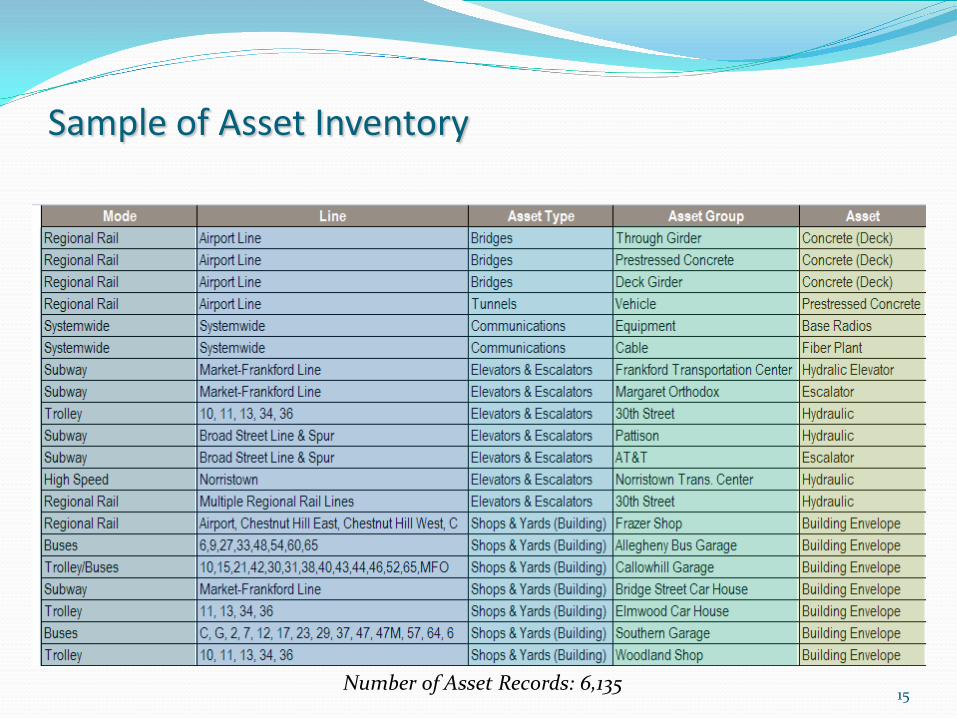
Sample of Asset Inventory
Number of Asset Records: 6,135
16
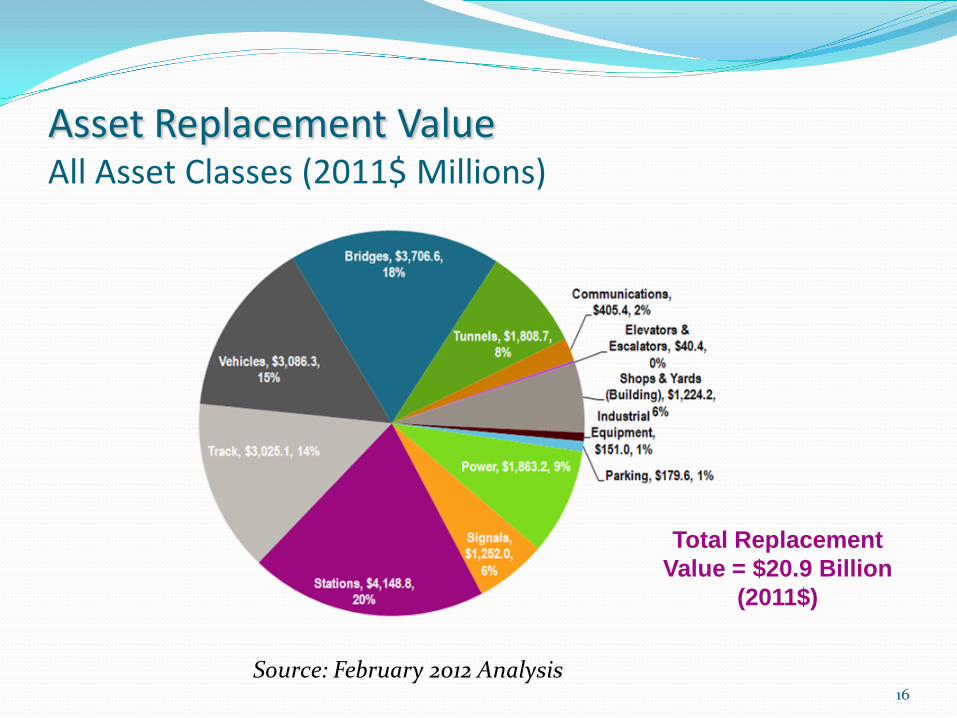
Asset Replacement Value All Asset Classes (2011$ Millions)
Total Replacement Value = $20.9 Billion
(2011$)
Source: February 2012 Analysis
17
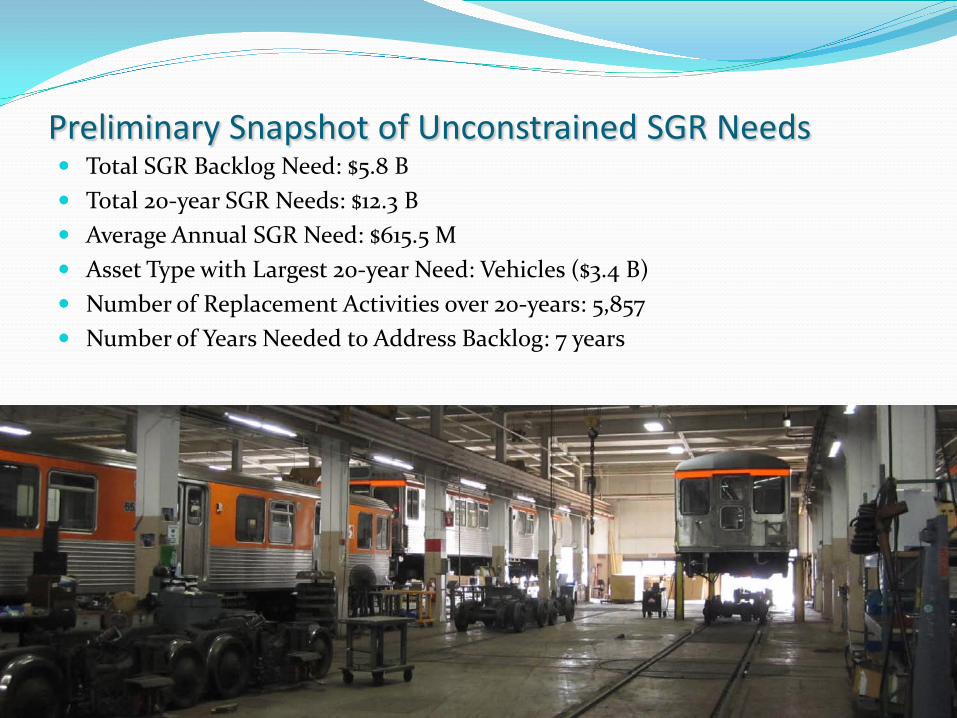
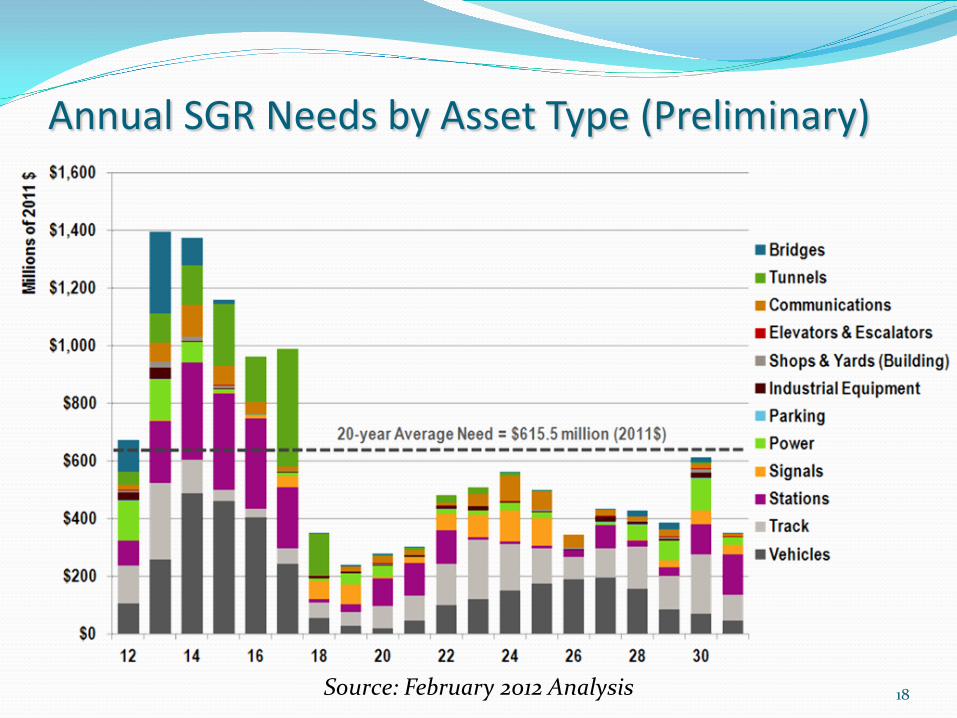
Preliminary Snapshot of Unconstrained SGR Needs Total SGR Backlog Need: $5.8 B Total 20-year SGR Needs: $12.3 B Average Annual SGR Need: $615.5 M Asset Type with Largest 20-year Need: Vehicles ($3.4 B) Number of Replacement Activities over 20-years: 5,857 Number of Years Needed to Address Backlog: 7 years
18
Annual SGR Needs by Asset Type (Preliminary)
Source: February 2012 Analysis
19
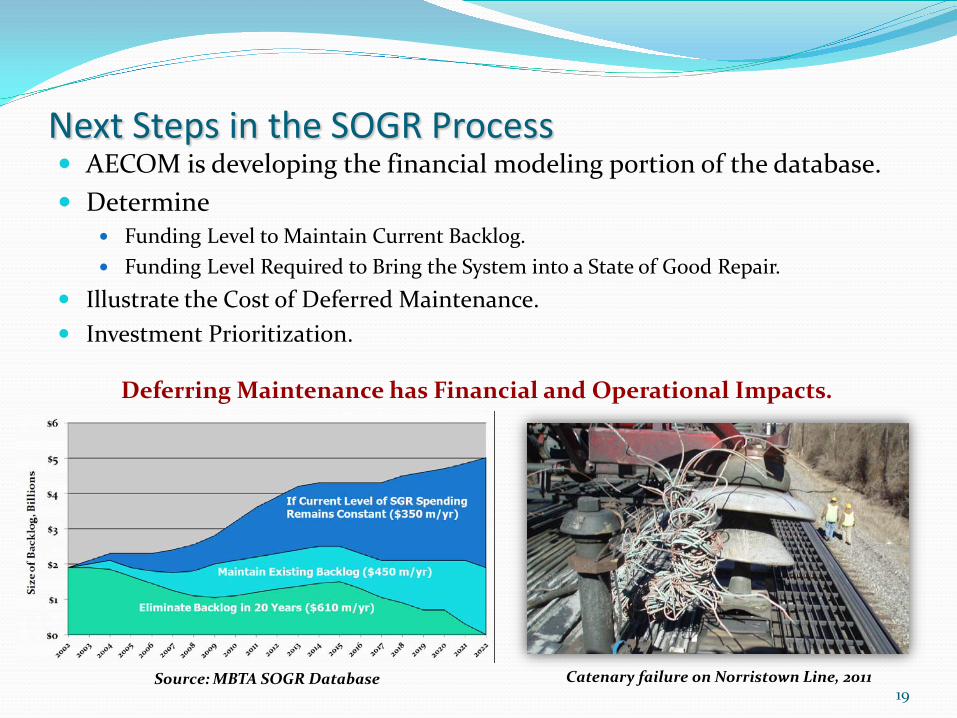
Next Steps in the SOGR Process AECOM is developing the financial modeling portion of the database. Determine
Funding Level to Maintain Current Backlog. Funding Level Required to Bring the System into a State of Good Repair.
Illustrate the Cost of Deferred Maintenance. Investment Prioritization.
Source: MBTA SOGR Database Catenary failure on Norristown Line, 2011
Deferring Maintenance has Financial and Operational Impacts.
20
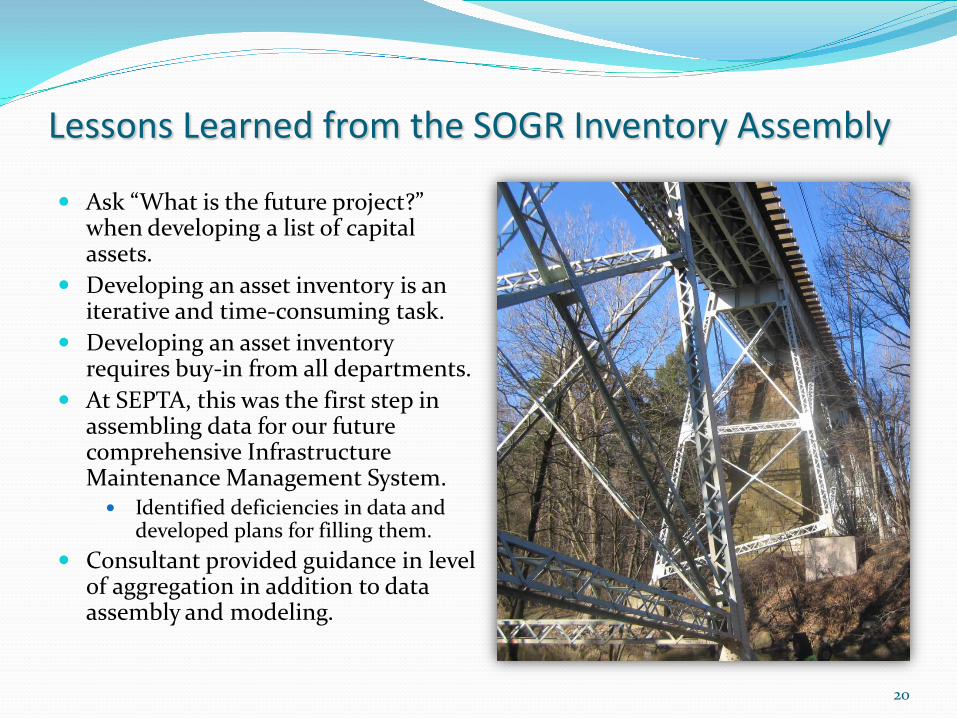
Lessons Learned from the SOGR Inventory Assembly
Ask “What is the future project?” when developing a list of capital assets.
Developing an asset inventory is an iterative and time-consuming task.
Developing an asset inventory requires buy-in from all departments.
At SEPTA, this was the first step in assembling data for our future comprehensive Infrastructure Maintenance Management System. Identified deficiencies in data and
developed plans for filling them. Consultant provided guidance in level
of aggregation in addition to data assembly and modeling.
21
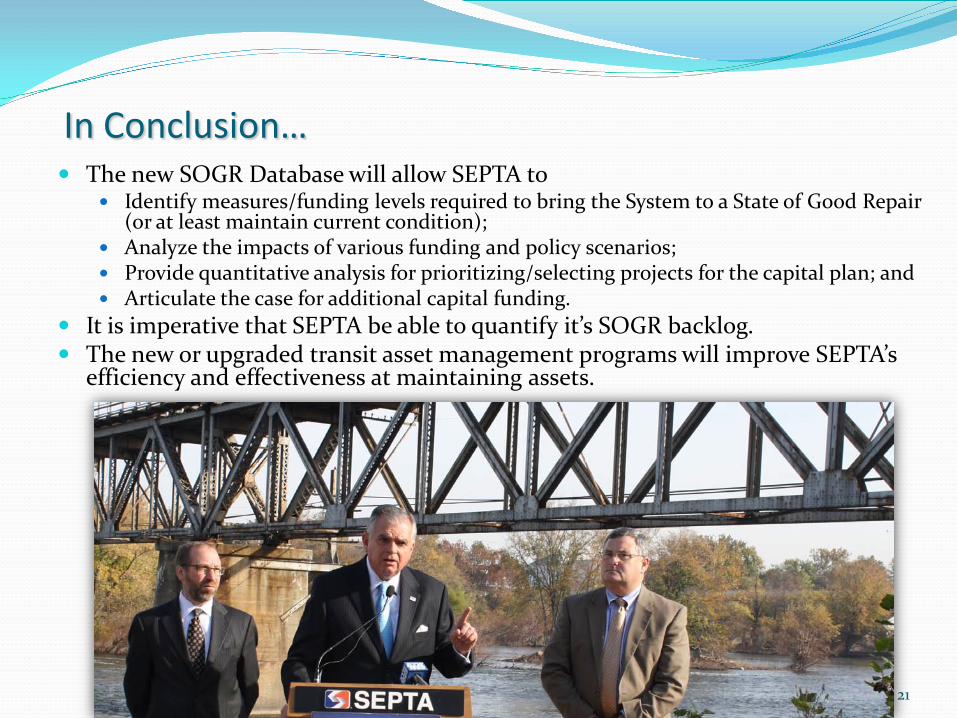
In Conclusion… The new SOGR Database will allow SEPTA to
Identify measures/funding levels required to bring the System to a State of Good Repair (or at least maintain current condition);
Analyze the impacts of various funding and policy scenarios; Provide quantitative analysis for prioritizing/selecting projects for the capital plan; and Articulate the case for additional capital funding.
It is imperative that SEPTA be able to quantify it’s SOGR backlog. The new or upgraded transit asset management programs will improve SEPTA’s
efficiency and effectiveness at maintaining assets.
22
… in Philadelphia!
We are looking forward to giving an update at the FTA State of Good Repair Roundtable…
Jeffrey Knueppel
Laura Zale
Robert Peskin Aaron Kozuki Adrian Merceron