southern africa economic outlook 2018 - afdb.org · southern africa economic outlook 2018...
TRANSCRIPT
SouthernAfricaEconomicOutlook2018Macroeconomic developments and poverty, inequality, and employment
Competing in food value chains

SouthernAfricaEconomicOutlook2018

The opinions expressed and arguments employed herein do not necessarily reflect the official views of the African Development Bank, its Boards of Directors, or the countries they represent. This document, as well as any data and maps included, are without prejudice to the status of or sovereignty over any territory, to the delimitation of international frontiers and boundaries, and to the name of any territory, city, or area.
Cover design by the African Development Bank based on images from Shutterstock.com
© African Development Bank 2018
ISBN 978-9938-882-70-4 (print) ISBN 978-9938-882-71-1 (electronic)
You may copy, download, or print this material for your own use, and you may include excerpts from this publication in your own documents, presentations, blogs, websites, and teaching materials, as long as the African Development Bank is suitably acknowledged as the source and copyright owner.
Abbreviations v
Executive summary 1
Part I The Southern African economy 3Economic performance and outlook 3Macroeconomic conditions 8Poverty, inequality, and employment 14Policy challenges 15
Part II Regional development and competition in food value chains 23Overview 23Fertilizer 24Poultry and animal feed 25The spread of supermarkets 27Policy agenda 28
Notes 30
References 30
Box1 High dependency on volatile and declining SACU revenues 13
Figures1 Average annual real GDP growth 42 Regional average real GDP growth 43 Real GDP growth of regional economies 54 Movements in SACU and RMA inflation rates 105 Selected commodity prices, 1996–2016 116 Exchange rate depreciations 117 Fiscal balances in Southern Africa 128 Current account balances, 2016–19 129 Evolution of poverty rates by income groups in the Southern African region 1510 Share of income by income quintile, selected countries 16
CONTENTS
iii
iv C O N T E N T S
11 Evolution of inequality and GDP per capita 1712 Decomposition of labor productivity growth 1813 SADC trade balances in processed food 2414 Urea prices 2515 Poultry value chain 2616 Soya costs and delivered prices in Gauteng Province, South Africa 2717 Footprint of Shoprite and Pick n Pay, by country, 2016 28
Tables1 Sectoral growth in Southern Africa, 2000–16 62 Sectoral GDP shares in Southern Africa, 2000–16 73 GDP composition by expenditure in Southern Africa, 2000–15 74 Demand component growth rates in Southern Africa, 2010–15 85 Consumer price inflation in Southern Africa, 2015–19 9

ADI African Development IndicatorsAEO African Economic OutlookAfDB African Development BankAGOA African Growth and Opportunity ActAMITSA Regional Agricultural Input Market Information and Transparency System for
East and Southern AfricaBLNS Botswana, Lesotho, Namibia, and SwazilandCOMESA Common Market for Eastern and Southern AfricaGDP Gross domestic productHIPC Heavily Indebted Poor Country InitiativeOECD Organisation for Economic Co-operation and DevelopmentPE Public enterprisePPP Public–private partnershipRMA Rand Monetary AreaSACU Southern African Customs UnionSADC Southern African Development CommunitySAEO Southern Africa Economic OutlookSME Small and medium-size enterprisesSQAM Standard Quality Accreditation MethodologyUNECA United Nations Economic Commission for AfricaWDI World Development Indicators
ABBREVIATIONS
v

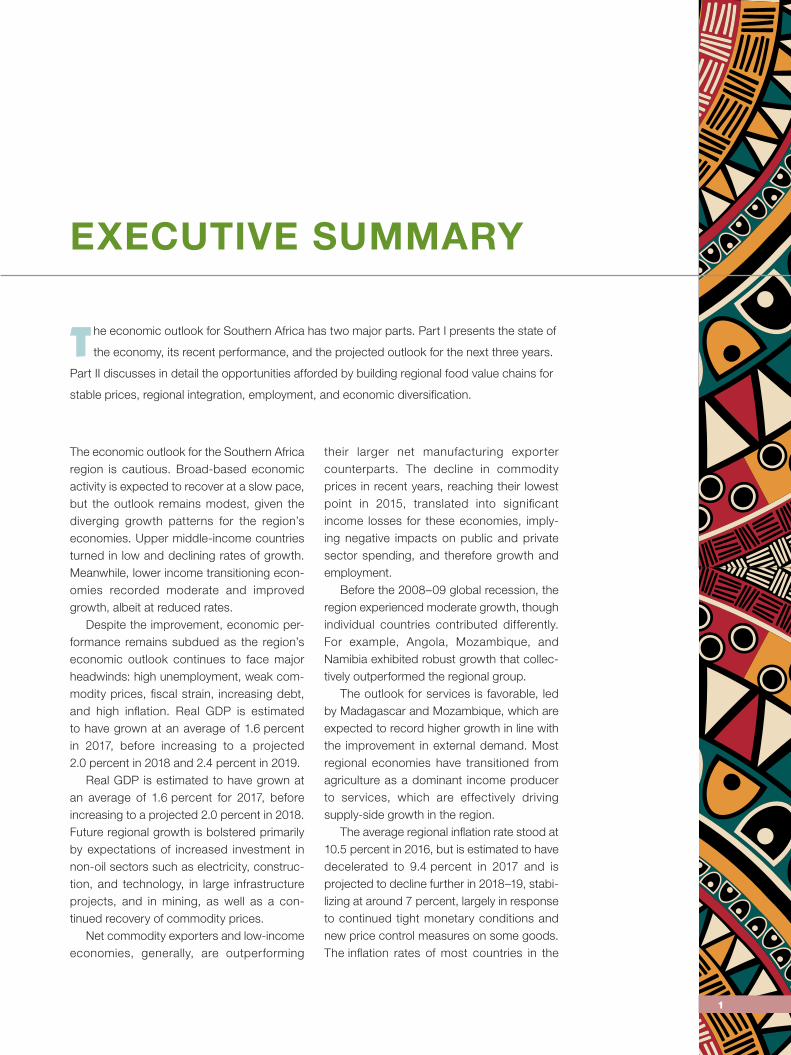
The economic outlook for the Southern Africa region is cautious. Broad- based economic activity is expected to recover at a slow pace, but the outlook remains modest, given the diverging growth patterns for the region’s economies. Upper middle- income countries turned in low and declining rates of growth. Meanwhile, lower income transitioning econ-omies recorded moderate and improved growth, albeit at reduced rates.
Despite the improvement, economic per-formance remains subdued as the region’s economic outlook continues to face major headwinds: high unemployment, weak com-modity prices, fiscal strain, increasing debt, and high inflation. Real GDP is estimated to have grown at an average of 1.6 percent in 2017, before increasing to a projected 2.0 percent in 2018 and 2.4 percent in 2019.
Real GDP is estimated to have grown at an average of 1.6 percent for 2017, before increasing to a projected 2.0 percent in 2018. Future regional growth is bolstered primarily by expectations of increased investment in non- oil sectors such as electricity, construc-tion, and technology, in large infrastructure projects, and in mining, as well as a con-tinued recovery of commodity prices.
Net commodity exporters and low- income economies, generally, are outperforming
their larger net manufacturing exporter counterparts. The decline in commodity prices in recent years, reaching their lowest point in 2015, translated into significant income losses for these economies, imply-ing negative impacts on public and private sector spending, and therefore growth and employment.
Before the 2008–09 global recession, the region experienced moderate growth, though individual countries contributed differently. For example, Angola, Mozambique, and Namibia exhibited robust growth that collec-tively outperformed the regional group.
The outlook for services is favorable, led by Madagascar and Mozambique, which are expected to record higher growth in line with the improvement in external demand. Most regional economies have transitioned from agriculture as a dominant income producer to services, which are effectively driving supply- side growth in the region.
The average regional inflation rate stood at 10.5 percent in 2016, but is estimated to have decelerated to 9.4 percent in 2017 and is projected to decline further in 2018–19, stabi-lizing at around 7 percent, largely in response to continued tight monetary conditions and new price control measures on some goods. The inflation rates of most countries in the
T he economic outlook for Southern Africa has two major parts. Part I presents the state of
the economy, its recent performance, and the projected outlook for the next three years.
Part II discusses in detail the opportunities afforded by building regional food value chains for
stable prices, regional integration, employment, and economic diversification.
EXECUTIVE SUMMARY
1

2 E x E C U T I v E S U M M A R Y
region are expected to gravitate toward a range of around 4–8 percent in the medium term.
Employment remains low, with a large number of people currently engaged in informal employ-ment such as subsistence farming rather than formal employment. The introduction of effi-cient technologies can increase the demand for
employment in productive sectors such as oil, gas, mining, and agriculture, thus increasing the skill requirements of the labor force. In response, governments should increase efforts to develop the skills of the labor force, thereby improving their prospects in the labor markets across the region and beyond.

PART ITHE SOUTHERN AFRICAN ECONOMY
ECONOMIC PERFORMANCE AND OUTLOOK
OverviewGrowth in real GDP is estimated to have recovered to an annual average of 1.6 percent for 2017, after 2016’s lackluster 0.9 percent. The recovery is largely due to better weather conditions, which lifted agricultural output and hydroelectric power. The pickup in commod-ity prices since 2015 added further impetus. But the full effect of these favorable condi-tions was limited by South Africa, the region’s largest economy, which posted a meager 0.9 percent. Only Namibia, at 0.8 percent, grew slower than South Africa. Other coun-tries posted growth of between 1 percent (Swaziland) and 4.6 percent (Lesotho).
Growth in the region is forecast to improve in the medium term, rising to an average 2.0 percent in 2018 and to 2.4 percent in 2019 (figure 1). The slight improvement in the medium- term economic outlook is premised on expectations of increased investment flows to non- oil sectors such as electricity, construction, and technology, to large infra-structure projects, and to mining and further strengthening of commodity prices.
Despite the improvement, economic performance remains subdued — below the regional 7 percent annual growth target for all member states. The region’s economic out-look continues to face major headwinds: high unemployment, fiscal slippages, and rising debt in some countries, as well as policy uncertainty.
Individual economies have little fiscal policy space in the current low growth environment, with the exceptions of Botswana, Lesotho, and Namibia, which recorded positive fiscal balances. Lower oil prices have helped con-sumption in the region, although Angola, the region’s foremost oil producer and exporter, continues to experience the adverse growth effects of weak oil prices. To contain the con-straining budget effects of low oil prices, the Angolan authorities instituted fiscal consolida-tion measures, with the major burden falling largely on public investment expenditure. To the extent that the cutback in public invest-ment expenditure is for growth- enhancing sectors, this could impede long- term growth for the country and the region. Angola is the second largest economy in Southern Africa.
Global demand is slowly recovering, thanks to the United States, China, and the
T he Southern Africa economic outlook reviews macroeconomic conditions in 12
countries.1 It highlights growth trends and provides projections for 2018 and 2019 by
examining the main drivers of growth based on prevailing global, regional, and domestic
conditions and shocks. It also examines financial and structural policies and how they shape
current and future growth in the region. And it discusses the region’s performance in relation
to inequality, employment, structural change, and poverty reduction.
3

4 T H E S O U T H E R N A F R I C A N E C O N O M Y
Geopolitical factors could have
implications for the direction of
future public policy, and the region’s
medium-term investment and
growth prospects more broadly
European Union, the main export markets for Southern Africa. The region has experienced change in top political leadership over the past few months in Angola and Zimbabwe, and South Africa and Botswana will follow in the next year.
These geopolitical factors could have implica-tions for the direction of future public policy, and the region’s medium- term investment and growth prospects more broadly.
GDP growth and key driversOver the last two decades, the economies of Southern Africa experienced two distinct growth patterns. Before the 2008–09 global recession, they experienced moderate growth, reaching 6.5 percent in 2007, just below the regional growth target of 7 percent (figure 2). These were the region’s high- growth years, underpinned by high commodity prices and favorable domestic condi-tions, especially in low- income economies, some graduating to lower middle- income (Zambia).
The sharp decline in growth in 2008 and the mild recession the following year were mainly due to the global recession, which had a large con-tractionary effect on global demand, especially for the region’s main exports. This constrained incomes and cut jobs in mining. The spillovers to other sectors were considerable, as growth fal-tered, reaching a nadir of 0.08 percent in 2009. Although growth has since recovered, it has remained below the pre-crisis levels and for the most part been on a downward trend. This slow-down has reinforced structural weaknesses in the
FIGURE 1 Average annual real GDP growth
Annual GDP growth (percent)
0
1
2
3
2019(projected)
2018(projected)
2017(estimated)
2016
Source: AfDB statistics.
FIGURE 2 Regional average real GDP growth
–2
0
2
4
6
8
201720162015201420132012201120102009200820072006200520042003200220012000
Annual GDP growth (percent)
Source: AfDB statistics.

T H E S O U T H E R N A F R I C A N E C O N O M Y 5
The post-crisis recovery in the region generally reveals great diversity
region, highlighting the imperative of strengthening alternative sources of growth.
Individual countries contributed differently to the overall trend — some are consistent as growth leaders while others trade places. Before the global crisis, Angola, Mozambique, and Namibia exhibited robust growth trends that collectively outperformed the region’s growth expectations (figure 3). The postcrisis recovery has been largely led by smaller economies, posting moderate but consistent growth. Clustering reveals weak- growth economies, average- to- moderate growth economies, and expansive- growth economies.
The notable exception is the persistently weak growth in South Africa, weighing down the regional average. Apart from its short- lived post- crisis rebound, South Africa has registered weak and declining growth since 2011. In the last decade, South Africa has consistently posted the lowest growth rates in the region.
While real GDP gains from select economies offer a positive outlook, they are inadequate and do not create sufficient momentum to significantly alter the region’s medium- term growth trajectory, which remains fairly flat. With population growth largely unchanged across the region, per capita income has tracked real GDP growth’s low levels.
The neighborhood effects of South Africa’s slow growth have been significant, particularly on Namibia and Swaziland, the latter’s situa-tion compounded by domestic macroeconomic imbalances characterized by large fiscal deficits. In contrast, Lesotho has grown at respectable rates, benefiting from strong manufacturing activ-ity, boosted by AGOA exports.
The post- crisis recovery in the region gen-erally reveals great diversity in growth patterns, responses to exogenous shocks, and domestic macroeconomic conditions. For instance, despite mounting debt, growth in Mozambique acceler-ated to 4.7 percent in 2017 from 3.8 percent in 2016, buoyed by mineral exports. Agriculture also performed strongly, bringing much needed relief to inflation, dominated by food inflation. But its fiscal deficit remains elevated, and fears of debt distress could unwind growth’s gains. Per capita income growth remained in positive territory at 2 percent in 2017 and is projected to rise to 2.6 percent in 2018, as GDP growth accelerates to 5.3 percent. The main challenges in Mozam-bique stem largely from financing constraints amid spending pressures and high external debt burdens, estimated at about 90 percent of GDP in 2016.
FIGURE 3 Real GDP growth of regional economies
Regionalaverage
ZimbabweZambiaSouthAfrica
SwazilandNamibiaMozambiqueMauritiusMalawiMadagascarLesothoBotswanaAngola
Percent 2016201420092004 2017
–10
0
10
20
30
Source: AfDB statistics.
6 T H E S O U T H E R N A F R I C A N E C O N O M Y
Services were a key driver of real GDP growth in recent
years, as agriculture performed below
expectations
Real GDP growth in Namibia is projected to more than double to 2.6 percent in 2018 from 0.8 percent in 2017 and in Swaziland from 1.0 per-cent to 2.5 percent. Namibia will benefit from recovery in the global prices of its main export commodities.
The change in leadership in Zimbabwe has renewed optimism about the country’s ability to reclaim its position in the region. The budget presented to parliament offered glimmers of hope to investors on prospects of new reforms, especially on minimal investment thresholds for external investors. But the economy is still expe-riencing financial constraints, and debt remains high, with accumulated arrears. So, real GDP growth is projected to remain weak at 1 percent in 2018, with a marginal gain of 0.2 percentage points the following year. This projection could be reversed however, depending on the outcome of the budget pronouncements and the country’s re- engagement with the international community, especially its creditors.
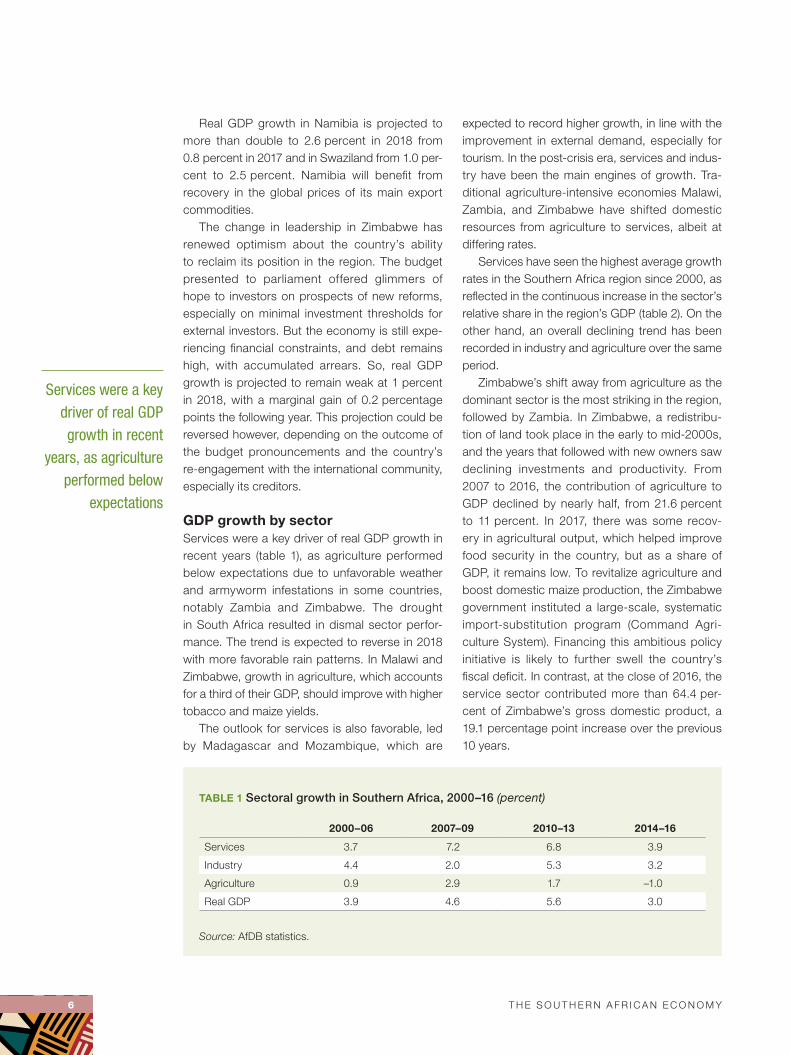
GDP growth by sectorServices were a key driver of real GDP growth in recent years (table 1), as agriculture performed below expectations due to unfavorable weather and armyworm infestations in some countries, notably Zambia and Zimbabwe. The drought in South Africa resulted in dismal sector perfor-mance. The trend is expected to reverse in 2018 with more favorable rain patterns. In Malawi and Zimbabwe, growth in agriculture, which accounts for a third of their GDP, should improve with higher tobacco and maize yields.
The outlook for services is also favorable, led by Madagascar and Mozambique, which are
expected to record higher growth, in line with the improvement in external demand, especially for tourism. In the post- crisis era, services and indus-try have been the main engines of growth. Tra-ditional agriculture- intensive economies Malawi, Zambia, and Zimbabwe have shifted domestic resources from agriculture to services, albeit at differing rates.
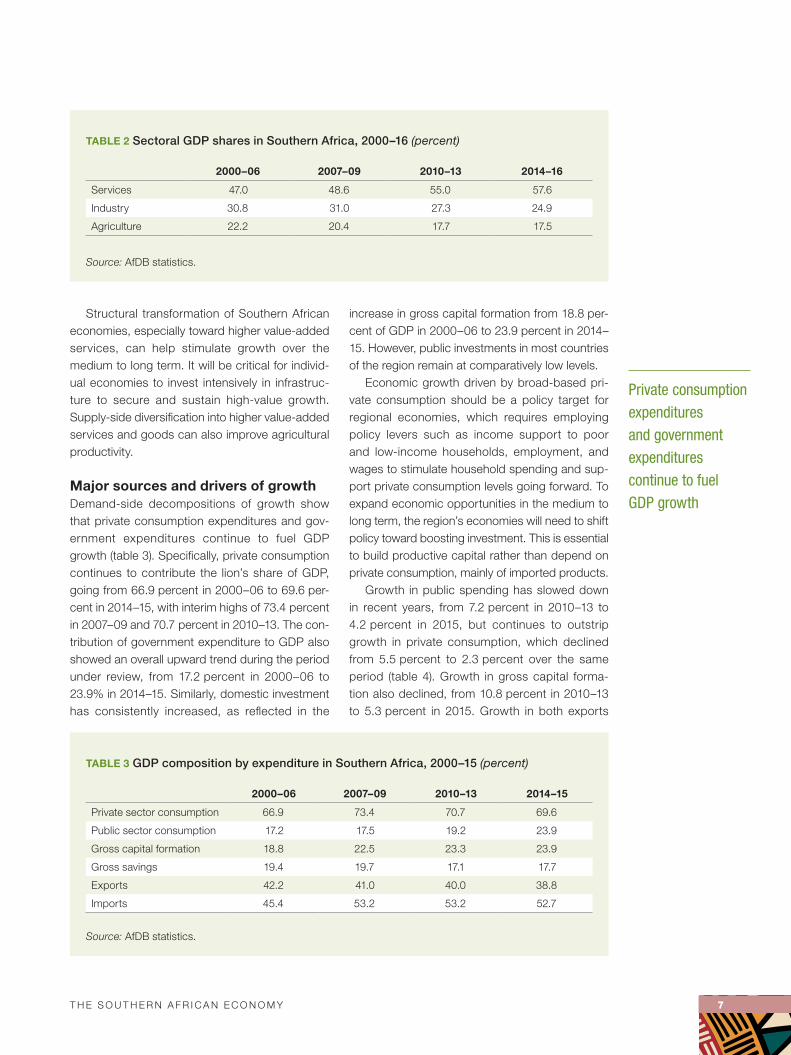
Services have seen the highest average growth rates in the Southern Africa region since 2000, as reflected in the continuous increase in the sector’s relative share in the region’s GDP (table 2). On the other hand, an overall declining trend has been recorded in industry and agriculture over the same period.
Zimbabwe’s shift away from agriculture as the dominant sector is the most striking in the region, followed by Zambia. In Zimbabwe, a redistribu-tion of land took place in the early to mid-2000s, and the years that followed with new owners saw declining investments and productivity. From 2007 to 2016, the contribution of agriculture to GDP declined by nearly half, from 21.6 percent to 11 percent. In 2017, there was some recov-ery in agricultural output, which helped improve food security in the country, but as a share of GDP, it remains low. To revitalize agriculture and boost domestic maize production, the Zimbabwe government instituted a large- scale, systematic import- substitution program (Command Agri-culture System). Financing this ambitious policy initiative is likely to further swell the country’s fiscal deficit. In contrast, at the close of 2016, the service sector contributed more than 64.4 per-cent of Zimbabwe’s gross domestic product, a 19.1 percentage point increase over the previous 10 years.
TABLE 1 Sectoral growth in Southern Africa, 2000–16 (percent)
2000–06 2007–09 2010–13 2014–16
Services 3.7 7.2 6.8 3.9
Industry 4.4 2.0 5.3 3.2
Agriculture 0.9 2.9 1.7 –1.0
Real GDP 3.9 4.6 5.6 3.0
Source: AfDB statistics.
T H E S O U T H E R N A F R I C A N E C O N O M Y 7
Private consumption expenditures and government expenditures continue to fuel GDP growth
Structural transformation of Southern African economies, especially toward higher value- added services, can help stimulate growth over the medium to long term. It will be critical for individ-ual economies to invest intensively in infrastruc-ture to secure and sustain high- value growth. Supply- side diversification into higher value- added services and goods can also improve agricultural productivity.
Major sources and drivers of growthDemand- side decompositions of growth show that private consumption expenditures and gov-ernment expenditures continue to fuel GDP growth (table 3). Specifically, private consumption continues to contribute the lion’s share of GDP, going from 66.9 percent in 2000–06 to 69.6 per-cent in 2014–15, with interim highs of 73.4 percent in 2007–09 and 70.7 percent in 2010–13. The con-tribution of government expenditure to GDP also showed an overall upward trend during the period under review, from 17.2 percent in 2000–06 to 23.9% in 2014–15. Similarly, domestic investment has consistently increased, as reflected in the
increase in gross capital formation from 18.8 per-cent of GDP in 2000–06 to 23.9 percent in 2014–15. However, public investments in most countries of the region remain at comparatively low levels.
Economic growth driven by broad- based pri-vate consumption should be a policy target for regional economies, which requires employing policy levers such as income support to poor and low- income households, employment, and wages to stimulate household spending and sup-port private consumption levels going forward. To expand economic opportunities in the medium to long term, the region’s economies will need to shift policy toward boosting investment. This is essential to build productive capital rather than depend on private consumption, mainly of imported products.
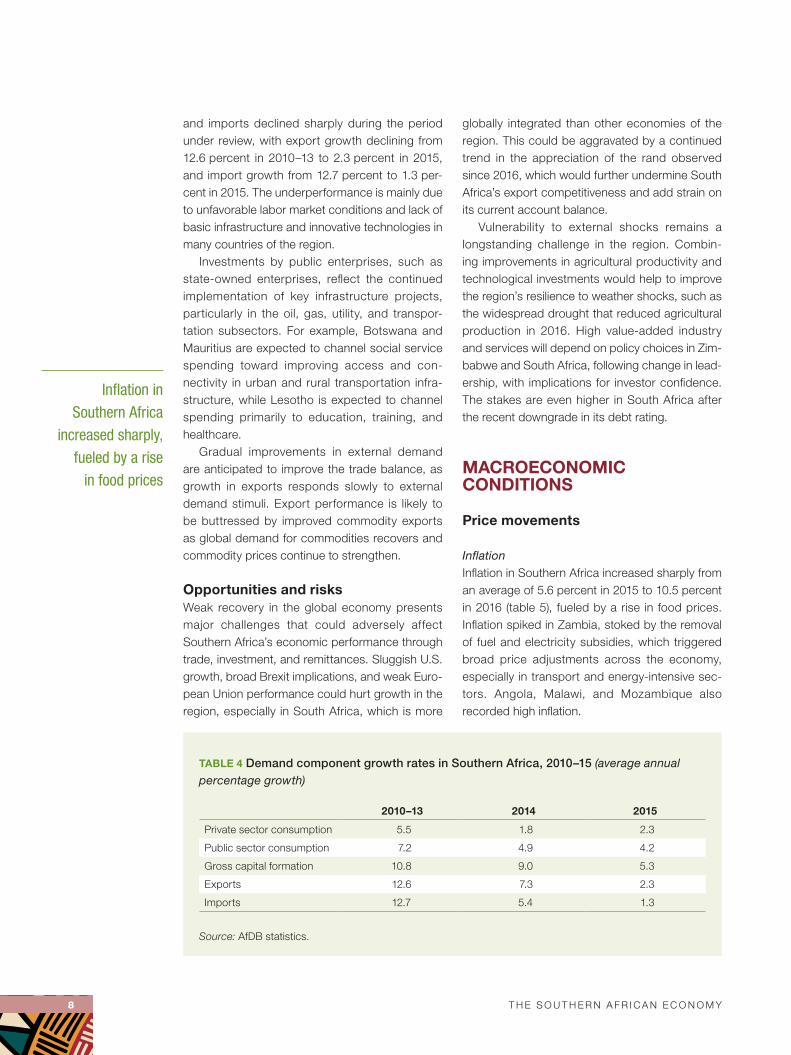
Growth in public spending has slowed down in recent years, from 7.2 percent in 2010–13 to 4.2 percent in 2015, but continues to outstrip growth in private consumption, which declined from 5.5 percent to 2.3 percent over the same period (table 4). Growth in gross capital forma-tion also declined, from 10.8 percent in 2010–13 to 5.3 percent in 2015. Growth in both exports
TABLE 3 GDP composition by expenditure in Southern Africa, 2000–15 (percent)
2000–06 2007–09 2010–13 2014–15
Private sector consumption 66.9 73.4 70.7 69.6
Public sector consumption 17.2 17.5 19.2 23.9
Gross capital formation 18.8 22.5 23.3 23.9
Gross savings 19.4 19.7 17.1 17.7
Exports 42.2 41.0 40.0 38.8
Imports 45.4 53.2 53.2 52.7
Source: AfDB statistics.
TABLE 2 Sectoral GDP shares in Southern Africa, 2000–16 (percent)
2000–06 2007–09 2010–13 2014–16
Services 47.0 48.6 55.0 57.6
Industry 30.8 31.0 27.3 24.9
Agriculture 22.2 20.4 17.7 17.5
Source: AfDB statistics.
8 T H E S O U T H E R N A F R I C A N E C O N O M Y
Inflation in Southern Africa
increased sharply, fueled by a rise
in food prices
and imports declined sharply during the period under review, with export growth declining from 12.6 percent in 2010–13 to 2.3 percent in 2015, and import growth from 12.7 percent to 1.3 per-cent in 2015. The underperformance is mainly due to unfavorable labor market conditions and lack of basic infrastructure and innovative technologies in many countries of the region.
Investments by public enterprises, such as state- owned enterprises, reflect the continued implementation of key infrastructure projects, particularly in the oil, gas, utility, and transpor-tation subsectors. For example, Botswana and Mauritius are expected to channel social service spending toward improving access and con-nectivity in urban and rural transportation infra-structure, while Lesotho is expected to channel spending primarily to education, training, and healthcare.
Gradual improvements in external demand are anticipated to improve the trade balance, as growth in exports responds slowly to external demand stimuli. Export performance is likely to be buttressed by improved commodity exports as global demand for commodities recovers and commodity prices continue to strengthen.
Opportunities and risksWeak recovery in the global economy presents major challenges that could adversely affect Southern Africa’s economic performance through trade, investment, and remittances. Sluggish U.S. growth, broad Brexit implications, and weak Euro-pean Union performance could hurt growth in the region, especially in South Africa, which is more
globally integrated than other economies of the region. This could be aggravated by a continued trend in the appreciation of the rand observed since 2016, which would further undermine South Africa’s export competitiveness and add strain on its current account balance.
vulnerability to external shocks remains a longstanding challenge in the region. Combin-ing improvements in agricultural productivity and technological investments would help to improve the region’s resilience to weather shocks, such as the widespread drought that reduced agricultural production in 2016. High value- added industry and services will depend on policy choices in Zim-babwe and South Africa, following change in lead-ership, with implications for investor confidence. The stakes are even higher in South Africa after the recent downgrade in its debt rating.
MACROECONOMIC CONDITIONS
Price movements
InflationInflation in Southern Africa increased sharply from an average of 5.6 percent in 2015 to 10.5 percent in 2016 (table 5), fueled by a rise in food prices. Inflation spiked in Zambia, stoked by the removal of fuel and electricity subsidies, which triggered broad price adjustments across the economy, especially in transport and energy- intensive sec-tors. Angola, Malawi, and Mozambique also recorded high inflation.
TABLE 4 Demand component growth rates in Southern Africa, 2010–15 (average annual percentage growth)
2010–13 2014 2015
Private sector consumption 5.5 1.8 2.3
Public sector consumption 7.2 4.9 4.2
Gross capital formation 10.8 9.0 5.3
Exports 12.6 7.3 2.3
Imports 12.7 5.4 1.3
Source: AfDB statistics.

T H E S O U T H E R N A F R I C A N E C O N O M Y 9
Weak economic growth, expensive credit, and lower oil prices have central banks in the region rethinking their monetary policy strategies
The average inflation for the region is esti-mated to decelerate to 9.4 percent in 2017 and to decline further in 2018–19, stabilizing at around 7 percent, as domestic food conditions improve due to a bumper crop harvest, and exchange rates stabilize, curbing pass- through effects from exchange rates to inflation. Most of the countries that recorded high inflation in 2016 have experi-enced a rapid reduction in 2017, most notably Malawi, where inflation declined from 21.8 percent to 12.3 percent, and Zambia, from 18.2 percent to 6.6 percent. The overall declining trend is also a response to tight monetary conditions instituted in 2016 to contain inflationary pressures. Inflation rates in the countries of the region (except Angola) are expected to gravitate toward a range of around 4–8 percent by 2019.
Weak economic growth, expensive credit, and lower oil prices have central banks in the region rethinking their monetary policy strategies. In the first quarter of 2017, the South African economy entered a recession amid subdued domestic demand and low private sector activity, coupled with policy uncertainty, which reduced inves-tor confidence. The country’s credit rating was also downgraded by two rating agencies to sub- investment grade in April and November 2017. The
South African Reserve Bank reduced the repo rate in July 2017 by 25 basis points to 6.8 percent to bolster the economy. The country’s economy moved out of recession in the second quarter, as quarterly growth accelerated to 2.8 percent from –0.6 percent in the first quarter. The economy continued to grow in the third quarter, at 2.0 per-cent. Similarly, due to lower inflation and a better outlook for the medium term, the Bank of Zambia announced in November 2017 a reduction in the key policy rate by 75 basis points to 10.3 per-cent and the reserve ratio by 150 basis points to 9.5 percent.
A build- up of inflationary pressure in South Africa stokes a rise in other countries given the country’s position as a major trading partner and the source of most imports, particularly food. Infla-tion in the countries in the Southern African Cus-toms Union (SACU) region and Rand Monetary Area (RMA) track movements in South Africa’s inflation (figure 4). Inflation is lower in Botswana because the country’s monetary policy is inde-pendent of South Africa’s. In other countries, monetary policy is strongly linked to South Africa due to rand parity exchange rates.
The vulnerability of the region’s inflation to volatile food prices and energy costs reflects the
TABLE 5 Consumer price inflation in Southern Africa, 2015–19 (percent)
2015 2016 2017 2018 2019
Regional average 5.6 10.5 9.4 7.8 7.0
Angola 10.2 30.4 31.2 20.6 15.4
Botswana 3.1 2.8 3.4 3.6 3.8
Lesotho 4.3 6.4 5.3 6.0 6.8
Madagascar 7.4 6.7 8.0 6.8 6.6
Malawi 21.0 21.8 12.3 9.6 8.1
Mauritius 1.3 1.0 3.8 4.6 4.1
Mozambique 2.4 19.2 17.2 10.3 5.9
Namibia 3.4 6.7 6.5 6.0 5.7
South Africa 4.6 6.3 5.4 5.2 5.4
Swaziland 5.0 8.0 7.0 5.0 5.1
Zambia 10.0 18.2 6.6 7.4 7.9
Zimbabwe –2.4 –1.6 0.5 7.6 4.6
Source: AfDB statistics.
Note: Figures for 2017 are estimates; figures for 2018 and 2019 are projections.

10 T H E S O U T H E R N A F R I C A N E C O N O M Y
Deteriorations in the terms of trade have a particularly
destabilizing effect on domestic
currencies and fiscal and current account positions
strong food and energy content in the consumer basket for most countries. Core inflation is gen-erally low and stable, suggesting that monetary policy should target this component of inflation rather than fight headline inflation, which is sus-ceptible to cyclical movements. Currency depreci-ation also fuels inflationary pressures, particularly in the region’s open economies.
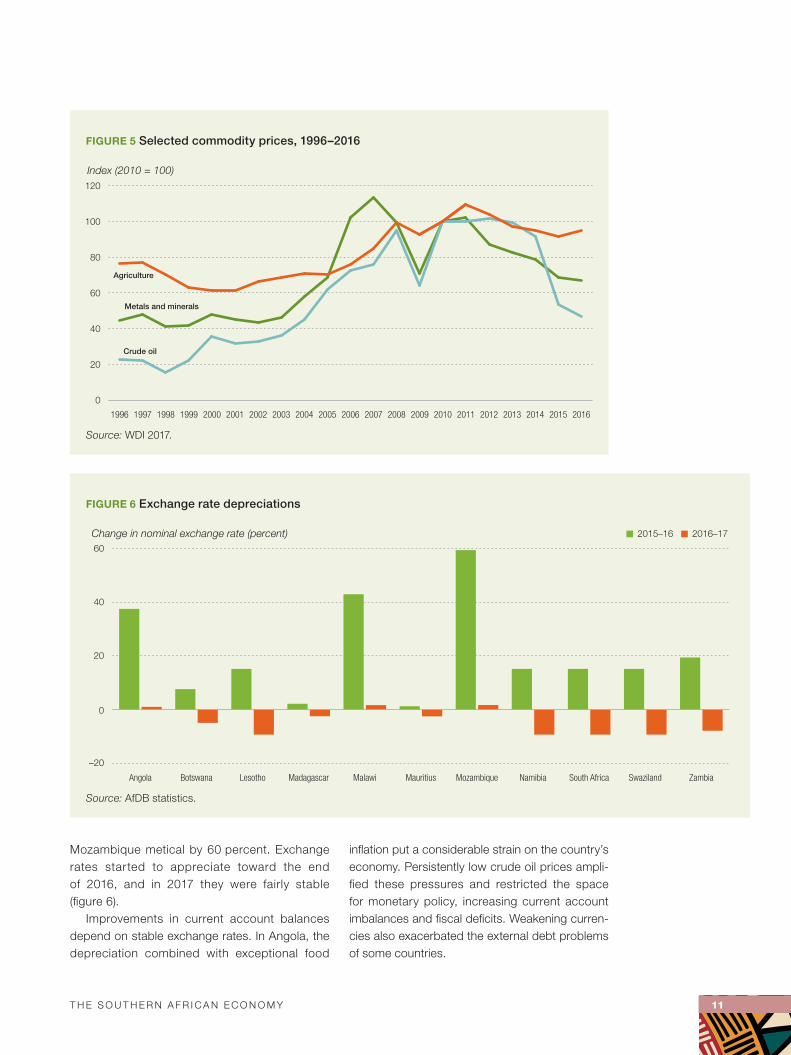
Terms of tradeMany countries in Southern Africa depend on at least one natural resource commodity for export revenues — diamonds in Botswana, copper in Zambia, oil in Angola, and gold in South Africa and Namibia. So, deteriorations in the terms of trade, stoked by low prices for these com-modities, have a particularly destabilizing effect on domestic currencies and fiscal and current account positions. But low oil prices generally support inflation conditions in the Southern African region. Terms of trade for resource- intensive economies have declined since 2011 as a result of falling prices of major commodi-ties. Since 2016, they have recovered, but are still significantly below the peak some years ago (figure 5).
Despite the rebound of non- food commodity prices, global crude oil prices remain subdued, which adversely impacts oil- producing states like Angola. The Organization of Petroleum Export-ing Countries (OPEC) renewed its commitment to keep oil output low in order to prop up prices. High crude oil prices would benefit Angola, but trigger macroeconomic imbalances for oil import-ers. Given the structural changes in the energy market — the excess supply from increased U.S. shale production — oil prices are likely to remain depressed. Saudi Arabia is also seeking to diversify from oil. Such structural changes could change the dynamics of the global oil market irre-versibly, and African policy makers should devise mechanisms to adjust.
Exchange ratesAs commodity prices recovered, exchange rate depreciations eased in 2016 and 2017, follow-ing sharp depreciations in 2015 and 2016. At the lowest point for commodity prices in 2015, depreciation pressures were further com-pounded by the U.S. dollar appreciation. The Angola kwanza depreciated by 38 percent, the Malawian kwacha by 43 percent, and the
FIGURE 4 Movements in SACU and RMA inflation rates
0
2
4
6
8
10
2019(projected)
2018(projected)
2017(estimated)
2016201520142009–13
Annual inflation (percent)
South Africa
SwazilandLesotho
BotswanaNamibia
Source: AfDB statistics.
T H E S O U T H E R N A F R I C A N E C O N O M Y 11
Mozambique metical by 60 percent. Exchange rates started to appreciate toward the end of 2016, and in 2017 they were fairly stable (figure 6).
Improvements in current account balances depend on stable exchange rates. In Angola, the depreciation combined with exceptional food
inflation put a considerable strain on the country’s economy. Persistently low crude oil prices ampli-fied these pressures and restricted the space for monetary policy, increasing current account imbalances and fiscal deficits. Weakening curren-cies also exacerbated the external debt problems of some countries.
FIGURE 5 Selected commodity prices, 1996–2016
0
20
40
60
80
100
120
201620152014201320122011201020092008200720062005200420032002200120001999199819971996
Index (2010 = 100)
Metals and minerals
Agriculture
Crude oil
Source: WDI 2017.
FIGURE 6 Exchange rate depreciations
–20
0
20
40
60
ZambiaSwazilandSouth AfricaNamibiaMozambiqueMauritiusMalawiMadagascarLesothoBotswanaAngola
Change in nominal exchange rate (percent) 2016–172015–16
Source: AfDB statistics.

12 T H E S O U T H E R N A F R I C A N E C O N O M Y
Fiscal and current account deficit and sources of financeHigh fiscal deficits remain unresolved in Southern Africa. The region’s average fiscal deficit stood at 4.4 percent of GDP in 2016, above the 3 per-cent prescribed as a norm in the region’s conver-gence criteria (figure 7). The region’s fiscal deficit
is estimated to have widened to 5 percent in 2017, with Mozambique, Zimbabwe, Zambia and Swa-ziland above 7 percent of GDP. Botswana and Lesotho returned to surplus, estimated at 0.3 per-cent and 0.1 percent of GDP.
Barring any external shock and spending pres-sures, fiscal consolidation measures instituted in
FIGURE 7 Fiscal balances in Southern Africa
ZimbabweZambiaSwazilandSouth AfricaNamibiaMozambiqueMauritiusMalawiMadagascarLesothoBotswanaAngola
Percent of GDP 2017 (estimated) 2018 (projected)2016
–12
–10
–8
–6
–4
–2
0
2
Source: AfDB statistics.
FIGURE 8 Current account balances, 2016–19
Percent of GDP 2017 (estimated) 2018 (projected) 2019 (projected)2016
–50
–40
–30
–20
–10
0
10
20
ZimbabweZambiaSwazilandSouth AfricaNamibiaMozambiqueMauritiusMalawiMadagascarLesothoBotswanaAngola
Source: Data from national authorities.

T H E S O U T H E R N A F R I C A N E C O N O M Y 13
Low aggregate GDP growth masks a promising resurgence in smaller, low-income economies
the region’s countries are expected to improve the fiscal outlook in the medium term. Mozambique and Zambia, the two countries with unprece-dented increases in post- HIPC debt, have put in place measures to instill fiscal discipline reducing frivolous and expensive capital expenditure cou-pled with enhanced tax collection efforts.
Deteriorating fiscal positions present signifi-cant challenges in today’s low growth environment (box 1). Fiscal stimuli are important countercyclical policy tools in periods of low growth, but macro-economic imbalances induced by fiscal deficits
reduce the fiscal space for governments to maneu-ver. Mozambique and Zambia show that reducing or delaying capital investments and improving the allocation of domestic resources may be among the few options available to restore fiscal fitness. But these strategies may be inimical to growth in the long run, since large- scale infrastructure investments are critical for fostering growth.
The region’s current account deficit aver-aged 4.6 percent in 2016, and it is estimated to have narrowed to 3.9 percent in 2017, bolstered by commodity exports (figure 8). Lesotho and
BOX 1 High dependency on volatile and declining SACU revenues
The smaller member states of the Southern African Customs Union (SACU) depend on SACU rev-enues. One of the oldest customs unions, established in 1910, SACU governs trade for Botswana, Lesotho, Namibia, and Swaziland (BLNS) and for South Africa under the SACU Agreement, 2002. The Union, which has a common external tariff and guarantees free movement of goods, rep-resents an important source of fiscal revenue for the smaller BLNS states, particularly for Lesotho and Swaziland. SACU revenues also play a large role in BLNS external current accounts.
SACU revenues, collected in the Common Revenue Pool managed by South Africa, are dis-tributed to member states according to a revenue-sharing formula, calculated based on customs duties, excise, revenues, and development components. Only the BLNS shares of collected reve-nue are calculated, with South Africa receiving the residual.
The size of the revenues collected depend mainly on the performance of the South African economy, while annual payments to each member country are based on forecast revenues. This method of payment causes enormous volatility to revenue flows for BLNS, exacerbating fiscal imbalances. For instance, SACU revenues fell from over 60 percent of total revenue in 2008/09 to about 38 percent in 2010/11, before rising to nearly 60 percent in 2012/13 for Swaziland.
Besides being volatile, member countries’ share of SACU revenues has been falling in recent years and the declining trajectory is likely to continue in the medium term if growth in South Africa fails to pick up. BLNS also face the risk of a further decline of SACU revenues emanating from a reduction in the common external tariff rates because of trade liberalization and the creation of the Southern African Development Community customs union. In addition, a new sharing formula could further reduce transfers to BLNS. Continued poor performance of SACU revenues could also pose important challenges to BLNS’s fiscal policy and adversely affect their external current accounts, eroding their international reserves.
The volatility and declining trend of SACU revenues underscore the need for BLNS govern-ments, especially Lesotho and Swaziland, to:• Put in place measures to help reduce vulnerability to SACU revenues and undertake durable
fiscal adjustment efforts, including expenditure reducing and revenue enhancing measures.• Consider establishing stabilization funds or adopting fiscal rules aimed at reducing the volatility
and uncertainty of SACU revenue flows to the budget.• Pursue, where necessary, efforts aimed at building adequate international reserve buffers over
the medium term to augment their countries’ resilience to risks from the volatility and decline of SACU revenues.

14 T H E S O U T H E R N A F R I C A N E C O N O M Y
Solving the region’s poverty puzzle requires
policy investments that explicitly
consider income redistribution
Mozambique had the largest deficits — 15.9 per-cent and 30.9 percent, respectively — reflecting mounting external imbalances in both countries. For Mozambique, the current account deficit is projected to widen further in 2018 and 2019, as the burden of external debt deepens. Botswana has a surplus in the current account, estimated at 11.2 percent in 2017 and expected to remain at this level. The current account surplus for Swazi-land is also projected to firm up to about 1.9 per-cent in 2018.
Current account deficits weaken external posi-tions, and increasing foreign direct investment may not be sufficient to shore them up. Botswana is an exception. Mineral exports buoyed its current account surpluses in 2014 and 2015, at 15.6 per-cent and 7.5 percent of GDP respectively. Improve-ment in the external demand for mineral exports is expected to contribute to a resurgence in Botswa-na’s capacity to rebuild current account surpluses.
Regional debt levels continue to rise as a share of GDP, problematic against weak growth. More-over, the rising debt coupled with increasing fiscal deficits bode poorly for the sustainability of long- term growth.
Low aggregate GDP growth masks a promis-ing resurgence in smaller, low- income economies. But the region’s sluggish growth and burgeon-ing debt require governments to be innovative in the fiscal policy space to generate and support emerging engines of growth.
POVERTY, INEQUALITY, AND EMPLOYMENT
Trends in poverty and inequalityChanges in the proportion of the population in poverty across the region reveal clear improve-ments in poverty reduction strategies and intrac-table poverty (figure 9). Economic growth that leaves significant segments of a population behind has negative long- run consequences. The region must invest in strategies that improve the lives of its people, particularly given extreme economic polarization and high youth unemployment.
The upper middle- income countries Botswana, Namibia, and South Africa have made signifi-cant progress in reducing poverty respectively:
from 30.6 percent in 2000–06 to 19.3 percent in 2010–15; from 37.7 percent to 28.7 percent; and from 69 percent to 55.5 percent. Meanwhile pov-erty rates in low- income countries such as Mad-agascar and Malawi registered elevated levels of 70.7 percent and 50.7 percent in 2010–15, respectively. On the other hand, the lower- middle- income countries Lesotho and Swaziland regis-tered poverty rates of 57.1 percent and 63.0 per-cent, respectively.
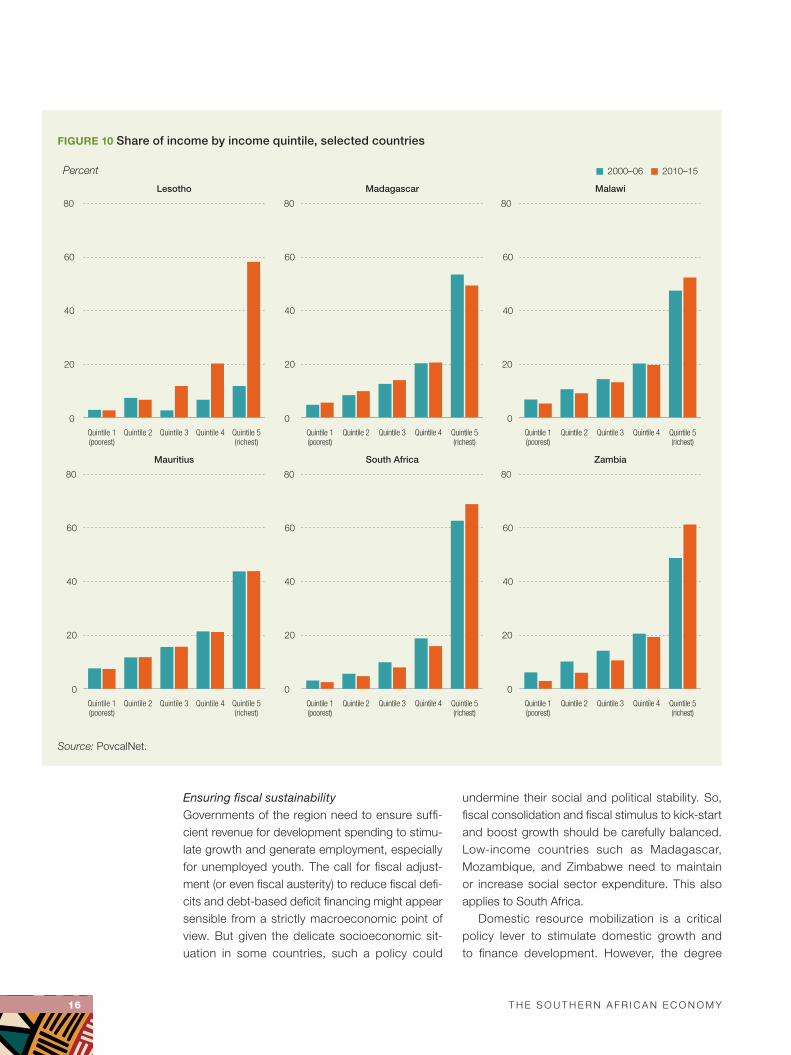
Solving the region’s poverty puzzle requires policy investments that explicitly consider income redistribution. Targeted cash transfer programs and increased social spending can boost incomes in the lowest quintile. In South Africa, increased social spending and direct cash transfers boosted incomes in the poorest decile tenfold. Income dis-tributions are polarized across the region, effec-tively limiting the distributional power of economic growth to lift families out of poverty (figure 10).
Historically, the Southern African region, much like the others, has been hyper- focused on gen-erating economic growth through debt financing and government spending. But slow growth in the context of rising debt and a sluggish global envi-ronment limits the effectiveness of such strategies. The region needs to prioritize addressing socio-economic inequalities in its poverty- reduction agenda. Over the last decade, income inequality remained virtually unchanged, despite stronger efforts to lift people steeped in poverty.
Economic growth in the early 2000s did not generate economic progress for most regional economies. Pronounced in the upper middle- income countries and highest in Botswana, Nambia, and South Africa, inequality is lower in the low- income countries (figure 11). Zambia and Malawi showed signs of deteriorating further, solidifying structural inequality. Botswana and Madagascar marginally improved, but insufficient for the depth of poverty.
Growth decompositionTo understand the nature of the growth that the region has experienced and whether the chang-ing structure has been of the transformational type, consider economywide labor productiv-ity, decomposed in two components. The first component measures within- sector productivity

T H E S O U T H E R N A F R I C A N E C O N O M Y 15
The region’s productivity grew at an average annual rate of 1.4% between 2005 and 2016, with a maximum of 6% registered in 2012
growth and its contribution to aggregate labor productivity growth. Sectoral productivity growth could be affected by periodic technological and price shocks, such as weather and volatile com-modity prices.
The second component measures the contri-bution of labor’s reallocation from low- productivity sectors to high- productivity sectors to aggregate productivity growth. When changes in sectoral employment shares are positively correlated with productivity levels, this term is positive, and structural change will contribute to economy-wide productivity growth. The second component captures a rather long- term process of economic transformation as countries grow. This structural transformation determines countries’ long- term economic performance, including their capacity to reduce poverty and create enough “decent” paying jobs.
Southern Africa fares poorly since much of the growth in labor productivity has been driven by within- sector productivity growth, with minis-cule contributions from structural change (figure 12). The region’s productivity grew at an average annual rate of 1.4% between 2005 and 2016, with a maximum of 6% registered in 2010. The region’s overall productivity largely coincides with
the boom in commodity prices, seemingly insu-lated from the global financial crisis in 2008–09. But like many other parts of Africa, the region has recently experienced economic headwinds, with the boom in global commodity prices starting to subside. Lower mineral prices, especially for oil, copper, iron, coal, and gold have put a dent on the region’s performance, especially for Angola, South Africa, and Zambia. The region has also been hit by widespread drought and acute water shortages due to El Niño, affecting several coun-tries: Botswana, Malawi, Namibia, Swaziland, Zimbabwe, and sizable parts of Mozambique and South Africa.
The slowdowns in the two largest economies, Angola and South Africa, have weighed down the regional growth rate, as smaller economies grap-ple with repeated weather shocks.
POLICY CHALLENGES
Macroeconomic policiesSouthern African countries are facing complex macroeconomic challenges, such as fiscal strain and low domestic revenues, rising debt levels, inflationary pressures, and currency devaluation.
FIGURE 9 Evolution of poverty rates by income groups in the Southern African region
Percent
Low income Lower middle income Upper middle income
MalawiMozambiqueMadagascar SwazilandLesotho South AfricaNamibiaBotswana
2000–06 2010–15
0
20
40
60
80
0
20
40
60
80
0
20
40
60
80
Source: WDI 2017.
16 T H E S O U T H E R N A F R I C A N E C O N O M Y
Ensuring fiscal sustainabilityGovernments of the region need to ensure suffi-cient revenue for development spending to stimu-late growth and generate employment, especially for unemployed youth. The call for fiscal adjust-ment (or even fiscal austerity) to reduce fiscal defi-cits and debt- based deficit financing might appear sensible from a strictly macroeconomic point of view. But given the delicate socioeconomic sit-uation in some countries, such a policy could
undermine their social and political stability. So, fiscal consolidation and fiscal stimulus to kick- start and boost growth should be carefully balanced. Low- income countries such as Madagascar, Mozambique, and Zimbabwe need to maintain or increase social sector expenditure. This also applies to South Africa.
Domestic resource mobilization is a critical policy lever to stimulate domestic growth and to finance development. However, the degree
FIGURE 10 Share of income by income quintile, selected countries
Percent
Lesotho Madagascar Malawi
0
20
40
60
80
Quintile 5(richest)
Quintile 4Quintile 3Quintile 2Quintile 1(poorest)
0
20
40
60
80
Quintile 5(richest)
Quintile 4Quintile 3Quintile 2Quintile 1(poorest)
0
20
40
60
80
Quintile 5(richest)
Quintile 4Quintile 3Quintile 2Quintile 1(poorest)
Mauritius South Africa Zambia
0
20
40
60
80
Quintile 5(richest)
Quintile 4Quintile 3Quintile 2Quintile 1(poorest)
0
20
40
60
80
Quintile 5(richest)
Quintile 4Quintile 3Quintile 2Quintile 1(poorest)
0
20
40
60
80
Quintile 5(richest)
Quintile 4Quintile 3Quintile 2Quintile 1(poorest)
2000–06 2010–15
Source: PovcalNet.

T H E S O U T H E R N A F R I C A N E C O N O M Y 17
of freedom for fiscal action varies in the region, with some countries having more scope for fiscal action than others. Upper middle- income econo-mies like Angola, Mauritius, and Namibia exhibit rather low tax to GDP ratios, and they have room for gaining fiscal space from additional domes-tic resource mobilization. Lower middle- income economies like Lesotho, Swaziland, and Zambia
have relatively high ratios. Low- income countries such as Madagascar, Malawi, and Zimbabwe also have relatively low tax to GDP ratios, and should take policy measures to improve them. Policy rec-ommendations to increase public revenue include:• Establish or strengthen revenue authorities.• Broaden the tax base through formalizing infor-
mal businesses.
FIGURE 11 Evolution of inequality and GDP per capita
Gini index Gini index
Gini index Per capita GDP growth (percent)
Low income Lower middle income
Africa
South AfricaNamibiaMauritiusBotswana
MalawiMadagascar ZambiaSwazilandLesotho
Upper middle income
–4
–2
0
2
4
6
201720142012201020082006200420022000
2000–06 2010–15
0
20
40
60
80
0
10
20
30
40
50
60
0
10
20
30
40
50
60
Source: AfDB statistics and WDI 2017.

18 T H E S O U T H E R N A F R I C A N E C O N O M Y
Greater engagement of government
in public– private partnerships
may also offer opportunities to
mobilize additional finance, especially
for infrastructure development
• Reform and strengthen tax administrations and tax inspections to ensure tax compliance.
• Review and revise existing tax legislation to minimize or eliminate tax evasion.
• Strengthen capacity in transfer pricing to reduce tax evasion.
• Reduce tax exemptions and holidays.Greater engagement of government in public–
private partnerships may also offer opportunities to mobilize additional finance, especially for infra-structure development. To this end, the authorities should put in place appropriate PPP legal frame-works and regulations.
On the expenditure side, spending in many countries is insufficient to meet critical social and infrastructural needs and to boost economic growth.
Policy recommendations on the expenditure side include:• Contain the increase in or reduce recurrent
spending to free resources for productive spending by implementing civil service reforms, eliminating ghost workers, and imposing (tem-porary) hiring and wage freezes.
• Improve the efficiency and effectiveness of public spending by reforming public expenditure and putting in place institutional mechanisms to identify infrastructure projects with high impact.
• Review and reduce and eventually phase out unproductive transfers and subsidies, such as those for fuel and energy.
• Restructure state- owned enterprises to increase their efficiency and reduce losses.Public enterprises should be reassessed and
rationalized based on their relevance for state par-ticipation. In addition, a robust governance frame-work should be established for their management and governance. Recommended here is adopting international best practices, particularly the OECD Guidelines on Corporate Governance of State- Owned Enterprises.
Managing rising debtRegional public debt continues to rise as a share of GDP, caused by a mismatch between reve-nue and expenditure. This trend is problematic against the backdrop of lackluster growth in many countries in the region. Moreover, rising debt levels coupled with the increasing fiscal deficits have negative implications for long- term growth. Patterns of indebtedness differ, calling for differ-ent policy responses. For example, public debt iZn South Africa and Zimbabwe has increased in recent years, but South Africa’s consists almost exclusively of domestic debt, while Zimbabwe’s is mostly external.
FIGURE 12 Decomposition of labor productivity growth
Percent
Weighted within-sector labor productivity growth Weighted structural labor productivity growth
201620152014201320122011201020092008200720062005
–4
–2
0
2
4
6
8
Source: AfDB statistics.
T H E S O U T H E R N A F R I C A N E C O N O M Y 19
Countries in the region should seize new opportunities emerging from cooperation and collaboration with other economies
Policy recommendations to address rising debt include:• Increase domestic resource mobilization.• Contract new debt on terms as concessional
as possible. External arrears should be cleared to be able to access concessional debt. Policy makers should be aware that increased domestic debt might crowd out the private sector, hence curtail growth.
• Strengthen the capacity of debt management units.
• Attract foreign investment by reducing uncer-tainty about investment regulations and improve the business climate by reducing costs and procedures to open a company and to register property.To strengthen a country’s resilience against
external shocks and shield the economy from exchange rate volatility, policy recommendations include:• Diversify the country’s economic base to
reduce dependency on too narrow a set of products and increase export competitiveness. This requires identifying and promoting new businesses and industries with good potential for growth and exports.
• Put in place a conducive business environ-ment with affordable infrastructure services and a streamlined bureaucracy, to promote private sector activity and attract foreign direct investments.
• Build up sufficient international reserves to respond to shocks. Countries with significant natural resource endowments should consider establishing sovereign wealth funds.
• Invest in climate- resilient infrastructure to better withstand natural disasters and adverse weather phenomena. This also includes invest-ment in green energy infrastructure to reduce dependency on costly petrol imports to gen-erate power.
Structural policies
Boosting structural transformation and industrializationFrom a long- term perspective though, transfor-mation of the economies of the region appears to have been toward services not industry. A large
share of the growth in (non- farm) employment was in household enterprises, not in modern industrial enterprises.
Policies should, thus, focus on speeding up industrialization in the Southern African countries. Policy harmonization is necessary across regional countries. In addition, policy changes should ensure efficiency in the linkages between the var-ious sectors.
Countries in the region should seize new opportunities emerging from cooperation and col-laboration with other economies. In this regard, developing a regional strategy can facilitate the participation of regional firms in global value chains through access to finance, technology, and markets.
Countries also need to strengthen fair trading and competition policies and regulations, since anti- competitive practices are common. Competi-tion policies and laws should level the playing field in the market.
Collaborative measures should also be devel-oped to support the region’s drive toward indus-trialization by cooperating in public procurement. That would reduce the tendency to exclude regional suppliers from participating in public bids in pursuit of national and local development objectives.
Policy recommendations to promote Southern Africa’s industrialization include:• Identify sectors with good potential for value
addition and transformative growth. Mada-gascar and Mozambique have considerable untapped potential for agro- based and blue economy- led industrialization. Others enjoy endowments of oil, gas, and minerals.
• Develop sectors and industries with an iden-tified potential for industrialization and large- scale employment as a top priority, notably by providing infrastructure, putting in place ade-quate legal and regulatory environments, and imparting the right skills.
• Design tailor- made support policies and schemes through tax- free land and other incentives, promote business incubators, build industrial clusters and parks, and establish special economic zones.
• Enable and promote the transfer of necessary know- how and technology from abroad to

20 T H E S O U T H E R N A F R I C A N E C O N O M Y
Investments that boost agricultural productivity and
technology in the sector should
catalyze the conversion of
small-scale activities
boost productivity, with South- South cooper-ation as entry points.
Modernizing Southern Africa’s agricultural sector — Feed Southern AfricaAgriculture remains a significant source of income and employment for most poor families in the region. So, investments that boost agricultural productivity and technology in the sector should catalyze the conversion of small- scale activities from the informal to the formal sector. Govern-ments in the region should foster a self- reinforcing catalytic economic growth process — investing in agricultural innovations and vocational skills to support and promote youth self- employment as a viable path to economic growth.
Large businesses have operations extending across the region, and are linked into global value chains and international production systems. Eco-nomic policies must engage with the interests of these firms if they are to influence their decisions toward investing in productive capabilities. Large firms can realize economies of scale, but they can also exert market power to exclude smaller firms and entrants (see Part II).
Reaping the benefits of Southern Africa’s rich gas, oil, and mineral resources — Power Southern AfricaMozambique could become one of the largest economies in Africa when production of natural gas in the north reaches its peak in 2028. The country’s economy is expected to grow at 24 percent a year, and half of Mozambique’s GDP might come from natural gas. Fast- tracking natural gas production and improving budget management can maximize the benefits in human development outcomes.
A portion of the gas should be allocated to meet local demand, especially for power gener-ation, processing, and industrial needs. Mozam-bique should improve sector governance, put in place a policy framework, and provide fiscal incentives for investments in infrastructure to har-ness the benefits for inclusive development.
Policy recommendations to manage Mozam-bique’s gas reserves include:• Develop specific domestic gas utilization policies.• Target policies that promote interregional trade
of gas resources.
• Develop gas revenue management policies.• Promote policies that pursue industrial devel-
opment using gas, and develop industrial zones where gas can be supplied to several industries.Angola is Africa’s second largest oil producer,
producing 1.8 million barrels of oil per day on average, with an estimated proven oil reserve of 11.6 billion barrels. Although Angola produces a lot of oil, it still imports petroleum products. It needs to develop policies that sustain the econ-omy using petroleum resources processed in the country. The recent restructuring of the national oil company and the general management of the oil and gas sector is likely to improve the oil sector’s performance.
Policy recommendations to ensure that Ango-la’s oil resources are used transparently and effec-tively include:• Design policies that review institutional frame-
works to separate and enhance clarity on the roles of different institutions in the oil sector.
• Develop petroleum revenue management policies.
• Favor value addition for petroleum resources in order to satisfy the domestic market.
• Promote the maximization of gas resources to generate electricity.South Africa is endowed with a variety of min-
eral resources and has a well- developed mining and quarrying industry based on over 100 years of experience, especially in gold, diamonds, and coal mining. While mining is spread across the country, there is a greater concentration of both mining and industry in the northeast covering the Gauteng and Limpopo provinces. Gauteng province is a major industrial area that developed largely as a result of gold and coal mining.
Policy recommendations to allow the mining and quarrying industry to respond to external and internal developments include:• Boost the low investor confidence and there-
fore increased difficulties in raising capital due in part to the downgrading of the country’s credit ratings.
• Improve investor perceptions of regulatory uncertainty. For long-term sustainability, invest-ments are required in exploration to replace or replenish depleted resources.

T H E S O U T H E R N A F R I C A N E C O N O M Y 21
The region needs to coordinate growth, trade, and job creation policies to engender a multiplier effect
• Develop local content policies to increase local communities’ benefits from the mining industry.
• Rehabilitate disused mines. Some mines that have not been fully rehabilitated are encour-aging illegal mining, which causes both safety issues and risks of criminal activity such as illicit dealing in minerals and money laundering.
Creating jobs for Southern Africa’s youthYouth employment is a collective Southern Afri-can regional issue that should be a top priority for governments, and adequate levels of resources should be allocated to promoting policy inter-ventions to reduce the youth unemployment rate. Governments should emphasize employment and investment in the agricultural sector through voca-tional skills training, commercial farming training, and farmer cooperative formation and strengthen-ing. The focus should be on job creation, entre-preneurial skill development, and small business development. Best practices such as the Malawi Youth in Agriculture and National Youth Service Program and Botswana National Internship Pro-gram can impart knowledge and entrepreneurial skills, as can setting up youth employment net-works and youth desks at district levels (Malawi and Zambia). Science, technology, engineering, and mathematics (STEM) education programs can support technological innovation, a key factor in the development and competitiveness of the regional economies. Also needed are lower bar-riers to entry for small, micro, and medium enter-prises through active anti- competitive measures and commitments by businesses and govern-ments to redesign their supply chains. Funding, from both public agencies and private funds, should be more accessible to support the growth and expansion of small businesses.
Specific policy recommendations to generate employment for youth include:• Prioritize employment and entrepreneurship
with increased resource allocation to programs that increase access to financial and material resources for young people.
• Foster a culture of social and environmental responsibility among enterprises to support youth employment and entrepreneurship.
• Promote education and skill development by enacting educational laws and improving the
quality and relevance of education and training systems.
• Address the mismatch between education and the requirements of the labor market and national development.
• Increase resources available to improve educa-tion by ensuring that individuals can afford edu-cation and that countries allocate resources to fund education, and enroll and retain girls in school.
• Foster health and well- being and advocate for the allocation of a sufficient budget for health to meet the specific needs of adolescents, mobilize investment in the health system, and promote and champion child and adolescent health.
Integrating Southern AfricaThe Southern Africa region needs to coordinate growth, trade, and job creation policies to engen-der a multiplier effect. Shifting resource exporters higher on the global value- added chain from raw material conduits to intermediate product proces-sors can provide economies of scale, a base to defray upfront investment costs, and an organic middle- skill job creation engine. In Zambia, this would involve exporting intermediate and pro-cessed copper goods in addition to raw copper. New regional trade agreements with emerging high- demand economies like China could provide ready markets for such initiatives.
Challenges such as food security, energy, water, and transport and communications infra-structure require solutions integrating the region. For example, the Lesotho Highlands Water Proj-ect will generate hydroelectric power for Lesotho, while increasing the volume of water transferred to South Africa from the current 10 billion cubic meters a year to about 15 billion. It comprises dams, hydropower stations, and tunnels between South Africa and mountainous, landlocked Lesotho.
More coordinated and robust regional infra-structure corridors such as water, ports, roads, and rail can integrate economies within the region, as can regulatory and legal frameworks for access to and efficient pricing of such services.
Increased regional and international trade will require significant investment in standards,
22 T H E S O U T H E R N A F R I C A N E C O N O M Y
quality assurance, accreditation, and metrology. Strengthening the regional SQAM infrastructure will also prevent the dumping of cheap, substan-dard manufactured goods in the regional market. A regional approach to SME support and devel-opment can promote the formation and growth of the sector to participate in regional trade and global supply chains.
Policy recommendations to promote regional integration in Southern Africa include:• Undertake rigorous political economy analysis
of factors preventing progress on the region’s integration agenda, including the identifica-tion of winners and losers. This will help policy
makers understand the real bottlenecks to regional integration and allow the design of pol-icies and reforms to accelerate the process of integration.
• Strengthen regional infrastructure, notably the multimodal transport corridors such as the Maputo Development Corridor, North- South Corridor, Dar- es- Salaam Corridor, Beira Corri-dor, and the Nacala Corridor, which offer great potential for growth and development.
• Remove nontariff barriers to trade, such as cum-bersome custom procedures, and strengthen soft infrastructure, such as one- stop border posts and single window information portals.
PART IIREGIONAL DEVELOPMENT AND COMPETITION IN FOOD VALUE CHAINS
Competitive rivalry should be understood in dynamic as well as static terms, includ-ing whether it improves capabilities. A key challenge in economic development is to generate competition and support local competitors.
This relates to a wider set of concerns about how markets are constructed and gov-erned. Markets are shaped by regulations, previous industrial policies, and dominant firms. Production decisions and competitive-ness are heavily influenced by how the suc-cessive stages of processing are governed and the balance of power between parties in the value chain. Policies, to be effective, need to recognize these dynamics at work.
Since the late- 1990s, many African countries have recorded high rates of GDP growth, based in most cases on minerals and agricultural commodities. At the same time, there have been rapid urbanization and changing consumption patterns toward more processed food.2 But Africa has a trade deficit in food, and SADC countries have col-lectively recorded persistent trade deficits in many processed food products (figure 13). Uncompetitive local production is one reason
food in African cities is around 35 percent more expensive than in cities in comparator developing countries.3 African countries also have generally low agricultural yields and poor agricultural productivity, despite having good conditions for agricultural production.4 Relatively arid countries with less scope for expanded agricultural production will still benefit from expanded regional production as a whole in terms of lower consumer prices and a lower cost base for downstream pro-duction such as in poultry where competitive-ness depends on animal feed costs.
Major multinational traders such as Bunge, Cargill, and Louis Dreyfus have expanded operations in Southern Africa very substantially, as has ETG, which has its origins in Kenya. Cargill and Louis Drey-fus handle 70 percent of the maize trading in South Africa.5 In South Africa, the two larg-est agro- conglomerate groups, Afgri and Senwes, have been sold to or joint ventured with international finance and trading compa-nies, Agrigroupe and Bunge.6
Meeting the growing demand for pro-cessed food in African cities requires cross- border agreement and actions to link
OVERVIEW
A n aggressive push to reduce trade restrictions has been accompanied by some growth
in regional trade, but the liberalization agenda assumes away many of the real issues
regarding how markets actually work, including market power and imperfect information. For
regional integration in Africa, the simplistic pushes to de fragment the continent further ignore
questions about how to build local industrial capabilities.
23

24 R E G I O N A L D E v E LO P M E N T A N D C O M P E T I T I O N I N F O O D vA L U E C H A I N S
Meeting the growing demand
for processed food in African cities requires cross-
border agreement and actions to link investments along
value chains
investments along value chains and develop capa-bilities to compete with imports. Food processing has characterized the early industrialization stages of many emerging economies. At issue here is how the Southern African region can best seize the opportunity for local industrialization offered by the growing demand for processed foods.7
Some promising examples: Zambia has seen impressive growth in agriculture, increasing soy-bean production from 55,000 tonnes in 2007 to more than 350,000 in 2017, with an increase of more than 80,000 tonnes between 2016 and 2017 alone. In the 2017 season, smallholder farmers produced 43 percent of the soya crop.8 South Africa has sustained export growth in fruits and moved the export basket to higher value products, reflected in substantially higher average export prices.
FERTILIZER
Low agricultural yields in many African countries are the result of extremely low fertilizer usage.9,10 One reason for low usage is that prices of fertilizer
have been substantially above international bench-mark world prices, as with urea in selected SADC countries (figure 14). The margins above the international export prices increased significantly around the end of 2011, even with initiatives to reduce transport and logistics costs.
The reasons for higher fertilizer prices include the exertion of market power, and the conditions along the fertilizer supply chain. Aside from South Africa, there is almost no fertilizer production in SADC countries. As importers, countries source from a small number of transnational corpora-tions in a highly concentrated international market. In two of the three main groupings of fertilizer, potash and phosphates, export cartels dominate the market. The Canpotex and BPC cartels control potash.11 Canpotex is the marketing organization for the three largest North American potash pro-ducers, PotashCorp, Agrium, and Mosaic. BPC is a joint venture of the three largest Russian and Belarusian potash producers, Uralkali, Silvinit, and Belaruskali. Mark- ups from collusion in potash have been estimated for 2008–12 at 50 per-cent to 63 percent.12 In phosphates, PhosChem is a USA Webb- Pomerene export cartel whose
FIGURE 13 SADC trade balances in processed food
US$ millions
Sugars and sugar productsPrepared meat, fish, crustaceans, mollusks, or other aquatic invertebratesPrepared vegetables, fruits, nuts, or other plant parts
Animal or vegetable fats and oilsMiscellaneous edible products
Prepared cereals, flour, starches, or milk (pastry products)Cocoa and cocoa products
201620152014201320122011
–3,000
–2,000
–1,000
0
1,000
2,000
Netexports
Netimports
Trade balance
Source: ITC Trade Map.

R E G I O N A L D E v E LO P M E N T A N D C O M P E T I T I O N I N F O O D vA L U E C H A I N S 25
Commercial poultry is highly concentrated with control in the hands of vertically integrated companies
members include PotashCorp and Mosaic, which are also members of Canpotex.13 The other major source of phosphate fertilizer is Morocco’s OCP, a government- owned monopoly for phosphate mining in that country.
In the third and most important fertilizer prod-uct grouping, nitrogenous fertilizers (including urea), high international prices have been asso-ciated with increasing concentration, as well as indications of collusion around 2008–09.14 This is consistent with the sharp increases in prices to farmers in Southern Africa in 2010–12.
The margins and excess profits give a strong incentive for businesses to lobby for rules and reg-ulations that bolster their position and keep out rivals by raising barriers to other suppliers, includ-ing access to port facilities. The cost of overland transport also adds to prices.
POULTRY AND ANIMAL FEED
The competitiveness of the overall poultry value chain depends on the pricing and supply of the main feed components (maize and soya), the efficient production of poultry in breeding, and broiler production, processing, and distribution
arrangements. Commercial poultry is highly con-centrated with control in the hands of vertically integrated companies with the rights to breeding stock and who typically link this to animal feed.15
Southern Africa has three main integrated poultry businesses (Astral, Rainbow, and Country Bird), which have licenses for breeding stock with the two largest multinationals (Cobb and Aviagen). The farmers producing animal feed are relatively dispersed, and many small chicken farmers buy feed and breeding stock to rear broiler chickens (figure 15). The development of the industry there-fore depends to a large extent on the decisions and strategies of the large integrated firms, which have the ability to govern the value chain as a whole.
The organization of the regional value chain across Southern Africa is critical for the overall competitiveness of poultry production. The main feed input cost depends on whether regional pro-duction meets and exceeds regional demand, such that maize and soya are at export prices — or whether demand will be met with deep sea imports.
For maize, the region generally produces in excess of local demand, and the prices on the South Africa Futures Exchange are at export
FIGURE 14 Urea prices
0
250
500
750
1,000
1,250
201520142013201220112010
Average price per ton (US$)
Malawi
TanzaniaZambia
Urea (granular, from the Arab Gulf)
Source: Amitsa and World Bank.
Note: Prices in Malawi, Tanzania, and Zambia are average prices reported monthly to Amitsa by agro-dealers.

26 R E G I O N A L D E v E LO P M E N T A N D C O M P E T I T I O N I N F O O D vA L U E C H A I N S
parity, meaning that the maize is cheaper than in international markets. In drought years, how-ever, the situation is reversed, and local poultry producers are squeezed. Increased rainfall vari-ability with climate change, coupled with growing local demand, means that the poultry industry will be affected by these shocks more frequently. Zambia is not necessarily subject to the same rainfall variability as South Africa and, indeed, had good harvests in 2015/16 when South Africa had a drought.
For soya, the region is a net importer, with the largest market, South Africa, importing large vol-umes of oilcake from South America at higher delivered import prices than poultry producers pay in Brazil. The resultant uncompetitiveness of the poultry industry in Southern Africa is reflected in imports of poultry from Europe and North and South America, which account for around 20 per-cent of South African consumption, on top of imports of soya beans and oilcake from Argentina and Brazil.16
There is good potential for substantial increases in the main feed inputs in Zambia. Indeed, the high growth in soya production in Zambia has already led to lower prices and supply more competitive with deep sea imports for the largest source of demand, which is in the Gauteng region of South Africa. Overland transport costs are also a signifi-cant factor.
In January 2017, the price of Argentinian soya was about $380 a ton. Transport, insurance, and financing costs from Argentina to Gauteng added about $110 a ton, so the price paid by poultry pro-ducers in Gauteng was around $490 a ton. At the time, Zambian soya prices averaged around $390 a ton, which with overland transport from Zambia to Gauteng at around $110 a ton left it uncompet-itive (figure 16).
However, benchmarks indicate that efficient logistics and border operations should put trans-port costs between Zambia and South Africa at around $40–$50 a ton. In 2017, backhauls from Zambia to South Africa became available at $45
FIGURE 15 Poultry value chain
Large, integrated customers
Globally concentrated input markets
Large, vertically integrated poultry
producers
Small, “emerging”outgrowers
Trade agreements and import competition Exclusive supply, rely on competitors for
chicks, feed, extension services
Exclusivelicense
Multiple, dispersed farmers
Limited bargaining
Global customers/ global standards
Concentratedstorage infrastructure
Limited choice(local monopoly)

R E G I O N A L D E v E LO P M E N T A N D C O M P E T I T I O N I N F O O D vA L U E C H A I N S 27
Supermarkets are changing food systems and driving trade flows in food, consumer goods, and related services
a ton, as the trucks would otherwise be returning empty to South Africa. Based on the January 2017 figures, Zambian soya could be landed in South Africa at $435 a ton compared with $490 a ton for deep sea imports.
Moves by South Africa to source more feed inputs from within the region would mean major growth in production in other Southern African countries such as Zambia. The competitive-ness of production requires investment to add value through the value chain along with efficient logistics. Zambia’s becoming a net exporter in 2013/14, and its exports in 2017 of animal feed and soya to South Africa, indicate the huge potential for further growth through the value chain.
Large international firms are at the center of these value chains, as suppliers to, and competi-tors with, smaller local businesses. While vertical integration can support the large linked capital investments required at different levels of the value chain, the concentration raises concerns about market power and anticompetitive conduct, evi-dent in cases involving poultry producers in South Africa and Zambia.17
THE SPREAD OF SUPERMARKETS
Southern African countries have experienced strong growth in the number and spread of supermarkets over the past decade.18 Super-markets are changing food systems and driv-ing trade flows in food, consumer goods, and related services such as transport. They have moved on from serving the traditional high- end affluent consumers in urban areas and are successfully penetrating new markets in lower income communities.19 The offerings include wholesalers extending into retail, and buying groups supporting independent supermarkets with purchasing and logistics.
The two main South African chains, Shoprite and Pick n Pay, have spread rapidly across Southern Africa (figure 17). The routes to market of supermarkets are oriented to processed and packaged food products, a large proportion exported from South Africa. To access supermar-kets, local suppliers must meet the private stan-dards and requirement of supermarket chains in cost, quality, packaging, delivery schedules, and
FIGURE 16 Soya costs and delivered prices in Gauteng Province, South Africa
0
100
200
300
400
500
ZambiaArgentina
0
100
200
300
400
500
Zambia Argentina
US$ per ton
a. September 2016 b. January 2017
Soybean price Transport costSoybean price Sea freightOverland transport Other (duty, financing)
Transport costs between Zambia and South Africa are coming down
because of assured backhauls
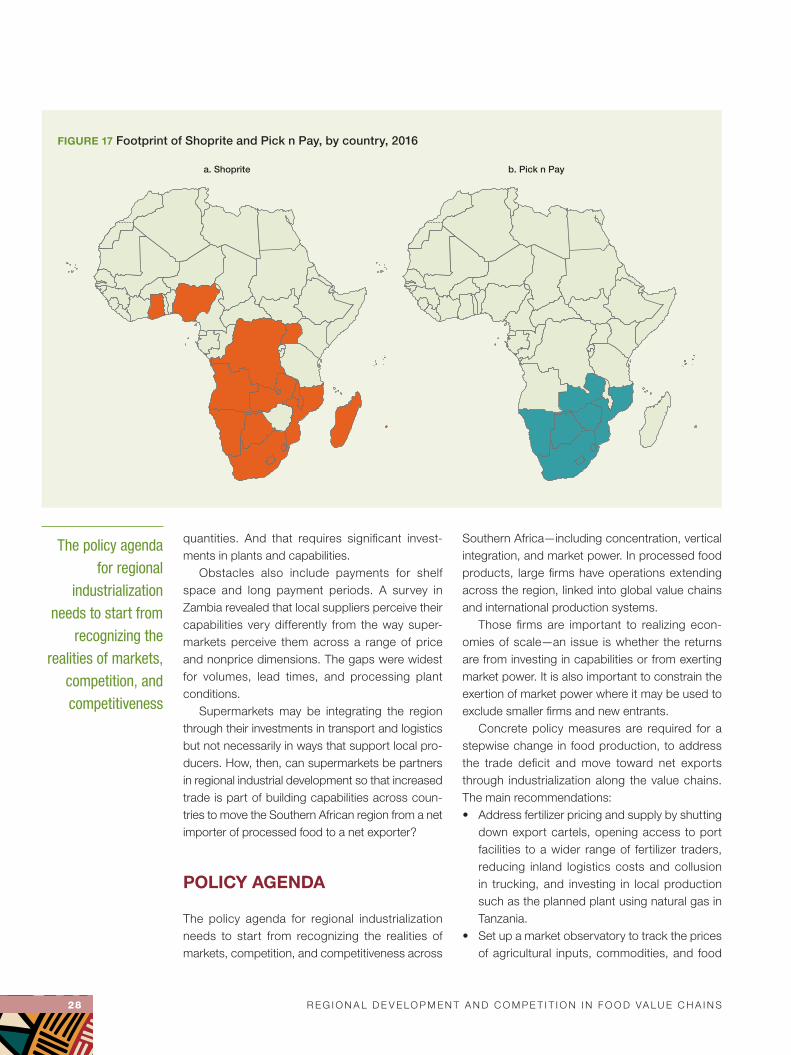
28 R E G I O N A L D E v E LO P M E N T A N D C O M P E T I T I O N I N F O O D vA L U E C H A I N S
The policy agenda for regional
industrialization needs to start from
recognizing the realities of markets,
competition, and competitiveness
quantities. And that requires significant invest-ments in plants and capabilities.
Obstacles also include payments for shelf space and long payment periods. A survey in Zambia revealed that local suppliers perceive their capabilities very differently from the way super-markets perceive them across a range of price and nonprice dimensions. The gaps were widest for volumes, lead times, and processing plant conditions.
Supermarkets may be integrating the region through their investments in transport and logistics but not necessarily in ways that support local pro-ducers. How, then, can supermarkets be partners in regional industrial development so that increased trade is part of building capabilities across coun-tries to move the Southern African region from a net importer of processed food to a net exporter?
POLICY AGENDA
The policy agenda for regional industrialization needs to start from recognizing the realities of markets, competition, and competitiveness across
Southern Africa — including concentration, vertical integration, and market power. In processed food products, large firms have operations extending across the region, linked into global value chains and international production systems.
Those firms are important to realizing econ-omies of scale — an issue is whether the returns are from investing in capabilities or from exerting market power. It is also important to constrain the exertion of market power where it may be used to exclude smaller firms and new entrants.
Concrete policy measures are required for a stepwise change in food production, to address the trade deficit and move toward net exports through industrialization along the value chains. The main recommendations:• Address fertilizer pricing and supply by shutting
down export cartels, opening access to port facilities to a wider range of fertilizer traders, reducing inland logistics costs and collusion in trucking, and investing in local production such as the planned plant using natural gas in Tanzania.
• Set up a market observatory to track the prices of agricultural inputs, commodities, and food
FIGURE 17 Footprint of Shoprite and Pick n Pay, by country, 2016
a. Shoprite b. Pick n Pay
R E G I O N A L D E v E LO P M E N T A N D C O M P E T I T I O N I N F O O D vA L U E C H A I N S 29
Regional markets can be deepened and better integrated by coordinating investment in productive capacity
products so that regional competition author-ities, such as the COMESA Competition Com-mission, can identify cartels and provide infor-mation to farmers to negotiate with traders and other large buyers. Enhanced access to information will also assist potential entrants in identifying market opportunities.
• Build the industrial capabilities of suppliers through development finance, advisory serv-ices, and assistance in meeting standards and certification of agro- processing and food processing companies. This needs to include establishing effective regional industrial policy institutions in these areas, leveraging existing cross- country partnerships.
• Target the competitiveness requirements of specific value chains, and pay attention to the cross- border nature of these value chains. Urgently required in prioritizing interventions is anticipating the changing demand patterns from urbanization and population growth and the potential for import replacements.
• Improve packaging, a key requirement for making processed food products competitive
in urban consumer markets. Centers of excel-lence can provide facilities to food companies to design and specify packaging, especially if packaging companies have incentives to locate plants in food products clusters.
• Provide a regional code of conduct for super-markets, local supplier development commit-ments, advice on packaging and branding, and logistics to strengthen two- way trade. Both Namibia and Zambia are putting in place mea-sures to increase local procurement by super-markets, but a regional code can be developed that is consistent with strengthening regional value chains and with the reality that supermar-kets are integrating the region.Regional markets can be deepened and better
integrated by coordinating investment in productive capacity — from farming through processed food production. This is essential given climate change. The increasing weather variability in the region implies that there may be drought conditions in one area, but good rains in another. Intraregional trade can mitigate the effects on prices, and improve-ments in transport are obviously crucial.

30 R E G I O N A L D E v E LO P M E N T A N D C O M P E T I T I O N I N F O O D vA L U E C H A I N S
REFERENCES
ACET (African Center for Economic Transformation).
2017. African Transformation Report 2017: Agriculture
Powering Africa’s Economic Transformation. Accra,
Ghana.
das Nair, R., M. Nkhonjera, P. Ncube, and F. Ziba. 2017.
“Growth and Development in the Sugar to Confection-
ary value Chain.” CCRED Working Paper 2017/16,
Centre for Competition, Regulation and Economic De-
velopment, Johannesburg, South Africa.
das Nair, R., and S. Chisoro-Dube. 2016. “The Expansion
of Regional Supermarket Chains and Implications for
Local Suppliers: A Comparison of Findings from South
Africa, Botswana, Zambia and Zimbabwe.” WIDER
Working Paper 2016/169, United Nations University–
World Institute for Development Economics Research,
Helsinki, Finland.
———. 2017. “The Expansion of Regional Supermarket
Chains: Implications on Suppliers in Botswana and
South Africa.” WIDER Working Paper 2017/26, Unit-
ed Nations University–World Institute for Development
Economics Research, Helsinki, Finland.
Gnutzmann, H., and P. Spiewanowski. 2014. “Did the Fer-
tilizer Cartel Cause the Food Crisis?” Working Paper
14–03, Institute of Economics of the Polish Academy
of Sciences, Warsaw, Poland.
Greenberg, S. 2017. “Corporate Power in the Agro-food
System and the Consumer Food Environment in South
Africa.” Journal of Peasant Studies 44 (2): 467–496.
Hernandez, M., and M. Torero. 2013. “Market Concen-
tration and Pricing Behavior in the Fertilizer Industry:
A Global Approach.” Agricultural Economics 44 (6):
723–734.
Jenny, F. 2012. “Export Cartels in Primary Products: The
Potash Case in Perspective.” In Trade, Competition
and the Pricing of Commodities, ed. S. Evenett and F.
Jenny. London: Centre for Economic Policy Research.
Makhaya, G., and S. Roberts. 2013. “Expectations and
Outcomes: Considering Competition and Corporate
Power in South Africa under Democracy.” Review of
African Political Economy 138: 556–571.
Nakamura, S., R. Harati, S. Lall, Y. Dikhanov, N. Hama-
deh, W. Oliver, M. Rissanen, and M. Yamanaka. 2016.
“Is Living in African Cities Expensive?” Policy Research
Working Paper 7641, World Bank, Washington, DC.
Ncube, P., S. Roberts, P. Samboko, and T. Zengeni. 2017.
“Identifying Growth Opportunities in the Southern Afri-
can Development Community through Regional value
Chains: The Case of the Animal Feed to Poultry value
Chain.” WIDER Working Paper 2017/4, United Na-
tions University–World Institute for Development Eco-
nomics Research, Helsinki, Finland.
Ncube, P., S. Roberts, and T. vilakazi. 2015. “Study of
Competition in the Road Freight Sector in the SADC
Region: A Case Study of Fertilizer Transport and Trad-
ing in Zambia, Tanzania and Malawi.” CCRED Working
Paper 2015/3, Centre for Competition, Regulation and
Economic Development, Johannesburg, South Africa.
———. 2016. “Regulation and Rivalry in Transport and
Supply of Fertilizer Industry in Malawi, Tanzania and
Zambia.” In Competition in Africa: Insights from Key
Industries, ed. S. Roberts. Cape Town, South Africa:
HSRC Press.
NOTES
1. Angola, Botswana, Lesotho, Madagascar, Malawi,
Mauritius, Mozambique, Namibia, South Africa,
Swaziland, Zambia, and Zimbabwe.
2. Paremoer 2017.
3. Nakamura et al. 2016.
4. ACET 2017; Suttie and Benfica 2016.
5. Greenberg 2017.
6. Makhaya and Roberts 2013.
7. ACET 2017.
8. Paremoer 2017.
9. This section draws primarily from Ncube, Roberts, and
vilakazi (2015 and 2016), unless otherwise indicated.
10. ACET 2017.
11. World Bank 2016.
12. Jenny 2012; Gnutzmann and Spiewanowski 2014.
13. World Bank 2016.
14. Gnutzmann and Spiewanowski 2014; Hernandez
and Torero 2013.
15. Ncube et al. 2017.
16. Ncube et al. 2017.
17. Ncube, Roberts, and vilakazi 2016; Ncube, Roberts,
and Zengeni 2016.
18. Unless otherwise indicated, this section draws from
das Nair and Chisoro (2016 and 2017); das Nair
et al. (2017); Ziba and Phiri (2017).
19. Tschirley et al. 2015.

R E G I O N A L D E v E LO P M E N T A N D C O M P E T I T I O N I N F O O D vA L U E C H A I N S 31
Ncube, P., S. Roberts, and T. Zengeni. 2016. “The De-
velopment of the Animal Feed to Poultry value Chain
across Botswana, South Africa, Zambia and Zimbab-
we.” WIDER Working Paper 2016/2, United Nations
University–World Institute for Development Economics
Research, Helsinki, Finland.
Paremoer, T. 2017. “Regional value Chains, Industriali-
sation, and Climate Change: Exploring Linkages and
Opportunities in the Agro-Processing Sector across
Five SADC Countries.” Working Paper, United Nations
Conference on Trade and Development, Geneva.
Suttie, D., and R. Benfica. 2016. “Fostering Inclusive Out-
comes in Sub- Saharan African Agriculture: Improving
Agricultural Productivity and Expanding Agribusiness
Opportunities.” IFAD Research Series 03, International
Fund for Agricultural Development, Rome.
Tschirley, D., T. Reardon, M. Dolislager, and J. Snyder.
2015. “The Rise of a Middle Class in East and South-
ern Africa: Implications for Food System Transforma-
tion.” Journal of International Development 27 (5):
628–646.
WDI (World Development Indicators). 2017. World Devel-
opment Indicators [database]. Washington, DC: World
Bank. Available at: wdi.worldbank.org.
World Bank. 2016. Breaking Down Barriers: Unlocking Af-
rica’s Potential through Vigorous Competition Policy.
Washington, DC.
Ziba, F., and M. Phiri. 2017. “The Expansion of Regional
Supermarket Chains: Implications for Local Suppli-
ers: The Case for Zambia.” WIDER Working Paper
2017/58, United Nations University–World Institute for
Development Economics Research, Helsinki, Finland.


The economic outlook for the Southern Africa region is cautious. Broad- based
economic activity is expected to recover at a slow pace, but the outlook
remains modest, given the diverging growth patterns for the region’s
economies. Upper middle- income countries turned in low and declining
rates of growth. Meanwhile, lower income transitioning economies
recorded moderate and improved growth, albeit at reduced rates.
Despite the improvement, economic performance remains below the
regional target of 7 percent annual economic growth for all member
states. The region’s economic outlook continues to face major
headwinds: high unemployment, fiscal strain, increasing debt, and
high inflation.
Real GDP is estimated to have grown at an average of 1.6 percent
for 2017, before increasing to a projected 2.0 percent in 2018.
Future regional growth is bolstered primarily by expectations
of increased investment in non- oil sectors such as electricity,
construction, and technology, in large infrastructure
projects, and in mining, as well as a con tinued recovery of
commodity prices.
Net commodity exporters and low- income economies,
generally, are outperforming their larger net
manufacturing exporter counterparts. The decline
in commodity prices in recent years, reaching their
lowest point in 2015, translated into significant
income losses for these economies, implying
negative impacts on public and private sector
spending, and therefore growth and employment.
African Development Bank GroupAvenue Joseph Anoma01 BP 1387 Abidjan 01
Côte d’Ivoirewww.afdb.org