southern california association of governments freight transportation: emerging issues for southern...
TRANSCRIPT

Southern California Association of Governments

Freight Transportation:Freight Transportation:Emerging Issues for Southern CaliforniaEmerging Issues for Southern California
Alan BowserAlan Bowser
Goods Movement PlanningWorkshopGoods Movement PlanningWorkshop
Detroit, MichiganDetroit, Michigan
July 10-12, 2001July 10-12, 2001


2025 Forecast for Population & Employment Growth (Millions)
1997 2025 Increase
Population 16.1 23.0 43%
Employment 7.0 10.0
44%
“Like adding two Chicago's toSouthern California”

SCAG’S regional domestic product is $438 billion, which would make it the world’s 12 largest economy, just following Canada

“The RTP Balancing Act”
MOBILITY
Growth and RTP Projects and Programs
Performance Measures (Air
Quality Mandate)
Constrained Funding
(Financial Mandate)

Goods Movement System
Purpose is to improve efficiency of all modes (truck, rail freight, marine shipping, and air cargo) and all cargo types (domestic import/export, containerized, break-bulk and bulk).
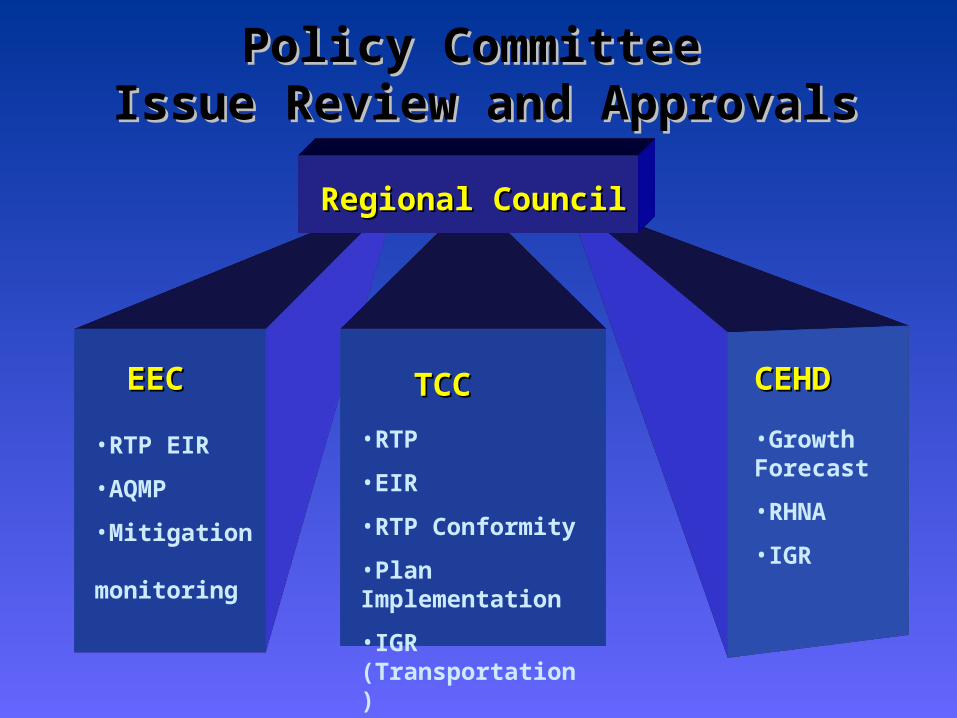
Policy Committee Policy Committee Issue Review and ApprovalsIssue Review and Approvals
EECEEC TCCTCC CEHDCEHD
Regional CouncilRegional Council
•RTP EIR
•AQMP
•Mitigation monitoring
•RTP
•EIR
•RTP Conformity
•Plan Implementation
•IGR (Transportation)
•Growth Forecast
•RHNA
•IGR

2001 RTP UPDATE
TCC
RTP Task ForcesRTP Task Forces
Long Range
Finance
RTPTAC Aviation
TruckLanes
High SpeedRail/
MAGLEV
RegionalTransit
TransitCorridors
GoodsMovement
FourCorners
Growth

SCAG Committee & Task Force Planning Process
Goods Movement Advisory Committee
Mission: “The Goods Movement Advisory Committee will
advise the Regional Council on the conditions prevailing in
moving goods in Southern California; on establishing
appropriate transportation, infrastructure, air quality and
environmentally sound land use policies; and propose
programs and priorities to ensure the safe, efficient and
economical movement of goods within the region and its
competitive advantage in international trade.

SCAG Committee & Task Force Goods Movement Planning Process
GMAC (con’t)
... responsible for guiding SCAG in the development of an
understanding of the freight transportation issues and needs
of the region, and will work interactively with SCAG staff to
fulfill its charge. The Committee will meet periodically to
review the progress of SCAG work, and may establish sub-
committees at its discretion to focus on particular concerns.
It will seek to reflect the diverse interests of the region, the
public and private needs, and the goals of the Regional
Comprehensive Plan and Guide.”

SCAG Committee & Task Force Goods Movement Planning Process
GMAC (con’t)
Membership Includes:
- Elected/Appointed Officials - Local Gov’t Staff
- Caltrans - Federal DOT Agencies
- Private Companies - railroads, truckers steamship lines, air cargo operations, package express operators
- Representatives of Seaports, Airports, Environmental Groups, law enforcement agencies, local neighborhood groups consultants
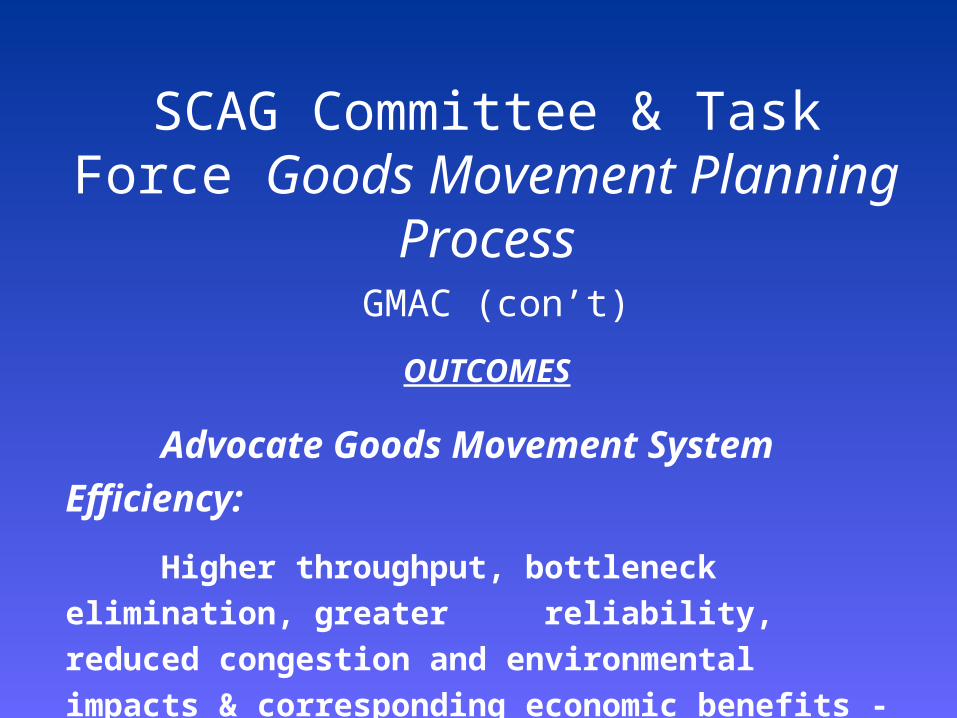
SCAG Committee & Task Force Goods Movement Planning Process
GMAC (con’t)
OUTCOMES
Advocate Goods Movement System Efficiency:
Higher throughput, bottleneck elimination, greater
reliability, reduced congestion and environmental
impacts & corresponding economic benefits - region,
state, nation.

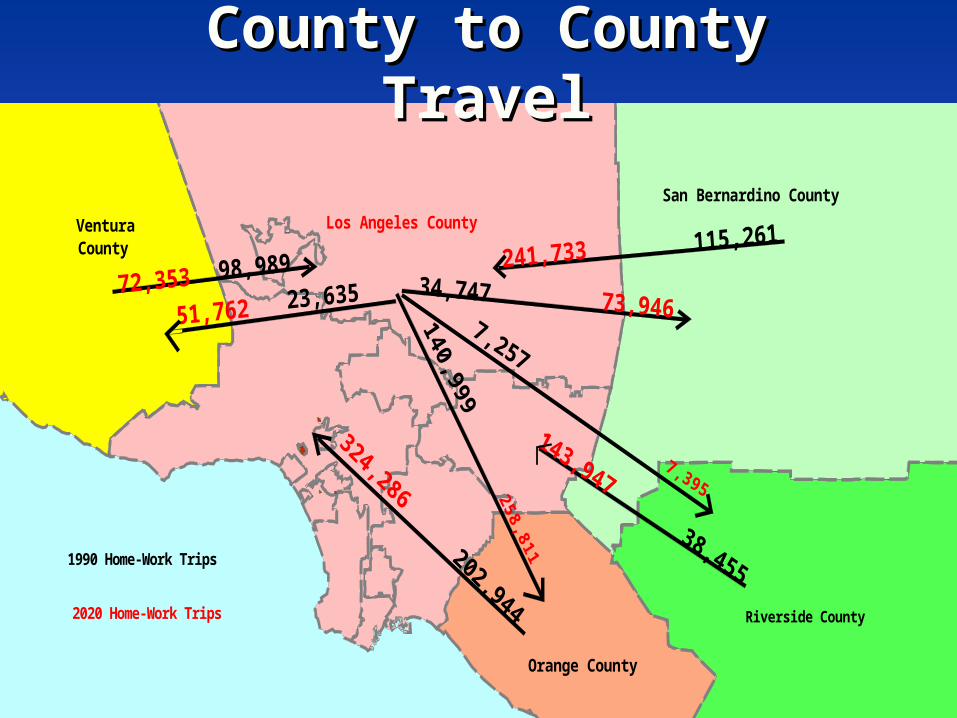
Los Angeles CountySan Bernardino County
Orange County
VenturaCounty
1990 Home-Work Trips
2020 Home-Work Trips Riverside County
County to County TravelCounty to County Travel


SCAG’s Travel Demand Model Improvment
Trip Generation Model Trip Distribution Model Mode Choice Model
New Traffic Analysis Zones Other improvements
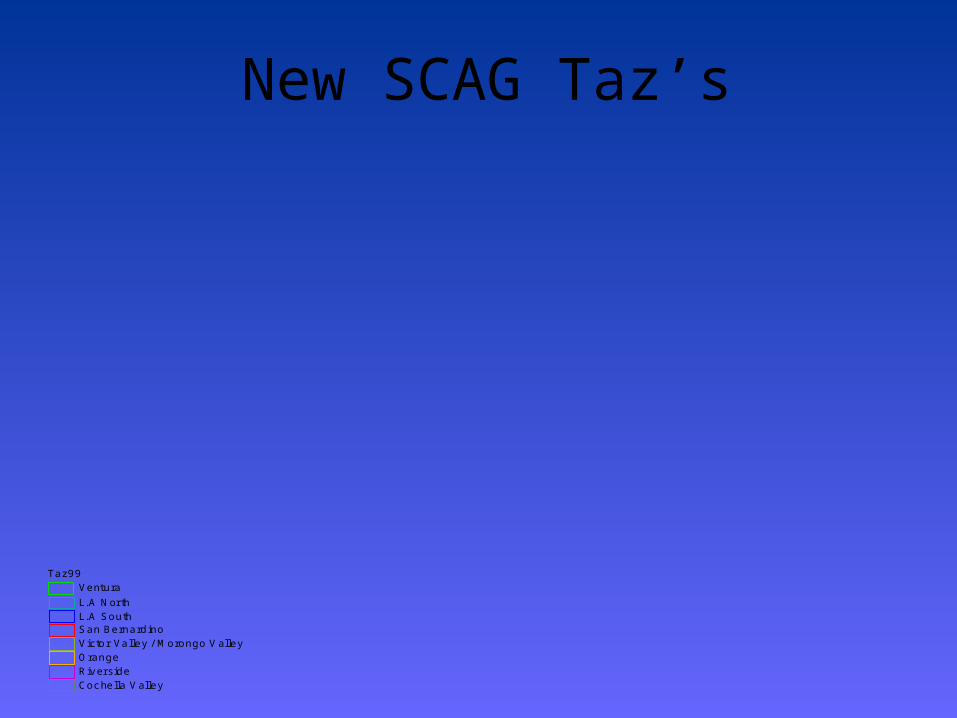
Taz99VenturaL.A NorthL.A SouthSan BernardinoVictor Valley / Morongo ValleyOrangeRiversideCochella Valley
New SCAG Taz’s

Heavy Duty Truck Model
• Developed and incorporated the Heavy Duty Truck Model into SCAG’s new travel demand model.

40
5
15
10
210
15
405
10
5
605
215
110
13280105
710
30440
32 28 0
10 3616 027360
1232
0
40
16900
48380
28120
1846085
480
31360
14060
22400
145 4
0
6312
0
26080
3762
0
63600
4726047340
39 56042580
28260
18140 41740
23560
19240
24 000
13920
6620
0
Kern
Victorville
San Bernardino
Palm Springs
Riverside
Burbank
PasadenaOxnard
Santa Clarita
Los Angeles
Torrance
Barstow
Temecula
Palmdale
Thousand Oaks
Santa Ana
Long Beach
Newport Beach
Simi Valley
Corona
Ontario
Anaheim
Irvine
Ventura
Los Angeles San Bernardino
RiversideOrange1995 Daily Truck Volumes0 to 18,00018,000 to 24,00024,000 to 40,00040,000 to 90,000
Other
1995 Daily Truck Volumes


SCAG 1995 & 2020SCAG 1995 & 2020Freight Mode ShareFreight Mode Share
(Million Tons)(Million Tons)
1995 2020 Increase
Rail 91 309 240%
Truck 319 527 65%
Air 3 8.9 197%

Goods Movement Issues
Options
• How do we meet the future demand of goods traffic on the region’s roads, railroads, and airports?
• How do we fund improvements in an efficient and equitable manner?
• Build dedicated truck lanes on I-710, I-15, SR-60• Evaluate the regional grade crossing system• Study the costs of converting the truck fleet to
alternative fuels; develop incentives• Promote cargo airports on closed military bases and
in the Inland Empire
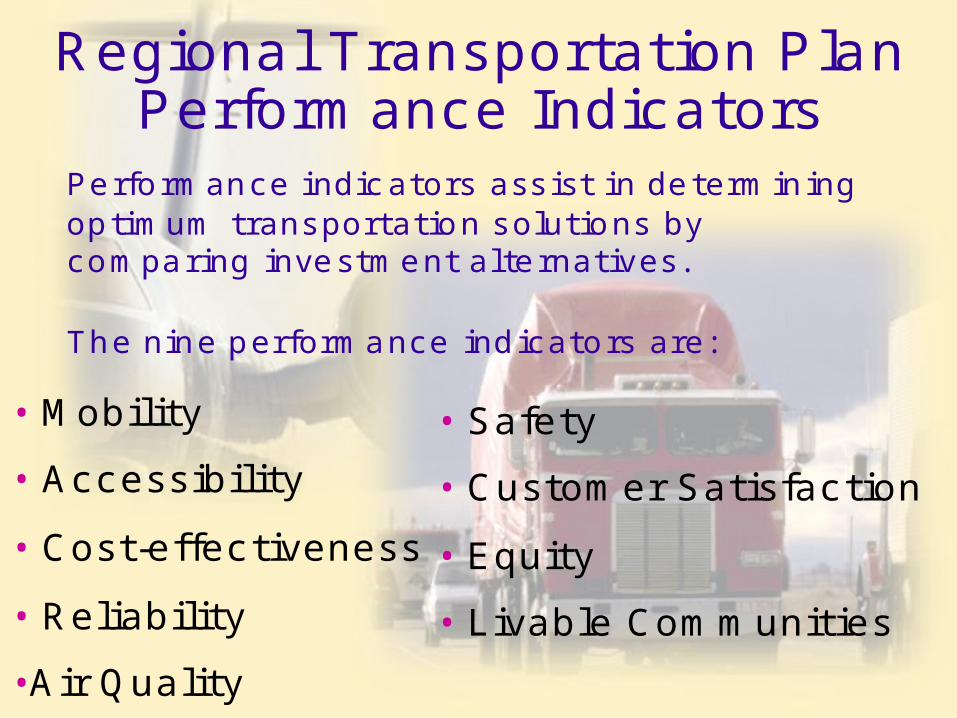
Regional Transportation P lanPerformance Indicators
Performance indic ators ass ist in determiningoptimum transportation solutions bycomparing investment al ternatives.
The nine performance indicators are:
• Mobility
• Accessibility
• Cost-effectiveness
• Reliability
•Air Quality
• Safety
• Customer Satisfaction
• Equity
• Livable Communities

8.2 9.1
12.5
17.4
24.3
0
5
10
15
20
25
30
ACTUAL1999
2005 2010 2015 2020
TE
U (
Mil
lio
ns)
Container GrowthContainer Growth(Ports of Los Angeles and Long Beach)(Ports of Los Angeles and Long Beach)

1.8
0.8
3.2
1.6
4.0
2.3
4.6
2.9
5.3
3.6
0.0
1.0
2.0
3.0
4.0
5.0
6.0
7.0
8.0
9.0
Mill
ion
To
ns
1996 2005 2010 2015 2020
Years
Domestic
International
SCAG Air Cargo ProjectionsSCAG Air Cargo Projections

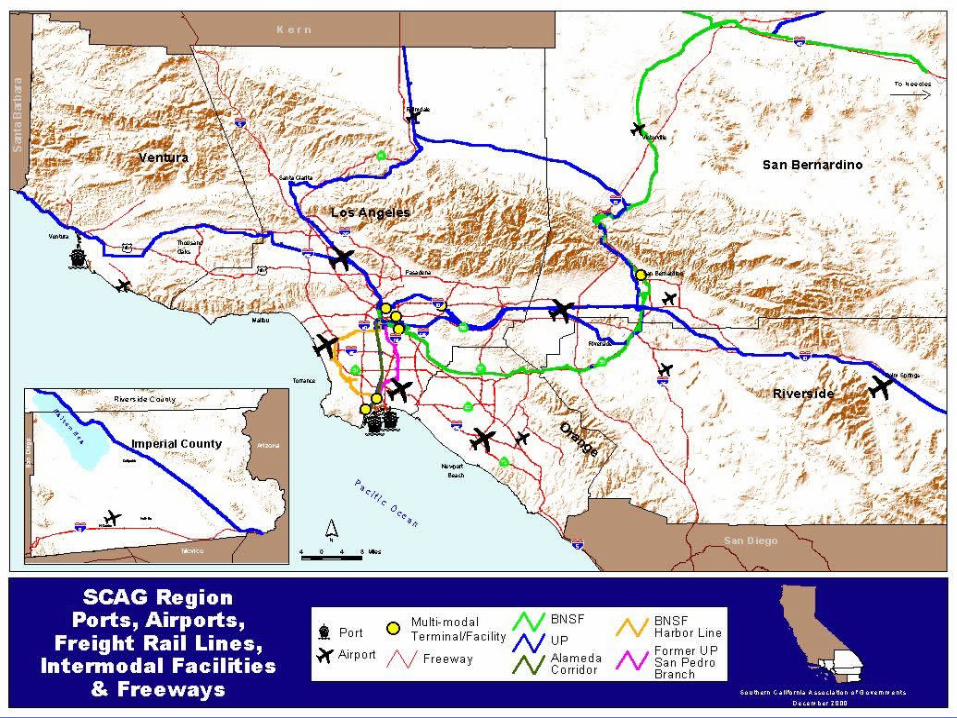
Major Infrastructure ComponentsMajor Infrastructure Components
• Alameda Corridor / East
• Orangethorpe Corridor
• Other railway grade crossing improvements
• Exclusive Truck Lanes
• Inter-modal facilities
• Freight throughput productivity enhancement
• Air cargo distribution


Funding IssuesFunding Issues• Lack of funding for freight throughput
enhancement
• Lack of funding for freight movement mitigation
• Difficulty in selecting projects between freight and people movement
• Freight factors
• Traditional funding limitations between truck and rail infrastructure
• Within-the-fence mentality
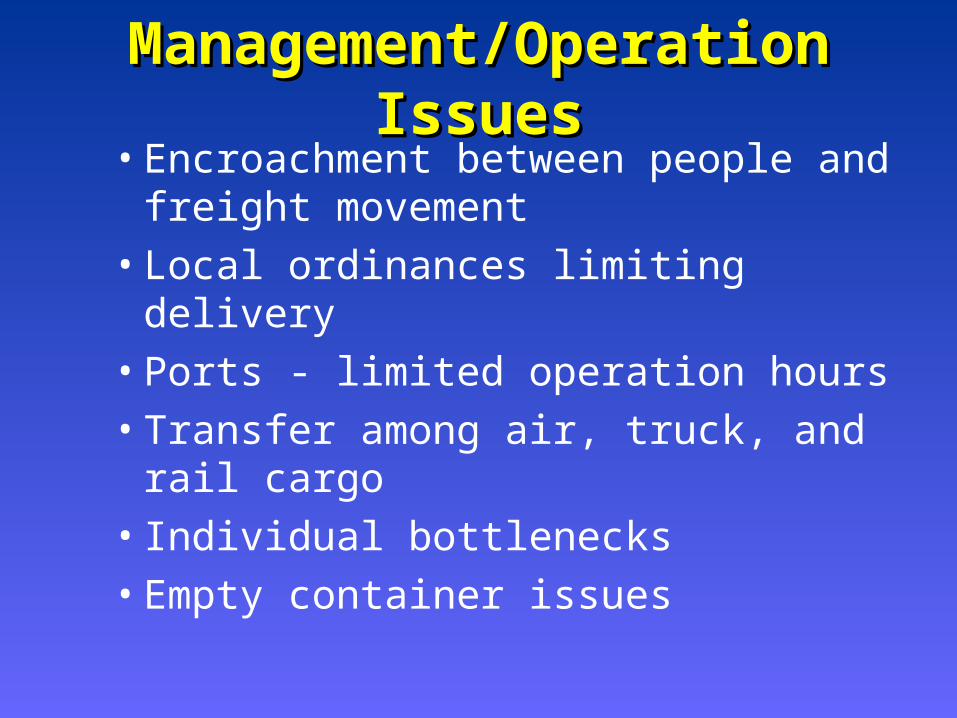
Management/Operation IssuesManagement/Operation Issues• Encroachment between people and
freight movement
• Local ordinances limiting delivery
• Ports - limited operation hours
• Transfer among air, truck, and rail cargo
• Individual bottlenecks
• Empty container issues
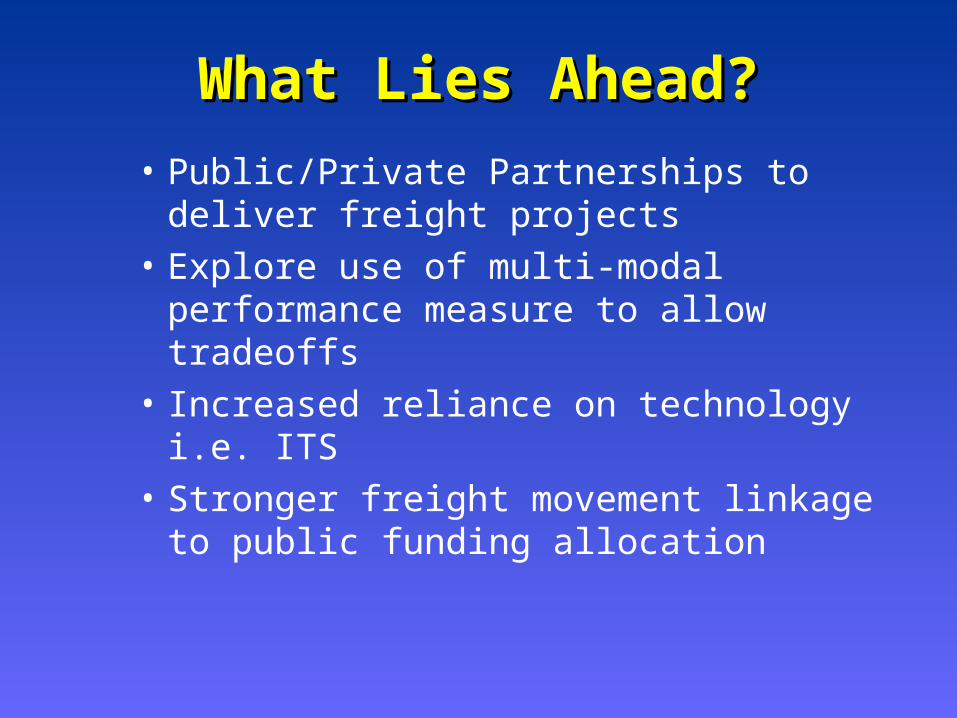
What Lies Ahead?What Lies Ahead?
• Public/Private Partnerships to deliver freight projects
• Explore use of multi-modal performance measure to allow tradeoffs
• Increased reliance on technology i.e. ITS
• Stronger freight movement linkage to public funding allocation

Southern California Association of Governments