southern copper overview and highlights · 1 copper contained in reserves based on us$1.20 per...
TRANSCRIPT

SOUTHERN COPPER
Overview and Highlights
May, 2008

Safe Harbor Statement
This presentation contains ‘‘forward-looking statements,’’ as defined by federal securities laws, withrespect to our financial condition, results of operations and business, and our expectations or beliefsconcerning future events. These statements include words such as, but not limited to, ‘‘expect,’’‘‘anticipate,’’ ‘‘believe,’’ ‘‘intend,’’ ‘‘plan,’’ ‘‘seek,’’ ‘‘forecast,’’ ‘‘estimate,’’ ‘‘continue,’’ ‘‘may,’’ ‘‘will,’’‘‘would,’’ ‘‘could,’’ ‘‘likely,’’ and similar expressions. These forward-looking statements reflectmanagement’s current expectations and assumptions regarding future events and operating andmanagement s current expectations and assumptions regarding future events and operating andfinancial performance and are based on currently available information. However, actual results aresubject to risks and uncertainties, which could cause actual results to differ materially from thosecontained in the forward-looking statements.
Many risks and uncertainties are inherent in the copper industry. Others are more specific to ouroperations. Additional information about risks and uncertainties that could affect our future resultsare contained in our SEC filings, including our reports on Forms 8-K, 10-Q, and 10-K and aregistration statement on Form S-3 relating to our proposed public offering of common stockregistration statement on Form S-3 relating to our proposed public offering of common stock.
1

I. Introduction

Management Presenters
Presenters TitleGenaro Guerrero
Raúl Jacob
Executive VP and CFO
Manager of Financial Planning & IR
3

Corporate Structure
75.1%
Public Float
24.9%
99.29 % 99.95 %
SCC Peru Branch Minera México
4
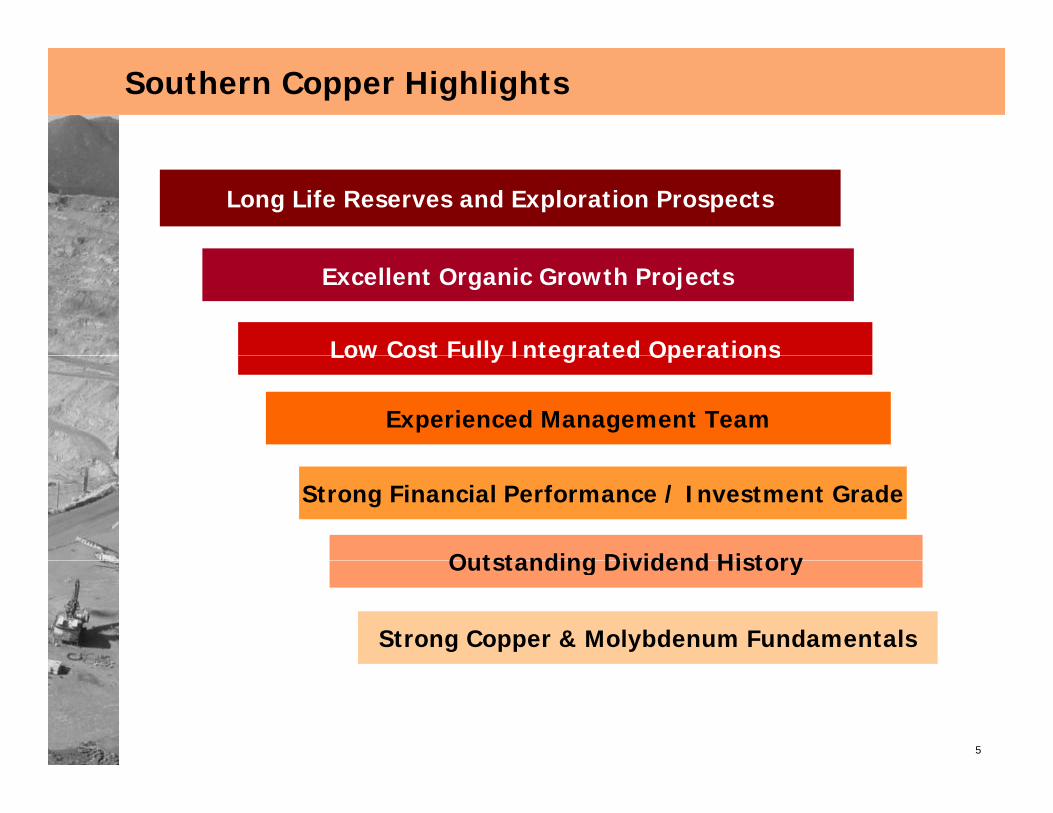
Southern Copper Highlights
Long Life Reserves and Exploration Prospects
Excellent Organic Growth Projects
Low Cost Fully Integrated OperationsLow Cost Fully Integrated Operations
Experienced Management Team
Outstanding Dividend History
Strong Financial Performance / Investment Grade
Outstanding Dividend History
Strong Copper & Molybdenum Fundamentals
5

Southern Copper Business Strategy
L ld l d l tiLeverage our world-class reserves and exploration
prospects
– Develop portfolio of value enhancing projects
Low cost, pure copper play
– Strategic investments focused on cost reduction
– Increase copper production, reserves and continue exploration
Investment grade capital structure with focus on cash flow
generationgeneration
– Return excess capital to investors
St k h d t k i ti
6
– Stock repurchase program and stock appreciation

Copper Price Trends
Strong underlying fundamentals with potential to change the long-term g y g p g gaverage of copper prices
Real Copper Price Trends (US producer) (in US$1998)
1900—1933 1934—1973 1974—2002 Today1
$ $ $ $Technological advances
Economies of scale reduce unit costs and real prices
Construction programs after WWII
US consumer boom
Substitution/conservation reduce Cu consumption
Shift from manufacturing to service economies
Increased demanddriven by China and emerging nations
Low inventories
Average: US$2.13/lb Average: US$1.61/lb Average: US$1.36/lb Current Price: US$3.54
real prices Industrialization of Japan led to rising real prices
to service economies
Processing efficiency lowers costs
Low inventories
Supply disruptions
New projects: Low ore grades and delays
$3 00
$3.50
$4.00
$4.50
$1.50
$2.00
$2.50
$3.00
US$
/lb
$0.00
$0.50
$1.00
1900 1907 1914 1921 1928 1935 1942 1949 1956 1963 1970 1977 1984 1991 1998 2005
33 years 40 years 29 years
2006 2007 2008
7
Source: USGS, Thomson Financial DatastreamNote:1 Average as of March 31st, 2008

II. Overview of Operations
i
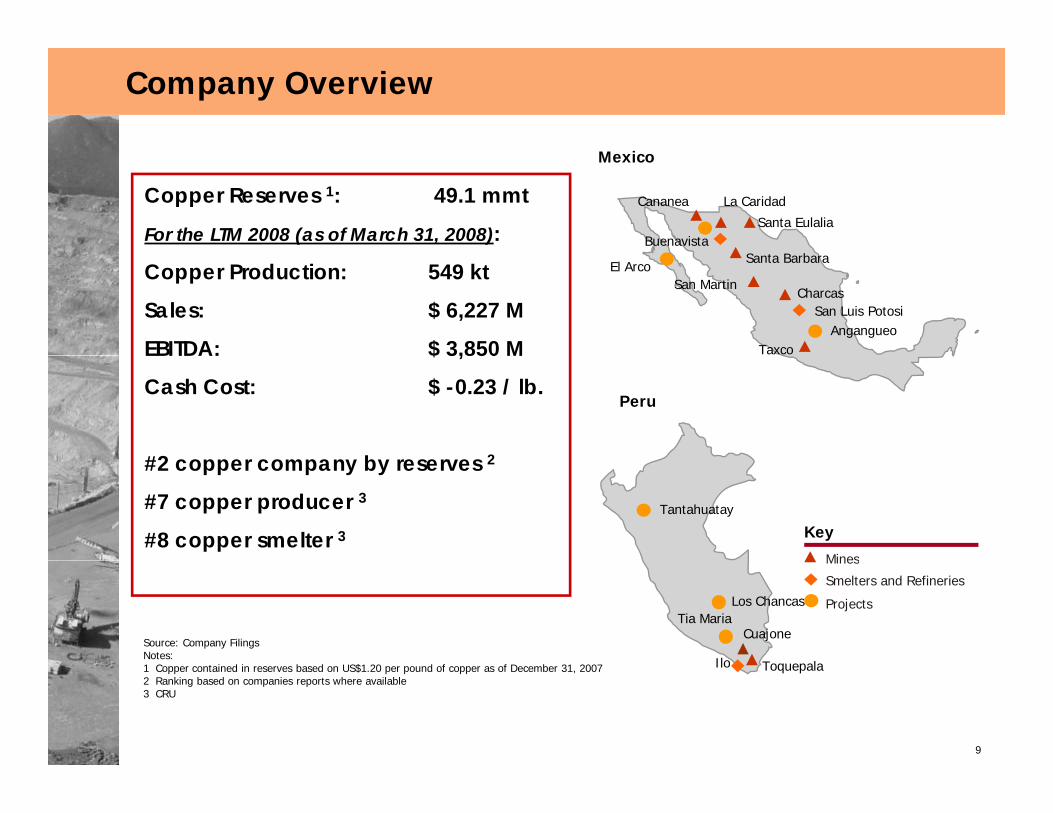
Company Overview
Mexico
La Caridad
S b
Santa Eulalia
Cananea
Buenavista
Copper Reserves 1: 49.1 mmt
For the LTM 2008 (as of March 31, 2008):Santa Barbara
Charcas
Taxco
San Luis Potosi
El Arco
Angangueo
Copper Production: 549 kt
Sales: $ 6,227 M
EBITDA: $ 3,850 M
San Martin
Peru
EBITDA: $ 3,850 M
Cash Cost: $ -0.23 / lb.
#2 b 2
Mines
Key
#2 copper company by reserves 2
#7 copper producer 3
#8 copper smelter 3Tantahuatay
Ilo
Cuajone
T l
Los Chancas
Mines
Smelters and Refineries
ProjectsTia Maria
Source: Company FilingsNotes:
9
Ilo Toquepala1 Copper contained in reserves based on US$1.20 per pound of copper as of December 31, 20072 Ranking based on companies reports where available3 CRU

SCC MinesTotal copper production in 2007 amounted to 592 kt
Copper production 1: 99 kt
– 17% of total
Copper production 1: 125 kt
– 21% of total
Cananea — Mexico La Caridad — Mexico
– 35% SX-EW 2, 65% mill 3
Reserves 4: 19 Mt
– 39% of totalSilver production: 0.8 M Oz
– 18% SX-EW 2, 82% mill 3
Reserves 4: 5.2 Mt
– 10% of totalMolybdenum production: 6.2 ktp
Gold production: 6.9 k Oz
y p
Silver production: 1.9 M Oz
Gold production: 4.2 k Oz
Toquepala PeruCuajone Peru
Copper production 1: 182 kt
– 31% of total– 100% mill 3
Copper production 1: 178 kt
– 30% of total– 21% SX-EW 2, 79% mill 3
Toquepala — PeruCuajone — Peru
Reserves 4: 9.1 Mt
– 18% of totalMolybdenum production: 3.8 kt
Silver production: 2 2 M Oz
,Reserves 4: 15.7 Mt
– 32% of totalMolybdenum production: 6.2 kt
Silver production: 2 0 M Oz
10
Silver production: 2.2 M Oz
Gold production: 4.9 k Oz
Silver production: 2.0 M Oz
Gold production: 2.4 k OzSource: SCC1 Production includes copper in concentrate and SX-EW cathodes2 Solvent Extraction / Electrowinning process3 Mill: A plant in which ore is treated and metals are recovered or prepared for smelting4 Copper price of $1.20 / lb used to calculate reserves

SCC Metallurgical Complexes Three main metallurgical complexes
Caridad – Mexico Ilo – Peru
Copper Smelter
Electrolytic Copper Refinery
Copper Smelter
Copper Refineryy pp y
Precious Metal Refinery
Rod Plant
Sulfuric Acid Plant
pp y
Precious Metals Refinery
Sulfuric Acid Plant
San Luis Potosi – Mexico
Total copper smelting capacity:
– 2,200 kt per year in concentrate feed, standard equivalent of 640 thousandSan Luis Potosi – Mexico
Electrolytic Zinc Refinery
Copper Smelter
Sulfuric Acid Plant
standard equivalent of 640 thousand tons of contained copper
Total copper refinery capacity:
– 580 kt per year in refined cathode
l i l fi iSulfuric Acid Plant Total precious metals refinery capacity:
– Silver: 19.4 M oz
– Gold : 117 K oz
Total zinc refinery capacity:
11
Total zinc refinery capacity:
– 105 kt per year in refined zinc
Total sulfuric acid capacity:
– 2,796 kt per year

Long Life Reserves
First largest copper reserves of any publicly traded companyg pp y p y p y
Copper Reserves SCC Copper Reserves Sensitivity
42.1
49.150.3
40
50
60
rves
(Mt)
69.9
6070
rves
(Mt)
42%
8.710.2
16.517.322.9
25.6
10
20
30
Cop
per R
eser 49.1
38.2
102030405060
er C
onta
ined
in re
ser
29%
2006
2007
SEC
Source: SCCSourc Annual Rep 10K 10K 20F Annual Rep 20F Reserve Rep Annual Rep Annual Rep
0
Cod
elco
SC
C
FCX
BH
P B
illito
n
Ang
loA
mer
ican
Rio
Tin
to
Xst
rata
Ant
ofag
asta
CV
RD
-Inco
010
0.90 1.20 2.664Copper prices ($/lb)
Cop
pe
Source: SCCSourc Annual Rep. 10K 10K 20F Annual Rep. 20F Reserve Rep. Annual Rep. Annual Rep.
Period 06/12/31 07/12/31 07/12/31 07/06/30 07/12/31 07/12/31 07/06/30 07/12/31 06/12/31
Cu Price N/A $1.20 $1.20 $2.00 N/A $2.31 N/A N/A N/A
12

Low Cost of Operations
SCC’s cash cost is in the bottom quartile of global copper producers
0.6
Low Cost Drivers
q g pp p
Net Operating Cash Costs (1)
High quality reservesStrong by-product credits (1)
-0.17
0.160.03
0.18
0.44
0
0.2
0.4
(US$
/lb)
Strong by product credits – molybdenum (18% of revenues) – zinc (6% of revenues)– silver (4% of revenues)– gold & others (3% of revenues)
-0.23
-0.4
-0.22003 2004 2005 2006 2007 LTM 2008
g ( )Significant low cost SX-EW production (2)
– 94 kt or 12% of copper production in 2007Large scale minesManagement focus on cost efficiencyCash Cost per Pound Produced, excluding
By-Product Credits Cost by Elements (1)
Other11%
Operating Materials
16%1.28
1.481.40
1 01
1.50
1.80
Maintenance17%
Labor
Fuel13%
1.010.85
0.74
0.00
0.30
0.60
0.90
1.20
(US
$/lb
)
13
Source: Southern Copper Notes: (1) Includes by-product credits.
Notes:(1) LTM as of March 31, 2008(2) Solvent Extraction / Electrowinning process.
Labor16% Energy
27%
2003 2004 2005 2006 2007 LTM 2008

Geographic and Product Diversification
SCC has broad geographic and product diversification
2007 SCC Revenue by Product
g g p p
2007 SCC Revenue by Market
Zinc6%
Silver4%
Other3%
Peru2%
Asia9% Latin America
19%
Molybdenum18%
Europe24%
United StatesCopper
69%
Mexico20%
United States26%
14

Experienced Management Team
SCC’s team has an average of 30 years experience with the Companyg y p p y
As a result of the SCC–MM merger, the management teams of both companies have been
seamlessly integratedGermán Larrea
Chairman of the BoardChairman of the Board
Oscar González RochaCEO SCC &
President - Peru
Xavier García de Quevedo
Genaro Guerrero
VP-Finance (CFO)
Vidal Muhech
VP - Environmental
Armando Ortega
General Counsel
Mario Vinageras
VP - Commercial
Gabino Paez
VP - Human Resources
QCOO SCC &
President - Mexico
SCC is fully compliant with the Sarbanes-Oxley Act
Strong corporate governance provisions
– one class of shares
( )
– one class of shares
– pro-rata number of independent directors (4 of 13)
– Special Nominating Committee for independent directors
– Audit Committee for independent accountants, and to review internal audit procedures,
15
accounting and financial controls
– independent director oversight of any potential related party transactions
– Compensation and stock incentive plan committees
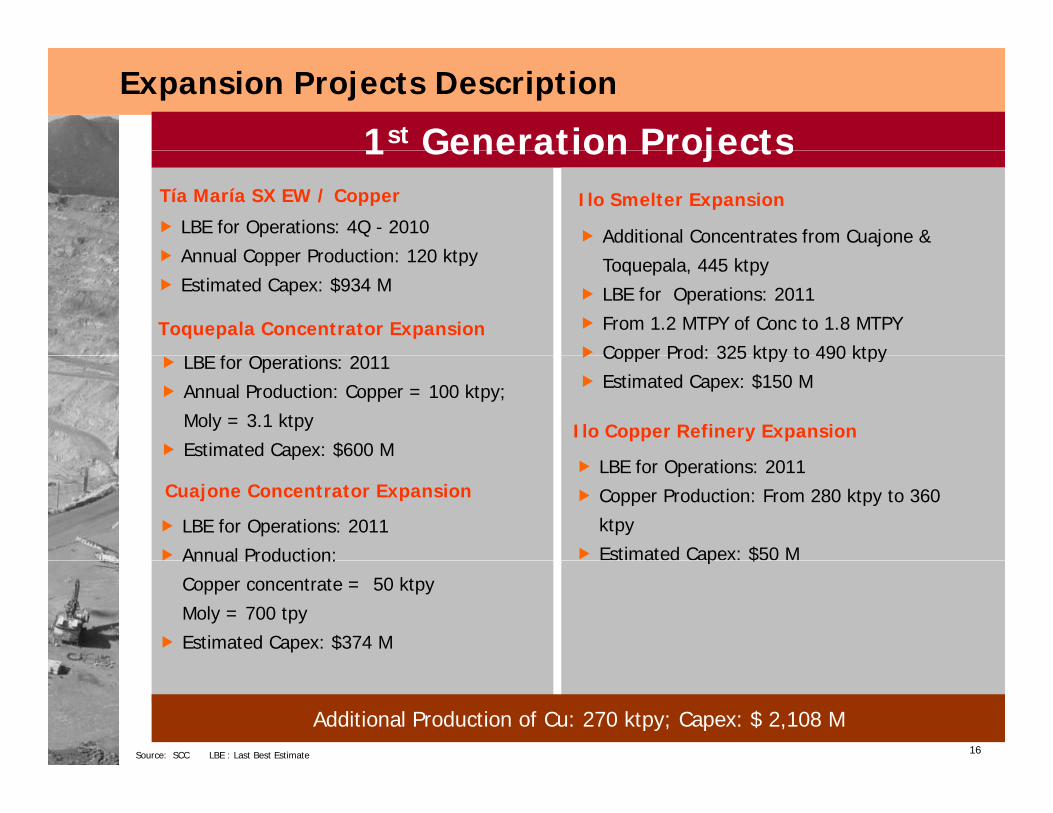
Expansion Projects Description
1st Generation Projects1 Generation Projects
LBE for Operations: 4Q - 2010
Annual Copper Production: 120 ktpy
Tía María SX EW / Copper Ilo Smelter Expansion
Additional Concentrates from Cuajone & Annual Copper Production: 120 ktpy
Estimated Capex: $934 M
Toquepala Concentrator Expansion
LBE f O i 2011
Toquepala, 445 ktpy
LBE for Operations: 2011
From 1.2 MTPY of Conc to 1.8 MTPY
Copper Prod: 325 ktpy to 490 ktpyLBE for Operations: 2011
Annual Production: Copper = 100 ktpy;
Moly = 3.1 ktpy
Estimated Capex: $600 M
Copper Prod: 325 ktpy to 490 ktpy
Estimated Capex: $150 M
Ilo Copper Refinery Expansionp $
LBE for Operations: 2011
Copper Production: From 280 ktpy to 360
ktpy
Estimated Capex: $50 M LBE for Operations: 2011
Annual Production:
Cuajone Concentrator Expansion
p $Annual Production:
Copper concentrate = 50 ktpy
Moly = 700 tpy
Estimated Capex: $374 M
16Source: SCC LBE : Last Best Estimate
Additional Production of Cu: 270 ktpy; Capex: $ 2,108 M

III. Financial Overview

Financial Summary
(US$ MM) 2003 2004 2005 2006 2007 LTM 20084(US$ MM) 2003 2004 2005 2006 2007 LTM 20084
Copper Price (LME) US$ per pound 0.81 1.30 1.67 3.05 3.23 3.44Income Statement:Net Revenues $1,577 $3,097 $4,089 $5,460 $6,086 $6,227COGS 992 1,334 1,635 2,020 2,122 2,176Gross Margin 584 1,762 2,454 3,440 3,964 4,050G g 58 ,76 , 5 3, 0 3,96 ,050SG&A 64 72 81 88 98 99EBITDA 493 1,702 2,335 3,316 3,766 3,850EBITDA Margin 31% 55% 57% 61% 62% 62%EBIT 326 1,482 2,071 3,054 3,497 3,575Interest Expense 117 106 109 113 123 122Net Income 84 982 1,400 2,038 2,216 2,230Balance Sheet Statement:Cash & Equivalents $352 $710 $876 $1,023 $1,409 $1,473Total Assets 4,491 5,319 5,688 6,376 6,581 6,778Total Debt 1 1,671 1,330 1,172 1,528 1,450 1,450Total Liabilit ies 2,386 2,494 2,349 2,696 2,716 2,760Total Shareholders' Equity 2,023 2,814 3,326 3,667 3,848 4,001Cash Flow Statement:Capital Expenditures 2 $65 $228 $471 $456 $316 $281Free Cash Flow 3 (0.1) 944 1,193 1,604 2,388 2,376( )Key Credit RatiosNet Debt / EBITDA 2.7x 0.4x 0.1x 0.2x 0.01x -0.01XEBITDA / Interest Expense 4.2 16.0 21.4 29.3 30.6 31.6
1 Includes short-term and long-term debt including current portion2 Includes capitalized stripping costs until 2005
18
2 Includes capitalized stripping costs until 20053 Free Cash Flow defined as net cash from operating activities less capital expenditures4 LTM as of March 31, 2008

Solid Financial Performance
Among the highest EBITDA margins and strongest leverage ratios in the g g g g gmetals & mining industry
2007 EBITDA Margin (%) Net Debt/ 2007 EBITDA (x)
62%
72%
SCC
Antofagasta -0.7x
-0.02xSCC
Antofagasta
46%
51%
FCX
BHP Billiton
0.5x
0.4x
AngloAmerican
BHP Billiton
42%
44%
Rio Tinto
Anglo American
1.0x
0.7x
Xstrata
FCX
e ca
39%
41%
Xstrata
CVRD - Inco
3.2x
2.7x
Rio Tinto
CVRD - Inco
19
Source: SCC; Company Reports

Focus on Total Return to Investors
Disciplined approach to creating shareholder value
Current Dividend Yield1 (%) 3-Year Share Price Performance1 (%)
p pp g
3 5%
6.3%
7.6%
Antofagasta
SCC
Anglo American
328%
439%
448%
Xstrata
SCC
CVRD
1.4%
1.7%
3.5%
Freeport
BHP Billiton
Antofagasta
In 2007, SCC paid US$2 Billi
291%
328%
333%
Antofagasta
Rio Tinto
Xstrata
1.3%
1.3%
Rio Tinto
Xstrata
US$2 Billion
US$6.80 per share
218%
242%
BHP Billiton
Freeport
0.5%
0.0% 1.0% 2.0% 3.0% 4.0% 5.0% 6.0% 7.0% 8.0%
CVRD 190%
0% 100% 200% 300% 400% 500%
Anglo American
20
Source: Bloomberg; Company FilingsNote:1 Regular and special dividends declared over last twelve months by record date
divided by current share price as of March 31, 2008 (SCC = US$103.83)1 As of March 31, 2008

Capital Expenditure Forecast (US$M)
$107
$1,200$1,085$1,070
$107
$199
$800
$1,000
$137 $
$333$213
$60
$45
$116
$226
$950 $965
$400
$600$471 $456 $500
$316$137 $121 $112$45$56$40
$143$230
$120 $120 $120
$328$226
$135$380
$127
$120$181
$0
$200$247
$316
2008- 2011 = US$ 2,108 M in First Generation Development
$02005A 2006A 2007A 2008E 2009E 2010E 2011E
All Other Projects
21Source: SCC
$ , p
US$ 480 M in Other Equipment Replacement Investments

SCC Debt Amortization ScheduleMillions of USD as of March 31, 2008
$1 000$1,000
SCC is evaluating the best financing option for its
j tprojects.
$150
$56
$200
$10$10$10 $10 $10$10$56
2008 2009 2010 2011 2012 2013 2015 2028 2035
22
Mitsui Yankee Bonds 10 & 30 year Bonds

SOUTHERN COPPER
Overview and Highlights
May, 2008