southern golden gate estates … planning assistance cooperative study ... southern golden gate...
TRANSCRIPT

SOUTHERN GOLDEN GATE ESTATES
WATERSHED PLANNING ASSISTANCE
COOPERATIVE STUDY
FINAL REPORT OCTOBER 2003
SOUTH FLORIDA WATER MANAGEMENT DISTRICT
BIG CYPRESS BASIN
and
UNITED STATES DEPARTMENT OF AGRICULTURE NATURAL RESOURCES CONSERVATION SERVICE

ACKNOWLEDGEMENTS Input and assistance for the duration of this study was provided by the Interagency Technical Committee for the Southern Golden Gate Estates Watershed Planning Assistance Cooperative Study. The following have served as members of this Committee: Ananta Nath—South Florida Water Management District, Big Cypress Basin Gail Abbott—South Florida Water Management District, Big Cypress Basin Tomma Barnes—South Florida Water Management District, Big Cypress Basin Dr. Michael Duever —South Florida Water Management District, Big Cypress Basin Kent Feng, South Florida Water Management District, Big Cypress Basin Shabbir Ahmed, South Florida Water Management District, Big Cypress Basin Tim Howard, South Florida Water Management District, Big Cypress Basin Andy Potts, South Florida Water Management District, Big Cypress Basin Rosalind Moore—USDA Natural Resources Conservation Service Howard Yamataki—USDA Natural Resources Conservation Service Tony Polizos—USDA Natural Resources Conservation Service Greg Hendricks—USDA Natural Resources Conservation Service Skip Bergmann—U.S. Army Corps of Engineers Capt. Russ Jones—U.S. Army Corps of Engineers Maj. John Chaput—U.S. Army Corps of Engineers Kim Dryden—U.S. Fish & Wildlife Service Betty Grizzle—U.S. Fish & Wildlife Service Terry Doyle—U.S. Fish & Wildlife Service, Ten Thousand Islands National Wildlife Refuge Jim Krakowski—U.S. Fish & Wildlife Service, Florida Panther National Wildlife Refiuge Dr. James Burch—National Park Service, Big Cypress National Preserve Sherry Brandt-Williams—Rookery Bay National Estuarine Research Reserve Dr. Todd Hopkins—Rookery Bay National Estuarine Research Reserve Sonja Durrwachter—Florida Department of Forestry, Picayune Strand State Forest Jim Beever—Florida Fish & Wildlife Conservation Commission David Addison—The Conservancy of Southwest Florida Dr. Michael Savarese—Florida Gulf Coast University Ilene Barnett—Florida Department of Environmental Protection Bruce Boler—Florida Department of Environmental Protection Andy Barienbrock—Florida Department of Environmental Protection Mike Owen—Florida Park Service, Fakahatchee Strand State Preserve Valuable assistance was also provided by Ken Murray, USDA Natural Resources Conservation Service, Gary Lytton, Rookery Bay National Estuarine Research Reserve, and John Kremer, U.S. Army Corps of Engineers. Many thanks are due to the volunteer members of The Conservancy of Southwest Florida and NRCS Earth Team for gathering monitoring well data over the course of this study. This report would not have been possible without the extensive efforts of Jean-Paul Calixte of the USDA Natural Resources Conservation Service in creating GIS databases for the study.

i
Table of Contents INTRODUCTION...........................................................................................................................................1
Purpose of Study ...............................................................................................................................1
Environmental Setting.......................................................................................................................1
Hydrologic Restoration Plan .............................................................................................................3
CHARACTERIZATION OF THE STUDY AREA ........................................................................................7
Land Use ..........................................................................................................................................7
Geology and Soils .............................................................................................................................7
Plant Communities ..........................................................................................................................11
The Watershed ................................................................................................................................13
Regional Flow Patterns ...................................................................................................................15
SCOPE OF WORK .......................................................................................................................................18
Overview.........................................................................................................................................18
Plant Communities Descriptions .....................................................................................................20
Soil Descriptions .............................................................................................................................24
Water Table Elevation Data ............................................................................................................24
Hydrologic-Hydraulic Assessment..................................................................................................24
Modeling Domain And Modeling Scenarios ....................................................................26
Modeling Results ..............................................................................................................27
Predictive Analysis .........................................................................................................................46
PREDICTED PLANT COMMUNITY CHANGES FOLLOWING RESTORATION.................................49
Cypress Forest.................................................................................................................................50
Freshwater Marsh............................................................................................................................52
Wet Prairie ......................................................................................................................................53
Pine Flatwoods................................................................................................................................54
Hammocks ......................................................................................................................................56
Coastal Wetlands and Estuaries ......................................................................................................59
Other Communities .........................................................................................................................60
Average Wet Season Water Levels .................................................................................................61
Maximum Annual One-Day Water Levels......................................................................................64
TIMEFRAMES FOR PLANT COMMUNITY RESPONSE TO RESTORATION.....................................66
IMPLICATIONS FOR WILDLIFE AND LISTED SPECIES......................................................................69
OTHER CONSIDERATIONS ......................................................................................................................72
Water Quality..................................................................................................................................72
Problems with Adequacy of the Model ...........................................................................................72
Roads ..............................................................................................................................................74

ii
Adjacent Lands ...............................................................................................................................75
RECOMMENDATIONS ..............................................................................................................................76
Restoration and Management..........................................................................................................76
Monitoring Restoration Success......................................................................................................77
Hydrological .....................................................................................................................78
Water Quality....................................................................................................................79
Fish and Wildlife Resources .............................................................................................80
Listed Species ...................................................................................................................82
LITERATURE CITED..................................................................................................................................85
Divider Tab APPENDIX A: Inventory and Analysis of Soils and Vascular Plant Communities in SGGE.......................A
APPENDIX B: Flood Hydrology and Hydraulics Analysis ........................................................................... B
APPENDIX C: Surficial Aquifer Observation Well Data .............................................................................. C
APPENDIX D: Hydrologic Model Developmen............................................................................................D
APPENDIX E: Florida Natural Areas Inventory List of Species found in Picayune Strand State Forest ..... E

iii
LIST OF TABLES
Table 1: Restoration of Southern Golden Gate Estates (SGGE) Chronology.................................................5
Table 2 Acreages and Percentages of Each SGGE Plant Community in 1940 and 1995. ............................24
Table 3 Relationship of Hydrology to Major Plant Community Types ......................................................44
Table 4: Comparison of Acreages and Percentages of Major Plant Community Types in MIKE SHE Model
.. Boundary Area Based on Inundation Depth Ranges Predicted by the MIKE SHE Model for Each
Modeling Scenario ..........................................................................................................................45
LIST OF FIGURES
Figure 1: SGGE Location Map.......................................................................................................................2
Figure 2: Faka Union Canal Watershed Boundary (Existing/Pre-GGE) ........................................................8
Figure 3: Land Use/Land Cover Map of Golden Gate Estates Area...............................................................9
Figure 4: Approximate Location of Major Drainage Basins Prior to the Development of SGGE................14
Figure 5: Southern Golden Gate Estates Watershed Planning Study Survey Sites.......................................19
Figure 6: Plant Community Maps of SGGE for 1940 and 1995...................................................................23
Figure 7: Pumping Rate and Operation Schedule at Designated Pump Stations of Miller Canal, Faka
Union Canal and Merritt Canal .......................................................................................................28
Figure 8: MIKE SHE Modeling Boundaries for SGGE Hydrologic Restoration Plan ..................................29
Figure 9: Surface Topography for Natural Condition...................................................................................30
Figure 10: Surface Topography for Current Condition ................................................................................31
Figure 11: Surface Topograpyh for Restored Condition ..............................................................................32
Figure 12: SGGE Average Inundation Depth During Wet Season for Natural Condition............................34
Figure 13: SGGE Average Inundation Depth During Wet Season for Current Condition ............................35
Figure 14: SGGE Average Inundation Depth During Wet Season for Restored Condition ..........................36
Figure 15: Maximum One-day Water Depths During an Average Year for Natural Condition in SGGE....37
Figure 16: Maximum One-day Water Depths During an Average Year for Current Condition in SGGE.....38
Figure 17: Maximum One-day Water Depths During an Average Year for Restored Condition in SGGE...39
Figure 18: Difference of Wet Season Average Inundation Depth of Current Condition to Wet Season
Average Inundation Depth of Natural Condition ............................................................................40
Figure 19: Difference of Wet Season Average Inundation Depth of Restored Condition to Wet Season
Average Inundation Depth of Natural Condition ............................................................................41
Figure 20 Number of Cells in Each Inundation Depth Range and Hydroperiod for Natural, Current and
Restored Condition, and Major Plant Community Type Association .............................................42
Figure 21: Difference in Number of Cells in Each Inundation Depth Range Between Natural Condition
and Other Modeling Scenarios ........................................................................................................43

1
INTRODUCTION
Purpose of Study
This study was initiated by the Big Cypress Basin of the South Florida Water
Management District (District) to provide information to be used in the development of the Big
Cypress Basin Watershed Plan. The District entered a cooperative agreement with the U.S.
Department of Agriculture, Natural Resources Conservation Service (NRCS) to procure data
and analyses of the soils, vegetation, topography, and water table fluctuations in the portion of
the watershed known as the Picayune Strand State Forest (PSSF) and the Ten Thousand Islands
National Wildlife Refuge south of the PSSF to the estuarine boundary of the Refuge. The PSSF
includes an area known as the Southern Golden Gate Estates, a large tract that was the focus of
the study and of this report. The information obtained in this study will be used by the District
to enhance and expand the scope of its “Hydrologic Restoration of Southern Golden Gate
Estates—Conceptual Plan” (Abbott and Nath 1996). The goal of the study was to update the
analysis of the hydrologic restoration strategy proposed in the Conceptual Plan using more
detailed site-specific data and to predict the effects of the proposed strategy on the existing plant
communities in the study area. In addition, data acquired during this study can serve as a
“baseline” that can be augmented to track hydrological and biological changes that occur in the
PSSF and the Refuge over the duration of the hydrologic restoration process.
Environmental Setting
The Southern Golden Gate Estates (SGGE) encompasses an approximately 94 square-
mile area of sensitive environmental landscape in Collier County, Florida, between Interstate

2
FIGURE 1: SGGE Location Map
Highway 75 (“Alligator Alley”) and U.S. Highway 41 (Figure 1). Located southwest of the
Florida Panther National Wildlife Refuge, north of the Ten Thousand Islands National Wildlife
Refuge, west of the Fakahatchee Strand State Preserve, and east of the Belle Meade State
Conservation and Recreation Land Projects area, the SGGE constitutes the heart of the PSSF. It
contains some of the most diverse plant and wildlife communities of the North American
continent. Prior to anthropogenic impacts, the area was characterized by seasonal flooding
several months of the year. Broad, slow moving sheetflow sustained wetland vegetation and
rejuvenated freshwater aquifers. Three major flowways contributed freshwater to the Ten
Thousand Islands estuary.
However, significant alterations in the area's hydrology and plant communities have
occurred within the SGGE since cypress logging operations began in the 1940s and 1950s.
S.R. 29
NAPLES
U.S. 41
C.R. 846
ALLIGATOR ALLEY
27
41
ALLIGATOR ALLEY
A T L A N T I C
O C E A N
N
80 80
27
SOUTHERNGOLDEN GATEESTATES
I-75
MILES
0 2 5
I75
BELLE MEADECARL PROJECT
COLLIERSEMINOLESTATE
ROOKERY BAYCARL PROJECT
10,000 ISLANDSNATIONAL
FAKAHATCHEESTRAND STATE
FLORIDA PANTHERNATIONAL WILDLIFEREFUGE
CORKSCREWSWAMP
CREW
BIG CYPRESS
SANCTUARY
ENP
NATIONAL
PRESERVE
PRESERVE
PARK
& LANDOWNERREQUEST ZONE
REFUGEWILDLIFE

3
Land drainage activities began in southwest Florida with the diversion and channelization of the
Caloosahatchee River during this time, which later culminated in the development of the
Golden Gate Estates in the 1960s. Golden Gate Estates is a very large subdivision bisected by
I-75 into northern and southern tracts, known as NGGE and SGGE, respectively. When the
Golden Gate Estates was subdivided in the 1960s, an extensive network of roads and canals
were built and thousands of lots were sold. The developer, Gulf America Corporation, went out
of business and many of the planned homes were never built. Today the vast majority of
existing homes are located in the NGGE, which has been zoned for single family residential
use. The SGGE has undergone very little further development, and was targeted for restoration
efforts beginning in the 1970s as the impacts of the extensive drainage became recognized.
Presently, a network of over 300 miles of roads intercepts the historic flowways and four major
canals significantly drain the landscape, resulting in reduction of aquifer storage, increased
freshwater shock load discharges to the estuary, degradation of plant communities, and
increased frequency of forest fires in the SGGE area.
Hydrologic Restoration Plan
Concern over the gradual degradation of environmental quality and water supply
potential of the region prompted the U.S. Congress to authorize a Golden Gate Estates
Feasibility Study by the U.S. Army Corps of Engineers (COE) in 1978. A Reconnaissance
Report for the Golden Gate Estates was developed by the COE in 1980. In 1986, the COE
released the Golden Gate Estates Feasibility Report which developed a number of alternative
restoration plans, but recommended no federal involvement for project implementation at that
time. The State of Florida identified the area as a component of the Save Our Everglades
program in 1985, and included it in its Conservation and Recreation Lands (CARL) acquisition

4
program initiative. In 1996, at the direction of the Governor of Florida, the District developed a
conceptual hydrologic restoration plan (Conceptual Plan) for the SGGE with the goal of
enhancing the environmental value and water resources of the region. The basic premise of the
Conceptual Plan was to reduce the over drainage by restoring historic flow ways and sheet flow
patterns while maintaining the existing levels of flood protection for areas north of the SGGE.
The implementation of the Conceptual Plan was included among a number of South
Florida Critical Ecosystem Restoration projects authorized under the Water Resources
Development Act (WRDA) of 1996. However, the Plan could not be authorized for
implementation since the state received federal funds to acquire SGGE lands under the “Farm
Bill” (Section 390 of the Federal Agriculture Improvement and Reform Act of 1996, PL 104-
127) in excess of the limit of federal participation criteria set by WRDA 1996. The project has
now been proposed for implementation as an “Other Project Element” of the Comprehensive
Everglades Restoration Plan (CERP) authorized by WRDA 2000. A Project Management Plan
for the hydrologic restoration of the SGGE has been developed by the COE and the District as
joint sponsors. The database and analyses developed as a part of this Watershed Planning
Assistance Cooperative Study Report will be incorporated into the Project Implementation
Report (PIR), a feasibility report updating the Conceptual Plan that will be used in the jointly
sponsored proposal for WRDA 2004 funding. It is to be noted that the MIKE-SHE model set-
up used in this study is being updated and additional alternative water management strategies
are being analyzed in the PIR effort to formulate a cost-effective restoration plan. The table
below summarizes the sequence of events in the SGGE restoration process.

5
TABLE 1
RESTORATION OF SOUTHERN GOLDEN GATE ESTATES (SGGE)
CHRONOLOGY
Late 1950s • Gulf America Corporation (GAC) begins acquiring land in Collier County. Early 1960s • Golden Gate Estates (GGE) subdivision plan submitted to and approved by Collier
County. • Subdivision platted for commercial, multifamily, and single family residential use.
August 1963 • Construction of the first GAC canal (lower portion of the Golden Gate Canal) completed.1960s – early 1970s
• Extensive land sales program by GAC. • Estimated GGE owners in excess of 50,000 worldwide.
Late 1960s • General awareness developed regarding the need for careful management of natural resources, particularly South Florida’s water resources.
1968–1971 • Construction and completion of the Faka Union canal system. 1974 • “Hydrologic Study of the GAC Canal Network” by Black, Crow and Eidsness, Inc. is the
first engineering study to address environmental aspects of the GAC canal system. Also evaluated flood protection. Prepared for Collier County Water Management Advisory Board.
March 1975 • GGE Study Committee established by the Board of County Commissioners: • Represented formal Collier County government movement to address GGE issues. • Purpose: To re-evaluate the GGE in terms of appropriate long-term urban planning and
resource management. 1977 • GGE Redevelopment Study report:
• Showed general nature of redevelopment plan. • Major changes in drainage plan and land ownership feasible. • Recommended that a hydrologic engineering plan be prepared.
1978 • Authorization of GGE Feasibility Study by Congress. 1980 • U.S. Army Corps of Engineers Reconnaissance Report for the GGE. 1985 • SGGE included in “Save Our Everglades” portion of the CARL program. 1986 • U.S. Army Corps of Engineers (COE) GGE Feasibility Report:
• Evaluated three alternatives for modifying the canal network. • Alternative C offered greatest attainment of multipurpose objectives. • Recommended no federal involvement (no economic benefit to nation). Determined was
state/local issue. August 1986 • Committee for Restoration of GGE established by the Kissimmee River—Lake
Okeechobee Everglades Coordinating Council. Purpose was to keep restoration of SGGE on agenda of important state environmental issues.
October 1991 • Agreement between District and Florida Department of Environmental Protection (FDEP) to fund land acquisition personnel.
February 1992 • District directed by Governor Lawton Chiles to “…develop a conceptual hydrologic restoration plan for SGGE, using the Corps’ Feasibility Report as a primary reference.”
February 1996 • District submits “Hydrologic Restoration of Southern Golden Gate Estates – Conceptual Plan” to the Governor of Florida.
June 1996 • FDEP’s Office of Ecosystem Management institutes interagency coordination.

6
October 1996
• Cooperative Watershed Planning Assistance Study agreement with USDA NRCS to enhance database on soils, vegetation, topography and hydrologic-ecologic assessment of the restoration plan.
January 1997
• Interagency Technical Advisory Committee convened with representatives from Corps of Engineers, U.S. Fish and Wildlife Service, U.S. Geological Survey, FDEP, Florida Game & Fresh Water Fish Commission and others, to provide input and assistance for duration of study.
June 1997 • South Florida Ecosystem Restoration workgroup ranks the project 7th among the South Florida Critical Restoration Projects recommended for funding under WRDA 1996 initiative.
February 1998 • Assistant Secretary of Army approves letter report for funding under WRDA 1996. April 1998 • Federal Farm Bill funds of $25 million provided to FDEP to enhance SGGE land
acquisition efforts. July 1998 • Settlement of lawsuit brought by SGGE landowner’s group (representing more than 2,000
landowners) under which FDEP acquires 2,968 acres of land in SGGE. October 1998 • Governor and Cabinet approve purchase of 8,526 acres of land from Avatar Properties,
Inc., the largest landowner in the SGGE project area. August 1999
• Corps of Engineers rules that implementation of the proposed SGGE hydrologic restoration plan cannot be funded as a Critical Restoration Project due to $25 million limit of federal assistance under WRDA 1996 criteria, but funding will be considered as an element of the Comprehensive Everglades Restoration Plan (CERP).
May 2000 • Florida Cabinet approves accelerated land acquisition mechanism by authorizing state to offer 25% more than the appraised value of land to willing sellers.
September 2000
• Corps of Engineers and District jointly initiate Master Program Management Plan development for restoration project implementation as a CERP element.
January 2001 • Florida Cabinet approves proceeding with Eminent Domain classification for remaining land acquisition in SGGE.
March 2001 • Project Management Plan agreement signed by Corps of Engineers and District, and Project Implementation Report initiated.
May 2001 to present
• Project Implementation Report development continuation.

7
CHARACTERIZATION OF THE STUDY AREA
Land Use
The Golden Gate Estates (GGE) development occupies a large portion of the Faka
Union Canal watershed. Figures 2 and 3, respectively, illustrate the boundaries of the
watershed and generalized land uses within the GGE. Much of the area north of I-75 is zoned
residential. The residential zoning is low density with a minimum lot size of 2 ¼ acres. The
remainder of this area is used for agriculture, predominantly vegetable farming, except in areas
of persistent flooding. The most populated portion of the watershed is north of I-75,
particularly west of Everglades Boulevard. Telephone and electric services are not available in
most areas south of I-75 and this area remains generally undeveloped. A small urban area
called Port of the Islands exists near the intersection of the Faka Union Canal and I-75. South
of I-75, the majority of the land cover is identified as wetlands (Figure 3). It will be shown later
in this report that many of these areas no longer meet the ecological criteria for this designation,
however.
Geology and Soils
The area encompassed by this study lies within Big Cypress physiographic region of the
lower Coastal Lowlands topographic division. The dominant geomorphic features are the
Southwestern Slope and Reticulated Coastal Swamps. Limestone and marine deposits
underlying the area were formed during the Pleistocene epoch. Duever, et al. (1986) classified
four major soil groups (rock, sand, marl, and organics) in the Big Cypress National Preserve.
These major soil groups are also found in the study area.

8
Faka-Union Canal

9
Figure 3: Land Use/Land Cover Map of Golden Gate Estates Area (1995, Florida Dept. of Transportation)
Ever
glad
es

10
Soils throughout the study area vary in thickness over limestone. There is exposed
limestone in the northeastern portion, and the remainder of the area is shallow limestone
throughout. The surface thickness of the soil and depth to limestone is greatest in the lower
elevations between U.S. 41 and the platted portion of the study area. At the higher elevations of
the study area, if the thickness of the soil layer above the limestone is greater than four feet,
soil-forming processes occur to form stain layers or cause mineral movement within clay layers
above the limestone. South of the four major canals that drain the SGGE, soils in the prairie
areas have marl over sandy deposits on rock. The detailed soil map units from the Soil Survey
of Collier County Area, Florida (Luidahl et al., 1998) appear to indicate that oxidation through
drainage or fire activity has thinned the organic surface layers.
Most of the soils in the study area are characterized as poorly or very poorly drained and
historically were subject to intermittent or prolonged flooding. Because of the strong
correlation between soil type and vegetation under unaltered conditions, observations of soil
types in the SGGE provide information about pre-development natural flowways and land
cover. In the 1954 Collier County Soil Survey (Leighty, et al.) the deepest of these flowways
and basins are identified as a generic map unit labeled as Cypress Swamp (Cf). The survey
names several soils that might be found within this map unit. Most of them have black or dark
gray mucky fine sand or peaty muck; in others it is brown peat. According to the current NRCS
Soil Survey (Luidahl, et al., 1998), areas mapped as Cf in the 1954 survey have soils with sandy
or mucky fine sands. Comparison of 1940 and 1953 aerial photography with the 1954 soil
survey information verifies the historic plant communities described in this report.
Plant Communities
The SGGE area is primarily made up of forests and hydric prairies. Leighty, et al.

11
(1954) indicated the area was largely bald cypress swamp and short grass prairie, with
occasional mesic hammock or flatwoods communities. Significant alterations to the hydrology
and biology of the area probably began between 1968 and 1971, when the Faka Union Canal
system was completed. Gore (1988) estimated that the Faka Union drainage canal system
drained the basin 16 times faster than natural drainage, and reduced wetland hydroperiods by 2-
4 months, lowering the area's water table by 2-4 feet.
A significant shift has taken place in plant community composition from that of wetland
and transitional vegetation to more upland and exotic species-dominated systems. Prior to the
1960s, the dominant native plant communities in the SGGE area were cypress-dominated
forests, wet prairies and pine flatwoods. Drainage of the landscape has resulted in decreased
hydroperiods, increased frequency and intensity of fires, and degradation of the organic soils
that supported the historic communities. In the cypress forest communities, slash pines (Pinus
elliottii var. densa) and saw palmettos (Serenoa repens) that are adapted to drier conditions and
more intensive fire regimes have colonized, often followed by invasive exotic species like
Brazilian pepper (Schinus terebinthifolius). In addition, the extensive roadway system in the
SGGE has resulted in a loss of tree canopy that has affected understory vegetation, air flows and
temperature. Many species, including some endangered orchids and bromeliads, require
specific temperature and/or humidity conditions that are found in mature forested systems. In
wet prairie communities, shortened hydroperiods have resulted in impacts such as inhibited
growth of periphytic algae, which sustain small forage fish, amphibians and macroinvertebrates,
that are in turn an important food source for larger animals, particularly wading birds.
Drainage appears to have affected the wetland communities differently. Prairies and
cypress sloughs may have superficial resemblance to the communities described by Leighty, et
al.; however, species compositions often differ (see Appendix A). Other areas appear to have

12
changed more significantly. Exotic species, mostly Brazilian pepper, have become dominant or
co-dominant in many areas that formerly were more hydric.
The native sabal palm (Sabal palmetto) appears to have become dominant through much
of the area during the past few decades. These palms now form dense populations of similar
sized, apparently young trees, beneath widely spaced individuals that appear to be very old.
Ages of sabal palms here have been subjectively estimated, as features of their growth do not
conform to annual or seasonal events, and ages cannot be accurately determined from their
physical characteristics (Tomlinson, 1984). Most areas with dense sabal palm populations do
not appear to have had dense populations on aerial photographs taken in 1940 and 1953. This
suggests a sparse parent population that has given rise to a successful population of offspring,
all at about the same time. The younger palms appear to be 2-3 decades old (again, ages
determined subjectively), suggesting that the population increase may have occurred since the
hydrology of the area was changed.
Fires are important ecological factors in many terrestrial communities in southern
Florida. Lightning strikes and the occasional fires that result are common, and in the SGGE
human-mediated fires burn many acres nearly every year. Wade et al. (1980) suggested that a
naturally occurring fire frequency in sawgrass (Cladium jamaicense) prairies may be from three
to twenty-five years, typically much more frequent than the latter figure. Marl prairies may be
expected to burn even more often (Wade et al., 1980), so that these communities perhaps do not
experience fire frequencies greater than before drainage. Other communities, however, may be
experiencing fire frequencies much different from frequencies before drainage. Flooded
cypress sloughs, for example, probably seldom experienced fires, except for the areas adjacent
to prairies (Wade et al., 1980). Fires that occur now may burn closer to, or below the soil
surface, as surface water and moisture levels are likely to be lower than levels before drainage.

13
Gore (1988) noted that wildfires in Collier County increased dramatically after completion of
the Golden Gate Estates drainage system. The year following its completion, four times as
many acres burned as the cumulative total of acres burned during the eight years of drainage
canal construction. Furthermore, the mean acreage burned per year exceeded this cumulative
total for the following five years. Evidence of fires is abundant in much of the SGGE area as
charred stumps or fallen trunks of cypress trees. Fires commonly burn from prairies or
flatwoods farther into adjacent cypress sloughs or other hydric forest communities than was
historically common. This alters species compositions in communities formerly more hydric, as
most resident species are not well adapted to withstand fires (Wade et al., 1980).
The Watershed
What is now known as the Faka Union Canal watershed, including SGGE and part of NGGE,
historically (i.e., 1940s-50s prior to GGE development) encompassed an area of approximately
234 square miles and was known as the Camp Keais watershed (Black, Crow and Eidsness, Inc.,
1974). Figure 4 shows these historic watershed boundaries. The extent of the historic
watershed has been reduced due to construction of roads, canals and urban and agricultural
development. The existing Faka Union Canal watershed is approximately 189 square miles
containing approximately 70 miles of canals with 12 weir structures. A grid-like system of
roads is spaced every quarter mile over much of the watershed. Pre-GGE development and
current Faka Union watershed boundaries are illustrated in Figure 2.

14
Figure 4
(shown for reference)

15
Regional Flow Patterns
The topography of the basin is characterized by low relief and poorly defined drainage
patterns. Elevations range from 24 feet NGVD in the extreme north end with a gradual slope in
the central and southern part to elevations of 2 feet NGVD near the outlet of the basin some 28
miles to the south. Over the basin the water flows in a general southwest direction.
Historically, the general water movement in the watershed was characterized by slow,
overland sheetflow a few inches to a few feet deep and several miles wide. Much of the
drainage was concentrated in slightly lower sloughs and strands. The area was regularly
inundated by several feet of water during the wet season (U.S. Army Corps of Engineers, 1986).
During the wet season, overland runoff was stored in depressional areas, peak channel flows
were attenuated, and wetland hydroperiods were maintained well into the dry season. Storage
of water in wetlands was integral to the hydrology of the watershed. As the wet season ended
and throughout the dry season, water stored in depressions was slowly depleted as it recharged
the shallow water table aquifer and was used by vegetation in the evapotranspiration process.
This reduced the amount of surface runoff. It has been estimated that, of the 50+ average inches
of annual rainfall received in western Collier County, historical natural runoff was on the order
of 0 to 10 inches annually (Kenner, 1966).
Since their construction, roads and canals largely control the surface flow patterns and
the subbasin boundaries. The Faka Union Canal system is made up of four major canals
(Miller, Faka Union, Merritt and Prairie) with the Faka Union Canal being the longest,
extending approximately 28 miles north from the estuary of the Ten Thousand Islands nearly to
County Road 846. The canals have an average excavated depth of approximately ten feet from
top of bank to bottom of channel and are trapezoidal in cross-section, with surface widths
ranging from 45 to over 200 feet. Canal discharge records measured at the gauging station
16
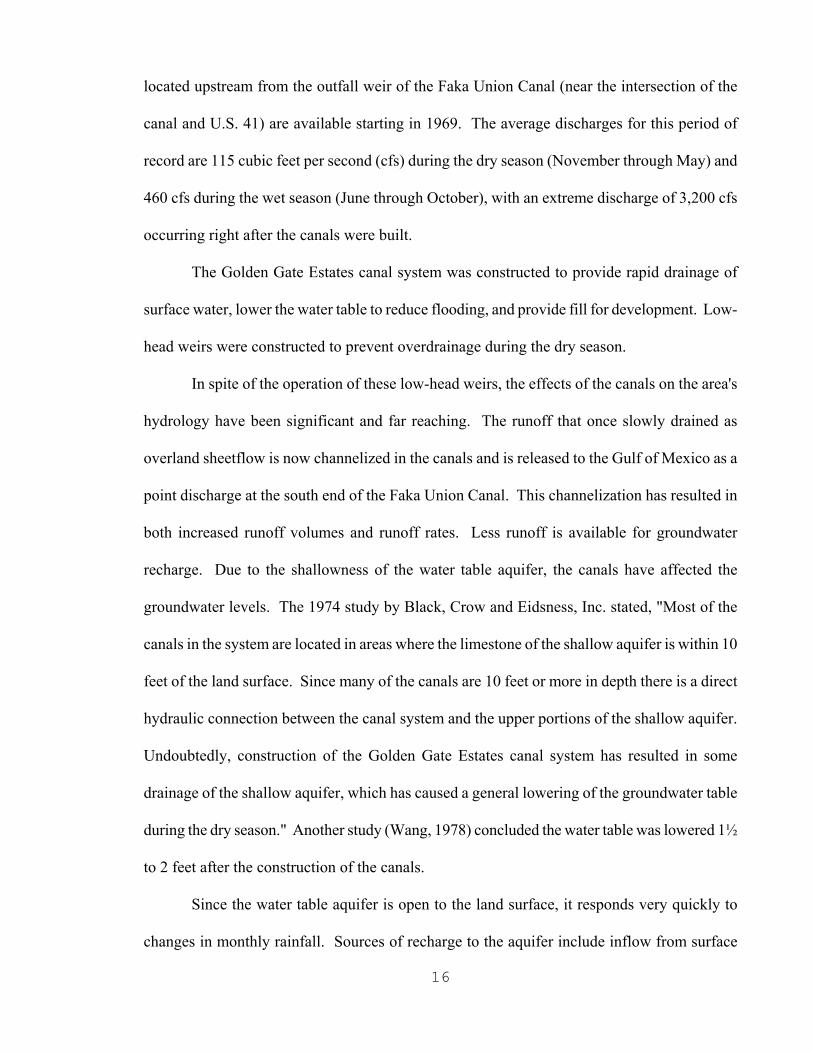
located upstream from the outfall weir of the Faka Union Canal (near the intersection of the
canal and U.S. 41) are available starting in 1969. The average discharges for this period of
record are 115 cubic feet per second (cfs) during the dry season (November through May) and
460 cfs during the wet season (June through October), with an extreme discharge of 3,200 cfs
occurring right after the canals were built.
The Golden Gate Estates canal system was constructed to provide rapid drainage of
surface water, lower the water table to reduce flooding, and provide fill for development. Low-
head weirs were constructed to prevent overdrainage during the dry season.
In spite of the operation of these low-head weirs, the effects of the canals on the area's
hydrology have been significant and far reaching. The runoff that once slowly drained as
overland sheetflow is now channelized in the canals and is released to the Gulf of Mexico as a
point discharge at the south end of the Faka Union Canal. This channelization has resulted in
both increased runoff volumes and runoff rates. Less runoff is available for groundwater
recharge. Due to the shallowness of the water table aquifer, the canals have affected the
groundwater levels. The 1974 study by Black, Crow and Eidsness, Inc. stated, "Most of the
canals in the system are located in areas where the limestone of the shallow aquifer is within 10
feet of the land surface. Since many of the canals are 10 feet or more in depth there is a direct
hydraulic connection between the canal system and the upper portions of the shallow aquifer.
Undoubtedly, construction of the Golden Gate Estates canal system has resulted in some
drainage of the shallow aquifer, which has caused a general lowering of the groundwater table
during the dry season." Another study (Wang, 1978) concluded the water table was lowered 1½
to 2 feet after the construction of the canals.
Since the water table aquifer is open to the land surface, it responds very quickly to
changes in monthly rainfall. Sources of recharge to the aquifer include inflow from surface

17
water bodies such as canals, subsurface flow from adjacent areas, and upward seepage from
semi-confined aquifers. Generally, recharge occurs after rainfall events when the canal levels
immediately upstream from the weirs are higher than adjacent groundwater levels.

18
SCOPE OF WORK
Overview
The purpose of the District’s hydrologic restoration plan is to restore historic
hydroperiods and sheetflow patterns in the study area to the extent possible while maintaining
the existing levels of flood protection for areas north of SGGE. Appendix B contains a detailed
site specific analysis of flood hydrology and hydraulics performed to help insure that these
levels will be maintained. Since the response of SGGE plant communities to the hydrologic
changes will be one of the most fundamental and visible indicators of restoration success, data
on both the present and historic hydrological and ecological conditions of the watershed were
collected and analyzed for this study. Historic conditions were defined for this study by
interpretation of aerial photography and soil survey data recorded in the 1940’s and 1950’s,
prior to the occurrence of significant environmental impacts to the area.
Utilizing plant community associations for soil types contained in the 1954 Collier
County Soil Survey (Leighty, et al., 1954) and 1940 and 1953 aerial photography, the historic
plant community types were described and mapped in GIS format. 1995 color infrared aerial
photography, current soil survey information, and extensive groundtruthing were used to create
analogous GIS maps to describe existing plant communities in the study area. The two data sets
were compared to examine changes in plant communities over time.
Field surveys of current plant communities, soils, and surficial aquifer levels were
conducted at 39 selected sites (see Figure 5). Survey sites were selected to provide a
representative sample of the predominant communities in the study area, although constraints

19
20
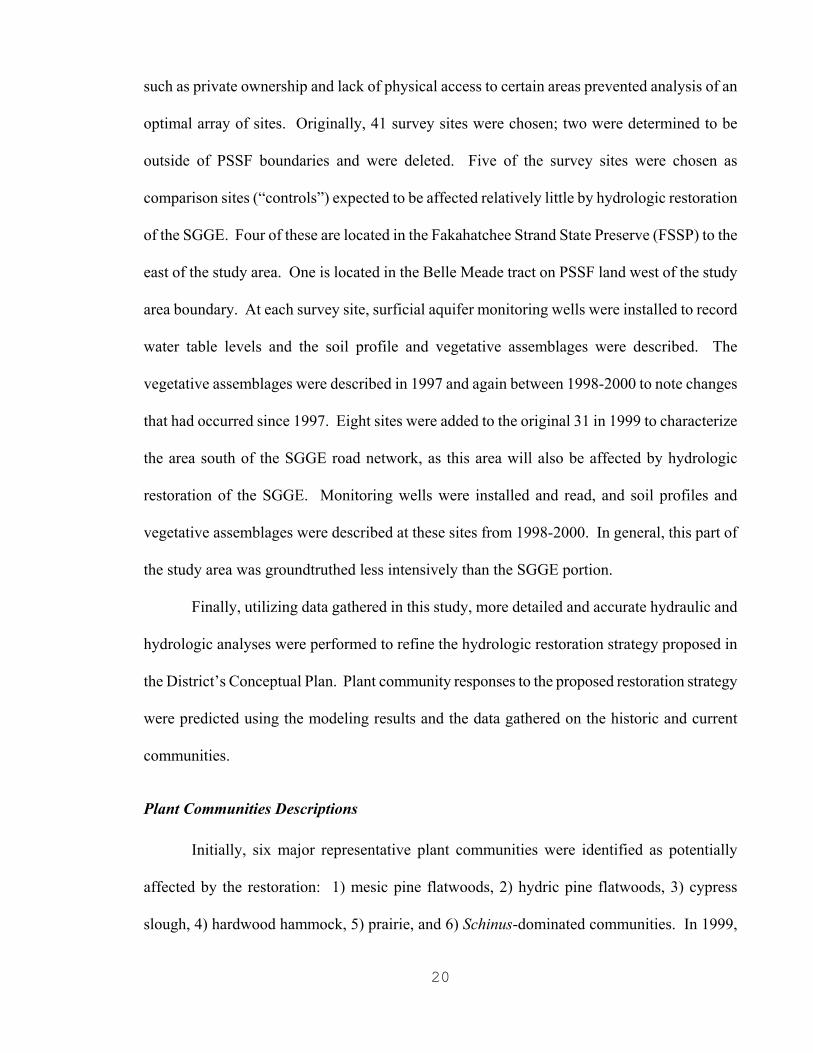
such as private ownership and lack of physical access to certain areas prevented analysis of an
optimal array of sites. Originally, 41 survey sites were chosen; two were determined to be
outside of PSSF boundaries and were deleted. Five of the survey sites were chosen as
comparison sites (“controls”) expected to be affected relatively little by hydrologic restoration
of the SGGE. Four of these are located in the Fakahatchee Strand State Preserve (FSSP) to the
east of the study area. One is located in the Belle Meade tract on PSSF land west of the study
area boundary. At each survey site, surficial aquifer monitoring wells were installed to record
water table levels and the soil profile and vegetative assemblages were described. The
vegetative assemblages were described in 1997 and again between 1998-2000 to note changes
that had occurred since 1997. Eight sites were added to the original 31 in 1999 to characterize
the area south of the SGGE road network, as this area will also be affected by hydrologic
restoration of the SGGE. Monitoring wells were installed and read, and soil profiles and
vegetative assemblages were described at these sites from 1998-2000. In general, this part of
the study area was groundtruthed less intensively than the SGGE portion.
Finally, utilizing data gathered in this study, more detailed and accurate hydraulic and
hydrologic analyses were performed to refine the hydrologic restoration strategy proposed in
the District’s Conceptual Plan. Plant community responses to the proposed restoration strategy
were predicted using the modeling results and the data gathered on the historic and current
communities.
Plant Communities Descriptions
Initially, six major representative plant communities were identified as potentially
affected by the restoration: 1) mesic pine flatwoods, 2) hydric pine flatwoods, 3) cypress
slough, 4) hardwood hammock, 5) prairie, and 6) Schinus-dominated communities. In 1999,

21
with the addition of eight new survey sites to the south in the expanded study area, the brackish
marsh community which is prevalent on the Ten Thousand Islands National Wildlife Refuge
(TTINWR) was added. Thus, 39 sites representing 7 communities were selected. This allowed
for sampling comparisons both within and between communities. Comparison sites were
chosen for five of the six native community types. Because most of the brackish marsh sites on
the TTINWR are considered relatively undisturbed, no comparison site was chosen for this
community type. Of the other five, a hydric pine flatwoods comparison site was chosen in the
Belle Meade tract, and cypress slough, hardwood hammock, and prairie sites were located in the
FSSP. The fifth comparison site, for mesic pine flatwoods, had to be deleted from the survey
when it was discovered not to be in public ownership. As no other adequate site could be
located, there is no comparison site for this community type.
The biological communities at each of the 39 survey sites are defined and described
primarily by their vascular plant residents in Appendix A. The communities’ components were
compared with descriptions provided by Leighty, et al. from field reconnaissance performed in
the 1940’s for the 1954 Collier County Soil Survey. The Soil Survey included descriptions of
the plant communities commonly found on the described soils. In describing current conditions
of the communities, diversity measures of habitat assemblages were developed for use as
descriptive tools. These descriptions can be used for future comparisons to determine whether
changes in habitat communities are in line with expectations of land managing entities.
GIS maps showing the distribution of major plant community types in the study area in 1940
and 1995 were created using the plant community descriptions, aerial photography, soil survey
information and groundtruthing (Figure 6, Table 2). The maps and table provide a detailed
comparison of the location and extent of historic and current plant communities.
22
Soil Descriptions
The soils at each survey site were described in terms of the uniformity and continuity of
soil layers, and morphology (i.e., structure, texture, color, organic matter, permeability, seasonal
high water table elevation and hydric condition). Detailed soils information including
descriptions of the soil profile for each of the 39 sites surveyed for this study can be found in
Appendix A.
Water Table Elevation Data
In order to show fluctuations in the shallow water table at the survey sites, shallow
surficial aquifer monitoring wells were installed at all SGGE study area sites and at the
comparison site on the Belle Meade tract (wells were pre-existing at the FSSP sites). Well
water levels were recorded where possible on a biweekly basis between beginning in October
1998. The wells on FSSP property were read monthly by FSSP personnel. Appendix C
contains monitoring well data.
Hydrologic-Hydraulic Assessment
For the District’s Conceptual Plan, the hydrologic-hydraulic assessment of the
watershed and of the alternative restoration strategies was performed by applying the U.S.
Environmental Protection Agency’s continuous process Hydrologic Simulation Program Fortran
(HSPF). However, an enhanced representation of the complex surface and groundwater flow
patterns of the watershed was incorporated for this study via the application of the integrated
mathematical modeling system MIKE SHE (Refsgaard and Storm, 1995). The MIKE SHE
modeling system is an integrated and distributed, physically based, finite difference
mathematical

23
FIGURE 6: Plant Community Maps of Southern Golden Gate Estates for 1940 and 1995

24
TABLE 2: ACREAGES AND PERCENTAGES OF EACH SGGE PLANT COMMUNITY IN 1940 AND 1995.
Name Veg. Symbol
1940 Acres Percent of Total Acreage
1995 Acres Percent of Total
Acreage
Difference (1995-1940) in Acres and Percent
Cypress C 30583.1 30.5% 10567.1 10.5% -20016.0 -19.9% Cypress with hardwoods Ch 0.0 0.0% 2845.7 2.8% 2845.7 2.8%
Cypress with palms Cp 8758.1 8.7% 9025.6 9.0% 267.5 0.3% Coastal Uplands Cu 301.9 0.3% 301.9 0.3% 0.0 0.0%
Cypress (disturbed) Cx 0.0 0.0% 1246.2 1.2% 1246.2 1.2% Wet Prairie G 7619.3 7.6% 7031.0 7.0% -588.3 -0.6%
Prairie with palms Gp 0.0 0.0% 2043.6 2.0% 2043.6 2.0% Prairie (disturbed) Gx 0.0 0.0% 161.8 0.2% 161.8 0.2% Hydric Hammock Hh 0.0 0.0% 2574.2 2.6% 2574.2 2.6% Mesic Hammock Hm 0.0 0.0% 139.8 0.1% 139.8 0.1%
Sabal Palm Hammock Hp 55.8 0.1% 7286.4 7.3% 7230.7 7.2% Tropical Hammock Ht 264.9 0.3% 688.6 0.7% 423.7 0.4% Freshwater Marsh Mf 512.1 0.5% 94.7 0.1% -417.5 -0.4% Marsh (Salt/Fresh) Mfs 8574.2 8.5% 6480.4 6.5% -2093.8 -2.1%
Mangrove Mg 16564.5 16.5% 18417.3 18.3% 1852.8 1.8% Hydric Pine Flatwoods Ph 7141.2 7.1% 5852.9 5.8% -1288.3 -1.3% Mesic Pine Flatwoods Pm 2908.0 2.9% 1983.0 2.0% -924.9 -0.9%
Pine Flatwoods with palms Pp 2408.0 2.4% 6478.1 6.5% 4070.2 4.1% Pine Flatwoods (disturbed) Px 0.0 0.0% 48.2 0.0% 48.2 0.0%
Saw Palmetto S 0.0 0.0% 6.2 0.0% 6.2 0.0% Brazilian Pepper St 0.0 0.0% 273.1 0.3% 273.1 0.3%
Urban Land URB 0.0 0.0% 298.8 0.3% 298.8 0.3% Water WAT 14721.9 14.7% 15843.8 15.8% 1121.9 1.1%
Disturbed Land x 0.0 0.0% 725.0 0.7% 725.0 0.7% Total: 100412.9 100.0% 100413.5 100.0%

25
model. It comprises a number of flow modules, which may be combined to describe flow
within the entire land-based part of the hydrological cycle. In addition to surface water flow,
groundwater flow through the water table aquifer is considered in the MIKE SHE model.
MIKE SHE has been adopted for simulating various water demand and environmental problems
for the District since 1997. For detailed information on the development and application of
MIKE SHE, see Appendix D.
An extensive database of meteorological and land-based hydrologic-hydraulic data was
utilized for the development of the MIKE SHE integrated model for the SGGE. Some of the
major input parameters are listed in Appendix D. The model was then applied to generate
inundation depths, frequencies, and durations for surveyed elevation points on a quarter mile
grid across the modeled area for historic, current, and predicted restored conditions. These
conditions were based on implementation of Alternative III-D, an update of Alternative III-C,
which was the recommended hydrologic restoration plan for SGGE as presented in the
District’s Conceptual Plan.
The major features of the Alternative III-D hydrologic restoration design include pumps,
spreader channels, canal blocks and road removal to achieve the objectives of restoring
hydrology and sheet flow patterns to the extent possible while still providing flood protection
for populated areas north of SGGE.
The Alternative III-D design utilizes three pumps, one each on Miller, Faka-Union and
Merritt Canals, a dike at each pump to keep water from moving overland to the north after being
pumped from each canal, and spreader channels to recreate sheet flow downstream of the
pumps. Pumping rates were determined by actual flows measured at the outlet of the canal
system just north of U.S. 41. From these measurements it was estimated that flows from Miller
Canal, Faka Union Canal, Merritt Canal, and Prairie Canal contribute 20 percent, 50 percent, 18

26
percent, and 12 percent, respectively, to the total discharge measured at the Faka Union outfall
weir located near U.S. 41. Accordingly, pumping rates were calculated along those percentages
from the average of 10-year flow records at the outfall weir and distributed at the Miller, Faka
Union, and Merritt Canal pump stations. No pumping will occur in the Prairie Canal under
Alternative III-D. The design calls for pumps to run from June 1 through October 1. Flows
coming down the canals during the rest of the year are allowed to pass the pumps by gravity
flow. This schedule was determined via MIKE SHE modeling analysis to prevent flooding in
populated areas to the north while achieving SGGE hydrologic restoration objectives. Proposed
pumping rates and pump operation schedules are illustrated in Figure 7 on page 28.
Modeling Domain And Modeling Scenarios The domain of the MIKE SHE model is an area of 139.5 m2 (see Figure 8, p. 29), which
includes areas outside the PSSF (shown as red CARL boundary). Modeling results presented in
this report apply to the area within the SGGE modeling boundary. This area was divided into
2232 grid cells with cell dimensions of 1320 ft. by 1320 ft. (quarter mile) each. An explanation
of the extended modeling area shown as pink in Figure 8 may be found in Appendix D.
Three temporal scenarios were modeled to evaluate Alternative III-D:
1. Natural Condition: The surface topography and hydrology without the existence of
man’s influence in the form of canals, roads, etc. (Figure 9, p. 30). The term
“natural” hereafter refers to historic conditions as defined previously in this report.
(Major roads and canals are shown for reference.)
2. Current Condition: The surface topography and hydrology with the existing (1990-
99) networks of canals, roads, and water control structures (Figure 10, p. 31).
3. Restored Condition: The surface topography and hydrology with the proposed
elements of Alternative III-D in place (Figure 11, p.32).

27
Modeling Results The MIKE SHE model has permitted comparison of water levels, and by extension the
major plant communities, associated with natural, current, and restored conditions. In order to
best determine the extent to which Alternative III-D will restore historic hydroperiods of the
SGGE plant communities, MIKE SHE was applied to analyze parameters of wet season
hydroperiods. The spatial and temporal hydroperiod variations for a range of simulated
inundation depths under the three modeling scenarios are illustrated in the following series of
figures. It is important to note that refinements to MIKE SHE are ongoing, and these
refinements will allow the District to further enhance modeling capabilities in the near future;
thus, many of the following results are labeled as draft. Results show inundation depths and
differences for natural, current and restored conditions within the SGGE model boundary area
for an average meteorological year. Appendix D describes how an average meteorological year
was determined and provides additional model analyses.

28
Figure 7: Pumping Rate and Operation Schedule at Designated Pump Stations of Miller Canal, Faka Union Canal, and
Merritt Canal
0
50
100
150
200
250
300
350
400
450
500
1/1 1/31 3/2 4/1 5/1 5/31 6/30 7/30 8/29 9/28 10/28 11/27 12/27
Date
Flow
(cfs
)
Miller Canal Station Faka Union Canal Station Merritt Canal Station

29
Figure 8 MIKE SHE Modeling Boundaries for SGGE Hydrologic Restoration Plan

30
Figure 9: Surface Topography for Natural Condition

31
Figure 10: Surface Topography for Current Condition

32
Figure 11: Surface Topography for Restored Condition

33
Results are shown for the following model analyses:
A. Average inundation depths during wet season (July 1 through October 1) for:
Natural Condition (Figure 12).
Current Condition (Figure 13).
Restored Condition (Figure 14).
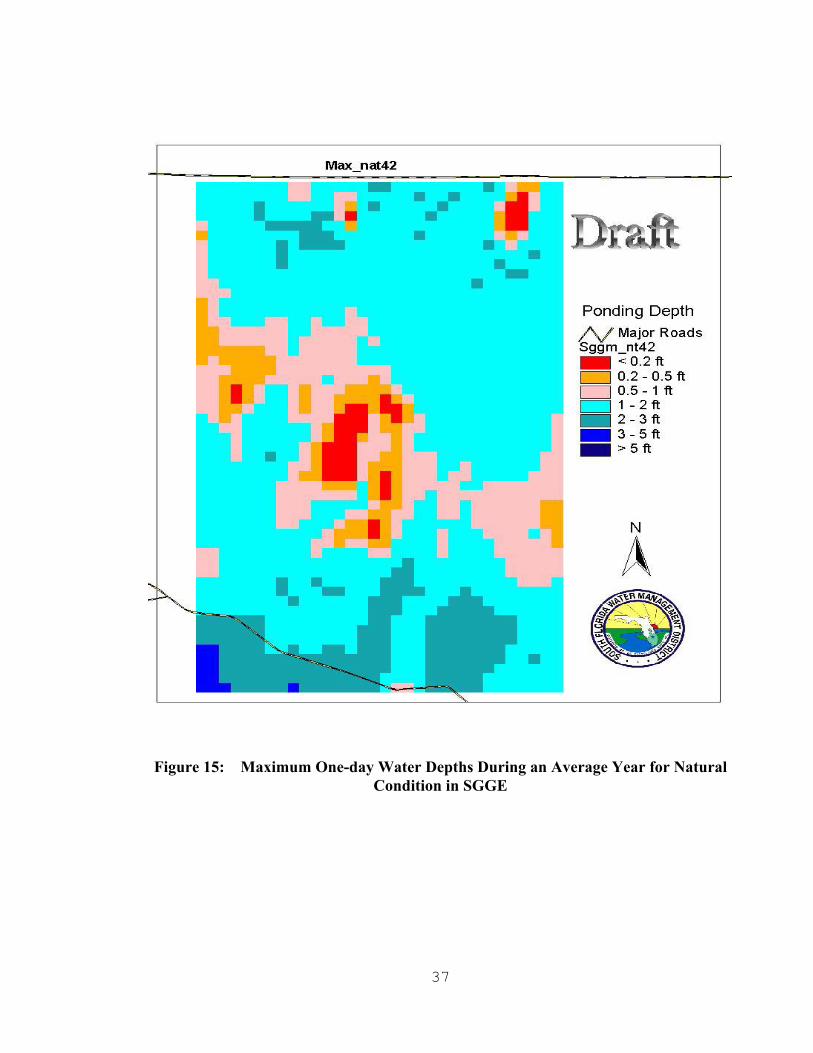
B. Maximum one-day water depths during an average year for:
Natural Condition (Figure 15).
Current Condition (Figure 16).
Restored Condition (Figure 17).
C. Difference in wet season average inundation depths between:
Current Condition and Natural Condition (Figure 18).
Restored Condition and Natural Condition (Figure 19).
D. Number of cells (1320 ft2) in each inundation depth range and hydroperiod for
Natural, Current and Restored Condition, and major plant community type
associations for depth ranges and hydroperiods (Figure 20).
E. Difference in number of cells in each inundation depth range between natural
condition and other modeling scenarios (Figure 21).
Utilizing the results of these modeling analyses and the hydrology and plant community
relationships shown in Table 3, Table 4 provides a comparison of acreages and percentages of
major plant community types based on inundation depth ranges predicted by the MIKE SHE
model for each modeling scenario.

34
Figure 12: SGGE Average Inundation Depth During Wet Season (July 1st – October 1st) for Natural Condition

35
Figure 13: SGGE Average Inundation Depth During Wet Season (July 1st to October 1st) for Current Condition

36
Figure 14: SGGE Average Inundation Depth During Wet Season (July 1st – October 1st) for Restored Condition
37
Figure 15: Maximum One-day Water Depths During an Average Year for Natural Condition in SGGE

38
Figure 16: Maximum One-day Water Depths During an Average Year for Current Condition in SGGE

39
Figure 17: Maximum One-day Water Depths During an Average Year for Restored Condition in SGGE

40
Figure 18: Difference of Wet Season Average Inundation Depth of Current
Condition to Wet Season Average Inundation Depth of Natural Condition

41
Figure 19: Difference of Wet Season Average Inundation Depth of Restored
Condition to Wet Season Average Inundation Depth of Natural Condition

42
Figure 20: Number of Cells in Each Inundation Depth Range and Hydroperiod for Natural, Current and Restored Condition, and
Major Plant Community Type Association.

43
Figure 21: Difference in Number of Cells in Each Inundation Depth Range Between
Natural Condition and other Modeling Scenarios
N
umbe
r of C
ells
Difference Natural and Current Condition
Difference Natural and Restored Condition

44
TABLE 3
RELATIONSHIP OF HYDROLOGY TO MAJOR PLANT COMMUNITY TYPES (based on Duever, et al.,. (1975) and Duever (1984)).
High Water Level (in)
Hydroperiod (mon)
SGGE Plant Communities
<-6 0 Tropical Hammock (Ht)
<2 <1 Mesic Pine Flatwoods (Pm) <2 <1 Mesic Hammock (Hm) <2 <1 Brazilian Pepper (St) <2 <1 Flatwoods with Palms (Pp) <2 <1 Sabal Palm Hammock (Hp)
2 - 6 1 - 2 Hydric Pine Flatwoods (Ph) 2 - 6 1 - 2 Hydric Hammock (Hh) 2 - 6 1 - 2 Flatwoods with Palms (Pp) 2 - 6 1 - 2 Sabal Palm Hammock (Hp)
6 - 12 2 - 6 Wet Prairie (G)
12 - 24 6 - 10 Marsh (Mf, Mfs)
12 - 18 6 - 8 Cypress Forest (C) 18 - 24 8 - 10 Cypress with hardwoods (Ch)
>24 >10 Open Water (WAT)

45
TABLE 4 COMPARISON OF EXTENT OF MAJOR PLANT COMMUNITY TYPES BASED ON INUNDATION DEPTH RANGES AS PREDICTED BY THE
MIKE SHE MODEL FOR NATURAL, CURRENT, AND RESTORED CONDITION. (Note: All acreage and percentage figures based on MIKE SHE model boundary area.)
ACREAGES
Community Type (listed in order of
increasing inundation depth ranges)
Natural Acres
Current Acres
Restored Acres
Difference (Current vs. Natural) Acres
Difference (Restored vs. Natural) Acres
Mesic Pine Flatwoods Mesic Hammock
3040 36880 8640 33840 5600
Hydric Pine Flatwoods Hydric Hammock
6480 5840 9080 -640 2600
Wet Prairie 17960 8960 16840 -9000 -1120Cypress Forest Freshwater Marsh
37040 6480 22800 -30560 -14240
Open Water 2.0 - 3.0 ft 3120 3360 6040 240 2920Open Water > 3.0 ft 200 6320 4440 6120 4240
Total: 67840 67840 67840 PERCENTAGES
Community Type (listed in order of
increasing inundation depth ranges)
Natural Acres
Current Acres
Restored Acres
Difference (Current vs. Natural) Acres
Difference (Restored vs. Natural) Acres
Mesic Pine Flatwoods Mesic Hammock
4.5% 54.4% 12.7% 49.9% 8.3%
Hydric Pine Flatwoods Hydric Hammock
9.6% 8.6% 13.4% -0.9% 3.8%
Wet Prairie 26.5% 13.2% 24.8% -13.3% -1.7%Cypress Forest Freshwater Marsh
54.6% 9.6% 33.6% -45.0% -21.0%
Open Water 2.0 - 3.0 ft 4.6% 5.0% 8.9% 0.4% 4.3%Open Water > 3.0 ft 0.3% 9.3% 6.5% 9.0% 6.3%
Total: 100.0% 100.0% 100.0%

46
Predictive Analysis
There were two sets of maps used in the analysis of SGGE restoration. The first were
GIS maps of the distribution of major plant community types in SGGE in 1940 and 1995
(Figure 6). The other set of maps was based on hydrology calculated by the MIKE SHE model
for natural, current, and restored conditions within the modeling boundary (Figure 8). Restored
plant community distributions were predicted based on the hydrologic characteristics of each
major community type and on model output of average wet season (July 1 – October 1) water
depths.
The two sets of maps and data serve different purposes to some extent and should not be
subject to direct comparison. In addition, the MIKE SHE and plant community maps have
different boundaries, based on their respective purposes and constraints imposed on the
selection of the respective boundaries. For instance, the MIKE SHE model was not designed to
deal with tidal influences. The use of a constant mean high tide elevation at the model area’s
southern boundary was necessary in order to run the model. It should be noted that the lack of
data on topography and water circulation patterns greatly limits the usefulness of any model in
this area. The model minimizes the amount of area influenced by tides by excluding most of the
saline estuarine habitat located south of U.S. 41 (Ms, Mg, WAT in Figure 6). In addition, the
MIKE SHE model includes extended coverage to the east, west, and north of SGGE in an effort
to minimize problems with model boundary conditions (see Appendix D) and increase the
accuracy of the model within the area of interest. These differences become significant when
trying to compare plant community acreages and percentages of natural, current, and restored
conditions between the two sets of maps.

47
Another feature that prevents comparison between the MIKE SHE-based maps and the
plant community maps is the quarter mile square cell size used in the model, which does not
allow for the inclusion of small features or features with a lot of edge, both of which can be
more precisely shown on the plant communities map. In the model result maps, the former are
usually incorporated into larger features and the latter tend to be erratically distributed because
of the necessity to produce average values for each cell.
The plant communities maps provide excellent documentation about where changes
have occurred from historic to current conditions. They also represent a valuable baseline with
which to compare future change following restoration, particularly where a return to historic
conditions is the restoration target. However, while they provide good estimates of plant
community acreages for historic and current conditions, they are not able to provide an estimate
of restored condition acreages. The only acreage estimates for restoration conditions are those
that can be calculated based on the MIKE SHE hydrology model. Thus, comparison of plant
community acreages for all three conditions has been based on the MIKE SHE model in this
report.
The descriptions of the plant communities utilized for the MIKE SHE model are based
on the FLUCCS (Florida Land Use, Cover and Forms Classification System) (Florida
Department of Transportation, 1999) and are somewhat modified in format from those utilized
for the plant communities survey and shown in Figure 6.
The greatest value of the MIKE SHE model as used in this study is its ability to
quantitatively estimate future conditions when certain features of a system are altered in specific
ways. Real ecosystems are far too complex to represent accurately in a model. However, the
ability of a model to synthesize current understanding of the major features and processes
operating within an ecosystem allows manipulation of the model so that the implications of

48
those specific manipulations can be evaluated much more precisely than would otherwise be
possible.

49
PREDICTED PLANT COMMUNITY CHANGES FOLLOWING RESTORATION
The SGGE area was originally dominated by wetland communities, particularly cypress
forest and to a lesser extent, herbaceous wet prairies. Even those sites normally designated as
uplands, particularly islands of pine flatwoods, often had water at or above the ground surface
for at least short periods during wetter portions of the year. Following drainage, cabbage palms,
pines, and hardwood species characteristic of drier habitats have increased in many of the
cypress forests. In addition, severe and frequent fires have eliminated many of the pine and
cypress trees, furthering the conversion of these lands to earlier shrubby successional stages of
upland or shallower wetland plant communities. The character of the original SGGE ecological
communities has also changed as a result of the invasion of exotic plant species, particularly
Brazilian pepper, into drained and disturbed sites.
The long-term goal of the proposed restoration is to return the hydrology of the area
downstream of the proposed system of pumps and spreader canals to a condition comparable to
that which existed in the SGGE prior to drainage. This will involve the reestablishment of a
predominantly wetland ecosystem within the SGGE and the elimination of a point discharge to
coastal waters. The combination of a restored hydrologic regime, a restored fire regime, and an
appropriate exotic vegetation control program can be expected to return most of SGGE to its
pre-drainage character, including the plant communities and wildlife that it supported at that
time. However, those areas where canals are not completely removed will obviously not be
restored.
Below is a description of the dominant plant communities found in the SGGE study
area, and analyses of expected ecological changes to each community type following the

50
proposed hydrologic restoration activities. Further descriptions of each type are contained in
Appendix A.
Cypress Forest (C)
Cypress forests (FLUCCS: 621 Cypress) in SGGE are dominated by dense stands of
bald cypress (Taxodium distichum), and occasional hardwoods such as red maple (Acer
rubrum), pop ash (Fraxinus caroliniana), or pond apple (Annona glabra), where these
hardwoods provide less than 30 percent canopy cover. Ground cover can be sparse to dense,
and emergent in standing water during normal wet season conditions. Epiphytic bromeliads and
orchids are locally common in trees and ferns are common on palm trunks. Normal wet season
water depths are relatively deep (12 to 24 inches) and hydroperiods are long (6 to 10 months)
(Table 3). This community may occur on any type of soil, including sand, marl, rock (hatrack
cypress), and organic. One variation of the cypress forest is cypress-with-palms (Cp), which
were typically shallow cypress communities in 1940 and drained cypress communities in 1995.
Almost 40,000 acres of the lands within SGGE were cypress forest (C, Cp) in 1940 (Table 2),
based on the plant communities map (Figure 6).
Since SGGE was drained, the original cypress forest (C) has been reduced by about
20,000 acres based on the plant communities map (Table 2). Although there was little change
in the acreage of the cypress-with-palms community (Cp), there were large shifts in where this
community was found (Figure 6). It now occupies areas within the south-central study area that
were largely cypress (C) in 1940. Much of the original C and Cp acreage has been replaced by
sabal palm hammock (Hp) or one of the pine flatwoods (P) communities. This is the single
most significant change in plant community structure resulting from the drainage of SGGE.

51
A small portion of the cypress forest (C) at scattered locations throughout the original
cypress communities has been converted to cypress-with-hardwoods (Ch) (FLUCCS: 630
Wetland Forested Mixed), probably due to a lack of fire, which has allowed succession to
proceed. These forests are dominated by bald cypress and a variety of hardwoods, such as red
maple, pop ash, or pond apple, where these hardwoods provide more than 30 percent canopy
cover. Epiphytic bromeliads are common in trees, and ferns are common on palm trunks. Drier
conditions could also have allowed hardwoods to invade the original cypress forests, but again
only in the absence of fire.
Currently there are about 1,200 acres of the original cypress that are classified as
disturbed (Table 2, Figure 6). Disturbed cypress forest (Cx) are cypress forests that have been
significantly altered as evidenced by physically altered soils; large areas of charred, dead trees;
dominance or partial dominance by ruderal species such as saltbush (Baccharis halimifolia),
wax myrtle (Myrica cerifera), muscadine grape (Vitis munsoniana), poison ivy (Toxicodendron
radicans) or Brazilian pepper (Schinus terebinthifolius).
Restoration of cypress communities to their original condition on sites where pre-
development hydrology has been restored will likely take many decades. Since the original
canopy cypress were probably about 100 to 200 years old, it will take longer where they have
been eliminated or greatly reduced in numbers such as in the disturbed areas. Where most of
the older cypress stands are still present but have been invaded by palms or hardwoods, it
should take less time, on the order of a few decades. The application of an appropriate fire
regime and/or mechanical clearing would expedite the recovery of these latter sites. Certain
areas are not expected to be restored to their historic condition, such as those located upstream
of the pumps and spreader system. They will likely remain in a drier condition that would

52
support pine flatwoods and wet prairie communities, although the vegetative composition of
these communities will depend on future fire and exotic plant management.
Freshwater Marsh (Mf)
Freshwater marsh communities (FLUCCS: 641 Freshwater Marshes) are low diversity
herbaceous communities dominated by tall, dense stands of grasses and forbs. They have
relatively long hydroperiods (6 to 10 months) and deep wet season water depths (12 to 24
inches) (Table 3). They are found primarily on organic soils. Fires are frequent, and retard the
invasion of woody vegetation. However, marshes can have occasional bald cypress, where
these trees produce less than 30 percent cover. Epiphytes are uncommon due to the lack of
trees. In 1940 there were only a few small marshes in the study area, with most of them located
along the northern boundary of the salt marshes near the coast.
The conversion of sheetflow across the whole width of the SGGE to a point discharge
out of the Faka Union Canal would be expected to have converted all of the freshwater marshes
along the coast to salt marsh. However, it cannot be confirmed from study data whether this has
actually happened, due to the fact that sufficient groundtruthing was not conducted in that part
of the study area. Because of this uncertainty, the 1995 plant community classification has
combined salt and fresh marsh into a single class (Mfs) along the coast (Figure 6). The one
freshwater marsh near the north boundary of the SGGE is still present, even after drainage.
It may be difficult to reestablish the isolated freshwater marshes near the coast that
might have been lost following drainage even if natural sheetflow is returned to the area. If
there are no appropriate seed sources at the sites, their isolation from other marsh seed sources
may make it difficult for the marsh community to recolonize these sites, at least over the short
term. Sea level rise could be an additional impediment to their reestablishment.

53
Wet Prairie (G)
Wet prairies (FLUCCS: 643 Wet Prairies) are high diversity herbaceous communities
dominated by short, open stands of grasses, sedges and forbs. They have relatively short
hydroperiods (2 to 6 months) and shallow wet season water depths (2 to 6 inches) (Table 3).
They are found on mineral soils, including sand, marl, and rock. Fires are frequent, and retard
the invasion of woody vegetation. However, wet prairies can have occasional slash pine (Pinus
elliottii) or bald cypress, where these trees produce less than 30 percent cover. Epiphytes are
uncommon due to the lack of trees. In 1940, wet prairies originally occupied approximately
7,600 acres (Table 2) and were most extensive just upstream of the brackish marshes along the
coast, with smaller scattered areas in the northern and eastern portions of the SGGE (Figure 6).
Since the SGGE has been drained, there has been only a small decrease in their acreage
(Table 2), and a small change in the distribution of wet prairies (Figure 6). They are still most
widespread just upstream of the coastal brackish marshes, with scattered smaller wet prairies
farther north, particularly along the eastern side of SGGE. The lack of change between 1940
and 1995 in the larger, more downstream wet prairies is most likely due to their low elevation
and proximity to the coast, which could reduce the ability of the canals to drain these sites.
There is currently a substantial acreage of wet prairie with palms (Gp) (Table 2) in the
northwest and central portions of the study area on sites that were cypress forest prior to
drainage (Figure 6). These probably represent sites where sabal palm (Sabal palmetto) invaded
following drainage, and subsequent fires eliminated the cypress. There are some small areas of
disturbed wet prairie (Gx) that were cypress forest and are now at least partially dominated by
ruderal species such as saltbush, wax myrtle, muscadine grape, poison ivy, or Brazilian pepper.

54
Again fires have probably eliminated the cypress, and with the drier conditions following
drainage, early succession upland species are now invading these sites.
Since most of the wet prairie acreage is still currently intact in the southern portion of
SGGE, restoration of this habitat to historic conditions should be relatively expeditious once
hydrology has been restored. Some small areas will not be restored, including those upstream
of the pumps and spreader canals and where canals will not be completely removed. Otherwise,
the restored hydrology and an appropriate fire regime (Duever 1984) can be expected to restore
most of the altered SGGE wet prairies to their original condition within a decade.
Pine Flatwoods (P)
Most of the SGGE upland communities present in 1940, about 12,500 acres (Table 2),
were islands of pine flatwoods (FLUCCS: 411Pine Flatwoods) that were scattered throughout
the area and that decreased in both size and aerial coverage as one moved from north to south
through SGGE (Figure 6). Pine flatwoods have an open canopy dominated by slash pine. They
typically have water slightly above (<6 inches) or below ground during the peak of the wet
season and short hydroperiods (<2 months). They can occur on sand or rock substrates.
Compared to hydric pine flatwoods (Ph) (FLUCCS: 625 Hydric Pine Flatwoods), which have
deeper wet season water depths (<6 inches) and a longer hydroperiod (<2 month), mesic pine
flatwoods (Pm) are more elevated with shallower wet season water depths (<2 inches) and a
shorter hydroperiod (<1 month). Mesic flatwoods are more likely to be dominated by a dense
saw palmetto (Serenoa repens), while hydric pine flatwoods are more likely to be dominated by
a dense and diverse herbaceous ground cover of grasses, sedges, and forbs. Pine flatwoods with
an abundance of sabal palms (Pp) in the subcanopy were also common, particularly in the
northern portion of SGGE. The open character of the canopy and shrub strata and the dense

55
groundcover are maintained by intense and frequent fires. Epiphytes are not common due to the
small number of trees and their limited branching, as well as the frequent fires.
Currently there is a moderate reduction in the acreage of mesic and hydric pine
flatwoods (Table 2), although they generally have a very different distribution from where they
occurred in 1940 (Figure 6). The one area where mesic pine flatwoods occurred in both 1940
and 1995 was along both sides of the boundary between fresh and saltwater communities near
the coast in the vicinity of Tamiami Trail. Hydric pine flatwoods have tended to expand into
what were cypress communities in 1940, but where they originally occurred at that time, they
have since been largely replaced by sabal palm or hammock forests.
There has been a substantial increase in the acreage of pine flatwoods that have been
heavily invaded by sabal palms (Pp) which provide 30 percent or more shrub cover (Table2).
These palms are usually of similar size and appear to be even-aged. Dense palm stands occur
on calcareous substrates in both natural uplands and uplands created by drainage (Figure 6).
Otherwise, disturbed pine flatwoods (Px) are limited in extent, but can be identified by the
presence of physically altered soils, large areas of charred, dead trees, and dominance or partial
dominance by ruderal species such as saltbush, wax myrtle, muscadine grape, poison ivy, or
Brazilian pepper.
A small area of dense shrubby saw palmetto (S) (FLUCCS: 321, Palmetto Prairies) is
indicated as being present near the southwestern corner of the canal system (Table 2) (Figure 6).
Slash pines may occur, but are not common, and the ground cover is a sparse mix of mesic
grasses and herbs. This community is essentially mesic pine flatwoods where a high fire
frequency has eliminated or prevented the invasion of pines.
Restoration of pine flatwoods communities to their original condition will likely take
several decades, once natural hydrology has been restored. Since the canopy pines were

56
probably 50 to 100 years old, where they have been eliminated or greatly reduced in numbers, it
will take longer. Where most of the older pine stands are still present, but have been invaded by
palms or hardwoods, it should take less time. The application of an appropriate fire regime
(Duever 1984) and/or mechanical clearing would expedite the recovery of these latter sites.
Certain areas are not expected to be restored, such as those located upstream of the pumps and
spreader system. Also, those areas where canals have not been completely removed will not be
restored.
Hammocks (H)
There was only a very small acreage of hammock in 1940 (Table 2), most likely because
of frequent fires in areas dry enough to support these communities. These communities
typically have water slightly above (<6 inches) or below ground during the peak of the wet
season, and short hydroperiods (<2 months). They can occur on sand or rock substrates. Those
dominated by hardwoods are relatively intolerant of fire, while the sabal palm hammocks are
not only tolerant but thrive with frequent severe fires.
In 1940 there was only a small area of sabal palm hammock (Hp) (FLUCCS: 428,
Cabbage Palm) near the northeast corner of SGGE (Figure 6). This community has an almost
monospecific canopy of palms with few shrubs and little groundcover because of the dense
canopy. Epiphytic ferns are common on sabal trunks.
Numerous small tropical hammocks (Ht) (FLUCCS: 426, Tropical Hardwoods) were
originally found scattered in the more upstream portions of the salt marshes along the coast
(Figure 6), where proximity of the warm Gulf waters moderates freezing temperatures
associated with winter cold fronts. These forested communities are dominated by a variety of
hardwoods with tropical affinities, such as gumbo limbo (Bursera simaruba), mastic

57
(Mastichodendron foetidissimum), or strangler fig (Ficus aurea). Sabal palms and live oaks
(Quercus virginiana) may be common, but are not dominant. Shrub density is moderate and
includes small hardwoods such as myrsine (Rapanea punctata), wild coffee (Psychotria
nervosa), or indigo berry (Randia aculeata), and seedlings of the canopy species. Ground cover
is usually sparse because of the dense canopy. Epiphytic ferns, bromeliads and orchids are
common on the hardwoods and palms.
Following drainage of SGGE, hammocks have expanded from a little over 400 acres in
1940 to over 10,000 acres in 1995 (Table 2). Drainage has created drier conditions suitable for
hammock communities, although the associated more frequent and intense fires would tend to
eliminate them.
The tropical hammocks had more than doubled in acreage from 265 to 689 acres by
1995 (Table 2). Their distribution in SGGE is similar to what it was in 1940, but in addition to
sites they occupied at that time, they are now occupying numerous small islands in the coastal
salt marshes that had previously supported mesic pine flatwoods (Figure 6). This suggests
either a decrease in fire frequency in this area over the last 50 years, or replacement of the less
salt tolerant pines by more salt tolerant tropical hardwoods as a result of the reduction of
freshwater sheetflow following drainage of SGGE.
Most of the new upland sites created as a result of drainage have a shallow soils over
limestone. In addition, drier conditions have promoted the occurrence of frequent and severe
fires. This combination of environmental conditions has created an ideal setting for the rapid
expansion of the sabal palm hammock community from about 55 acres to almost 7,300 acres
(Table 2). This expansion has occurred primarily in the northern and eastern portions of SGGE
in cypress habitats, particularly those that tend to be closer to canals (Figure 6).

58
The lower elevation and wetter hydric hammock (Hh) (FLUCCS: 433, Western
Everglades Hardwoods) and slightly higher elevation but still moist mesic hammock (Hm) were
not recorded as being present in 1940. In 1995, they occupied over 2,700 acres, although mesic
hammock represented only 140 acres (Table 2). They are dominated by hardwoods such as red
maple, sabal palm, live oak on drier sites, or laurel oak (Quercus laurifolia) on wetter sites
(Figure 6). Bald cypress occurs, but is not common. Shrub density is sparse to moderate, and
usually made up of small hardwoods including myrsine, wild coffee, indigo berry, or dahoon
holly (Ilex cassine) and seedlings of the canopy species. Ground cover is variable, often
dominated by ferns. Epiphytic bromeliads are common in trees and ferns are common on palm
trunks. These two communities have primarily replaced cypress communities. The
replacement by hydric hammock of a large area of cypress along the eastern boundary of SGGE
to the south of Prairie Canal, which is probably less affected by drainage, suggests that lack of
fire is also playing a role in this conversion.
Restoration of SGGE would be expected to substantially reduce the coverage of
hammocks, once natural hydrology has been reestablished. However, restoration is likely to
require more than just fixing the hydrology. A restored hydrology could be expected to
eliminate or at least severely stress substantial areas of all of the hammock types, except the
tropical hammocks where water levels have probably not been substantially altered. A
combination of a restored fire regime and some amount of mechanical clearing will probably
also be required to remove hardwoods or palms that have become established either on
shallower wetlands or on pine flatwoods sites.
Coastal Wetlands and Estuaries

59
There has been a substantial decrease in acreage of salt marsh (Ms) (FLUCCS: 642
Saltwater Marshes), and moderate increases in mangrove swamp (Mg) (FLUCCS: 612
Mangrove Swamps) and water (WAT) (FLUCCS: 540 Bays and Estuaries) between 1940 and
1995 at the southern edge of the SGGE study boundary (Table 2). The general northward
advance of mangroves into the salt marshes (Figure 6) is likely to be at least partially due to
reduced freshwater flows from SGGE. However, other factors such as a reduced fire frequency
and sea level rise could also be involved. There are also more lakes within the 1995 mangrove
community than are indicated in the 1940 vegetation map. That could also be associated with
some of these same influences, or may be due to less detailed mapping of the mangrove area in
the 1954 soil survey. Unfortunately, since the MIKE SHE model does not include this area, it is
impossible to try to sort out the relative importance of potential influences. One way to
measure the amount of change in freshwater flows to the estuary (and thus potentially plant
community composition) would be to compare flows along a transect near the southern
boundary of the SGGE hydrology model under natural, current, and restored conditions.
Other Communities
There are several other communities that represent substantial acreages in 1995, but
were not present in 1940. These include urban land, disturbed land, and Brazilian pepper
(Table 2). The acreage of one plant community, coastal uplands (Cu), has not changed over this
same time period.
Urban land (URB) shown in Figure 6 is a residential–resort–marina complex that is not
included in the restoration effort.
Disturbed lands (x) are primarily associated with agricultural activities (Figure 6). Soil
disturbance associated with activities on these lands will make it very difficult to restore natural

60
communities over the short term, but given a return to natural processes, including restoring
hydrology and fire, they are likely to recover over the long term. Mechanical treatment will be
required to eliminate unnatural ground contours and established exotic or nuisance plant
species.
Brazilian pepper (St) (FLUCCS: 422, Brazilian Pepper) forms a nearly complete shrub
layer, sometimes with other trees such as slash pine, bald cypress or sabal palm as canopy
emergents. There is typically little ground cover in these very dense thickets and epiphytes
seldom occur. This community in SGGE occurs primarily as a result of soil disturbance
associated with the canals and adjacent spoil piles (Figure 6). Using spoil material to fill in
portions of the canals and restoring natural hydrology should deter recolonization of Brazilian
pepper in SGGE.
Average Wet Season Water Levels
One set of output from the MIKE SHE model was average wet season water levels from
July 1 through October 1, which is often closely related to hydroperiod (Table 3). These two
hydrologic parameters have been shown to be important determinants of the long-term
distribution of the major types of plant communities in the Big Cypress National Preserve
(Duever 1984). Based on this correspondence between hydroperiod and major plant community
types, the acreage of each community type was estimated from the number of cells (each cell
equals 40 acres) within each range of inundation depths present under natural, current, and
restored conditions.
Results of the MIKE SHE model runs for natural conditions indicated that water depths
appropriate for cypress and coastal marsh communities made up about 55 percent of the SGGE
model area, wet prairie made up about 25 percent, and flatwoods made up about 15 percent

61
(Table 4, Figure 12). Large areas south of I-75 exhibited long hydroperiods and are expected to
have been occupied by cypress forest with islands of wet prairie and pine flatwoods. The
cypress extended further south along the eastern side of SGGE than the western side. There
were similarly deeper areas directly north and south of Tamiami Trail (U.S. 41), predominantly
herbaceous plant communities including wet prairies and saltwater marshes (Figure 6). Based
on assumed water depths for wet prairies, the wet prairies in this area would be expected to be
drier than the hydrology predicted by the model indicated, but the model hydrology was
appropriate for the extensive coastal marshes. The relatively drier upland communities existed
as islands in the vicinity of I-75 and along an east-west belt across the center of SGGE. The
intermediate hydroperiod wet prairies were located as transitions between the cypress and pine
flatwoods communities, and over a large area between the deeper northern cypress and southern
coastal marshes in the southeastern portion of SGGE.
With the canals in place for many years, upland conditions have come to dominate the
vast majority of SGGE. However, until a program of canal maintenance begain in the mid-
1990’s, dense submerged and floating vegetation proliferated in the canals and attenuated the
drainage. It is important to remember that SGGE plant communities are still in transition,
responding to the hydrologic, fire, and edaphic conditions that currently exist, and modified by
the introduction of invasive species to the area. Some mix of pine flatwoods or palm hammocks
will result where fires are frequent, as will a variety of types of hardwood hammocks where
fires are infrequent. About half of the original wet prairies will likely survive in a transition
zone extending from the southern end of the SGGE canal system to the coastal marshes in the
vicinity of Tamiami Trail. The 9,860 acres of open water is an artificially high figure for the
restored condition because it includes the canals, which in the MIKE SHE model are one cell
(1320 feet) wide rather than the generally <100 foot width that they are in reality. Most of the

62
acreage in the remnant canal cells should most appropriately be distributed among the habitats
present in adjacent cells.
Looking at differences between natural and current water levels, the only areas that have
not changed in average depth are areas that were and still are upland or coastal marsh
communities (Figure 18). The upland communities were already dry, while water levels in the
coastal marshes are probably more strongly influenced by Gulf of Mexico water levels than
flows through SGGE. The long hydroperiod cypress areas in the northern part of SGGE were
the most impacted in terms of reduced water levels, while the shallower wetlands, particularly
the large area between the cypress and the coastal marshes, showed intermediate impacts.
The relative magnitude of the changes is reflected in Figures 20 and 21 in the number of
MIKE SHE model cells where water depths have changed to different degrees. The large
increase in drier cells is clearly evident. One change depicted in Figure 21, namely where water
depths have increased by more than 1.5 feet, is actually an artifact of the model because it
includes the canals, which in the model are one cell (1320 feet) wide rather than the generally
<100 foot width that they are in reality.
Modeling indicates that restoration will increase inundation depths substantially from
current conditions in the areas downstream of the pumps, while retaining drained conditions
upstream of the pumps (Figure 14). However, only about half of the historic cypress acreage is
expected to be restored (Table 4) (Figure 20). A portion of the deepwater cypress community
should reestablish south of I-75, but not extend as far south along the eastern side of SGGE as it
had under natural conditions (Figures 14 and 6). At the same time, hydroperiods appropriate for
cypress forest establishment should occur along the western side of SGGE. Most of the wet
prairie acreage should be restored, but not necessarily in the same locations, since much of it is
occupying what was originally cypress habitat. The upland communities will still occupy

63
substantially more area than they did originally, including some of what were originally wet
prairies (Table 2) (Figure 20). Another deviation from natural conditions indicated by the
modeling results is deeper inundation depths just downstream of the pumps (Figure 14).
Pumping may push water into this area faster than the spreader channels can convert it into
overland flow through SGGE. The acreage of open water is artificially high in the restored
condition because it includes the remnant sections of canals, which in the model are one cell
(1320 feet) wide rather than the generally <100 foot width that they are in reality. Most of the
acreage in the remnant canal cells should most appropriately be distributed among the habitats
present adjacent cells (Figure 14).
Large differences in water levels between the restored and natural conditions should be
limited to a few distinct areas (Figure 19). Most of the current uplands upstream of the pumps
are drained wetlands. Palms are a dominant feature in this area, and there has been some
discussion about removal of many of them. However, given the likely soil characteristics that
contributed to their original establishment, they may reestablish in the absence of restored
hydrology. A wetter than expected area located downstream of each of the pumps was
discussed earlier. Also, the drier than expected area along most of the eastern portion of SGGE
appears to be the result of incomplete restoration of flows.
The relative magnitude of these changes from natural to restored conditions are reflected
in the number of MIKE SHE model cells where inundation depths have changed to different
degrees (Figure 21). This indicates a substantial return to natural conditions within SGGE
(Table 4). Again, the relatively large number of cells representing water depths of more than
1.5 feet is actually an artifact of the current model because it includes the canals, which in the
model are one cell (1320 feet) wide rather than the <100 foot width that they are in reality.

64
Maximum Annual One-Day Water Levels
Another set of output from the MIKE SHE model was the maximum one-day water
depths during an average year throughout SGGE. These were useful for identifying the general
presence and location of areas that may be important to terrestrial wildlife since they should
remain above water even during the highest one-day water levels expected during an average
year under each of the three temporal conditions.
Modeling results showed expansion of the areas of greater inundation for maximum one-
day depths under natural conditions, which reduced but did not eliminate any of the shallow
water or upland areas normally present (Figures 12 and 15). Annual maximum one-day water
depths under current conditions approximated what would be expected for average wet season
water depths under natural conditions (Figures 12 and 16). Restoration produced annual
maximum one-day water depths that were deeper and more extensive than under natural
conditions because of the increased pumping that would be occurring at these times (Figures 15
and 17). However, while the shallow water and upland areas were reduced substantially in size,
none were completely eliminated, and those in the vicinity of I-75 were much more extensive.
Thus, it appears that while terrestrial wildlife might be stressed somewhat by temporarily
reduced habitat availability during normal annual flooding, it is unlikely that their populations
would be significantly reduced due to a lack of upland refugia. From another perspective, the
idea of concentrating terrestrial wildlife near I-75 would seem undesirable, if it were not for the
presence of wildlife fencing along and underpasses under the road.

65
TIMEFRAMES FOR PLANT COMMUNITY RESPONSE TO RESTORATION
It is important to remember that SGGE plant communities are still in transition from
their natural condition. They are by no means stable communities that can be expected to
maintain their current characteristics over the long term. In the absence of restoration, they will
succeed towards an ecosystem that will be created in response to the combination of hydrologic,
fire, and edaphic conditions that currently exist, as modified by the mix of invasive species that
are coming to dominate parts of the area. Thus, it is unrealistic to plan for the future of SGGE
and its plant and animal populations on the assumption that in the absence of restoration, what
currently exists is its likely future condition, with some modification based on active
management. It is unlikely that fire has yet finished altering plant communities that existed
prior to drainage. It is also unlikely that the spread and structural development of the palm
communities has yet stabilized. Thus, regardless of what restoration activities may or may not
be planned for SGGE, one must look at the current ecosystem and the processes affecting it
from a long-term perspective to evaluate what will likely be the final result of any given
alternative. This perspective will allow for better decisions about whether attempting to
maintain what currently exists in SGGE, or portions of it, is feasible or will accomplish the
restoration goals.
The long-term goal of the proposed restoration is to return the hydrology of the area
downstream of the pumps and spreader channels to a condition comparable to that which
existed in SGGE prior to drainage. The combination of a restored hydrologic regime, a restored
fire regime, and an appropriate exotic vegetation control program can be expected to return
most of the SGGE to its pre-drainage character, including the plant communities and wildlife

66
that it supported at that time. This will mean that those new plant and animal communities that
have developed under the current hydrologic and fire regimes, but were not present prior to
drainage, will be eliminated during the decades following restoration and will be replaced by
communities more similar to those present prior to drainage. In addition, extant plant and
animal communities that also existed in SGGE prior to construction of the canal system, but
have become established in new areas as a result of drainage, will likely return to a more
historic distribution pattern.
However, these changes will not happen in a few years. The timeframe for restoration
of the original communities will be variable depending on the type of community to be
reestablished and the degree to which it has been disturbed, particularly by severe fires. Loss of
the older forest trees will require many decades to replace, during which time the sites will be
dominated by earlier successional communities, most likely willow in the cypress swamps and a
mixture of wax myrtle and herbaceous species in the pine flatwoods. Lost organic soils in some
of the deeper wetlands will require centuries to replace, and in the meantime these sites will be
dominated by either deeper wetland communities, such as pop ash or pond apple sloughs, or
open water.
It is also important to be aware that during these transitions following hydrologic
restoration, much of the upland vegetation that colonized the original wetlands will die, and it
may take up to a decade to for the majority of the woody material to decompose. Where the
originally dominant species have been eliminated from a site, there can be substantial lags in the
time it takes for seeds of these species to get to a restored site to successfully germinate, survive
and grow to a size where they again dominate the site. Thus, the plant communities on these
sites may actually look worse than they did prior to restoration for some time before they start

67
to develop their desired character. Also, during this period it is important to monitor for
invasive plant species and eradicate them while their populations are still small.

68
IMPLICATIONS FOR WILDLIFE AND LISTED SPECIES
The presence and health of wildlife populations are a function of the habitats available
to support them. Given the dramatic changes in hydrologic and fire regimes in SGGE over the
past fifty years, current wildlife populations in SGGE have undoubtedly changed from those
present in the area during pre-development conditions. In these types of situations, wildlife
populations usually decrease in natural diversity with the loss of specialist species adapted to
relatively stable environmental conditions and more mature plant communities. The greatly
increased level of disturbance associated with the road and canal system has most likely
resulted in an increase in species that are widespread and abundant over much of southwest
Florida as a result of landscape alterations that are occurring throughout the area. A preliminary
list of wildlife recently recorded from Picayune Strand State Forest (including both SGGE and
the adjacent Belle Meade Conservation and Recreation Lands project) is found in Appendix E
of this report.
Much of the historic SGGE wetland habitat is being replaced by upland communities,
most of which are currently in early stages of the transition and thus appear to be in a very
disturbed condition. This has obvious implications for wetland dependent species such as
amphibians, otters, and wading birds and the forage fish and aquatic invertebrates upon which
they depend, all of whose populations have likely been greatly reduced in SGGE since drainage.
Some species have undoubtedly become more abundant as upland habitats have become
more widespread in SGGE. However, at least some of these species may not be able to tolerate
conditions in some of the new upland habitats, such as the intensity of the fires that are
occurring as a result of the steadily increasing abundance of palms. Alternatively, the lack of
fire in pine flatwoods portions of SGGE is allowing the development of dense woody vegetation

69
that is not suitable for species adapted to the open character of pine flatwoods with their dense
herbaceous groundcover.
The most critically endangered animal in the SGGE study area is the Florida panther
(Felis concolor coryi). Important characteristics of panther habitat are areas with little human
activity, and habitat for prey species, particularly deer and hogs. While some researchers have
reported that panthers prefer forested habitats, others have suggested they utilize a wider range
of habitats. The latter would seem to be more consistent with the distribution of their prey.
Deer are known to be an edge species; that is, they do best in areas where there is extensive
contact between forested and open herbaceous communities. Hogs are another favored prey
species. They seem to utilize all of the natural plant communities in SGGE, particularly the
receding wetland edges during the dry season. Some restored SGGE wetlands may not provide
ideal habitat for panthers because of extensive areas of deeper water; however, the removal of a
continuous road system in these areas of increased hydroperiod will benefit the panther through
the significantly reduced human use of the area. Thus, it would be reasonable to expect an
increase in panther use and perhaps panther breeding activity in SGGE following restoration.
The Big Cypress fox squirrel (Scuirus niger avicennia) and the red-cockaded
woodpecker (Picoides borealis) are listed species that would ordinarily benefit from the
increase in upland habitat. However, the lack of fire in some areas is expanding the distribution
of hammock into pine flatwoods, while in other areas, the increase in palms and the associated
high fire intensities may eliminate hardwood hammock and pine flatwoods communities that
might otherwise provide them with good habitat.
Restoration could also benefit the wood stork by providing additional foraging habitat
within a reasonable distance of the large rookery at Corkscrew Swamp. Breeding success of

70
this species in South Florida has declined drastically over the last 50 years, mainly due to the
loss of seasonal wetlands.
The significantly reduced duration of flooding in SGGE has likely had dramatic impacts
on tropical vegetation due to the loss of freeze protection that results from the moderating
influence of standing water when winter cold fronts pass through the area. This could be
particularly important to listed epiphytic orchids, bromeliads, and ferns, which are extremely
vulnerable to freezes. Rooted tropical vegetation would also be affected by loss of aboveground
stems and leaves, but most are likely to resprout from their roots, although with repeated
freezes, they too may eventually succumb.

71
OTHER CONSIDERATIONS
Water Quality
There is some concern about the quality of water coming down canals from NGGE,
particularly in terms of phosphorus input from the increasing numbers of septic tanks in the
area. This and nutrients derived from vegetation killed as a result of restoration efforts could
potentially encourage the growth of nuisance plant species. It will be important to monitor
SGGE for nuisance species, e.g. cattails and primrose willow, and provide control before they
come to dominate sites. If phosphorus levels become sufficiently high as NGGE develops, it
may become necessary to institute some sort of treatment of canal inflows to protect the
character of SGGE’s native communities. One option would be to identify a “water treatment
area”, which could function as a buffer between the canal inflows and the portion of SGGE that
is to be restored to natural condition. The input of nutrients from dying vegetation should be a
temporary problem manageable by mechanical and/or herbicide treatment until the native
community has become established.
Problems with Adequacy of the Model
The MIKE SHE model has produced useful information in evaluating the likely changes
in hydrology resulting from the proposed engineering redesign, relative to both natural and
current conditions in SGGE. However, the less than perfect match between the spatial
distribution of hydroperiods predicted by the model and the existing knowledge of plant
community distributions under natural and current conditions indicates that the model does not
adequately represent real world hydrology in SGGE.

72
One problem is uncertainty about the adequacy of the topographic data available when
this analysis was done. Future analysis of new topographic data, available by the publication
date of this report, should either increase confidence in the current topographic data or provide
improved data.
Another potentially significant problem is the use of fixed water levels in the boundary
cells. Current values for each boundary cell are calculated by a version of the MIKE SHE
model using a larger geographic area than SGGE, which is intended to minimize water depth
inaccuracies along the SGGE boundary. However, daily output for the 365-day year from the
larger model is averaged to produce a single value for each SGGE boundary cells, and this
average is used as a constant boundary water level in the SGGE model runs. Thus, compared to
interior SGGE water levels during wet periods, water levels at the boundary are relatively low,
and during low water periods, they are relatively high. Since water flows downhill, the result is
to produce more average water levels, at least in portions of SGGE, than occur in the real world.
Once a MIKE SHE model of the entire Big Cypress Basin is completed, it should allow model
runs where the boundaries of SGGE are remote from the MIKE SHE model boundaries.
It is also possible that our understanding of plant community – hydrology relationships
for other areas may not be directly applicable to SGGE, and may require some modification to
adequately represent how these processes operate in SGGE. Hopefully, monitoring associated
with the restoration will help sort out these kinds of problems.
Roads
The current restoration design removes most of the roads within SGGE to help restore
natural flowways. Under natural conditions, sheetflow during the wet season occurred across
virtually the whole SGGE, interrupted only by scattered upland islands.

73
Adjacent Lands
Most of the lands surrounding SGGE are in public ownership or are scheduled for
acquisition. The primary purpose of their acquisition has been for conservation of their natural
resources. Other than some outparcels in the Belle Meade tract and along US 41, the only
private lands are found along the western portion of the northern boundary. The planned
restoration will significantly help to restore the hydrologic and fire regimes and thus the
associated biotic resources on all of the surrounding public lands, while maintaining current
levels of flood protection for the private lands to the north.
Water table gradients from SGGE into Fakahatchee Strand have been monitored for over
ten years. Data from these monitoring wells and an earlier United States Geological Survey
study (Swayze and McPherson, 1977) have shown that water table drawdowns associated with
the SGGE canals have extended over two miles into Fakahatchee Strand. The plant
communities in the areas affected by this drawdown have been severely impacted, most
obviously by wildfires that have completely changed the character of these lands, particularly as
one gets closer to the easternmost SGGE canal. Similar impacts are most likely occurring on
the Belle Meade tract and the Florida Panther National Wildlife Refuge. Changes on the Ten
Thousand Islands Refuge are more likely associated with alterations in salinity due to reduced
overland freshwater flows that are currently diverted to the Faka Union Canal. Although not
documented at this time, it is likely that the distribution of plant and animal communities within
this freshwater – saline transition zone have been modified by drainage associated with the
SGGE canal system.

74
RECOMMENDATIONS
Restoration and Management
The incomplete restoration of natural conditions was intentional in the northwest corner
of SGGE to retain some upland habitat for terrestrial wildlife and listed species such as the
panther. A significant loss of upland plant communities, particularly pinelands, has occurred
regionally. However, the wetter conditions predicted by the MIKE SHE model immediately
downstream of the pumps and along most of the western side of SGGE are considered
undesirable. Exploration of possible modifications in the current restoration design has
suggested several possibilities. The largest change would be to redesign the spreader system so
that a much larger proportion of the water is moved farther east. This would help to relieve the
excess water levels to the west and an apparent lack of sufficient water to the east. Another
separate consideration would be to not build the pump on Merritt Canal. The Florida Panther
National Wildlife Refuge is located immediately upstream of this canal, which U.S. Fish and
Wildlife Service staff believe is excessively draining the Refuge. Thus, it appears that merely
installing plugs along the entire length of the Merritt Canal without pumping would
significantly benefit the Refuge without creating any adverse impacts in the area.
One of the important considerations about the restoration of SGGE is that while a
restored hydrology is crucial to meeting our goals, it is not sufficient to meeting them. As has
been stated repeatedly, an appropriate fire regime was a major factor in creating and
maintaining the natural communities, and it will be necessary to bring them back. There is also
the option of making a management decision to implement a different fire regime in parts or all
of SGGE, if considered appropriate to meet certain objectives. One example might be to reduce

75
the fire frequency to allow for the presence of a greater number of mesic and hydric hammocks
or merely a larger number of hardwoods in the pine and cypress communities, but at the
expense of herbaceous species and high-quality browse.
Another important consideration is the problem of invasive exotic and native plants.
While an improved hydrology will help with certain problem species at certain sites, herbicides
and mechanical control programs will need to be instituted to deal with some species and will
also be necessary in some locations where hydrology cannot do the whole job. These programs
will also be necessary where hydrologic restoration is not planned, such as in the northwestern
corner of SGGE or along remaining canal sections. It will be important to work to minimize the
chances of bringing new invasive species in during the restoration effort and to be prepared to
deal quickly with any that might appear. Problem species that can be carried to a site on heavy
equipment include cogon grass, torpedo grass, elephant grass, and climbing fern, among many
others.
Monitoring Restoration Success
The Interagency Technical Committee (Committee) assisting the District and NRCS on
this study has outlined recommendations for the monitoring of restoration effectiveness in both
the terrestrial/freshwater ecosystems in and around the study area and the estuarine ecosystem
of the Ten Thousand Islands. Recommendations are divided into fours categories:
Hydrological, Water Quality, Fish and Wildlife Resources, and Listed Species.
Recommendations are numbered for ease of reference and do not indicate priority.
Hydrological

76
1. Continue collection of baseline well data from Watershed Planning Assistance Study.
2. Establish new monitoring wells:
along four new east/west well transects with approximately six wells per transect
distributed among major community types, and twelve monitoring recorders. One
line of wells would be located north of the spreader swales, and one located
immediately below. The other two transects should be extensions of existing
Fakahatchee Strand State Preserve transects.
at six new locations in North Golden Gate Estates (to be determined).
3. Coordinate/calibrate all available well/water level monitoring data in the vicinity of the
SGGE, including:
Tamiami Trail Culverts and Plugs Critical Project.
Belle Meade tract of Picayune State Forest.
Ten Thousand Islands and Panther National Wildlife Refuges.
Fakahatchee Strand State Preserve.
Big Cypress Basin surface and groundwater wells in SGGE and adjacent watersheds.
U. S. Geological Survey wells.
main conveyance canals and or weir structures.
4. Add weather station in SGGE.
5. Monitor post-restoration conditions in estuarine environments and compare with
hydrologic model predictions:
Analyze the data obtained to compare water quality among estuarine spatial
homologues (i.e., geomorphologic congruous points on neighboring estuaries along
estuarine fresh to marine water gradients) with model predictions.
In cooperation with projects being developed in other watersheds by the U.S.

77
Geological Survey and the District, develop hydrological model modules that can
convert freshwater discharge measurements to salinity measurements.
Monitor, identify, and quantify freshwater fluxes into estuaries by using surface and
groundwater geochemistry, potentially using isotopic and dissolved inorganic carbon
water-characterization techniques to identify different surface and groundwater
sources.
Develop a monitoring plan for surface and groundwater levels similar to that already
developed in the freshwater portions of the SGGE project; for terrestrial habitats
within the downstream estuarine environment, to include water table elevations,
surface water depths, and hydroperiods.
Water Quality
1. Continue collection of existing baseline water quality data at established Collier County
water quality sampling sites, including those established by the County and the
Southwest Florida Water Quality Consortium.
2. Add additional water quality monitoring sites (to be proposed).
3. At a minimum, monitor and standardize monitoring methodologies and lab analyses for
phosphorus, organochlorines, pH, temperature, and conductivity (salinity) for each site.
Where data needs are identified, monitor chlorophyll a, fecal coliform, and other
nutrients or heavy metals.
4. Conduct water quality monitoring on a quarterly basis at minimum and monthly where
data needs are identified.
5. Monitor and compare salinity and other water quality parameters from altered and

78
unaffected neighboring bays:
Continue collection of existing baseline water quality data at Blackwater, Faka-
Union, and Fakahatchee Bays.
Establish additional water quality monitoring stations in locations further upstream
in Blackwater, Faka-Union, Fakahatchee, and Pumpkin Bays.
Establish an additional water quality monitoring station in Pumpkin Bay.
Establish spatial homologues along the unaltered Fakahatchee estuary to identify and
monitor restoration targets at the same homologue within altered estuaries.
Sample water quality parameters in sheetflow ecosystem (as opposed to canals)
during periods of flow.
After the project area is surveyed for contaminants, monitor the success of recovery
of contaminated sites if remediation is recommended.
Fish and Wildlife Resources
1. Continue existing baseline wildlife studies for a minimum of three years including all
studies currently contracted through the District, studies being conducted through the
Florida Division of Forestry, and breeding bird surveys (point counts). Prioritize frog
and herpetofauna surveys for 2002 wet season. The SGGE Project Development Team
authorized under the CERP should assess first year data to see where methodologies can
be improved, parameters added or modified, or locations of data collection modified to
reflect restoration monitoring goals. Sampling locations should be reviewed to assure
that sites will be accessible post-restoration.
2. Continue aerial wading bird studies. Conduct year-round baseline study. Begin post-

79
restoration data collection after one full growing season, conduct for three consecutive
years, then at less frequent intervals.
3. Add new baseline wildlife studies where appropriate to meet restoration goals.
Recommended studies include aquatic macroinvertebrates, apple snails, alligators,
insects, exotic fish, and epiphytes.
4. Continue existing Big Cypress Basin baseline vegetation studies. Initiate post-
restoration monitoring after one full growing season, and conduct for three consecutive
years, then at less frequent intervals. Sampling locations should be reviewed to assure
that sites will be accessible post-restoration.
5. Continue timber cruise surveys by Florida Division of Forestry.
6. Monitor biologic response of estuarine aquatic ecosystems.
Continue baseline data studies of oyster health, growth, recruitment, and distribution
for Blackwater and Faka-Union estuaries.
Expand baseline oyster studies to Fakahatchee and Pumpkin Bays.
Continue baseline studies of steno-and euryhaline crab populations in Blackwater,
Faka-Union, and Fakahatchee Bays.
Expand baseline studies of steno-and euryhaline crab populations to Pumpkin Bay.
Replicate transient fish population studies (Browder et al. 1986, 1987, 1988) for Ten
Thousand Islands and associated bay systems before project restoration. Repeat
studies post-restoration.
Continue fish trawl monitoring project being conducted by Rookery Bay National
Estuarine Research Reserve staff (O’Donnell and Shirley, unpublished data).
Map distribution of sea grasses in Faka-Union, Fakahatchee, Pumpkin, and
Blackwater estuaries pre- and post-restoration.

80
7. Monitor biologic response of intertidally influenced terrestrial ecosystems.
Monitor aerial coverage and degree of fragmentation of salt marsh and mangrove
habitat to establish changes in ecotones pre-and post-restoration.
Continue existing monitoring and expand baseline vegetative transects in salt marsh
ecotones.
Establish pre-restoration baseline studies for fish species in upper estuarine areas and
monitor changes in fish species composition and abundance post-restoration.
8. Monitor and document Division of Forestry fire regimes for effects on plant
communities.
Listed Species
1. Monitor state-listed species of concern including state-listed wading birds, the Florida
black bear, and Big Cypress fox squirrel, to determine the effects of the restoration.
2. Monitor the endangered Florida panther population to determine the effects of
restoration on panther habitat and the panther population.
Assess telemetry data on an annual basis for potential changes in patterns of panther
habitat use, number of panthers utilizing SGGE area, and demography of the panther
population utilizing the area.
Coordinate with the Naples office of the Florida Fish and Wildlife Conservation
Commission to determine if panther denning activities are occurring in potential
restoration construction project areas.
Establish a baseline panther prey base study pre-restoration followed by a prey base
study one year after restoration is completed and on five-year intervals thereafter.

81
3. Monitor the endangered wood stork and snail kite populations to determine the effects of
the restoration on foraging habitat productivity.
Continue aerial wading bird studies. Conduct year-round baseline study. Begin
post-restoration surveys after one full growing season, conduct for three consecutive
years, then at less frequent intervals.
4. Monitor the endangered Florida manatee population and manatee critical habitat.
Continue to monitor manatees that utilize the affected project area using annual
surveys and existing and potentially additional telemetry studies.
Establish baseline sea grass surveys in Faka-Union Bay at a minimum, and in
Blackwater, Fakahatchee, and Pumpkin Bays if historical sea grass presence is
established.
5. Monitor the concentration of manatees at the Port of the Islands basin and within Faka-
Union canal to determine the effects of the restoration on warm-water refugia at Port of
the Islands.
Establish and monitor baseline information for the Port of the Islands basin
(including weir) and Faka-Union canal including water depth, temperature, and
surface water quantity and quality. Continue monitoring throughout construction of
restoration project and post-restoration at a frequency based on effect of the project.
6. Monitor the endangered American crocodile population for effects of the restoration.
Continue existing crocodile surveys by the University of Florida in affected project
estuaries post-restoration at a frequency based on the effect of the project.
7. Monitor the red-cockaded woodpecker population within and adjacent to the project.
Continue monitoring of the red-cockaded woodpecker population within the adjacent
Belle Meade portion of Picayune Strand State Forest, Fakahatchee Strand State

82
Preserve and Big Cypress Preserve.
Establish a baseline survey for red-cockaded woodpeckers within the project
boundaries. Continue monitoring for location of red-cockaded woodpeckers on at
least three-year intervals after restoration.
Conduct a baseline red-cockaded woodpecker habitat suitability assessment. Re-
assess habitat suitability on five-year intervals after restoration.

83
LITERATURE CITED Abbott, G.C. and A.K. Nath. 1996. Hydrologic Restoration of Southern Golden Gate Estates Conceptual Plan. South Florida Water Management District, Naples, Florida. 206 pp. plus appendices. Black, Crow, and Eidsness, Inc. 1974. Hydrologic Study of the G. A. C. Canal Network. Gainesville, FL. Project no. 449-73-53. Browder, J.A., A. Dragovich, J. Tashire, E. Coleman-Duffie, C. Foltz, and J. Zweifel. 1986. A comparison of biological abundances in three adjacent bay systems downstream from the Golden Gate Estates canal system. NOAA Tech. Memo. NMFS-SEFC-185. Browder, J.A., J. Tashiro, E. Coleman-Duffie, and A. Rosenthal. 1988. Comparison of ichthyoplankton concentrations and water transport in three bay systems of the Ten Thousand Islands affected by the Golden Gate Estates canal system. Final Report to the South Florida Water Management District Contract No. 156-M88-0172-A3. Browder, J.A., and J.D. Wang. 1987. Modeling water management effects on marine resource abundances in Faka Union Bay, Florida. Proc. Symp. on Ecol. and Conserv. Wetlands of the Usumacinta and Grijalva Delta, Villahermosa, Tabasco, Mexico. Duever, M.J., J.E. Carlson, and L.A. Riopelle. 1975. Ecosystem analyses at Corkscrew Swamp. Pages 627-725 in Cypress Wetlands for Water Management, Recycling and Conservation. H.T. Odum, K.C. Ewel, J.W. Ordway, and M.K. Johnston (Eds.). Center for Wetlands, University of Florida, Gainesville. Duever, M.J. 1984. Environmental factors controlling plant communities of the Big Cypress Swamp. Pages 127-137 in Environments of South Florida: Past and Present II. P.J. Gleason (Ed.). Miami Geological Society, Coral Gables, Florida. Duever, M.J., et al. 1986. The Big Cypress National Preserve. National Audubon Society, New York, N.Y. Florida Department of Transportation. 1999. Florida land use, cover and forms classification system. Florida Department of Transportation, Tallahassee. 91 pp. Gore, R. H. 1988. Natural Resources Management in the Coastal, Inland, and Upland Zones of Collier County: Summary of Data Analyses and Program Recommendations. Technical report No. 88-1. Collier County Natural Resources Management Department. 173 pp. Kenner, W. E. 1966. Runoff in Florida. Map Series No. 22, U. S. Geological Survey.
84
Leighty, R.G., M.B. Marco, G.A. Swenson, R.E. Caldwell, J.R. Henderson, O.C. Olson, and G.C. Willson. 1954. Soil Survey (Detailed-Reconnaissance) of Collier County, Florida. USDA Soil Conservation Service. Luidahl, K., D. J. Belz, L. Carey, R. W. Drew, S. Fisher, and R. Pate. 1998. Soil Survey of Collier County Area, Florida. USDA Natural Resources Conservation Service. Refsgaard, J.C. and Storm, B. 1995. MIKE SHE, in V.P.Singh (Ed.), Computer Models of Watershed Hydrology. Swayze, L.J. and B.F. McPherson. 1977. The effects of the Faka Union Canal System on water levels in the Fakahatchee Strand, Collier County, Florida. United States Geological Survey Water Resources Investigations 77-61. Tomlinson, P. B. 1984. Personal Communication. U.S. Army Corps of Engineers, Jacksonville District. 1986. Golden Gate Estates, Collier County, Final Fesibility Report. Wade, D. J. Ewel, and R. Hofstetter. 1980. Fire in South Florida Ecosystems. Southeastern Forest Experiment Station, Asheville, NC. 125 pp.