southern nevada health district survey explores 35 aspects of employee ... • benchmark southern...
TRANSCRIPT

SHRM®
PEOPLEINSIGHT
SOUTHERN NEVADA HEALTH DISTRICTJuly 2016 • Employee Job Satisfaction and Engagement Survey Report

About People InSightOur ever-changing world has made organizations look at their business sustainability protocols and thepeople behind their business in different ways. To help retain top performers, organizations need todevelop talent management strategies that are based on their employee demographic profile and theirspecific needs. Through the SHRM People InSight service, employers can gauge how satisfied andengaged their employees are and benchmark their organizations against other U.S. employers. TheSociety for Human Resource Management (SHRM) has been conducting an annual employee jobsatisfaction survey since 2002. The survey explores 35 aspects of employee job satisfaction divided intofour topic areas—career development, relationship with management, compensation and benefits, andwork environment. In 2011, the survey was expanded to include multiple aspects of employee
engagement based on the engagement theory and researchi. SHRM normative data of U.S. employeesare based on the responses of 10,000 employees encompassing 22 major industries.
About SHRMThe Society for Human Resource Management (SHRM) is the world’s largest association devoted to humanresource management. Representing more than 250,000 members in over 140 countries, the Societyserves the needs of HR professionals and advances the interests of the HR profession. Founded in 1948,SHRM has more than 575 affiliated chapters within the United States and subsidiary offices in China andIndia. Visit SHRM Online at www.shrm.org.
USASHRM1800 Duke StreetAlexandria, VA 22314Phone: (800) 283-7476Fax: (703) 535-6432E-mail: [email protected]
ChinaBeijing Representative OfficeSHRM Corporation5/F, South Block, Tower CRaycom Info Tech ParkNo.2, Kexueyuan South RoadZhongguancun, Haidian DistrictBeijing, 100190ChinaTel: +86-10-59822093 / 59822146Fax: +86-10-59822588
IndiaStrategic Human Resource Management India,Private Limited702, 7th Floor,Raheja Towers,Plot C- 62, G Block,Bandra Kurla Complex, Bandra (E)Mumbai 400051MaharashtraTel: +91-22-42472000Fax: +91-22-42472010
OnlineSHRM Online: www.shrm.orgSHRM People InSight: www.shrm.org/peopleinsightSHRM Research: www.shrm.org/researchSHRM Survey Findings: www.shrm.org/surveys
Questions about the SHRM People InSightServiceCall: (703) 535-6295E-mail: [email protected]
People InSight: Employee Job Satisfaction and Engagement Survey Report 2

ABOUT PEOPLE INSIGHT 2
ABOUT SHRM 2
EXECUTIVE SUMMARY 4
SURVEY RESULTS
Career Development 17
Employee Relationship with Management 20
Compensation and Benefits 22
Work Environment 25
Engagement Opinions 28
Engagement Behaviors 30
Conditions for Engagement 32
Comparisons Southern Nevada Health District vs. Other U.S. Employees 35
CONCLUSIONS: LOOKING AHEAD AND NEXT STEPS 38
METHODOLOGY 41
APPENDIX A 43Job Satisfaction and Engagement Aspects by Departments
APPENDIX B 56Elements of Job Satisfaction and Engagement
CONTENTS
People InSight: Employee Job Satisfaction and Engagement Survey Report 3

EXECUTIVE SUMMARY
Survey Objectives
• Understand elements important to employees’ job satisfaction and engagement at SouthernNevada Health District.
• Identify Southern Nevada Health District’s strengths and opportunities.• Benchmark Southern Nevada Health District’s results against SHRM's database of U.S.
employees, organization size by industry, sub industry when applicable and overall industry.
When reviewing Tables 1, 2 and 3, compare the responses of the employees in your organization to theresponses of other U.S. employees in SHRM’s database. This will provide an overall assessment of youremployees against national norms. It is important, however, to also evaluate your employees alongsideemployees in similar industry and staff size to your organization. While comparing your organization to thenational norms will provide you with useful information, you will also need to take into account thesatisfaction and engagement levels of employees of competitors in your industry. Small differences shouldnot be over-interpreted. Blank cells in tables and figures throughout the report indicate that the item wasnot applicable to your organization.
Overall Employee Job SatisfactionMost management experts and business leaders agree that when employee satisfaction is very high, ittranslates into higher levels of performance, commitment and retention for organizations. Employees whoare satisfied will generally rate factors that contribute to their job satisfaction as important or veryimportant.
Your Organization's Overall EmployeeJob Satisfaction
2016 77% 10% 13%2015 75% 10% 15%
Other U.S. Employees inSHRM Database
71% 14% 15%
Satisfied Neutral DissatisfiedNote: Satisfied represents those who answered "very satisfied" and "somewhat satisfied." Dissatisfied represents those whoanswered "very dissatisfied" and "somewhat dissatisfied."
Compared with U.S. employees, employees at your organization are more satisfied overall.
People InSight: Employee Job Satisfaction and Engagement Survey Report 4

EXECUTIVE SUMMARY
Table 1: Aspects of Employee Job Satisfaction
YourEmployees
2016 | 2015
Other U.S.Employees
Level(above, below, or same
as other U.S.employees)
OrganizationStaff Size by
Industry
Administration ofhuman resource
programs
Publicadministration
CAREER DEVELOPMENT
Career advancement opportunities 38% 32% 50% -12% 21% 49% 43%
Career development opportunities 42% 33% 52% -10% 41% 56% 47%
Job-specific training 49% 46% 56% -7% 37% 54% 54%
Networking 47% 38% 51% -4% 22% 54% 47%
Opportunities to use skills and abilities 76% 71% 73% +3% 55% 78% 71%
Paid training and tuitionreimbursement programs 42% 35% 52% -10% 33% 42% 50%
Organization's commitment toprofessional development 39% 30% 53% -14% 20% 51% 48%
RELATIONSHIP WITH MANAGEMENT
Communication between employeesand senior management 46% 38% 57% -11% 30% 62% 50%
Note: Table represents those who answered “very satisfied” and “somewhat satisfied.” Percentages are based on a scale where 1 = “very dissatisfied” and 5 = “very satisfied.”
People InSight: Employee Job Satisfaction and Engagement Survey Report 5

EXECUTIVE SUMMARY
YourEmployees
2016 | 2015
Other U.S.Employees
Level(above, below, or same
as other U.S.employees)
OrganizationStaff Size by
Industry
Administration ofhuman resource
programs
Publicadministration
Autonomy and independence 72% 62% 67% +5% 55% 60% 65%
Management recognition of employeejob performance 47% 45% 58% -11% 45% 54% 48%
Relationship with immediatesupervisor 79% 77% 72% +7% 65% 78% 67%
COMPENSATION
Compensation/pay 71% 72% 60% +11% 50% 65% 63%
Base rate of pay 68% 70% 59% +9% 50% 64% 61%
Being paid competitively with the localmarket 65% 68% 55% +10% 42% 54% 54%
BENEFITS
Benefits 89% 87% 63% +26% 56% 76% 74%
Health care/medical benefits 85% 86% 63% +22% 67% 84% 77%
Family-friendly benefits 65% 56% 53% +12% 47% 47% 56%
Note: Table represents those who answered “very satisfied” and “somewhat satisfied.” Percentages are based on a scale where 1 = “very dissatisfied” and 5 = “very satisfied.”
People InSight: Employee Job Satisfaction and Engagement Survey Report 6

EXECUTIVE SUMMARY
YourEmployees
2016 | 2015
Other U.S.Employees
Level(above, below, or same
as other U.S.employees)
OrganizationStaff Size by
Industry
Administration ofhuman resource
programs
Publicadministration
Paid time off 91% 91% 70% +21% 67% 87% 85%
Defined contribution plans(e.g., 401(k), 403(b)) 72% 69% 64% +8% 59% 71% 71%
Defined benefit pension plan 89% 89% 55% +34% 60% 79% 72%
Flexibility to balance life and workissues 56% 45% 68% -12% 40% 68% 62%
WORK ENVIRONMENT
Feeling safe in the work environment 66% 66% 79% -13% 85% 82% 78%
Job security 70% 52% 69% +1% 80% 85% 81%
Meaningfulness of job 78% 75% 70% +8% 70% 77% 73%
Organization's commitment tocorporate social responsibility 45% 32% 55% -10% 35% 49% 50%
Organization's commitment to a"green" workplace 40% 27% 48% -8% 37% 37% 44%
Organization's financial stability 55% 31% 67% -12% 53% 67% 61%
Note: Table represents those who answered “very satisfied” and “somewhat satisfied.” Percentages are based on a scale where 1 = “very dissatisfied” and 5 = “very satisfied.”
People InSight: Employee Job Satisfaction and Engagement Survey Report 7
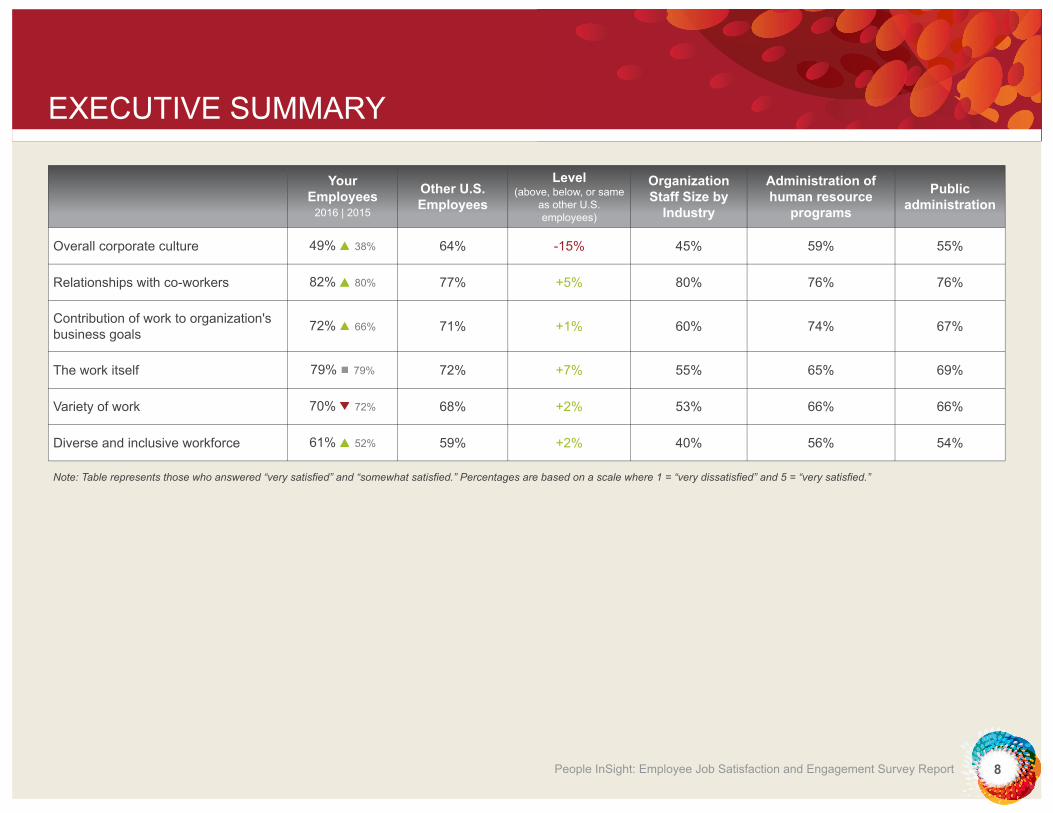
EXECUTIVE SUMMARY
YourEmployees
2016 | 2015
Other U.S.Employees
Level(above, below, or same
as other U.S.employees)
OrganizationStaff Size by
Industry
Administration ofhuman resource
programs
Publicadministration
Overall corporate culture 49% 38% 64% -15% 45% 59% 55%
Relationships with co-workers 82% 80% 77% +5% 80% 76% 76%
Contribution of work to organization'sbusiness goals 72% 66% 71% +1% 60% 74% 67%
The work itself 79% 79% 72% +7% 55% 65% 69%
Variety of work 70% 72% 68% +2% 53% 66% 66%
Diverse and inclusive workforce 61% 52% 59% +2% 40% 56% 54%
Note: Table represents those who answered “very satisfied” and “somewhat satisfied.” Percentages are based on a scale where 1 = “very dissatisfied” and 5 = “very satisfied.”
People InSight: Employee Job Satisfaction and Engagement Survey Report 8

Your Organization's Strengths
Top Five Areas ofSatisfaction
YourEmployees
2016 | 2015
OrganizationStaff Size by
IndustryDifference
Other U.S.EmployeesDifference
Paid time off 91% 91% +24% +21%
Defined benefitpension plan 89% 89% +29% +34%
Benefits, the overallpackage 89% 87% +33% +26%
Health care/medicalbenefits 85% 86% +18% +22%
Relationships withco-workers 82% 80% +2% +5%
Note: Table represents those who answered “very satisfied” and “somewhat satisfied.”
Your Organization's Opportunities
Top Five Areas ofDissatisfaction
YourEmployees
2016 | 2015
OrganizationStaff Size by
IndustryDifference
Other U.S.EmployeesDifference
Communicationbetween employeesand seniormanagement
40% 46% +16% -11%
Career developmentopportunities forlearning andprofessional growth
38% 44% +1% -10%
Career advancementopportunities withinthe organization
38% 43% +17% -12%
The organization’soverall commitmentto professionaldevelopment
37% 47% +19% -14%
Overall corporateculture 31% 41% +4% -15%
Note: Table represents those who answered “very dissatisfied” and “somewhat dissatisfied.”
EXECUTIVE SUMMARY
People InSight: Employee Job Satisfaction and Engagement Survey Report 9

EXECUTIVE SUMMARY
Employee EngagementPersonal engagement is defined by feelings of urgency, focus, enthusiasm and intensity. It is the energized feeling that an employee has about work. Engagementin an organization can also be described by employees behaviors that have a positive impact on the success of the organization. Employees with highengagement will generally agree or strongly agree with aspects of employee engagement.
Table 2: Level of Agreement - Engagement Areas
YourEmployees
2016 | 2015
Other U.S.Employees
Level(above, below, or same
as other U.S.employees)
OrganizationStaff Size by
Industry
Administration ofhuman resource
programs
Publicadministration
ENGAGEMENT OPINIONS
Urgency
Determined to accomplish work goals 90% 89% 87% +3% 90% 85% 84%
Highly motivated by work goals 78% 76% 70% +8% 70% 73% 66%
Focus
Wrapped up in work 72% 67% 64% +8% 65% 70% 55%
Completely plugged in at work 64% 59% 54% +10% 60% 63% 45%
Note: Table represents those who answered “strongly agree” and “agree.” Percentages are based on a scale where 1 = “strongly disagree” and 5 = “strongly agree.”
People InSight: Employee Job Satisfaction and Engagement Survey Report 10

EXECUTIVE SUMMARY
YourEmployees
2016 | 2015
Other U.S.Employees
Level(above, below, or same
as other U.S.employees)
OrganizationStaff Size by
Industry
Administration ofhuman resource
programs
Publicadministration
Enthusiasm
Volunteer for activities beyond jobrequirements 64% 65% 56% +8% 50% 55% 57%
Passionate and excited about work 76% 78% 63% +13% 65% 60% 60%
Intensity
Putting all effort into work 82% 81% 70% +12% 65% 70% 65%
Completely focused on work projects 84% 81% 69% +15% 75% 73% 66%
ENGAGEMENT BEHAVIORS
Persistence
Colleagues adapt to challenging orcrisis situations 68% 68% 61% +7% 70% 65% 62%
Work group never gives up 63% 60% 60% +3% 65% 65% 62%
Note: Table represents those who answered “strongly agree” and “agree.” Percentages are based on a scale where 1 = “strongly disagree” and 5 = “strongly agree.”
People InSight: Employee Job Satisfaction and Engagement Survey Report 11

EXECUTIVE SUMMARY
YourEmployees
2016 | 2015
Other U.S.Employees
Level(above, below, or same
as other U.S.employees)
OrganizationStaff Size by
Industry
Administration ofhuman resource
programs
Publicadministration
Proactive
Employees take action when aproblem or opportunity arises 55% 45% 66% -11% 50% 60% 58%
Work group anticipates next challenge 55% 50% 53% +2% 65% 55% 53%
Expand Roles
Employees in organization embraceunexpected responsibilities 40% 33% 47% -7% 50% 53% 43%
Employees in organization volunteerfor new projects 40% 36% 42% -2% 45% 35% 38%
Adaptability
Work group is flexible in expandingscope of work 63% 57% 53% +10% 53% 51% 50%
Employees in organization are flexiblein unpredictable work situations 55% 47% 58% -3% 70% 60% 60%
Note: Table represents those who answered “strongly agree” and “agree.” Percentages are based on a scale where 1 = “strongly disagree” and 5 = “strongly agree.”
People InSight: Employee Job Satisfaction and Engagement Survey Report 12

EXECUTIVE SUMMARY
Conditions for EngagementThere are certain conditions under which employee engagement is much more likely to occur. Employees need the capacity to engage, reasons to engage and thefeeling that they are free to engage. This section provides information on the organization’s conditions for engagement. Employees who view the conditions aspositive for the facilitation of engagement will be very, or at least somewhat, satisfied with the items in this section. (Note: These are items from the job satisfactionsection of the report. They indicate conditions under which engagement can be maximized.)
Table 3: Level of Satisfaction
YourEmployees
2016 | 2015
Other U.S.Employees
Level(above, below, or same
as other U.S.employees)
OrganizationStaff Size by
Industry
Administration ofhuman resource
programs
Publicadministration
EMPLOYEE CAPACITY TO ENGAGE
Career advancement opportunities 38% 32% 50% -12% 21% 49% 43%
Career development opportunities 42% 33% 52% -10% 41% 56% 47%
Job-specific training 49% 46% 56% -7% 37% 54% 54%
Organization's commitment toprofessional development 39% 30% 53% -14% 20% 51% 48%
Relationships with co-workers 82% 80% 77% +5% 80% 76% 76%
Organization's financial stability 55% 31% 67% -12% 53% 67% 61%
Note: Table represents those who answered “very satisfied” and “somewhat satisfied.” Percentages are based on a scale where 1 = “very dissatisfied” and 5 = “very satisfied.”
People InSight: Employee Job Satisfaction and Engagement Survey Report 13

EXECUTIVE SUMMARY
YourEmployees
2016 | 2015
Other U.S.Employees
Level(above, below, or same
as other U.S.employees)
OrganizationStaff Size by
Industry
Administration ofhuman resource
programs
Publicadministration
REASONS TO ENGAGE
Networking 47% 38% 51% -4% 22% 54% 47%
Opportunities to use skills and abilities 76% 71% 73% +3% 55% 78% 71%
Meaningfulness of job 78% 75% 70% +8% 70% 77% 73%
Contribution of work to organization'sbusiness goals 72% 66% 71% +1% 60% 74% 67%
The work itself 79% 79% 72% +7% 55% 65% 69%
Variety of work 70% 72% 68% +2% 53% 66% 66%
FEEL FREE TO ENGAGE
Communication between employeesand senior management 46% 38% 57% -11% 30% 62% 50%
Autonomy and independence 72% 62% 67% +5% 55% 60% 65%
Management recognition of employeejob performance 47% 45% 58% -11% 45% 54% 48%
Note: Table represents those who answered “very satisfied” and “somewhat satisfied.” Percentages are based on a scale where 1 = “very dissatisfied” and 5 = “very satisfied.”
People InSight: Employee Job Satisfaction and Engagement Survey Report 14
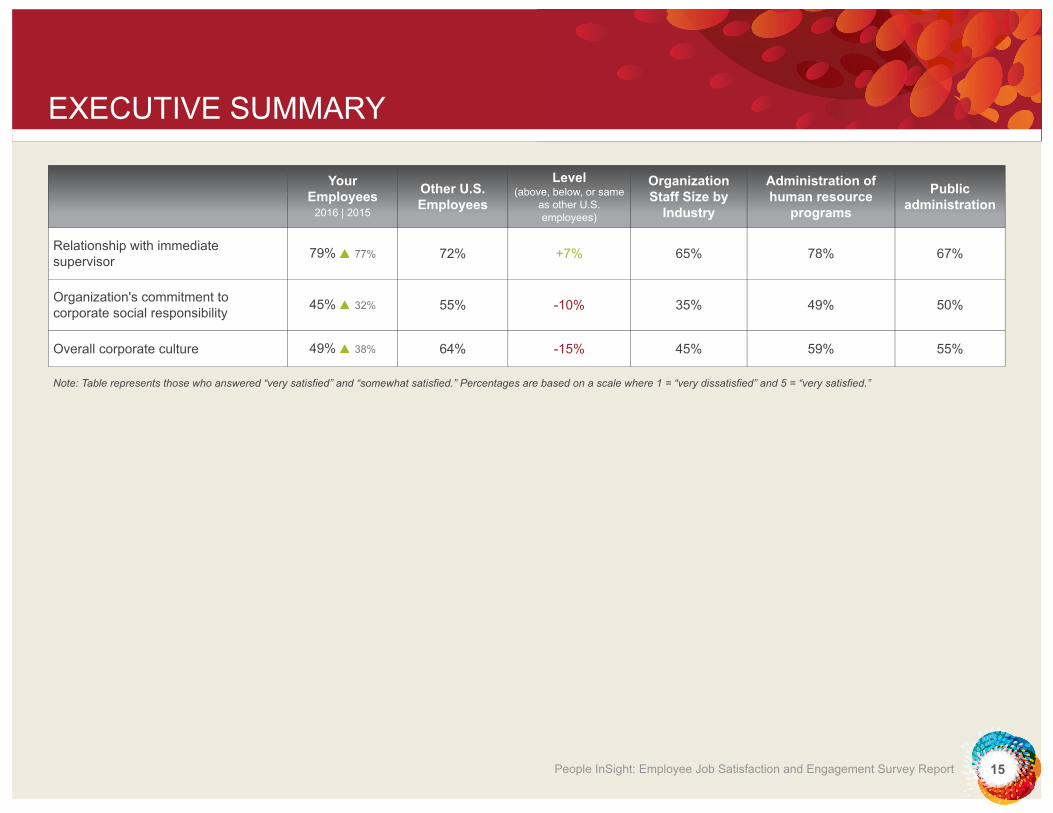
EXECUTIVE SUMMARY
YourEmployees
2016 | 2015
Other U.S.Employees
Level(above, below, or same
as other U.S.employees)
OrganizationStaff Size by
Industry
Administration ofhuman resource
programs
Publicadministration
Relationship with immediatesupervisor 79% 77% 72% +7% 65% 78% 67%
Organization's commitment tocorporate social responsibility 45% 32% 55% -10% 35% 49% 50%
Overall corporate culture 49% 38% 64% -15% 45% 59% 55%
Note: Table represents those who answered “very satisfied” and “somewhat satisfied.” Percentages are based on a scale where 1 = “very dissatisfied” and 5 = “very satisfied.”
People InSight: Employee Job Satisfaction and Engagement Survey Report 15

Overall Employee Engagement
Note: Engagement is based on a scale where 1.0 = “not engaged,” 3.0 = “moderatelyengaged” and 5.0 = “highly engaged.”
EXECUTIVE SUMMARY
Your Organization's Overall Employee Engagement
Overall employee engagement is the average of all engagement items(engagement opinions, engagement behaviors and conditions for engagement)using a scale of 1 = “strongly disagree” or “very dissatisfied” and 5 = “stronglyagree” or “very satisfied.” Employee engagement is based on the following scale:1.0 = “not engaged,” 3.0 = “moderately engaged” and 5.0 = “highly engaged.”
Overall Employee Engagement
Compared with other U.S. employees, employees at your organization areequally engaged. Compared with employees at similar sized organizations inyour industry, your employees are more engaged.
People InSight: Employee Job Satisfaction and Engagement Survey Report 16

2016
2015
Survey Results
CAREER DEVELOPMENT
Career development encompasses employees continually taking part in more advanced or diverseactivities (e.g., training, networking, etc.) that result in employees improving their skills, gaining new skills,taking greater responsibility at work and improving performance, status and income levels.
Figure 1: Importance of Career Development
Very Important Important Unimportant Very Unimportant
Very Important Important Unimportant Very Unimportant
Note: Percentages may not total 100% due to rounding.
People InSight: Employee Job Satisfaction and Engagement Survey Report 17

2016
2015
Survey Results
CAREER DEVELOPMENT
Figure 2: Satisfaction With Career Development
Very Satisfied Somewhat Satisfied Neutral/Neither Satisfied nor Dissatisfied
Somewhat Dissatisfied Very Dissatisfied
Very Satisfied Somewhat Satisfied Neutral/Neither Satisfied nor Dissatisfied
Somewhat Dissatisfied Very Dissatisfied
Note: Percentages may not total 100% due to rounding.
StrengthsAspects with which your employees are satisfied
OpportunitiesAspects with which your employees are dissatisfied
Opportunities to use your skills and abilities inyour work
Career development opportunities for learningand professional growth
Career advancement opportunities within theorganization
The organization’s overall commitment toprofessional development
People InSight: Employee Job Satisfaction and Engagement Survey Report 18

Survey Results
CAREER DEVELOPMENT
StrengthsAspects with which your employees are satisfied
OpportunitiesAspects with which your employees are dissatisfied
Job-specific training
People InSight: Employee Job Satisfaction and Engagement Survey Report 19

2016
2015
Survey Results
EMPLOYEE RELATIONSHIP WITH MANAGEMENT
The relationship an employee has with his or her supervisor is a central element to the employee’saffiliation to the organization, and it has been argued that many employee behaviors are largely a functionof the way they are managed by their supervisor. When there are open lines of communication (e.g.,encouraging an open-door policy), supervisors can respond more effectively to the needs and problems oftheir employees. Effective communication from senior management can provide the workforce withdirection, dispel rumors and promote trust. Additionally, management recognition of employees’performance through praise (private or public), awards and incentives is a cost-effective way of increasingemployee morale, productivity and competiveness.
Figure 3: Importance of Relationship With Management
Very Important Important Unimportant Very Unimportant
Very Important Important Unimportant Very Unimportant
Note: Percentages may not total 100% due to rounding.
People InSight: Employee Job Satisfaction and Engagement Survey Report 20

2016
2015
Survey Results
EMPLOYEE RELATIONSHIP WITH MANAGEMENT
Figure 4: Satisfaction With Relationship With Management
Very Satisfied Somewhat Satisfied Neutral/Neither Satisfied nor Dissatisfied
Somewhat Dissatisfied Very Dissatisfied
Very Satisfied Somewhat Satisfied Neutral/Neither Satisfied nor Dissatisfied
Somewhat Dissatisfied Very Dissatisfied
Note: Percentages may not total 100% due to rounding.
StrengthsAspects with which your employees are satisfied
OpportunitiesAspects with which your employees are dissatisfied
Relationship with immediate supervisor Communication between employees and seniormanagement
Recognition by management about your jobperformance
People InSight: Employee Job Satisfaction and Engagement Survey Report 21

2016
2015
Survey Results
COMPENSATION AND BENEFITS
To attract the best employees, companies must research the market in their area as well as their industryto ensure that their salaries and benefits match up against their competitors. Effective compensationprogram also ensures that pay levels are equitable internally. Benefits for employees can include a widearray of perks and other offerings; however, of primary importance to many employees are health care,paid time off, retirement and family-friendly benefits.
Figure 5: Importance of Compensation and Benefits
Very Important Important Unimportant Very Unimportant
Very Important Important Unimportant Very Unimportant
Note: Percentages may not total 100% due to rounding.
People InSight: Employee Job Satisfaction and Engagement Survey Report 22

2016
2015
Survey Results
COMPENSATION AND BENEFITS
Figure 6: Satisfaction With Compensation and Benefits
Very Satisfied Somewhat Satisfied Neutral/Neither Satisfied nor Dissatisfied
Somewhat Dissatisfied Very Dissatisfied
Very Satisfied Somewhat Satisfied Neutral/Neither Satisfied nor Dissatisfied
Somewhat Dissatisfied Very Dissatisfied
Note: Percentages may not total 100% due to rounding.
People InSight: Employee Job Satisfaction and Engagement Survey Report 23

Survey Results
COMPENSATION AND BENEFITS
StrengthsAspects with which your employees are satisfied
OpportunitiesAspects with which your employees are dissatisfied
Paid time off Flexibility to balance life and work issues
Benefits, the overall package
Defined benefit pension plan
Health care/medical benefits
People InSight: Employee Job Satisfaction and Engagement Survey Report 24

2016
2015
Survey Results
WORK ENVIRONMENT
Employers understand that employees spend a fair amount of their time at work and take steps to ensurethe work environment is conducive for employees to be productive and satisfied at work.
Figure 7: Importance of Work Environment
Very Important Important Unimportant Very Unimportant
Very Important Important Unimportant Very Unimportant
Note: Percentages may not total 100% due to rounding.
People InSight: Employee Job Satisfaction and Engagement Survey Report 25

2016
2015
Survey Results
WORK ENVIRONMENT
Figure 8: Satisfaction With Work Environment
Very Satisfied Somewhat Satisfied Neutral/Neither Satisfied nor Dissatisfied
Somewhat Dissatisfied Very Dissatisfied
Very Satisfied Somewhat Satisfied Neutral/Neither Satisfied nor Dissatisfied
Somewhat Dissatisfied Very Dissatisfied
Note: Percentages may not total 100% due to rounding.
People InSight: Employee Job Satisfaction and Engagement Survey Report 26

Survey Results
WORK ENVIRONMENT
StrengthsAspects with which your employees are satisfied
OpportunitiesAspects with which your employees are dissatisfied
Relationships with co-workers Overall corporate culture
The work itself
Meaningfulness of job
People InSight: Employee Job Satisfaction and Engagement Survey Report 27

2016
2015
Survey Results
ENGAGEMENT OPINIONS
Engagement Opinions: The "Feel" of Employee EngagementPersonal engagement is defined by feelings of urgency, focus, enthusiasm, and intensity. It is theenergized feeling that an employee has about work. Employees with high engagement will generally agreeor strongly agree with the eight items in this section.
Figure 9: Level of Agreement - Engagement Opinions
Strongly Agree Agree Neutral/Neither Agree nor Disagree Disagree
Strongly Disagree
Strongly Agree Agree Neutral/Neither Agree nor Disagree Disagree
Strongly Disagree
Note: Percentages may not total 100% due to rounding.
People InSight: Employee Job Satisfaction and Engagement Survey Report 28

Survey Results
ENGAGEMENT OPINIONS
StrengthsAreas in which your employees are engaged
OpportunitiesAreas in which your employees are disengaged
I am determined to accomplish my work goalsand confident I can meet them.
While at work, I’m almost always completelyfocused on my work projects.
I frequently feel like I’m putting all my effort intomy work.
I am highly motivated by my work goals.
I have passion and excitement about my work.
People InSight: Employee Job Satisfaction and Engagement Survey Report 29

2016
2015
Survey Results
ENGAGEMENT BEHAVIORS
Engagement Behaviors: The "Look" of Employee EngagementEngagement in an organization also can be described by employee behaviors that have a positive impacton the success of the organization. Organizations with highly engaged employees will find that employeesagree or strongly agree with the eight items in this section.
Figure 10: Level of Agreement - Engagement Behaviors
Strongly Agree Agree Neutral/Neither Agree nor Disagree Disagree
Strongly Disagree
Strongly Agree Agree Neutral/Neither Agree nor Disagree Disagree
Strongly Disagree
People InSight: Employee Job Satisfaction and Engagement Survey Report 30

Survey Results
ENGAGEMENT BEHAVIORS
Note: Percentages may not total 100% due to rounding.
StrengthsAreas in which your employees are engaged
OpportunitiesAreas in which your employees are disengaged
In my organization, employees view unexpectedresponsibilities as an opportunity to succeed atsomething new.
People InSight: Employee Job Satisfaction and Engagement Survey Report 31

2016
2015
Survey Results
CONDITIONS FOR ENGAGEMENT
There are certain conditions under which employee engagement is much more likely to occur. Employeesneed the capacity to engage, reasons to engage and the feeling that they are free to engage. This sectionprovides information on Southern Nevada Health District’s conditions for engagement. Employees whoview the condition as positive for the facilitation of engagement will be very or at least somewhat satisfiedwith the items in this section. (Note: These are items from the job satisfaction section of the report. Theyindicate conditions under which engagement can be maximized.)
Figure 11: Level of Satisfaction – Employee Capacity to Engage
Very Satisfied Somewhat Satisfied
Very Satisfied Somewhat Satisfied
People InSight: Employee Job Satisfaction and Engagement Survey Report 32

2016
2015
Survey Results
CONDITIONS FOR ENGAGEMENT
Figure 12: Level of Satisfaction – Reason to Engage
Very Satisfied Somewhat Satisfied
Very Satisfied Somewhat Satisfied
People InSight: Employee Job Satisfaction and Engagement Survey Report 33

2016
2015
Survey Results
CONDITIONS FOR ENGAGEMENT
Figure 13: Level of Satisfaction – Feel Free to Engage
Very Satisfied Somewhat Satisfied
Very Satisfied Somewhat Satisfied
People InSight: Employee Job Satisfaction and Engagement Survey Report 34

Survey Results
COMPARISONS: YOUR ORGANIZATION TO OTHER U.S. EMPLOYEES
Comparison of Aspects of Employee Job SatisfactionAbove Below
Defined benefit pension plan (i.e., PERSRetirement)
Overall corporate culture (organization’sreputation, work ethics, values, workingconditions, etc.)
Benefits, the overall package The organization’s overall commitment toprofessional development
Health care/medical benefitsFeeling safe in your work environment (i.e.,physical safety, taking measures to preventviolence in the workplace, acts of terrorism, etc.)
Paid time off (vacation, holidays, sick days,personal days, etc.) Organization’s financial stability
Family-friendly benefits (e.g., employeeassistance program, domestic partner benefits,subsidized childcare, eldercare referral service,etc.)
Flexibility to balance life and work issues(alternative work arrangements including jobsharing, flex schedules, telecommuting, etc.)
Compensation/pay, overall Career advancement opportunities within theorganization
Being paid competitively with the local market Communication between employees and seniormanagement
Base rate of pay Recognition by management about your jobperformance (feedback, incentives, rewards)
Meaningfulness of jobCareer development opportunities for learningand professional growth (mentorships, crosstraining, etc.)
Defined contribution plans (e.g., 401(k), 403(b),or similar type plan)
Organization’s commitment to corporate socialresponsibility (balance financial performance withcontributions to the quality of life of theiremployees, the local community and society atlarge)
The work itself Paid general training and tuition reimbursementprograms
Relationship with immediate supervisorOrganization’s commitment to a “green”workplace (environmentally sensitive andresource efficient)
Note: Only results that are 5% above or below other U.S. employees are reported. Items are sorted in descending order bydifference.
People InSight: Employee Job Satisfaction and Engagement Survey Report 35

Survey Results
COMPARISONS: YOUR ORGANIZATION TO OTHER U.S. EMPLOYEES
Above Below
Autonomy and independence to make decisions Job specific training
Relationships with co-workers
Note: Only results that are 5% above or below other U.S. employees are reported. Items are sorted in descending order bydifference.
Comparison of "Agree" Aspects of Employee EngagementAbove Below
While at work, I’m almost always completelyfocused on my work projects.
In my organization, employees are encouraged totake action when they see a problem oropportunity.
I have passion and excitement about my work.In my organization, employees view unexpectedresponsibilities as an opportunity to succeed atsomething new.
I frequently feel like I’m putting all my effort intomy work.
The people in my work group are always flexiblein expanding the scope of their work.
I feel completely plugged in at work, like I'malways on full power.
I am often so wrapped up in my work that hoursgo by like minutes.
I am highly motivated by my work goals.
I enjoy volunteering for projects beyond my jobrequirements.
The people in my work group quickly adapt tochallenging or crisis situations
Note: Only results that are 5% above or below other U.S. employees are reported. Items are sorted in descending order bydifference.
Comparison of "Satisfied" Aspects of Conditions for Engagement
People InSight: Employee Job Satisfaction and Engagement Survey Report 36

Survey Results
COMPARISONS: YOUR ORGANIZATION TO OTHER U.S. EMPLOYEES
Above Below
Meaningfulness of jobOverall corporate culture (organization’sreputation, work ethics, values, workingconditions, etc.)
Relationship with immediate supervisor The organization’s overall commitment toprofessional development
The work itself Career advancement opportunities within theorganization
Relationships with co-workers Organization’s financial stability
Autonomy and independence to make decisions Recognition by management about your jobperformance (feedback, incentives, rewards)
Communication between employees and seniormanagement
Career development opportunities for learningand professional growth (mentorships, crosstraining, etc.)
Organization’s commitment to corporate socialresponsibility (balance financial performance withcontributions to the quality of life of theiremployees, the local community and society atlarge)
Job specific training
Note: Only results that are 5% above or below other U.S. employees are reported. Items are sorted in descending order bydifference.
People InSight: Employee Job Satisfaction and Engagement Survey Report 37

CONCLUSIONS: LOOKING AHEAD AND NEXT STEPS
No doubt the past several years have been unique in the degree to which the overall economicenvironment has influenced the workplace and many of the factors that contribute to employee jobsatisfaction and engagement. But whatever the broader business climate, organizations’ success willalways depend on their ability to attract, retain and develop top talent. Creating an environment whereemployees are satisfied with their jobs and are fully engaged with their work is crucial to achieving any ofthese three objectives.
Planning Your Next StepsUnderstanding the factors that are most influential in determining how satisfied employees are with theirjobs is a necessary first step in making improvements. Addressing these findings through a series ofspecific and thoughtful actions is the next step. It is critical for employees to feel that changes will be madeas a result of these job satisfaction and engagement survey findings. When employees are skeptical thatany meaningful changes will be made to address the problem areas identified in the survey, they are likelyto grow frustrated and therefore will be less likely to take future surveys seriously.
The following is a list of suggestions for getting started and taking action after you’ve thoroughly reviewedthis report.
• Focus on a limited number of priority issues identified in the survey.• Depending on your organization’s staff size, target a limited number of lower-performing units.
Conversely, identify high-performing units and see what lessons can be learned from them andapplied elsewhere in your organization.
• Consider using focus groups or other qualitative approaches to get more detailed information onthe identified priority issues.
• Whenever possible, involve employees in finding solutions and, at minimum, give employees theopportunity to make suggestions anonymously.
• Work with your business leaders to draw up an action plan that identifies the priority issues andthe steps needed to address these key issues.
• Clearly communicate the action plan to employees and follow up on accomplishments related tothe plan frequently.
• Track the actions being taken. This will help you measure results later, after the action plan hasbeen implemented, and will help you learn from any successes or failures.
• Repeat the survey annually to track improvements or declines in employee satisfaction andengagement over time.
• Track external issues that could influence employee job satisfaction and consider possiblestrategies for preparing for and responding to broader trends.
People InSight: Employee Job Satisfaction and Engagement Survey Report 38

CONCLUSIONS: LOOKING AHEAD AND NEXT STEPS
The Influence of the Broader EnvironmentIn addition to variables within the workplace, a wide range of broader social, economic and demographictrends can influence both employee job satisfaction and employee engagement. For example, if theeconomy continues to improve, organizations may be better positioned to offer more competitivecompensation and benefits packages. At the same time, a more robust economy could mean thatemployee expectations around compensation and benefits also will rise. In organizations that fail to meetor effectively address these expectations, employees may become dissatisfied with the financial aspectsof job satisfaction. A greater proportion of total compensation dedicated to health care benefits may leavefewer funds available for wage increases. This trend, along with a general rise in living costs, could alsoinfluence employee satisfaction around compensation and pay.
Demographic trends are another external factor that could influence job satisfaction in the years ahead.An aging population will result in a higher proportion of older workers in the workplace. Older workers mayvalue slightly different job satisfaction factors than younger workers do and organizations will need torespond wisely to these varying calls for resources. Another key demographic trend that may influenceemployee job satisfaction is a growing gender divide in educational achievement. In the United States,women now obtain more bachelor’s, master’s and doctorate degrees than men. As a result, moreemployers may decide to tailor work practices to offer greater workplace flexibility in order to attract morequalified women to their organization. SHRM’s research on job satisfaction trends has found that there isgeneral agreement on most of the factors that men and women value. Therefore, organizationsimplementing more flexible working practices or other strategies to attract and retain qualified femaleemployees will also benefit in their efforts to attract and retain male employees.
The Importance of IntangiblesBecause a wide range of internal and external issues can influence employee job satisfaction andengagement, both the factors that influence job satisfaction and those that employees are most or leastsatisfied with can change over time. One issue to consider is whether the long recession and itscontinuing impact on the labor market has had an influence on the kinds of factors employees ratedfavorably and unfavorably. An argument could be made that in a time of scarcity of jobs, employees will beless satisfied with job satisfaction aspects involving pay and benefits and more focused on and satisfiedwith the intangible rewards of the work experience.
Such a theory appears to be supported by an analysis of SHRM’s normative database of approximately10,000 U.S. employees; employees are currently most satisfied with these kinds of intangible aspects, suchas their relationships with their co-workers, a feeling of personal safety in the work environment,
People InSight: Employee Job Satisfaction and Engagement Survey Report 39

CONCLUSIONS: LOOKING AHEAD AND NEXT STEPS
opportunities to use their skills and abilities and the inherent satisfaction with the work itself. At the sametime, most of the areas U.S. employees are dissatisfied with involve compensation or benefits. Movingforward, employers may need to pay more attention to addressing these financial aspects, withoutforgetting to continue to reinforce and support the intangible factors that most employees already reportbeing very satisfied with.
A fuller understanding of the unique issues that drive your organization’s employees’ job satisfaction andengagement empowers you to take action. Building a solid action plan will help you to continue to moveforward and to improve your organization’s work environment. An awareness of the potential impact ofexternal factors will help you prepare for the future. Taken together, these steps will help you build anorganization where employees are satisfied, motivated, engaged and effective.
People InSight: Employee Job Satisfaction and Engagement Survey Report 40

METHODOLOGY
Methodology
Response rate = 82%.
392 of Southern Nevada Health District employees participated.
Survey administered online to all Southern Nevada Health District employees from 7/1/2016 – 7/22/2016.
Reminder e-mails were sent to boost response rate.
For department/group level data shown in Appendix A, please keep in mind that with small sample sizes, theresponses of one survey participant can affect the overall percentage considerably; this should be notedwhen making interpretations of the data, particularly when interpreting percentage differences betweendepartments/groups.
People InSight: Employee Job Satisfaction and Engagement Survey Report 41
METHODOLOGY
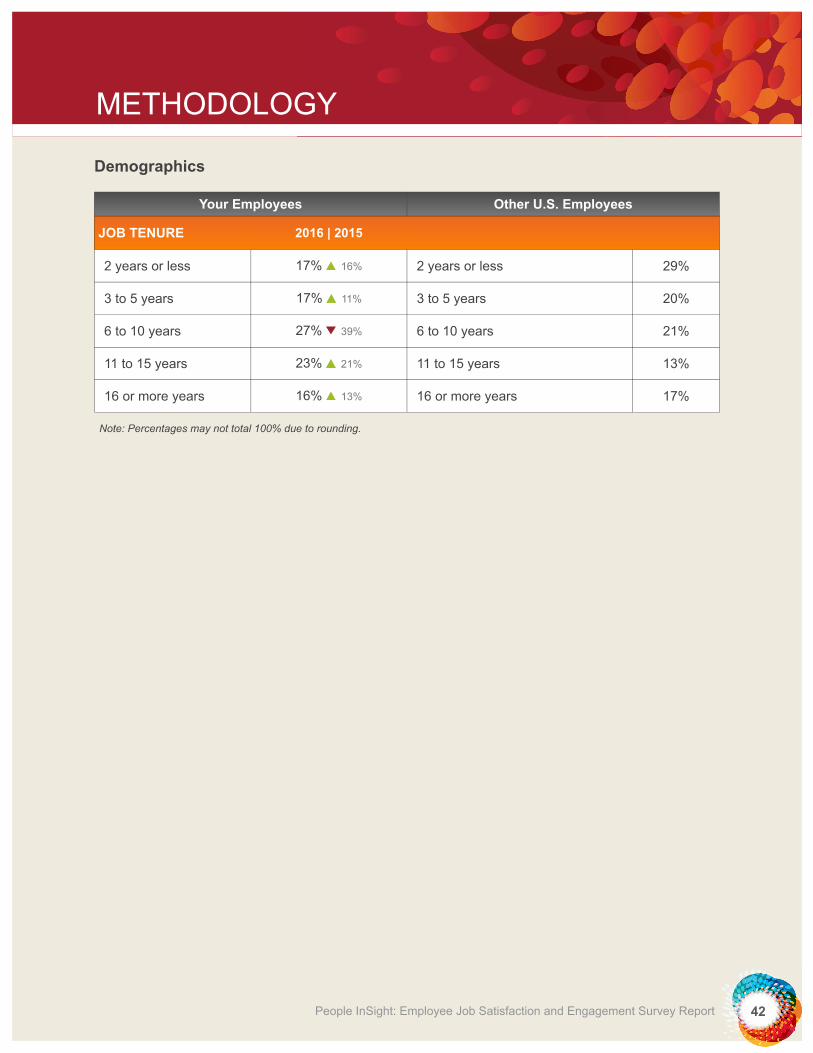
Demographics
Your Employees Other U.S. Employees
JOB TENURE 2016 | 2015
2 years or less 17% 16% 2 years or less 29%
3 to 5 years 17% 11% 3 to 5 years 20%
6 to 10 years 27% 39% 6 to 10 years 21%
11 to 15 years 23% 21% 11 to 15 years 13%
16 or more years 16% 13% 16 or more years 17%
Note: Percentages may not total 100% due to rounding.
People InSight: Employee Job Satisfaction and Engagement Survey Report 42

Appendix A
JOB SATISFACTION AND ENGAGEMENT ASPECTS BY DEPARTMENTS
Level of Satisfaction: Career Development
Your Organization’s Business Units*Your EmployeesOverall 1 2 3 4
Other U.S.Employees
CAREER DEVELOPMENT
Career advancement opportunities 38% 32% 31% 27% 44% 33% 36% 26% 40% 42% 50%
Career development opportunities 42% 33% 35% 27% 49% 47% 40% 19% 44% 46% 52%
Job-specific training 49% 46% 35% 29% 53% 60% 55% 44% 50% 55% 56%
Networking 47% 38% 30% 34% 51% 59% 49% 30% 53% 38% 51%
Opportunities to use skills and abilities 76% 71% 76% 67% 81% 78% 73% 70% 74% 72% 73%
Paid training and tuitionreimbursement programs 42% 35% 42% 30% 47% 38% 41% 30% 38% 42% 52%
Organization's commitment toprofessional development 39% 30% 41% 24% 42% 41% 31% 27% 45% 32% 53%
Note: Table represents those who answered “very satisfied” and “somewhat satisfied.” Percentages are based on a scale where 1 = “very dissatisfied” and 5 = “very satisfied.”
* Departments 1 - 4
1 Administration2 Community Health3 Environmental Health4 Clinical Services
People InSight: Employee Job Satisfaction and Engagement Survey Report 43

Appendix A
JOB SATISFACTION AND ENGAGEMENT ASPECTS BY DEPARTMENTS
Level of Satisfaction: Relationship With Management
Your Organization’s Business Units*Your EmployeesOverall 1 2 3 4
Other U.S.Employees
RELATIONSHIP WITH MANAGEMENT
Communication between employeesand senior management 46% 38% 53% 38% 48% 46% 34% 27% 52% 44% 57%
Autonomy and independence 72% 62% 64% 51% 73% 64% 78% 65% 69% 65% 67%
Recognition by management aboutyour job performance 47% 45% 47% 41% 58% 53% 43% 39% 44% 51% 58%
Relationship with immediatesupervisor 79% 77% 78% 70% 83% 85% 86% 85% 70% 71% 72%
Note: Table represents those who answered “very satisfied” and “somewhat satisfied.” Percentages are based on a scale where 1 = “very dissatisfied” and 5 = “very satisfied.”
* Departments 1 - 4
1 Administration2 Community Health3 Environmental Health4 Clinical Services
People InSight: Employee Job Satisfaction and Engagement Survey Report 44
Appendix A
JOB SATISFACTION AND ENGAGEMENT ASPECTS BY DEPARTMENTS
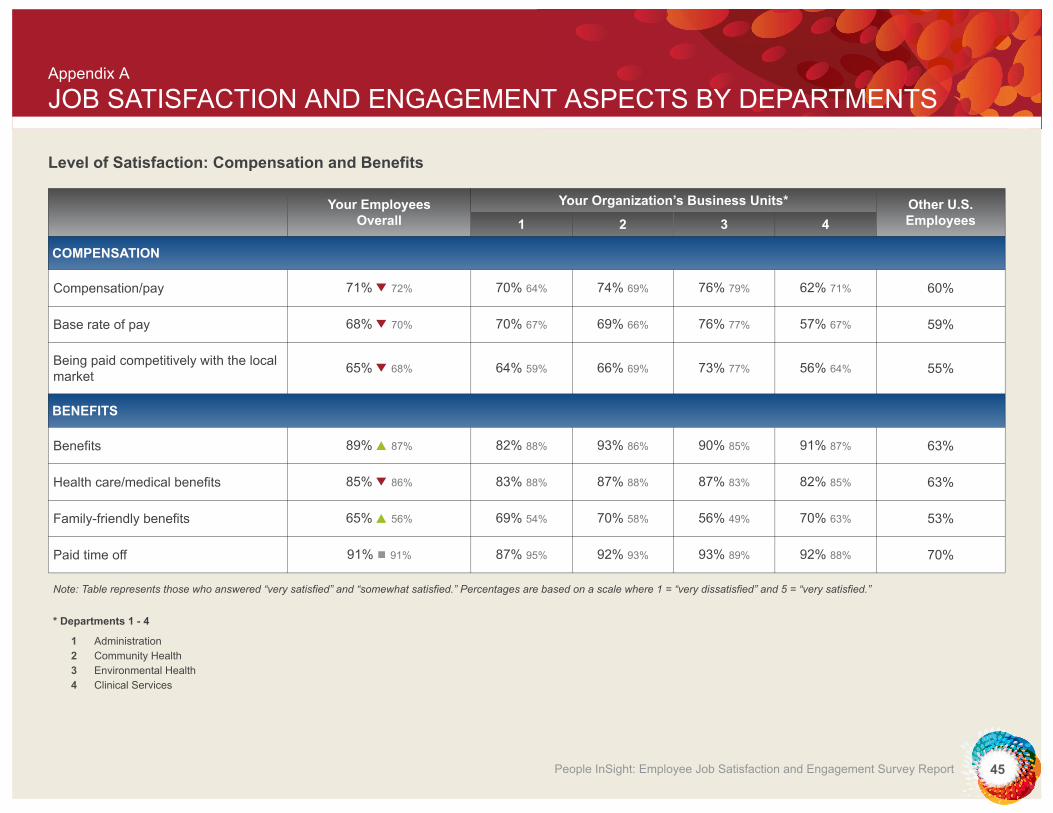
Level of Satisfaction: Compensation and Benefits
Your Organization’s Business Units*Your EmployeesOverall 1 2 3 4
Other U.S.Employees
COMPENSATION
Compensation/pay 71% 72% 70% 64% 74% 69% 76% 79% 62% 71% 60%
Base rate of pay 68% 70% 70% 67% 69% 66% 76% 77% 57% 67% 59%
Being paid competitively with the localmarket 65% 68% 64% 59% 66% 69% 73% 77% 56% 64% 55%
BENEFITS
Benefits 89% 87% 82% 88% 93% 86% 90% 85% 91% 87% 63%
Health care/medical benefits 85% 86% 83% 88% 87% 88% 87% 83% 82% 85% 63%
Family-friendly benefits 65% 56% 69% 54% 70% 58% 56% 49% 70% 63% 53%
Paid time off 91% 91% 87% 95% 92% 93% 93% 89% 92% 88% 70%
Note: Table represents those who answered “very satisfied” and “somewhat satisfied.” Percentages are based on a scale where 1 = “very dissatisfied” and 5 = “very satisfied.”
* Departments 1 - 4
1 Administration2 Community Health3 Environmental Health4 Clinical Services
People InSight: Employee Job Satisfaction and Engagement Survey Report 45
Appendix A
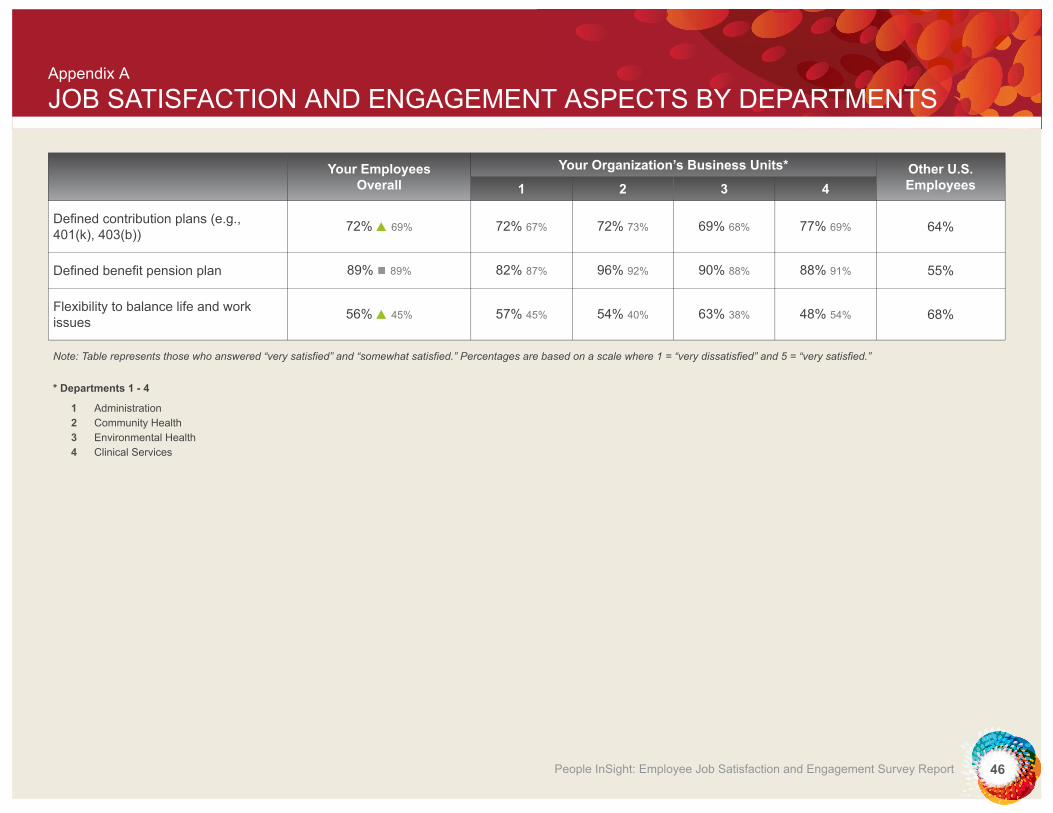
JOB SATISFACTION AND ENGAGEMENT ASPECTS BY DEPARTMENTS
Your Organization’s Business Units*Your EmployeesOverall 1 2 3 4
Other U.S.Employees
Defined contribution plans (e.g.,401(k), 403(b)) 72% 69% 72% 67% 72% 73% 69% 68% 77% 69% 64%
Defined benefit pension plan 89% 89% 82% 87% 96% 92% 90% 88% 88% 91% 55%
Flexibility to balance life and workissues 56% 45% 57% 45% 54% 40% 63% 38% 48% 54% 68%
Note: Table represents those who answered “very satisfied” and “somewhat satisfied.” Percentages are based on a scale where 1 = “very dissatisfied” and 5 = “very satisfied.”
* Departments 1 - 4
1 Administration2 Community Health3 Environmental Health4 Clinical Services
People InSight: Employee Job Satisfaction and Engagement Survey Report 46

Appendix A
JOB SATISFACTION AND ENGAGEMENT ASPECTS BY DEPARTMENTS
Level of Satisfaction: Work Environment
Your Organization’s Business Units*Your EmployeesOverall 1 2 3 4
Other U.S.Employees
WORK ENVIRONMENT
Feeling safe in your work environment 66% 66% 62% 57% 77% 85% 62% 68% 65% 61% 79%
Job security 70% 52% 64% 44% 68% 55% 73% 64% 72% 42% 69%
Meaningfulness of job 78% 75% 69% 52% 79% 84% 84% 79% 76% 82% 70%
Organization's commitment tocorporate social responsibility 45% 32% 47% 31% 51% 39% 36% 22% 50% 40% 55%
Organization's commitment to a"green" workplace 40% 27% 37% 29% 35% 28% 34% 16% 53% 36% 48%
Organization's financial stability 55% 31% 63% 29% 55% 45% 45% 19% 62% 38% 67%
Overall corporate culture 49% 38% 53% 38% 48% 44% 40% 27% 58% 48% 64%
Relationships with co-workers 82% 80% 76% 74% 86% 90% 85% 83% 81% 77% 77%
Note: Table represents those who answered “very satisfied” and “somewhat satisfied.” Percentages are based on a scale where 1 = “very dissatisfied” and 5 = “very satisfied.”
* Departments 1 - 4
1 Administration2 Community Health3 Environmental Health4 Clinical Services
People InSight: Employee Job Satisfaction and Engagement Survey Report 47

Appendix A
JOB SATISFACTION AND ENGAGEMENT ASPECTS BY DEPARTMENTS
Your Organization’s Business Units*Your EmployeesOverall 1 2 3 4
Other U.S.Employees
Contribution of work to organization'sbusiness goals 72% 66% 73% 66% 72% 69% 71% 61% 73% 69% 71%
The work itself 79% 79% 69% 65% 87% 85% 80% 81% 78% 86% 72%
Variety of work 70% 72% 66% 69% 76% 85% 68% 65% 70% 75% 68%
Diverse and inclusive workforce 61% 52% 60% 51% 59% 50% 55% 48% 71% 57% 59%
Note: Table represents those who answered “very satisfied” and “somewhat satisfied.” Percentages are based on a scale where 1 = “very dissatisfied” and 5 = “very satisfied.”
* Departments 1 - 4
1 Administration2 Community Health3 Environmental Health4 Clinical Services
People InSight: Employee Job Satisfaction and Engagement Survey Report 48

Appendix A
JOB SATISFACTION AND ENGAGEMENT ASPECTS BY DEPARTMENTS
Level of Agreement: Engagement Opinions
Your Organization’s Business Units*Your EmployeesOverall 1 2 3 4
Other U.S.Employees
URGENCY
Determined to accomplish work goals 90% 89% 88% 91% 92% 92% 87% 84% 93% 92% 87%
Highly motivated by work goals 78% 76% 81% 69% 88% 80% 69% 74% 78% 81% 70%
FOCUS
Wrapped up in work 72% 67% 73% 60% 78% 68% 66% 70% 73% 68% 64%
Completely plugged in at work 64% 59% 68% 51% 71% 61% 52% 58% 70% 66% 54%
ENTHUSIASM
Volunteer for activities beyond jobrequirements 64% 65% 57% 64% 62% 63% 66% 61% 71% 72% 56%
Passionate and excited about work 76% 78% 70% 71% 84% 80% 74% 78% 78% 81% 63%
INTENSITY
Note: Table represents those who answered “strongly agree” and “agree.” Percentages are based on a scale where 1 = “strongly disagree” and 5 = “strongly agree.”
* Departments 1 - 4
1 Administration2 Community Health3 Environmental Health4 Clinical Services
People InSight: Employee Job Satisfaction and Engagement Survey Report 49
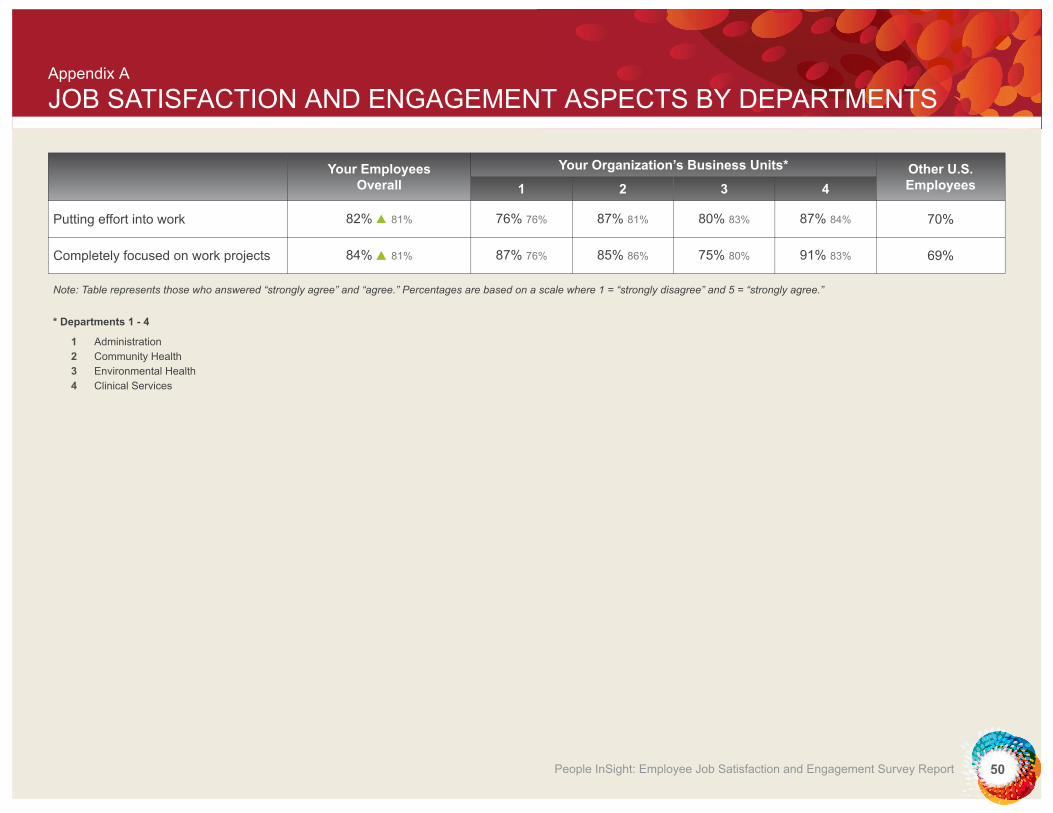
Appendix A
JOB SATISFACTION AND ENGAGEMENT ASPECTS BY DEPARTMENTS
Your Organization’s Business Units*Your EmployeesOverall 1 2 3 4
Other U.S.Employees
Putting effort into work 82% 81% 76% 76% 87% 81% 80% 83% 87% 84% 70%
Completely focused on work projects 84% 81% 87% 76% 85% 86% 75% 80% 91% 83% 69%
Note: Table represents those who answered “strongly agree” and “agree.” Percentages are based on a scale where 1 = “strongly disagree” and 5 = “strongly agree.”
* Departments 1 - 4
1 Administration2 Community Health3 Environmental Health4 Clinical Services
People InSight: Employee Job Satisfaction and Engagement Survey Report 50

Appendix A
JOB SATISFACTION AND ENGAGEMENT ASPECTS BY DEPARTMENTS
Level of Agreement: Engagement Behaviors
Your Organization’s Business Units*Your EmployeesOverall 1 2 3 4
Other U.S.Employees
PERSISTENCE
Colleagues adapt to challenging orcrisis situations 68% 68% 69% 63% 79% 83% 71% 71% 54% 60% 61%
Work group never gives up 63% 60% 64% 56% 71% 75% 66% 63% 52% 53% 60%
PROACTIVE
Employees take action when aproblem or opportunity arises 55% 45% 56% 44% 62% 56% 53% 43% 51% 43% 66%
Work group anticipates next challenge 55% 50% 55% 39% 70% 69% 51% 53% 48% 44% 53%
Note: Table represents those who answered “strongly agree” and “agree.” Percentages are based on a scale where 1 = “strongly disagree” and 5 = “strongly agree.”
* Departments 1 - 4
1 Administration2 Community Health3 Environmental Health4 Clinical Services
People InSight: Employee Job Satisfaction and Engagement Survey Report 51

Appendix A
JOB SATISFACTION AND ENGAGEMENT ASPECTS BY DEPARTMENTS
Your Organization’s Business Units*Your EmployeesOverall 1 2 3 4
Other U.S.Employees
EXPAND ROLES
Employees in organization embraceunexpected responsibilities 40% 33% 43% 22% 46% 48% 34% 31% 41% 37% 47%
Employees in organization volunteerfor new projects 40% 36% 27% 23% 46% 42% 50% 41% 34% 36% 42%
ADAPTABILITY
Work group is flexible in expandingscope of work 63% 57% 62% 49% 70% 68% 71% 59% 47% 54% 53%
Employees in organization are flexiblein unpredictable work situations 55% 47% 49% 38% 62% 56% 59% 50% 51% 45% 58%
Note: Table represents those who answered “strongly agree” and “agree.” Percentages are based on a scale where 1 = “strongly disagree” and 5 = “strongly agree.”
* Departments 1 - 4
1 Administration2 Community Health3 Environmental Health4 Clinical Services
People InSight: Employee Job Satisfaction and Engagement Survey Report 52

Appendix A
JOB SATISFACTION AND ENGAGEMENT ASPECTS BY DEPARTMENTS
Level of Satisfaction: Conditions for Engagement
Your Organization’s Business Units*Your EmployeesOverall 1 2 3 4
Other U.S.Employees
EMPLOYEE CAPACITY TO ENGAGE
Career advancement opportunities 38% 32% 31% 27% 44% 33% 36% 26% 40% 42% 50%
Career development opportunities 42% 33% 35% 27% 49% 47% 40% 19% 44% 46% 52%
Job-specific training 49% 46% 35% 29% 53% 60% 55% 44% 50% 55% 56%
Organization's commitment toprofessional development 39% 30% 41% 24% 42% 41% 31% 27% 45% 32% 53%
Relationships with co-workers 82% 80% 76% 74% 86% 90% 85% 83% 81% 77% 77%
Organization's financial stability 55% 31% 63% 29% 55% 45% 45% 19% 62% 38% 67%
REASONS TO ENGAGE
Networking 47% 38% 30% 34% 51% 59% 49% 30% 53% 38% 51%
Opportunities to use skills and abilities 76% 71% 76% 67% 81% 78% 73% 70% 74% 72% 73%
Note: Table represents those who answered “very satisfied” and “somewhat satisfied.” Percentages are based on a scale where 1 = “very dissatisfied” and 5 = “very satisfied.”
* Departments 1 - 4
1 Administration2 Community Health3 Environmental Health4 Clinical Services
People InSight: Employee Job Satisfaction and Engagement Survey Report 53

Appendix A
JOB SATISFACTION AND ENGAGEMENT ASPECTS BY DEPARTMENTS
Your Organization’s Business Units*Your EmployeesOverall 1 2 3 4
Other U.S.Employees
Meaningfulness of job 78% 75% 69% 52% 79% 84% 84% 79% 76% 82% 70%
Contribution of work to organization'sbusiness goals 72% 66% 73% 66% 72% 69% 71% 61% 73% 69% 71%
The work itself 79% 79% 69% 65% 87% 85% 80% 81% 78% 86% 72%
Variety of work 70% 72% 66% 69% 76% 85% 68% 65% 70% 75% 68%
FEEL FREE TO ENGAGE
Communication between employeesand senior management 46% 38% 53% 38% 48% 46% 34% 27% 52% 44% 57%
Autonomy and independence 72% 62% 64% 51% 73% 64% 78% 65% 69% 65% 67%
Recognition by management aboutyour job performance 47% 45% 47% 41% 58% 53% 43% 39% 44% 51% 58%
Relationship with immediatesupervisor 79% 77% 78% 70% 83% 85% 86% 85% 70% 71% 72%
Note: Table represents those who answered “very satisfied” and “somewhat satisfied.” Percentages are based on a scale where 1 = “very dissatisfied” and 5 = “very satisfied.”
* Departments 1 - 4
1 Administration2 Community Health3 Environmental Health4 Clinical Services
People InSight: Employee Job Satisfaction and Engagement Survey Report 54

Appendix A
JOB SATISFACTION AND ENGAGEMENT ASPECTS BY DEPARTMENTS
Your Organization’s Business Units*Your EmployeesOverall 1 2 3 4
Other U.S.Employees
Organization's commitment tocorporate social responsibility 45% 32% 47% 31% 51% 39% 36% 22% 50% 40% 55%
Overall corporate culture 49% 38% 53% 38% 48% 44% 40% 27% 58% 48% 64%
Note: Table represents those who answered “very satisfied” and “somewhat satisfied.” Percentages are based on a scale where 1 = “very dissatisfied” and 5 = “very satisfied.”
* Departments 1 - 4
1 Administration2 Community Health3 Environmental Health4 Clinical Services
People InSight: Employee Job Satisfaction and Engagement Survey Report 55

Appendix B
ELEMENTS OF JOB SATISFACTION AND ENGAGEMENT
The following 35 elements of job satisfaction and 34 elements of employee engagement are examined inthis report:
Aspects of Job Satisfaction
Career Development
1. Organization’s commitment to professional development
2. Career advancement opportunities within the organization
3. Career development opportunities for learning and professional growth (mentorships, cross-training, etc.)
4. Job-specific training
5. Opportunities to network with others (within or outside the organization) to help in advancing one’s career
6. Opportunities to use skills and abilities in work
7. Paid training and tuition reimbursement programs
Relationship With Management
8. Communication between employees and senior management
9. Autonomy and independence to make decisions
10. Management recognition of employee job performance (feedback, incentives, rewards)
11. Relationship with immediate supervisor
Compensation and Benefits
12. Compensation/pay overall
13. Base rate of pay
14. Opportunities for variable pay (bonuses, commissions, other variable pay, monetary rewards for ideas or
suggestions)**
15. Stock options**
16. Being paid competitively with the local market
17. Benefits
18. Health care/medical benefits
19. Family-friendly benefits (life insurance for dependents, subsidized child care, elder care referral service, etc.)
20. Paid time off (vacation, holidays, sick days, personal days, etc.)
21. Defined contribution plans such as 401(k)
22. Defined benefit pension plans
23. Flexibility to balance life and work issues (alternative work arrangements, including job-sharing, flex
schedules, telecommuting, etc.)
People InSight: Employee Job Satisfaction and Engagement Survey Report 56

Appendix B
ELEMENTS OF JOB SATISFACTION AND ENGAGEMENT
Work Environment
24. Feeling safe in the work environment
25. Job security
26. Meaningfulness of job (understanding how job contributes to society as a whole)
27. Organization’s commitment to corporate social responsibility (balance financial performance with
contributions to the quality of life of its employees, the local community and society at large)
28. Organization’s commitment to a ‘green’ workplace (environmentally sensitive and resource-efficient)
29. Overall corporate culture (organization’s reputation, work ethics, values, working conditions, etc.)
30. Relationships with co-workers
31. Contribution of work to organization’s business goals
32. The work itself (it is interesting, challenging, exciting, etc.)
33. Variety of work (working on different projects, using different skills)
34. Organization’s financial standing
35. Organization’s commitment to a diverse and inclusive workforce
Elements of Employee Engagement
Engagement Opinions
1. Determined to accomplish work goals
2. Highly motivated by work goals
3. Wrapped up in work
4. Completely plugged in at work
5. Volunteer for activities beyond job requirements
6. Passionate and excited about work
7. Putting effort into work
8. Completely focused on work projects
Engagement Behaviors
9. Colleagues adapt to challenging or crisis situations
10. Work group never gives up
11. Employees take action when a problem or opportunity arises
12. Work group anticipates next challenge
13. Employees in organization embrace unexpected responsibilities
14. Employees in organization volunteer for new projects
15. Work group is flexible in expanding scope of work
16. Employees in organization are flexible in unpredictable work situations
People InSight: Employee Job Satisfaction and Engagement Survey Report 57

Appendix B
ELEMENTS OF JOB SATISFACTION AND ENGAGEMENT
Conditions for Engagement
17. Career advancement opportunities
18. Career development opportunities
19. Job-specific training
20. Organization’s commitment to professional development
21. Relationships with co-workers
22. Organization’s financial stability
23. Networking
24. Opportunities to use your skills and abilities
25. Meaningfulness of job
26. Contribution of work organization’s business goals
27. The work itself
28. Variety of work
29. Communication between employees and senior management
30. Autonomy and independence
31. Management recognition of employee job performance
32. Relationship with immediate supervisor
33. Organization’s commitment to corporate social responsibility
34. Overall corporate culture
i Macey, W. H., Scheider, B., Barbera, K. M., Young, S. A. (2009). Employee engagement: Tools for analysis, practice, andcompetitive advantage. Hoboken, NJ: Wiley-Blackwell.
People InSight: Employee Job Satisfaction and Engagement Survey Report 58

© Society for Human Resource Management. All rights reserved.
This publication may not be disclosed, reproduced or transmitted in any form or by any means, electronic, mechanical,photocopying, recording or otherwise, to any individual or entity outside of the organization that is the subject of the report.The organization that is the subject of this publication may disclose externally the organization-specific results only, however,the organization may not do so in a way that states or implies SHRM endorsement of the organization, its practices, products,services, etc. In no case shall the organization disclose or distribute externally the non-organization-specific content of thispublication (including, but not limited to, the benchmarking comparison data) or the publication itself.