southern regional education board hstw sc 2005 cte1 career/technical education: doing the right...
TRANSCRIPT

SC 2005 cte 1
Southern
Regional
Education
Board
HSTW
Career/Technical Education: Doing the Right Thing and Getting High
Student Achievement
Gene Bottoms
Senior Vice [email protected]
SC 2005 cte 2
Southern
Regional
Education
Board
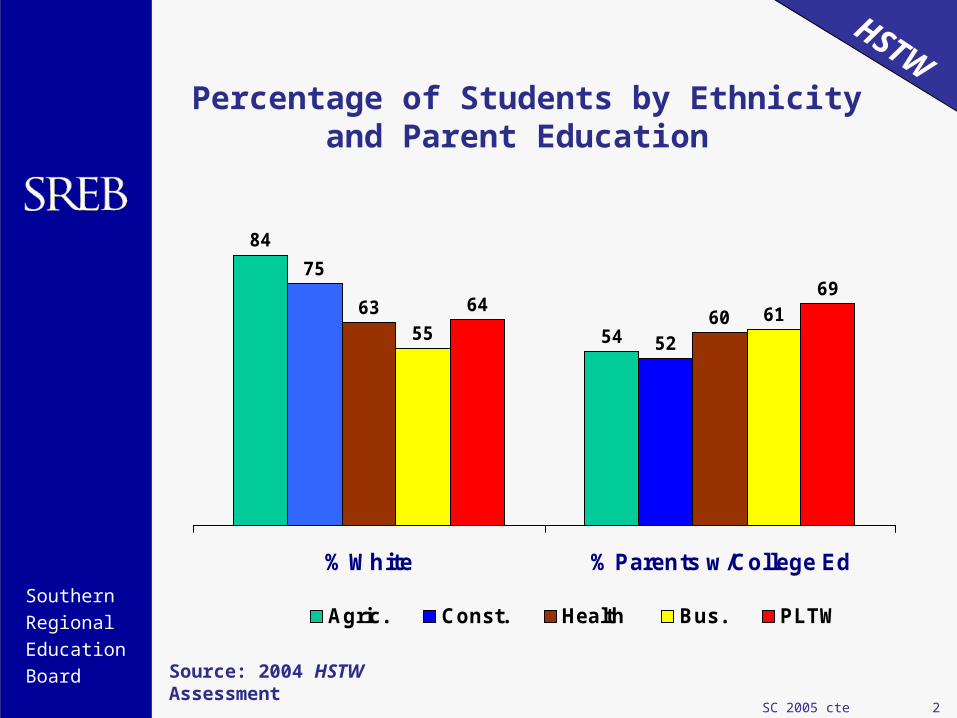
HSTWPercentage of Students by Ethnicity and
Parent Education
84
54
75
52
63 6055
616469
% White % Parents w/College Ed
Agric. Const. Health Bus. PLTW
Source: 2004 HSTW Assessment

SC 2005 cte 3
Southern
Regional
Education
Board
HSTW
Which career/technical field had the highest percentage of students completing HSTW-recommended curriculum core?
Which C/T field had the highest reading, mathematics and science achievement?
Students in which C/T field had the highest-quality career/technical experiences?
Which C/T field had the highest percentage of students planning further study?
Make a Prediction

SC 2005 cte 4
Southern
Regional
Education
Board
HSTWPercentages of Students Completing HSTW-recommended Curriculum
14
46
39
21
51
28
14
4541
25
55
20
3 1 or 2 0
Agricul. Bus. Const. Health
Source: 2004 HSTW Assessment
SC 2005 cte 5
Southern
Regional
Education
Board
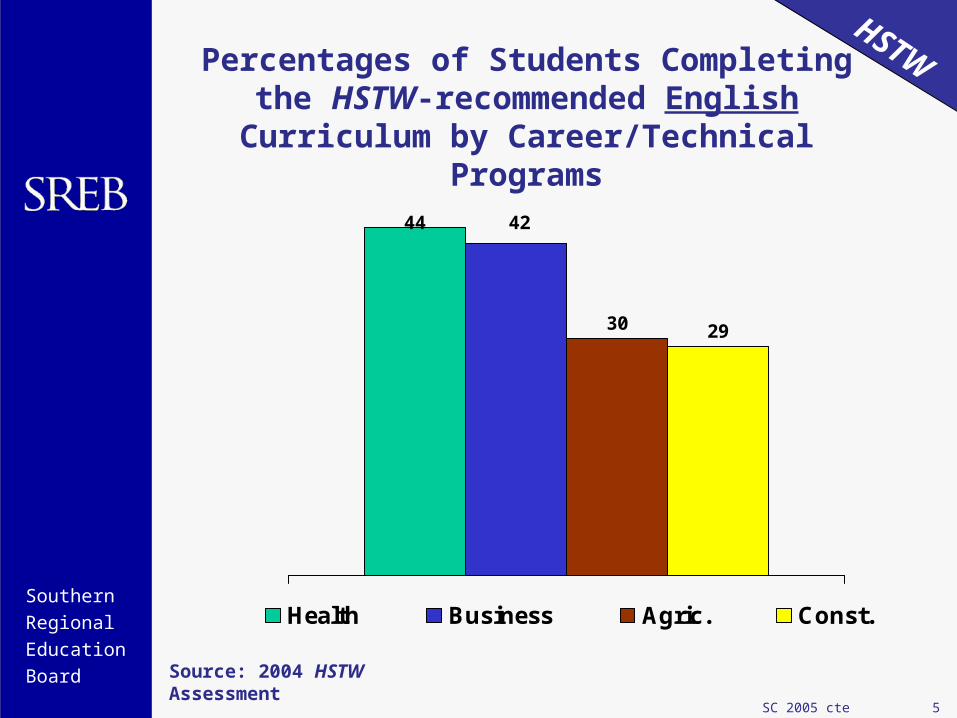
HSTWPercentages of Students Completing the
HSTW-recommended English Curriculum by Career/Technical Programs
44
30 29
42
Health Business Agric. Const.
Source: 2004 HSTW Assessment

SC 2005 cte 6
Southern
Regional
Education
Board
HSTWPercentages of Students Completing the
HSTW-recommended Mathematics Curriculum
46
32 31
72
43
Health Business Agric. Constr. PLTW
Source: 2004 HSTW Assessment

SC 2005 cte 7
Southern
Regional
Education
Board
HSTWPercentages of Students Completing the HSTW-recommended Science Curriculum
69
47 45
55
80
Health Business Agric. Constr. PLTW
Source: 2004 HSTW Assessment

SC 2005 cte 8
Southern
Regional
Education
Board
HSTW
Percentages of Students Completing the HSTW-recommended English Curriculum by Race
A-A White Other
% % %
Agriculture 20 31 28
Business 42 44 36
Construction 34 28 32
Health Science 43 44 43
PLTW 52 50 55
Source: 2004 HSTW Assessment

SC 2005 cte 9
Southern
Regional
Education
Board
HSTW
Percentages of Students Completing the HSTW-recommended Mathematics Curriculum by Race
A-A White Other
% % %
Agriculture 26 34 26
Business 42 45 39
Construction 32 31 32
Health Science 45 47 46
PLTW 77 71 65
Source: 2004 HSTW Assessment

SC 2005 cte 10
Southern
Regional
Education
Board
HSTW
Percentages of Students Completing the HSTW-recommended Science Curriculum by Race
A-A White Other
% % %
Agriculture 37 48 41
Business 56 56 51
Construction 57 42 52
Health Science 65 70 69
PLTW 78 81 74
Source: 2004 HSTW Assessment

SC 2005 cte 11
Southern
Regional
Education
Board
HSTWPercentages of Students Completing the HSTW-recommended English Curriculum
by Parent Education
Parent with
College
Parent with no College
% %
Agriculture 36 24
Business 46 36
Construction 36 22
Health Science 48 38
PLTW 54 44
Source: 2004 HSTW Assessment

SC 2005 cte 12
Southern
Regional
Education
Board
HSTWPercentages of Students Completing the HSTW-recommended Mathematics
Curriculum by Parent Education
Parent with
College
Parent with no College
% %
Agriculture 39 25
Business 49 34
Construction 38 23
Health Science 51 38
PLTW 77 59
Source: 2004 HSTW Assessment
SC 2005 cte 13
Southern
Regional
Education
Board
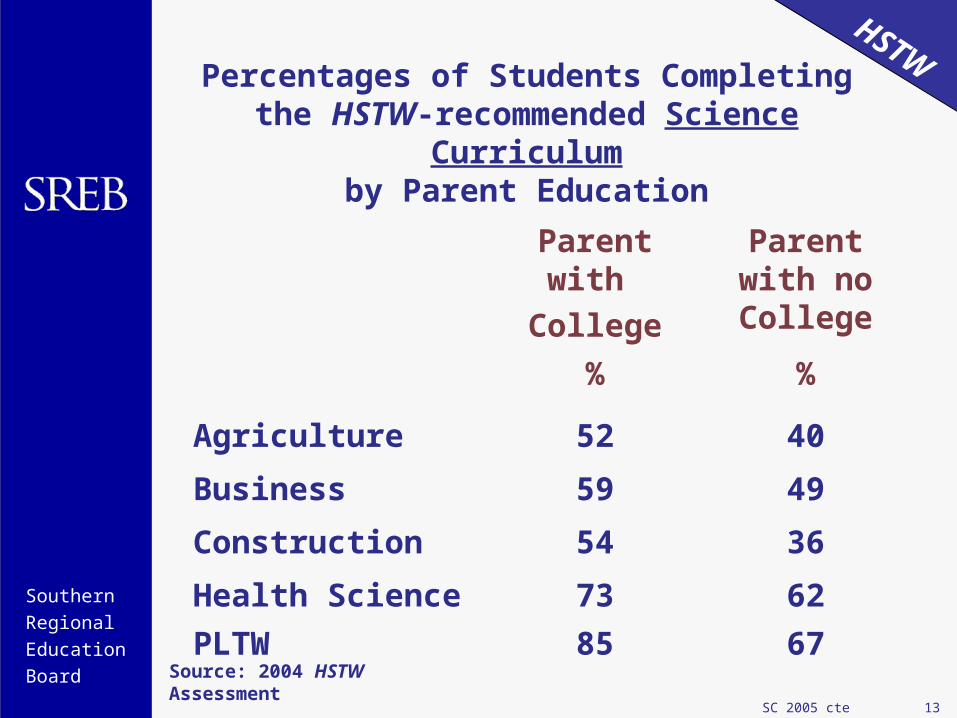
HSTWPercentages of Students Completing the HSTW-recommended Science Curriculum
by Parent Education
Parent with
College
Parent with no College
% %
Agriculture 52 40
Business 59 49
Construction 54 36
Health Science 73 62
PLTW 85 67
Source: 2004 HSTW Assessment

SC 2005 cte 14
Southern
Regional
Education
Board
HSTWPercentages of Students Meeting
the HSTW Performance Goalsby Career/Technical Programs
Reading Math Science
% % %
Agriculture 46 53 46
Business 50 54 39
Construction 46 55 44
Health Science 56 57 44
PLTW 69 76 65
Source: 2004 HSTW Assessment

SC 2005 cte 15
Southern
Regional
Education
Board
HSTWPercentages of Students Meeting the HSTW
Reading Performance Goal by Number of Curriculum Goals Met
None 1 or 2 All 3
% % %
Agriculture 30 52 70
Business 33 51 69
Construction 32 50 73
Health Science 34 54 74
PLTW 28 67 81
Source: 2004 HSTW Assessment

SC 2005 cte 16
Southern
Regional
Education
Board
HSTWPercentages of Students Meeting the HSTW Mathematics Performance Goal by Number
of Curriculum Goals Met
None 1 or 2 All 3
% % %
Agriculture 34 60 82
Business 33 55 79
Construction 39 60 84
Health Science 31 56 80
PLTW 36 78 86
Source: 2004 HSTW Assessment

SC 2005 cte 17
Southern
Regional
Education
Board
HSTWPercentages of Students Meeting the HSTW
Science Performance Goal by Number of Curriculum Goals Met
None 1 or 2 All 3
% % %
Agriculture 29 52 72
Business 23 39 60
Construction 33 46 73
Health Science 20 43 65
PLTW 24 63 77
Source: 2004 HSTW Assessment

SC 2005 cte 18
Southern
Regional
Education
Board
HSTWAverage Mean Score Gains by Students Who Had Moderate and Intensive Experiences in
Quality Career/Technical Education
%
ReadingMean
Math
Mean
Science Mean
Agriculture 50 +11 +7 +11
Business 55 +8 +6 +7
Construction 60 +7 +4 +8
Health Science 58 +6 +5 +6
Source: 2004 HSTW Assessment

SC 2005 cte 19
Southern
Regional
Education
Board
HSTWQuality Career/Technical
Education Indicators One hour or more reading non-school-related
materials in a week Completed four or more credits in career/technical
courses Used mathematics to complete challenging
assignments weekly in their career/technical area Read and interpreted technical books and
manuals weekly to complete assignments Read a career-related article monthly and
demonstrated understanding of the content Used computer skills monthly to do assignments
in their career/technical studies

SC 2005 cte 20
Southern
Regional
Education
Board
HSTWQuality Career/Technical Education Indicators (Cont’d)
Had challenging assignments in career/technical classes at least monthly
Completed a project that required some research and a written plan
Had to meet certain standards on a written exam to pass a course
Completed a senior project that included researching a topic, creating a product or performing a service and presenting it to the class
Spoke with or visited someone in a chosen career field
Spent 30 minutes or more on C/T homework each day
SC 2005 cte 21
Southern
Regional
Education
Board
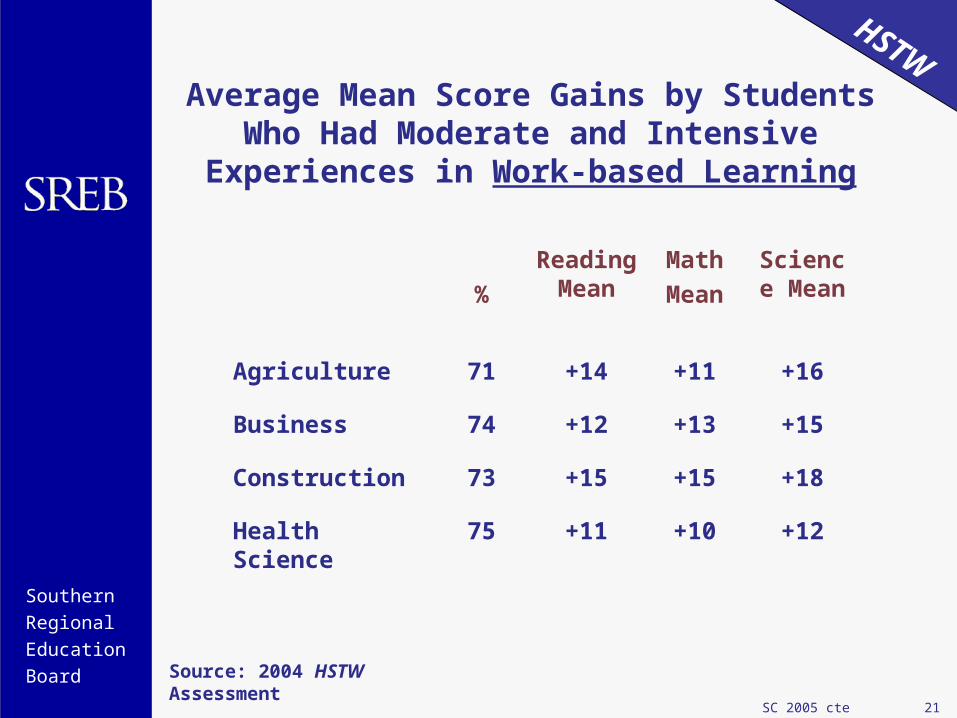
HSTWAverage Mean Score Gains by Students Who Had Moderate and Intensive Experiences in
Work-based Learning
%
ReadingMean
Math
Mean
Science Mean
Agriculture 71 +14 +11 +16
Business 74 +12 +13 +15
Construction 73 +15 +15 +18
Health Science 75 +11 +10 +12
Source: 2004 HSTW Assessment

SC 2005 cte 22
Southern
Regional
Education
Board
HSTWAverage Gains in Achievement for Students
Who Experienced Moderate to Intensive Classroom High Expectations
%
ReadingMean
Math
Mean
Science Mean
Agriculture 49 +17 +11 +17
Business 59 +12 +8 +11
Construction 44 +11 +8 +12
Health Science 68 +11 +8 +11
Source: 2004 HSTW Assessment

SC 2005 cte 23
Southern
Regional
Education
Board
HSTW
High Expectations Indicators
Teachers often clearly indicated the amount and quality of work necessary to earn a grade of A or B.
Teachers were available frequently to help students with their studies.
Students spent one or more hours on homework each day.
They revised their essays or other written work several times to improve quality.
They worked hard to meet high standards on assignments.

SC 2005 cte 24
Southern
Regional
Education
Board
HSTWAverage Gains in Achievement for Students
Who Experienced Moderate to Intensive Emphasis on Literacy Across the Curriculum
%
ReadingMean
Math
Mean
Science Mean
Agriculture 41 +12 +7 +14
Business 47 +10 +8 +12
Construction 43 +11 +9 +12
Health Science 49 +12 +5 +6
Source: 2004 HSTW Assessment

SC 2005 cte 25
Southern
Regional
Education
Board
HSTW
Literacy Indicators Used word processing software to complete
an assignment Revised essays or other written work several
times to improve quality Wrote in-depth explanations about a class
project or activity Discussed or debated with other students
about what they read in English/language arts classes
Read and interpreted technical books or manuals monthly to complete assignments in a career/technical area

SC 2005 cte 26
Southern
Regional
Education
Board
HSTW
Literacy Indicators (Cont’d)
Read an assigned book outside class and demonstrated understanding
Spent two or more hours reading non-school- related materials outside of class in a week
Completed short writing assignments of one to three pages in English classes monthly
Completed short writing assignments of one to three pages in science classes monthly
Completed short writing assignments of one to three pages in social studies classes monthly

SC 2005 cte 27
Southern
Regional
Education
Board
HSTWAverage Gains in Achievement for Students
Who Had Moderate to Intensive Experiences in Numeracy Across the Curriculum
%
Math
Mean
Agriculture 60 +11
Business 60 +10
Construction 65 +12
Health Science 60 +4
Source: 2004 HSTW Assessment

SC 2005 cte 28
Southern
Regional
Education
Board
HSTW
Numeracy Indicators
Took a math class during senior year Took four full-year courses in mathematics Mathematics teachers showed how
mathematics concepts are used to solve real-life problems
Used a graphing calculator to complete mathematics assignments
Completed a mathematics project monthly in ways that most people use mathematics in a work setting

SC 2005 cte 29
Southern
Regional
Education
Board
HSTW
Numeracy Indicators (Cont’d)
Orally defended a process used to solve a mathematics problem monthly
Worked with other students monthly on a challenging mathematics assignment
Worked in groups monthly to brainstorm how to solve a mathematics problem
Solved mathematics problems with more than one answer at least monthly
Solved mathematics problems other than those found in the textbook monthly
Used mathematics monthly to complete challenging assignments in career/technical area

SC 2005 cte 30
Southern
Regional
Education
Board
HSTWPercentages and Achievement Gains of Students Having Moderate and Intensive
Experiences in an Engaging Science Curriculum and Instruction and Mean Scores
%
Science Mean
Agriculture 56 +18
Business 63 +15
Construction 56 +18
Health Science
73 +18
Source: 2004 HSTW Assessment

SC 2005 cte 31
Southern
Regional
Education
Board
HSTW
Percentages of Students Who Had Intensive Experiences in Timely Guidance
%
Agriculture 44
Business 44
Construction 37
Health Science 54
Source: 2004 HSTW Assessment

SC 2005 cte 32
Southern
Regional
Education
Board
HSTWTimely Guidance Indicators
Received the most help in planning a high school program in the 9th grade
Talked to parents about planning for high school Talked to a teacher individually about post-high school Met once a year with an adviser to review a high school
program of study Spoke with someone in a chosen career field Talked to someone from a college about going to
college Received information from school on applying to
college Had an adult mentor or adviser for all four years of
high school

SC 2005 cte 33
Southern
Regional
Education
Board
HSTWAverage Achievement Gains of Students Who
View High School Studies asImportant to Their Future
%
ReadingMean
Math
Mean
Science Mean
Agriculture 65 +17 +10 +15
Business 74 +12 +11 +12
Construction 61 +11 +9 +13
Health Science 83 +11 +10 +11
PLTW 68 +12 +10 +7
Source: 2004 HSTW Assessment

SC 2005 cte 34
Southern
Regional
Education
Board
HSTWImportance of High School Indicators
Courses were often or sometimes exciting and challenging
Often tried to do their best work in school
Seldom or never failed to complete or turn in assignments
Most teachers often encouraged students to do well in school

SC 2005 cte 35
Southern
Regional
Education
Board
HSTWImportance of High School Indicators (Cont’d)
Teachers often showed they cared by not letting students get by without doing the work.
It is very important to study hard to get good grades.
It is very important to participate actively in class.
It is very important to attend all classes. It is very important to take a lot of college-
preparatory classes.

SC 2005 cte 36
Southern
Regional
Education
Board
HSTW
Average Achievement Gains of Students Who Received Quality Extra Help
%
ReadingMean
Math
Mean
Science Mean
Agriculture 44 +11 +7 +11
Business 48 +8 +6 +7
Construction 40 +7 +4 +8
Health Science
53 +6 +5 +6
PLTW 43 +11 +14 +15
Source: 2004 HSTW Assessment
SC 2005 cte 37
Southern
Regional
Education
Board
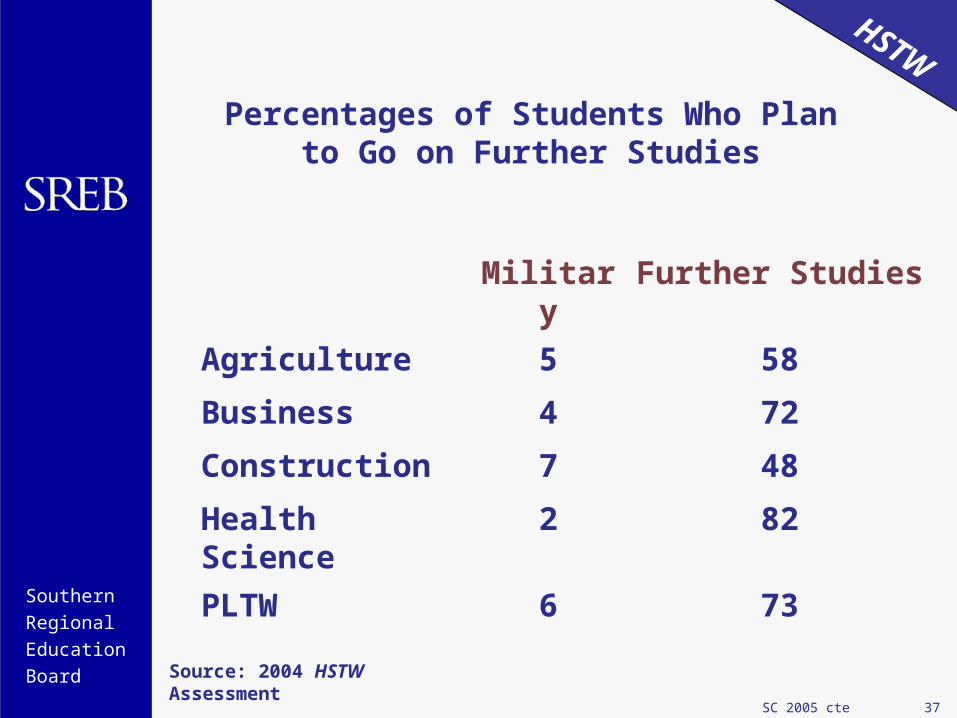
HSTW
Percentages of Students Who Planto Go on Further Studies
Military Further Studies
Agriculture 5 58
Business 4 72
Construction 7 48
Health Science 2 82
PLTW 6 73
Source: 2004 HSTW Assessment

SC 2005 cte 38
Southern
Regional
Education
Board
HSTWWhat can you do to improve high school academic and technical
studies for career/technical students?
Invest in high-quality curriculum materials.
Require training for teaching each course.
Use end-of-course exams. Plan integrated learning projects across
academic and career/technical courses.

SC 2005 cte 39
Southern
Regional
Education
Board
HSTWWhat can you do to improve high
school academic and technical studies for career/technical students?
Define sequences of required mathematics and science courses required.
Train counselors. Develop alliances with postsecondary
education. Require modern labs and supplies.

SC 2005 cte 40
Southern
Regional
Education
Board
HSTWWhat can you do to improve high school academic and technical
studies for career/technical students?
Stress completion of four years each of mathematics and science.
Train career/technical, mathematics and science teachers to do integrated projects.
Urge students to enroll in high-level mathematics and science courses.
Train C/T teachers in reading and writing for learning.