sovereign bancorp, inc. 2007 annual meeting of shareholders thursday, may 3, 2007 philadelphia,...
TRANSCRIPT

Sovereign Bancorp, Inc.
2007 Annual Meeting of Shareholders
Thursday, May 3, 2007Philadelphia, Pennsylvania

2
Forward-Looking Statements
This presentation contains statements of Sovereign Bancorp, Inc.’s (the “Company”) strategies, plans and objectives, estimates of future operating results for Sovereign Bancorp, Inc. as well as estimates of financial condition, operating efficiencies, revenue creation and shareholder value
These statements and estimates constitute forward-looking statements (within the meaning of the Private Securities Litigation Reform Act of 1995) which involve significant risks and uncertainties. Actual results may differ materially from the results discussed in these forward-looking statements
Factors that might cause such a difference include, but are not limited to: general economic conditions, changes in interest rates, deposit flows, loan demand, real estate values, and competition; changes in accounting principles, policies, or guidelines; changes in legislation or regulation; and other economic, competitive, governmental, regulatory, and other technological factors affecting the Company’s operations, pricing, products and services

Overview of Sovereign
Joe CampanelliPresident and
Chief Executive Officer

4
An Exceptional Franchise Serving the Northeastern United States 18th largest bank in
U.S. with $82 billion in assets at March 31st,
2007
785 offices& over 2,000 ATM’s
Approx. 11,350 team members
Source: SNL DataSource
5 Largest MSA’s in Northeast U.S.No. of SOV Mkt SOVOffices Share Rank
New York 226 1.98% 10
Philadelphia 86 4.30% 7
Boston 173 6.65% 3
Providence 55 10.58% 3
Hartford 29 4.78% 6

5
Sovereign’s Vision and Strategy
VisionTo be recognized by customers and prospects as a customer-centric local community bank with large bank capabilities
StrategyTo acquire and retain customers by: Demonstrating convenience through our locations,
technology and business approach Offering innovative and easy-to-use products and services Providing high-quality customer service that is both
responsive and flexible

6
America’s Neighborhood Banksm
7
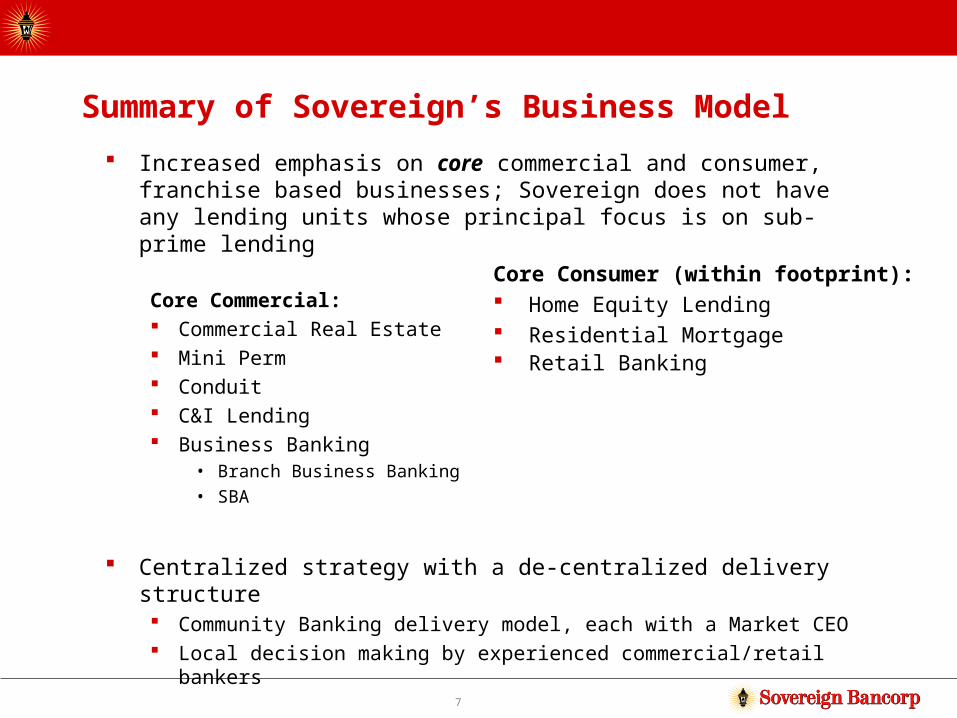
Summary of Sovereign’s Business Model
Increased emphasis on core commercial and consumer, franchise based businesses; Sovereign does not have any lending units whose principal focus is on sub-prime lending
Core Commercial: Commercial Real Estate Mini Perm Conduit C&I Lending Business Banking
• Branch Business Banking• SBA
Centralized strategy with a de-centralized delivery structure Community Banking delivery model, each with a Market CEO Local decision making by experienced commercial/retail bankers
Core Consumer (within footprint): Home Equity Lending Residential Mortgage Retail Banking

8
Specialty Businesses – Regional and National
Auto Finance Dealer Floor Plan Indirect Auto
Aviation Finance
Multi-Family/CRE
Health Care/Not-For-Profit
Asset Based Lending Business Alliance
Capital Corp.
Franchise Finance
Capital Markets
Cash Management
Equipment Finance/Leasing
Trade Finance
Retail Finance
Sports Lending

9
Strategic Alliances
CVS/Cardtronics Over 1,000 ATMs installed to date
First Data Corp. Sovereign Merchant Services Dedicated sales force in excess of 100
ADP Sovereign Payroll Services Dedicated sales force of approximately 225
American Express – OPEN Customer Rewards Program Official card issuer

10
Re-energize Emphasis on Convenience and Customer Service
Consumer banking emphasizes convenience and customer service
Many markets offer 7-day banking
Appointment banking
24/7/365 domestic call centers and internet availability
Developing comprehensive strategy to serve a variety of ethnic markets including Hispanic/Latino markets
Custom Switching Services

11
Experienced Leadership TeamQuality and Depth
Name Business UnitYears of
Experience Prior Institutions
Joe Campanelli President & CEO 25+ Shawmut, Fleet
Brendan Dugan Metro New York/New Jersey 30+ EAB Bank, CitiBank
Steve Issa New England South & Precious Metals 25+ Bank of Rhode Island, Shawmut
Jim Lynch Chairman & CEO, Mid-Atlantic Division 30+ Continental, Prime, Summit, Fleet
Larry McAlee Internal Audit 20 Arthur Anderson, Sovereign
Mark McCollom, CPA Chief Financial Officer 20+ Meridian Bank
Thomas Nadeau Auto Finance/Consumer Lending 20+ Bay Bank
Salvatore Rinaldi Operations & Administration 30+ Fleet, Shawmut
M. Robert Rose Risk Management 30 Shawmut Bank, BankBoston, Fleet
Marshall Soura Global Solutions Group and Marketing 40+ BankBoston, Bank One, Bank of America
Patrick Sullivan New England North & Specialty Businesses
25 Shawmut, BankNorth, Bank of Ireland

12
Objectives for 2007
Execute on four key initiatives to deliver improved quality of earnings, provide greater transparency and understanding of Sovereign’s businesses and strategy, and better position Sovereign for sustainable growth
The four initiatives are to:1. Improve productivity and expense management2. Improve the capital position and quality of earnings3. Improve the customer experience4. Improve communications with all stakeholders

Improving Productivity and Expense Management

14
Expense Reduction Initiative Announced in December 2006
Primary focus on: Functional redundancies and operating inefficiencies Products/business lines not meeting profit or
strategic goals Leverage economies of scale with vendor supply
and service contracts Consolidations of departments Optimization of retail delivery channels
While minimizing impact on customer facing activities and organic revenue generation
Identified ~$100 million of expense reductionsIdentified ~$100 million of expense reductions

15
Progress To Date
Over 200 cost savings initiatives identified for implementation – all on plan to meet projected savings
Targeted reduction in force in excess of 800 FTE positions or 7% reduction in staff 379 team member positions eliminated to date
145 positions open due to turnover have been closed
Approximately 400 positions to be eliminated primarily through attrition by Q3 2007
40 non-strategic community banking offices to be closed or consolidated in the 2nd and 3rd quarter
Initiatives have company-wide involvement Approved 135 of 339 team member suggestions, resulting in $5.0 million
of run-rate savings

16
Anticipate 100% of cost reductions to be realized, on a run rate basis, by the end of 2007:
75% realized by the end of the second quarter of 2007 100% realized by the end of 2007
Over $80 million of expense reductions will be reflected in 2007 financial statements
Expense savings are a key component to achieving positive operating leverage in 2007
Expense Reduction Initiative Implementation

17
Capital Re-investment in Core Businesses to Continue Sovereign will continue to invest in core commercial and
consumer businesses as well as targeted specialty businesses
Sovereign will continue to make investments to improve the customer experience Comprehensive review of all bank information systems currently
underway Reduction of account opening time More incentives focused on sales and service Revitalization of Community Banking Offices
Sovereign intends to direct greater marketing resources toward deposit products in 2007
Sovereign plans to open/relocate up to 40 new community banking offices over the next 2 years – up to 18 in 2007 and 22 in 2008

Improving Capital Position and Quality of Earnings

19
Balance Sheet Restructuring – Reduced Reliance on Wholesale Assets and Wholesale Funding
Sold about $7.6 billion of assets during the fourth quarter of 2006 and first quarter of 2007:
$3.3 billion of correspondent home equity loans $2.5 billion of purchased residential mortgages $1.5 billion of investment securities sold and reinvested $300 million of FHLB stock sold
Reduced wholesale funding $9.1 billion during the first quarter of 2007:
Reduced higher cost wholesale deposits $1.2 billion Repaid $7.9 billion of short-term borrowings

20
Commercial Real Estate
18%
C&I20%
Multi-family9%
Residential Mortgages
28%
Home Equity15%
Auto8%
Other Commercial
1%
Other Consumer
1%
Commercial Real Estate
21%
C&I22%Multi-family
9%Other
Commercial1%
Home Equity11%
Auto10%
OtherConsumer
1%
Residential Mortgages
25%
Improved Loan Mix – Result of Balance Sheet Restructuring
Period-end balances
December 31, 2006 March 31, 2007
1Q07 Loan Sales:$3.3 billion correspondent home equity loans$2.5 billion purchased residential mortgages
$1.3 billion multi-family loans
Total Commercial Loans 48.7%Total Consumer Loans 51.3%
Total Commercial Loans 53.2%Total Consumer Loans 46.8%

21
Benefits of Restructuring
Repositions Sovereign for sustainable growth in core earnings long-term
Improves risk profile of balance sheet
Improves capital levels
Provides investment capital to support organic growth
Reduces reliance on purchased assets and wholesale funding, improving quality of balance sheet and income statement
Enables management to fully focus attention on building core competencies

22
Improvement In Core Operating Metrics
Net interest margin – pro forma annualized benefit of approximately 20 to 25 basis points
Net interest margin expanded 10 basis points during the first quarter of 2007
Because of timing of sales, benefit is expected to be fully reflected in 2Q07, partial benefit in 1Q07
Loan to deposit ratio improved to 107% in March 2007 from 119% in December 2006
Improved capital ratios Sovereign Bancorp’s Tier 1 Leverage ratio increased
approximately 50 basis points at March 31, 2007 Sovereign Bank’s Total Risk-Based Capital ratio increased
approximately 40 basis points at March 31, 2007

Improving The Customer Experience

24
Tactical Plans To Improving Customer Experience Improve quality of service
Migrated back to domestically based customer service functions Refresher service training for all customer service personnel is
underway and will be completed during the second quarter Realign consumer and commercial infrastructure
Consolidation of commercial and retail on-line banking• Economies of development• Better customer experience - easier to use, more functionality
Rationalize product set
Franchise wide roll-out of customer switching services
Optimize sales process
Increase online usage Expand ATM network
Developed partnership with CVS to provide ATM banking services at over 1,000 locations
Align advertising and promotion with market needs

25
Core Deposit Growth Strategy Strategy to improve core deposit growth goals:
Marketing/Sales• Focus sales force on core deposit acquisition• Implement coordinated, aggressive balance-building campaigns• Align advertising, incentives and communication in support of the core
deposit growth goals• Optimize effectiveness of the advertising spend by re-allocating across
geographies• Integrate Small Business into marketing plan
Products• During the first quarter we streamlined our retail product set by half –
10 checking products to 5• Increase balance retention by addressing grandfather accounts• Establish standard “everyday good rate” pricing for money market
accounts Capabilities
• Develop and introduce Partnership Banking Program• Upgrade online account marketing and acquisition capabilities• Seek to leverage “Switch” program

Improving Communications with all Stakeholders

27
Improving Communication
Management’s responsibility is to share with all key constituents information that is timely, accurate, consistent and concise
Key constituents include: Team Members Shareholders Analysts Customers
Changes to date – Financial Disclosures: Operating earnings definition Capital ratios streamlined More credit quality detail (C&I, CRE) More deposit detail (wholesale vs. core)
Community leaders Advisory groups Regulators Rating agencies

28
What to Expect in 2007
Disciplined and focused approach to increasing the value of our core franchise Increase the rate of household and enterprise acquisition Increase the rate of cross selling and share of wallet
Continued formation of a solid capital position
Company-wide program to improve our sales culture
Continued focus on operational excellence Better, faster and cheaper
Continue to increase communications and transparency Both internally and externally

Financial Review
Mark McCollomChief Financial Officer

30
2006 Financial Highlights
Net income of $137 million or $.30 per share as compared to $676 million or $1.69 per diluted share in 2005
Operating/cash earnings for EPS purposes of $692 million or $1.48 per share as compared to $716 million or $1.72 per diluted share in 2005
Deposit growth of 40%, including acquisitions; organic deposit growth of 7%
Loan growth of 47%, including acquisitions; organic loan growth of 16%
Annualized net loan charge-offs of .25%, which excludes .71% of net charge-offs related to the fourth quarter balance sheet restructuring, as compared to .20% in 2005
Announced balance sheet restructuring and expense management initiatives during the fourth quarter of 2006
31
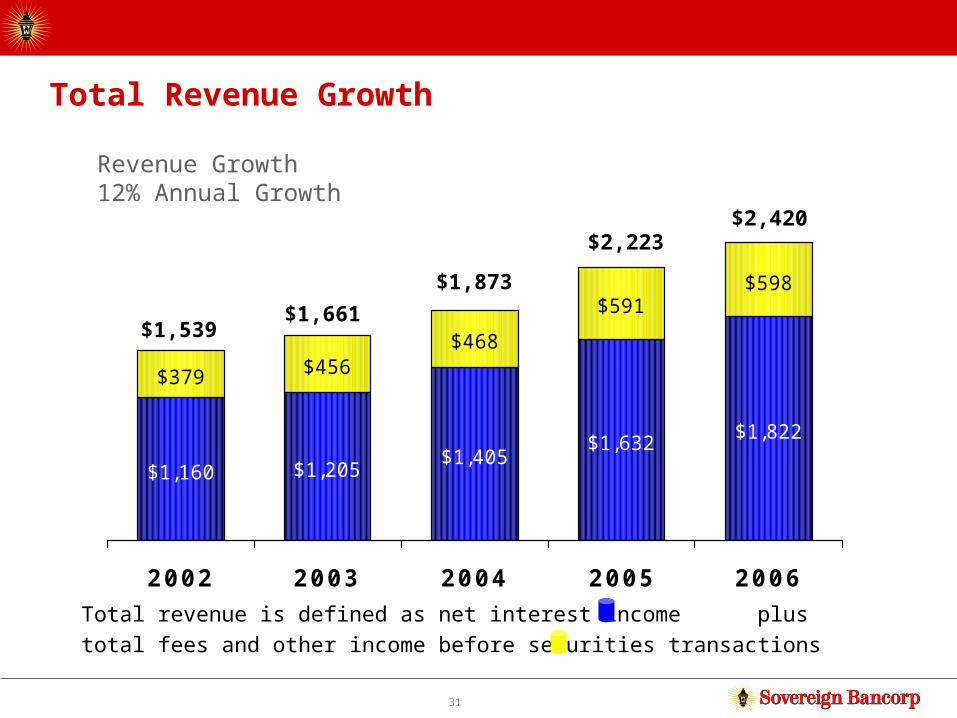
Total Revenue Growth
$1,160 $1,205$1,405
$1,632 $1,822
$379 $456$468
$591$598
2002 2003 2004 2005 2006
Revenue Growth12% Annual Growth
Total revenue is defined as net interest income plus total fees and other income before securities transactions
$1,661$1,539
$1,873
$2,223$2,420

32
Total Expense Growth
$814 $852 $943$1,089
$1,290
$163 $158$236
$163
$314
$146 $162$127 $90
$189
2002 2003 2004 2005 2006
Total Expense Growth12% Annual Growth
Total expenses includes provision for credit losses , G&A expense and other expense . 2006 provision excludes $296 million related to the fourth quarter balance sheet restructuring.
$1,172$1,123
$1,306 $1,342
$1,792

33
First Quarter of 2007 Highlights Net income of $48 million or $.09 per share, including charges, as
compared to $141 million or $.36 per diluted share a year ago
Operating/cash earnings for EPS purposes of $180 million or $.35 per share as compared to $155 million or $.38 per diluted share a year ago
Balance sheet restructuring completed during first quarter of 2007
Strong loan growth in core commercial and consumer portfolios offset by loan sales as part of balance sheet restructuring
Average deposits declined $988 million during the quarter; of this $734 million was planned runoff in higher cost wholesale deposits as we reduced our reliance on these wholesale deposit sources

34
First Quarter of 2007 Highlights
Net interest margin expanded 10 basis points from fourth quarter levels to 2.70%
G&A expenses declined $25 million or 7% from fourth quarter levels
Credit quality continues to meet our expectations
Capital ratios expanded within expectations, with most of the ratios expanding in excess of 40 basis points Tier 1 Leverage was 6.25% vs. 5.73% at year-end Tangible equity was 4.2%, up from 3.73% at year-end
Received credit rating upgrade from Moody’s to A3 from Baa1

35
Operating Metrics
3.00%2.86%
2.64%2.70%
2.60%
1Q06 2Q06 3Q06 4Q06 1Q07
Net Interest Margin
1.8%
1.7%
1.6% 1.5%1.6%
1Q06 2Q06 3Q06 4Q06 1Q07
G&A Expense to Average Assets
0.98% 0.89% 0.91% 0.83%0.73%
1Q06 2Q06 3Q06 4Q06 1Q07
Operating Return on Average Assets

36
What To Expect In 2007
Upper-single digit year-over-year growth in core commercial and consumer loan categories
Reductions in correspondent home equity and residential mortgage lending
Mid-single digit year-over-year growth from in-market deposits, offset by declines in wholesale deposits
$80 million decline in G&A expenses from fourth quarter levels offset by investment in core franchise
Improvement in net charge-offs over last year as result of correspondent home equity portfolio sale, partially offset by anticipated weakening of credit

Sovereign Bancorp, Inc.
2007 Annual Meeting of Shareholders
Thursday, May 3, 2007Philadelphia, Pennsylvania

Appendix

39
Operating Earnings Per Share
This presentation contains financial information determined by methods other than in accordance with U.S. Generally Accepted Accounting Principles (“GAAP”)
Sovereign’s management uses the non-GAAP measures of Operating Earnings in its analysis of the company’s performance. These measures typically adjust net income determined in accordance with GAAP to exclude the effects of special items, including significant gains or losses that are unusual in nature or are associated with acquiring and integrating businesses, and certain non-cash charges
Since certain of these items and their impact on Sovereign’s performance are difficult to predict, management believes presentations of financial measures excluding the impact of these items provide useful supplemental information in evaluating the operating results of Sovereign’s core businesses
These disclosures should not be viewed as a substitute for net income determined in accordance with GAAP, nor are they necessarily comparable to non-GAAP performance measures, which may be presented by other companies

40
One Non-GAAP Financial Measure
Sovereign’s management used the non-GAAP measure of Operating Earnings, and that related per share amounts on their analysis of the company: Provides greater financial transparency
Provides useful supplemental information when evaluating Sovereign’s core businesses
Operating Earnings represent net income adjusted for after-tax effects of merger-related and integration charges and any other non-recurring charges

41
Reconciliation of Operating Earnings to Reported GAAP Earnings
($ in thousands) Year Ended December 31,
2006 2005 2004 2003 2002Net Income as reported 136,911$ 676,160$ 453,552$ 401,851$ 341,985$ Dividends on preferred stock (7,908) - - - - Net Income available to common shareholders 129,003$ 676,160$ 453,552$ 401,851$ 341,985$
Net Income available to common shareholders 129,003 Contingently convertible trust preferred interest expense, net of tax 25,360 25,427 21,212
Net Income for EPS purposes 154,363$ 0.30$ 701,587$ 1.69$ 474,764$ 1.29 401,851$ 1.32 341,985$ 1.17
Net income for Operating earnings EPS purposes 154,363$ 0.33$ 701,587$ 1.69$ 453,552$ 1.31 401,851$ 1.32 341,985$ 1.17 Merger-related and integration costs 27,574 0.06 8,284 0.02 30,134 0.09 10,316 0.04 Provision for loan loss 200,499 0.43 3,900 0.01 3,900 0.01 Loss on economic hedge 7,402 0.02 Restructuring of balance sheet 197,799 0.42 42,605 0.12 18,838 0.06 Restructuring charges 51,134 0.11 2,589 0.01 Impairment charge for FNMA and FHLMC preferred stock 43,875 0.09 20,891 0.06 Proxy and professional fees 9,319 0.02 3,788 0.01 Non-solicitation expenseOperating earnings for EPS purposes 691,965$ 1.48$ 716,248$ 1.72$ 551,082$ 1.59$ 420,689$ 1.38$ 356,201$ 1.22$
Weighted average diluted shares for GAAP EPS 433,908 415,996 367,811 305,001 292,991 Add back of diluted shares for Operating EPS not factored into GAAP diluted shares due to antidilution 33,840 - (22,823) - - Adjusted weighted average diluted shares for Operating EPS 467,748 415,996 344,988 305,001 292,991

42
Mar. 31 Mar. 312007 2006
Net income/ (loss) as reported 48,059$ 141,398$
Dividends on preferred stock (3,650) -
Net income available to common shareholders 44,409 141,398
Contingently convertible trust preferred interest expense, net of tax - 6,327 Net income/ (loss) for EPS purposes 44,409$ 0.09$ 147,725$ 0.36$
Non GAAP adjustments to adjust antidilutive EPS
Net income available to common shareholders 44,409$
Trust IV expense, net of tax 6,412
Antidilutive net income/ (loss) for operating EPS calculation 50,821$
Reconciliation to Operating earnings EPS
Net income/ (loss) for Operating earnings EPS purposes 50,821$ 0.10$ 147,725$ 0.36$
Merger related and integration costs 1,323 0.00 (1,819) (0.00)
Loss on restructuring, other employee severance and debt repurchase charges 12,771 0.02 - -
ESOP expense related to freezing of plan 43,385 0.09 - -
Hedge loss on sale of multifamily loans (3,860) (0.01) - -
Gain on redemption of FNMA and FHLMC preferred stock (953) (0.00) - -
Writedown on correspondent home equity loans 76,394 0.15 - -
Proxy and related professional fees (249) (0.00) 9,319 0.02
Operating earnings for EPS purposes 179,632$ 0.35$ 155,225$ 0.38$
Weighted average diluted shares for GAAP EPS 475,115 410,366 Add back of diluted shares for operating EPS not factored into GAAP diluted shares due to antidilution (1) 34,353 - Adjusted weighted average diluted shares for Operating EPS 509,468 410,366
(1) The conversion of warrants and equity awards and the after-tax add back of Sovereign's contingently convertible trust preferred interest expense was excluded from Sovereign's GAAP diluted earnings per share calculation for the first quarter of 2007 since the result would have been anti-dilutive. However, for operating earning purposes these items are dilutive and as a result they have been added back for operating earnings and operating earnings
Reconciliation of Operating Earnings to Reported GAAP Earnings
($ in thousands)
Quarter Ended

Sovereign Bancorp, Inc.