sp’ 05w. li solidification and heat treatment solidification crystal structures ...
TRANSCRIPT

Sp’ 05 W. Li
Solidification and Heat Treatment
Solidification Crystal structures
Structure-property relationships Heat treatment

Pure Metal Solidification
• Temperature remains constant while grains grow.
• Some metals undergo allotropic transformation in solid state.
• For example on cooling bcc -iron changes to fcc -iron at 1400 C, which again to bcc -iron at 906 C.
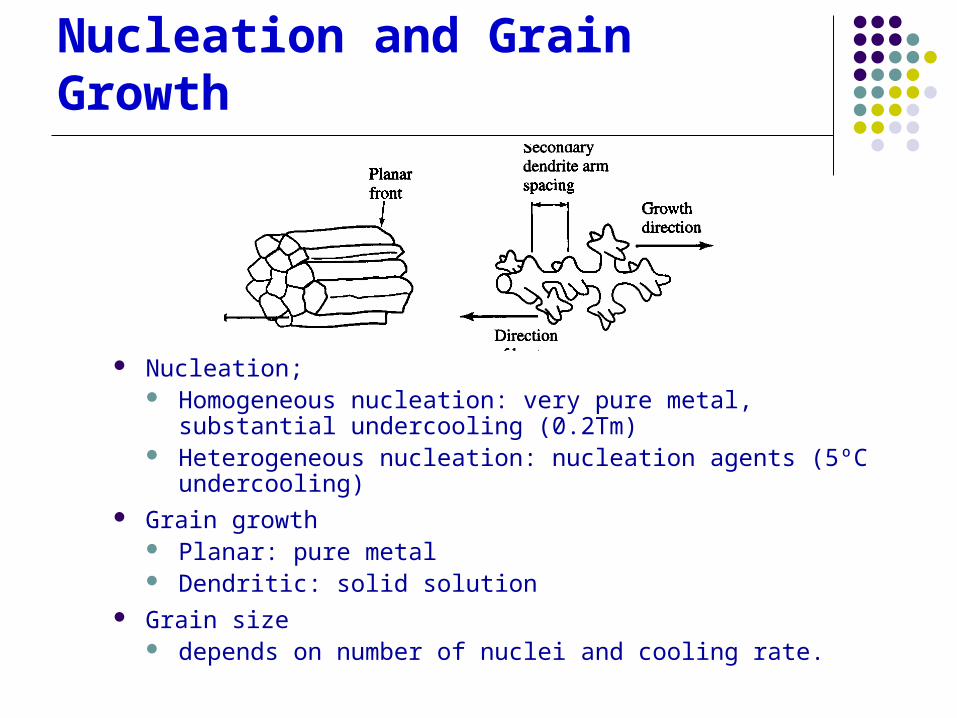
Nucleation and Grain Growth
Nucleation; Homogeneous nucleation: very pure metal, substantial
undercooling (0.2Tm) Heterogeneous nucleation: nucleation agents (5ºC
undercooling) Grain growth
Planar: pure metal Dendritic: solid solution
Grain size depends on number of nuclei and cooling rate.

Crystal Nucleation and Growth
“Manufacturing Processes for Engineering Materials,” by Serope Kalpakjian
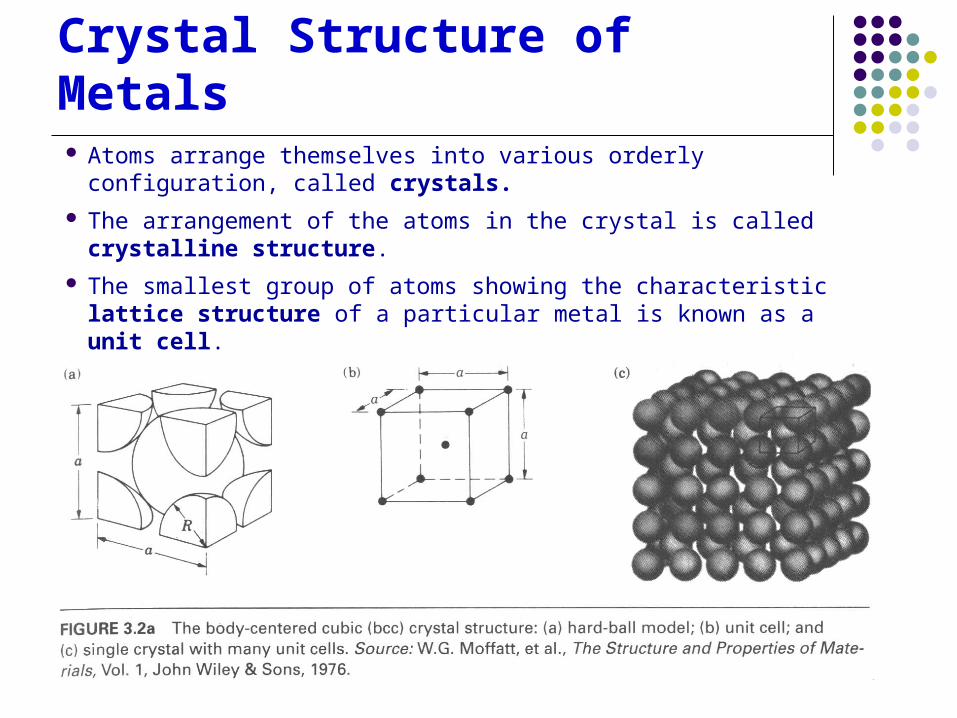
Crystal Structure of Metals Atoms arrange themselves into various orderly configuration,
called crystals.
The arrangement of the atoms in the crystal is called crystalline structure.
The smallest group of atoms showing the characteristic lattice structure of a particular metal is known as a unit cell.

Crystal Structure of Metals

Slip Systems Deformation (dislocation) occurs on preferential
crystallographic planes and directions, called slip systems.
The slip plane/direction is the plane/direction with the most closely packed atoms.
6x2=12 4x3=12 1x3=3

Slip Systems
BCC has 6 slip planes and 2 slip directions per plane (12 slip systems), but distance between slip planes is small, therefore the required stress is high. Good Strength and moderate ductility, e.g. Steel, Titanium, Molybdenum, Tungsten.
FCC has 4 slip planes and 3 slip directions per plane (12 Slip Systems), but distance between slip planes is larger than BCC. Therefore, probability of slip is moderate, shear stress to cause slip is low. Moderate Strength and Good Ductility, e.g., Aluminum, Copper, Gold, Silver
HCP has 1 slip plane and 3 slip directions on that plane (3 systems). Low probability of slip. Generally brittle materials, e.g., Beryllium, Magnesium, and Zinc

Plastic Deformation of Single Crystals

Theoretical Shear Strength and Tensile Strength
Theoretical shear stress is the shear stress to cause permanent deformation in a perfect crystal.
Theoretical or ideal tensile strength of material is the tensile stress required to break the atomic bonds between two neighboring atomic planes.
The actual strength of metals is approximately one to two orders of magnitude lower than the theoretical strengths. The discrepancy can be explained in terms of imperfections in the crystal structure.
30/~10/2max GGbetween
a
bG
10/max E

Solid Solutions
Most metals are not pure but contain a number of other metallic or non-metallic elements, either alloying elements or contaminants. Alloying elements are uniformly distributed in the base metal, forming a solid solution.
Substitutional solid solution Interstitial solid solution

Effect of Imperfections
Pure metal: dislocation Solid solutions
Solute atoms of slightly different size distort the lattice and makes dislocation propagation more difficult, thus strength increases without necessarily reducing ductility.
Interstitial elements play a similar role in impeding dislocation mobility although they can have an embrittling effect.
Interfaces, inclusions, gases

Grain Size Effect Grain boundaries present
obstacles to dislocation propagation. Therefore, it is generally found that the yield strength of a material increase with decreasing grain size according to the Hall-Petch equation.
However at low strain rate and close to Tm, dislocation is resolved by diffusion. Material deforms by sliding of grains or reshaping of grains. Both processes are easier if grain size is small.

Phase Diagrams
• A phase diagram, also called equilibrium diagram or a constitutional diagram, graphically illustrates the relationships among temperature, composition, and the phases present in a particular alloy system.

Lever Rule
The composition of various phases in a phase diagram can be determined by a procedure called the lever rule.
Example: Calculate the relative proportions of the phases in a Cu-Ag alloy of eutectic composition just below the eutectic temperature.
Ls
s
Ls
L
CC
CC
LS
Lor
CC
CC
LS
S
00
%2.232.919.7
2.919.71
CC
CCE

The Structure of a Cu-Ag Solid Solution with 20% Ag

Iron/Iron Carbide Phase Diagram

Nonequilibrium Solidification
Microsegregation or coring

Heat Treatment Most parts will require heat treatment either after or
during the processing for proper in-service properties
Annealing Heat to elevated temp, hold, cool Softens the material and removes stress
Precipitation Hardening Diffusion of alloys to produce two phase structure that
promote good strength and ductility (Aging – Aluminum for example)
Heat Treatment of Steel
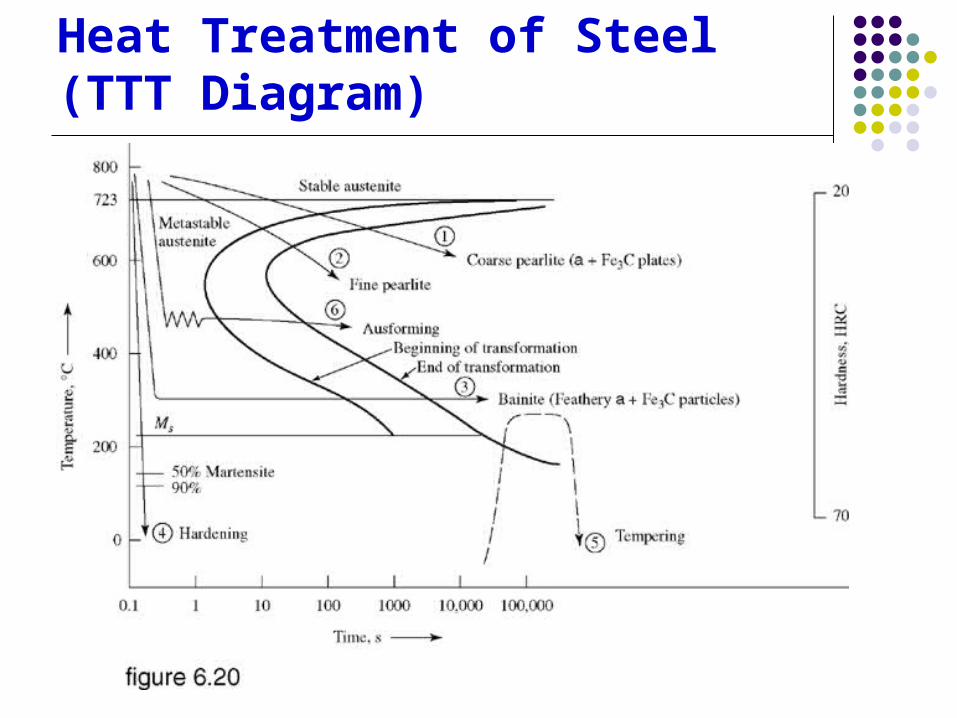
Heat Treatment of Steel (TTT Diagram)

Summary
Solidification process affects crystal structures which in turn affect material properties.
Single crystal materials behave very differently than metal alloys.
The effect of imperfections and grain size in solid solutions.
Heat treatment can modify material properties by changing the crystal structure.