sp 225 lecture 4
DESCRIPTION
SP 225 Lecture 4. Introduction to Data and Levels of Measurement. Manipulating Data Sheets. GENERAL Social Survey and SPSS. How Do We Collect Data to Test Hypothesis?. Natural Sciences Physical Measurements Observations Social Sciences Survey Data Community Observations Interviews. - PowerPoint PPT PresentationTRANSCRIPT
SP 225Lecture 4
Introduction to Data and Levels of Measurement

GENERAL SOCIAL SURVEY AND SPSS
Manipulating Data Sheets
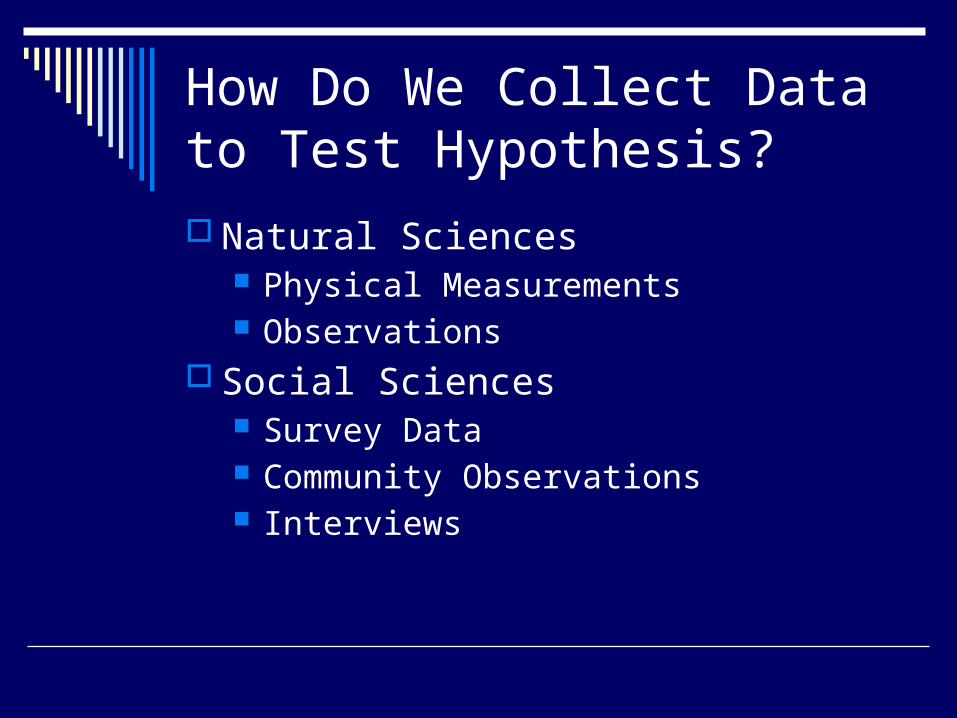
How Do We Collect Data to Test Hypothesis? Natural Sciences
Physical Measurements Observations
Social Sciences Survey Data Community Observations Interviews
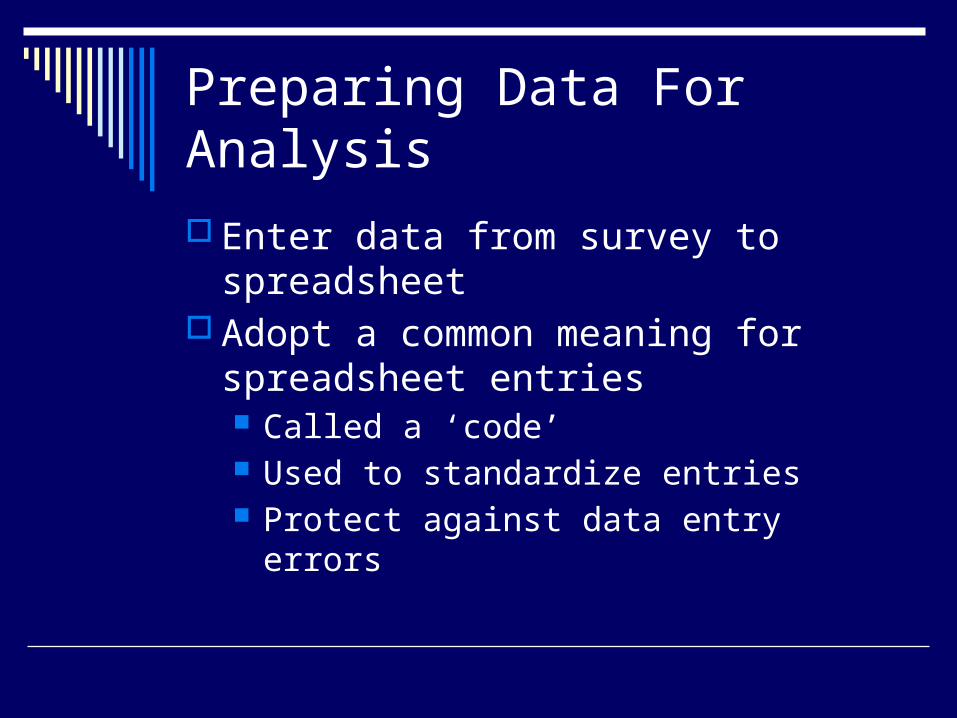
Preparing Data For Analysis
Enter data from survey to spreadsheet Adopt a common meaning for
spreadsheet entries Called a ‘code’ Used to standardize entries Protect against data entry errors

Survey Data Standardizing and interpreting responses Managing missing or erroneous
responses
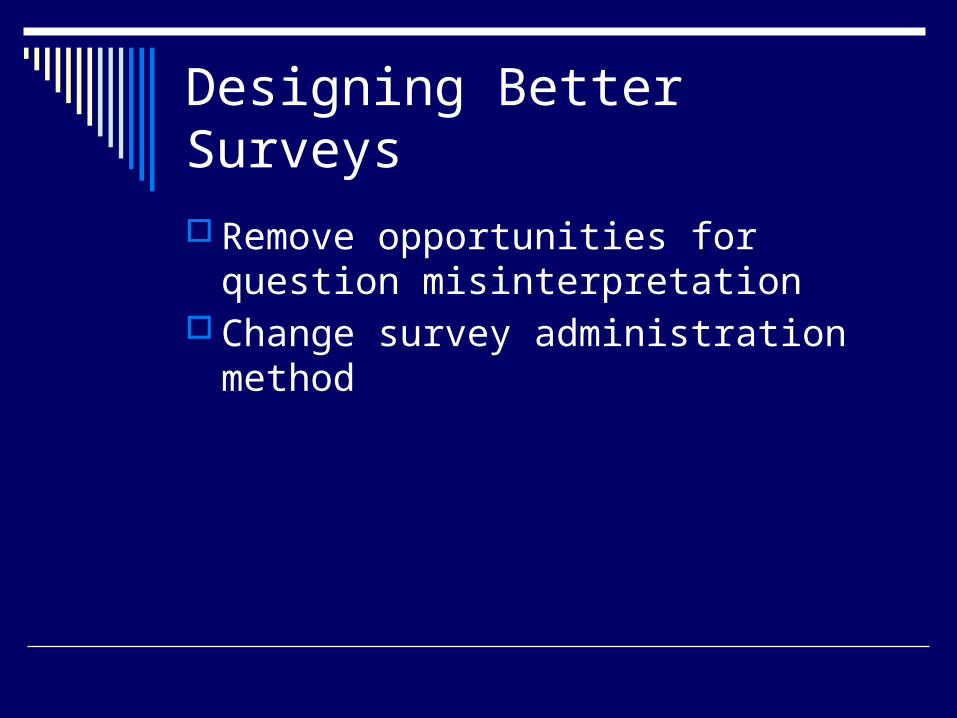
Designing Better Surveys
Remove opportunities for question misinterpretation
Change survey administration method
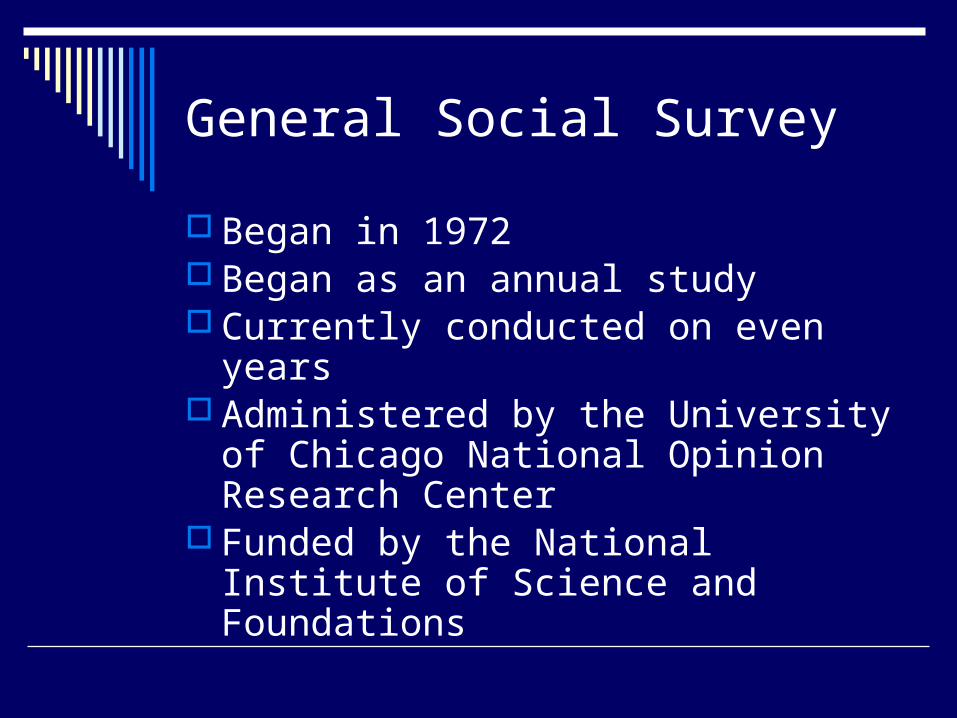
General Social Survey
Began in 1972 Began as an annual study Currently conducted on even years Administered by the University of
Chicago National Opinion Research Center
Funded by the National Institute of Science and Foundations

Usage
Over 12,000 research uses 250,000 students use the data annually

Study Design
Block Design Cluster Design Methodology has been varied to
understand any impact methodology has on study results
We can analyze it as a random sample
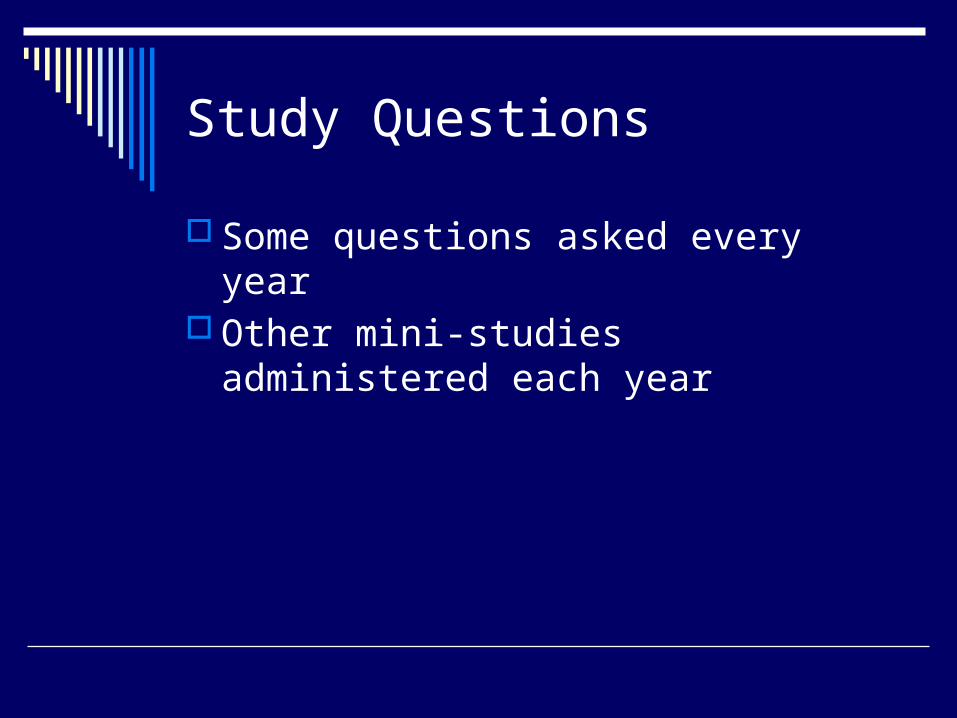
Study Questions
Some questions asked every year Other mini-studies administered each
year
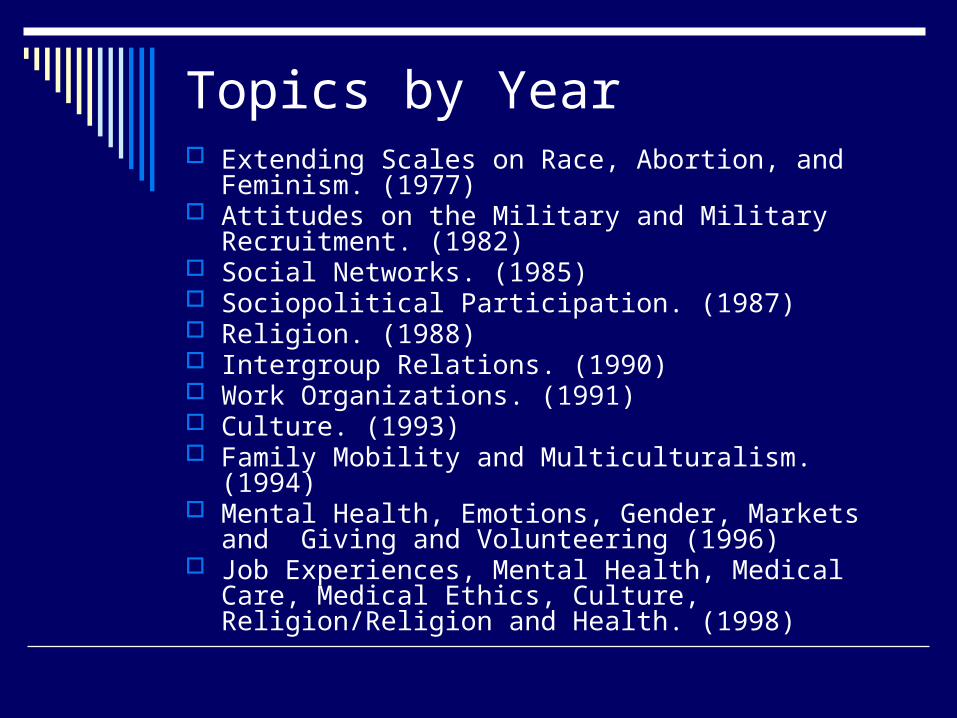
Topics by Year Extending Scales on Race, Abortion, and Feminism.
(1977) Attitudes on the Military and Military Recruitment. (1982) Social Networks. (1985) Sociopolitical Participation. (1987) Religion. (1988) Intergroup Relations. (1990) Work Organizations. (1991) Culture. (1993) Family Mobility and Multiculturalism. (1994) Mental Health, Emotions, Gender, Markets and Giving
and Volunteering (1996) Job Experiences, Mental Health, Medical Care, Medical
Ethics, Culture, Religion/Religion and Health. (1998)
Guide to GSS Contents
http://webapp.icpsr.umich.edu/GSS/index.html
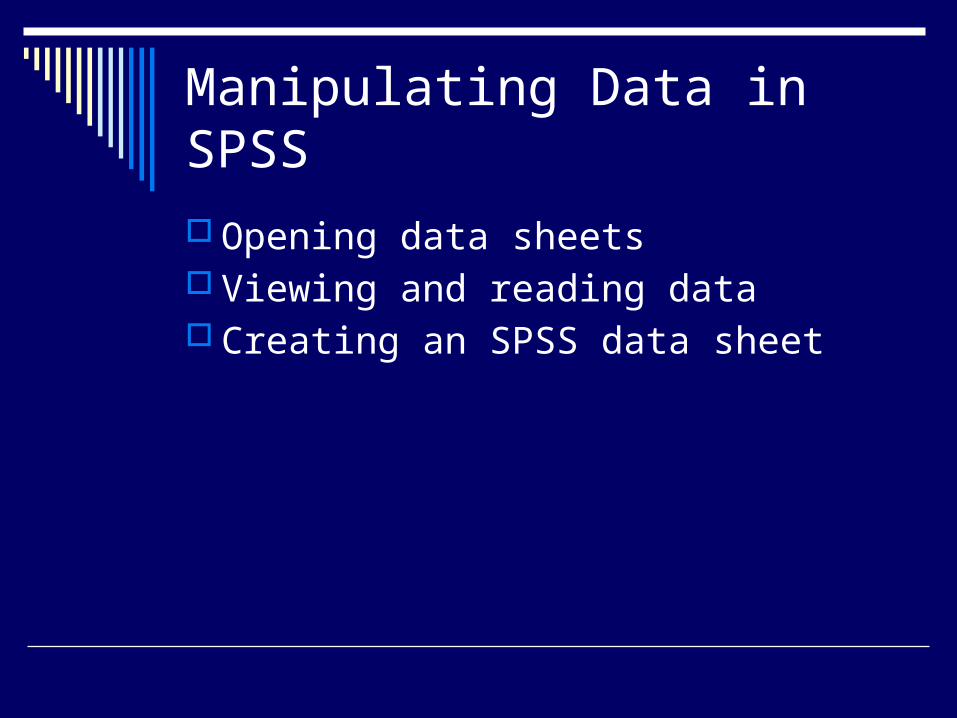
Manipulating Data in SPSS
Opening data sheets Viewing and reading data Creating an SPSS data sheet
LEVELS OF MEASUREMENT
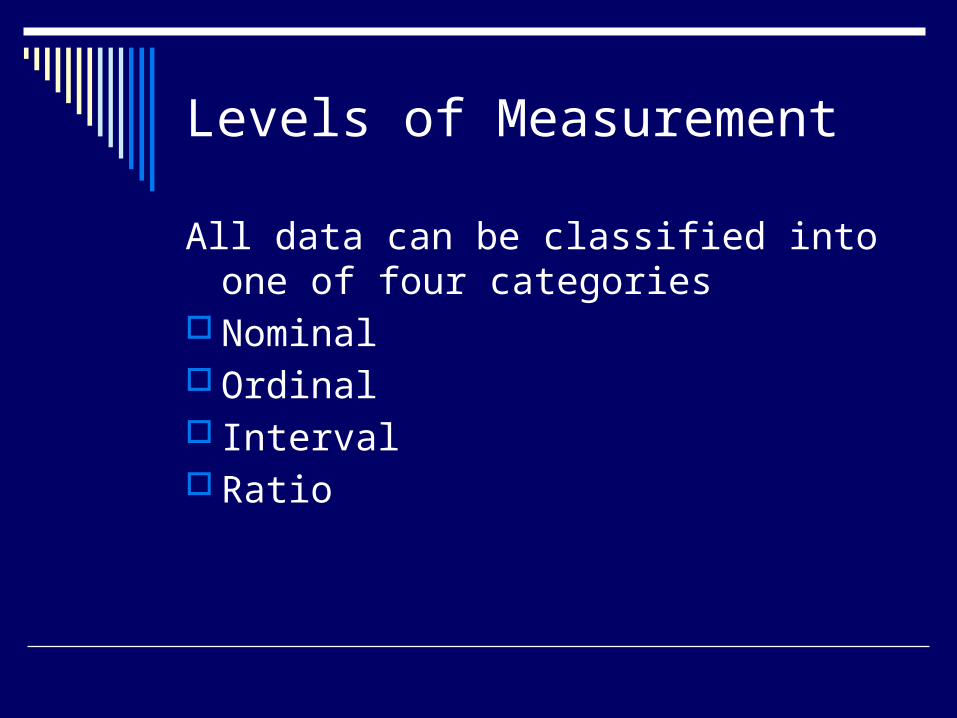
Levels of Measurement
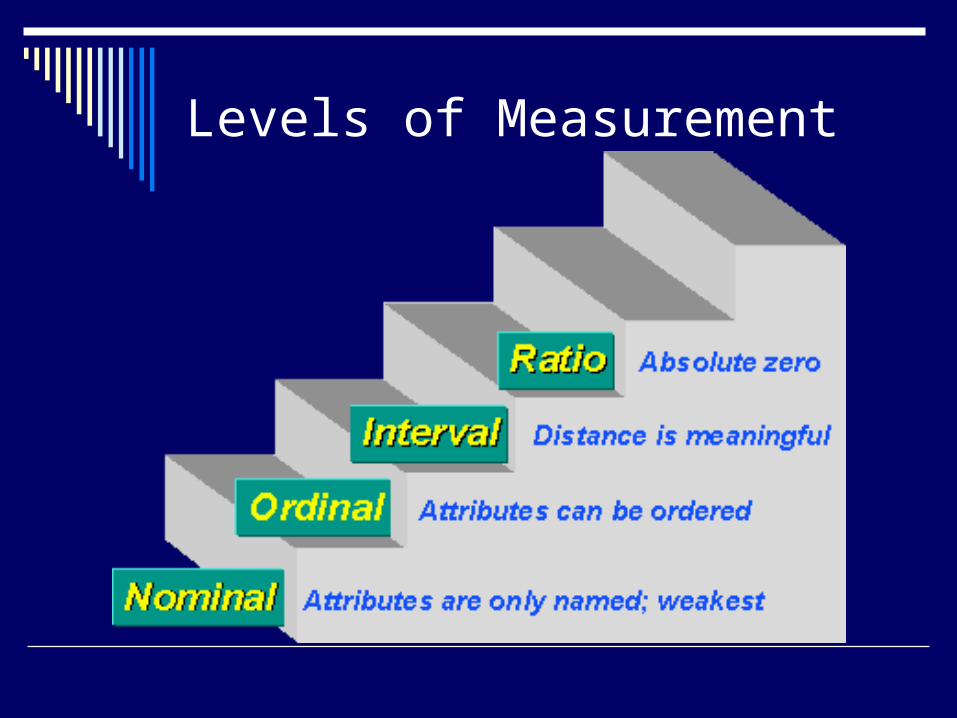
All data can be classified into one of four categories
Nominal Ordinal Interval Ratio
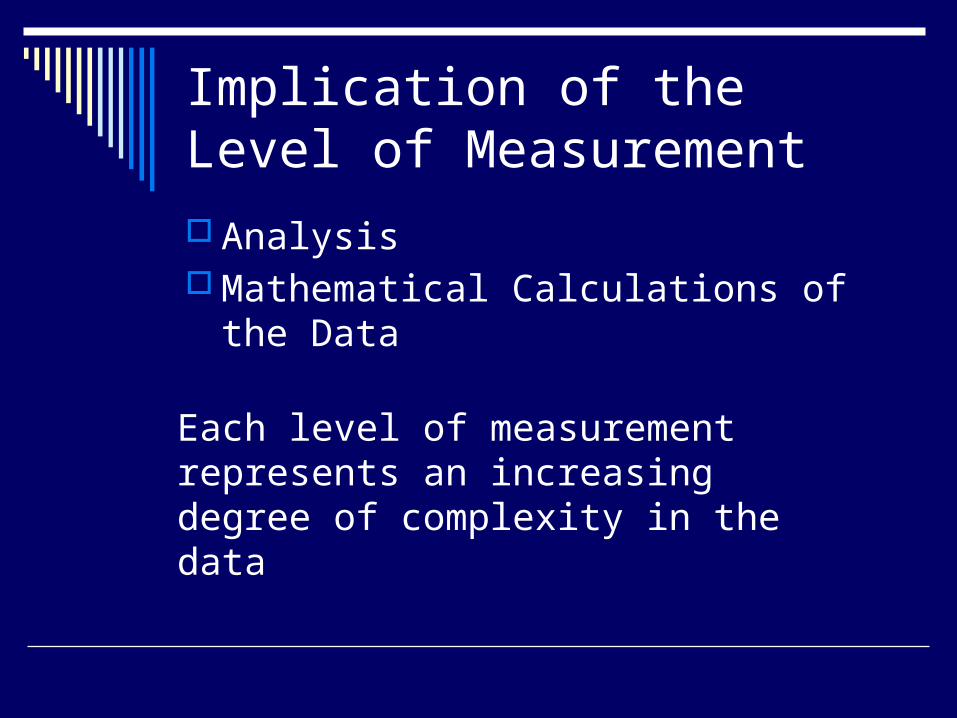
Implication of the Level of Measurement Analysis Mathematical Calculations of the Data
Each level of measurement represents an increasing degree of complexity in the data
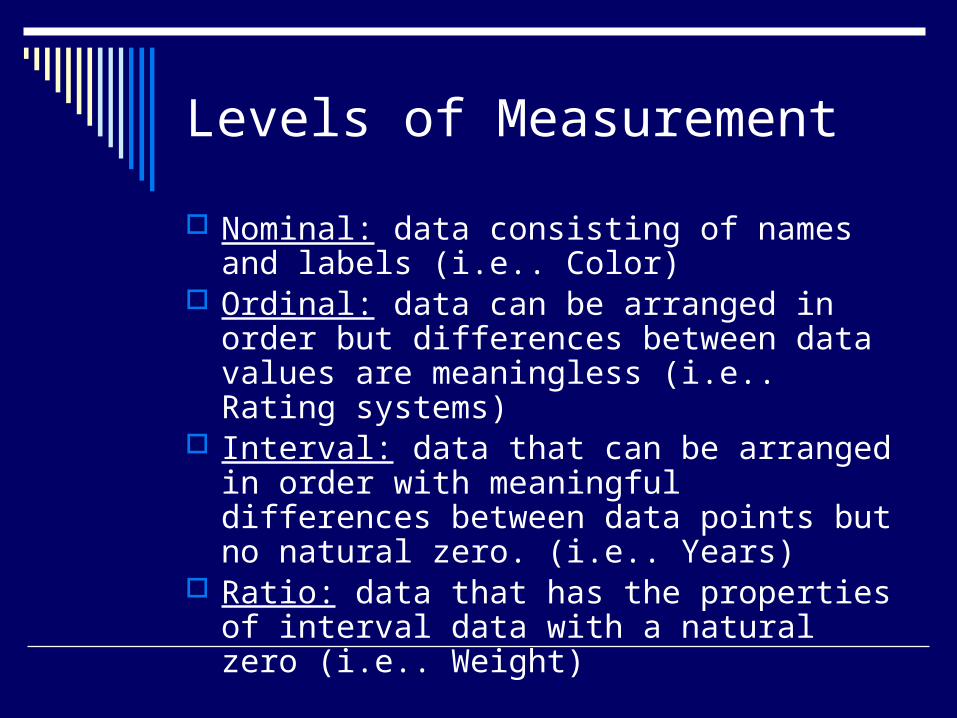
Levels of Measurement
Nominal: data consisting of names and labels (i.e.. Color)
Ordinal: data can be arranged in order but differences between data values are meaningless (i.e.. Rating systems)
Interval: data that can be arranged in order with meaningful differences between data points but no natural zero. (i.e.. Years)
Ratio: data that has the properties of interval data with a natural zero (i.e.. Weight)
Levels of Measurement
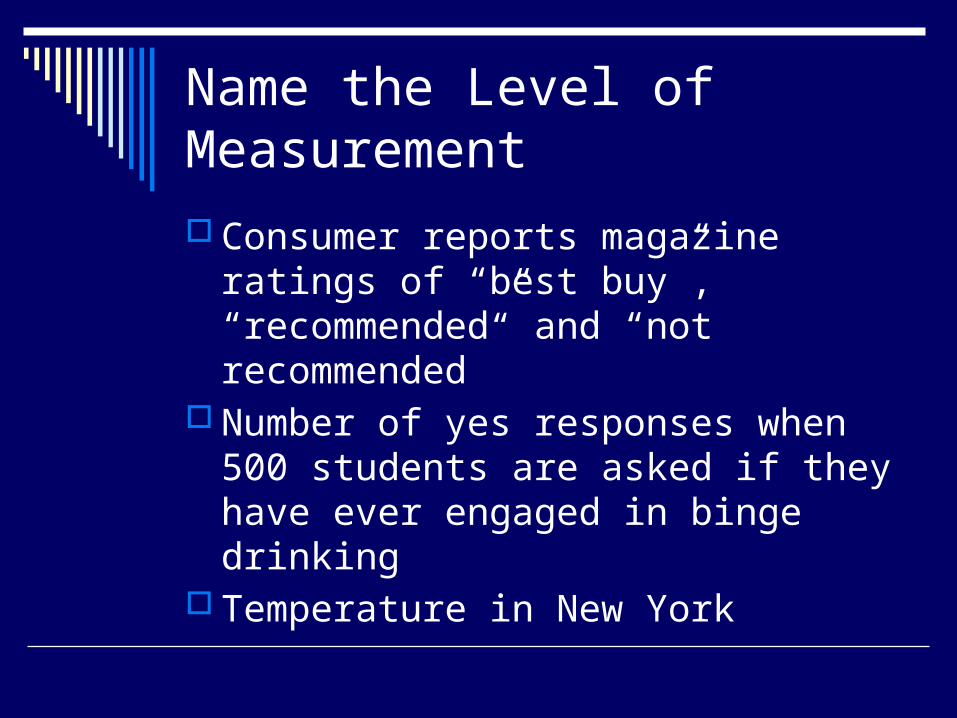
Name the Level of Measurement Consumer reports magazine ratings of
“best buy”, “recommended” and “not recommended”
Number of yes responses when 500 students are asked if they have ever engaged in binge drinking
Temperature in New York

M&M Example What characteristics of a bag of M&M’s
are nominal, ordinal or interval/ratio in measurement?

Levels of Measurement in Data Collection Identifying levels of measurement from a
survey question Changing the level of measurement Identifying levels of measurement from a
described research project