s&p 500 yields: earnings, dividends, & buybacks · table of contents table of contentstable...
TRANSCRIPT
Stock Market IndicatorsS&P 500 Yields:
Earnings, Dividends,& Buybacks
Yardeni Research, Inc.
July 1, 2018
Dr. Edward Yardeni516-972-7683
Joe Abbott732-497-5306
Mali Quintana480-664-1333
Please visit our sites atwww.yardeni.comblog.yardeni.com
thinking outside the box
Table Of Contents Table Of ContentsTable Of Contents
July 1, 2018 / S&P 500 Yields: Earnings, Dividends, & Buybacks www.yardeni.com
Yardeni Research, Inc.
S&P 500 3S&P 500 and Ex-Energy 4S&P 500 Consumer Discretionary 5S&P 500 Consumer Staples 6S&P 500 Energy 7S&P 500 Financials 8S&P 500 Health Care 9S&P 500 Industrials 10S&P 500 Information Technology 11S&P 500 Materials 12S&P 500 Telecommunication Services 13S&P 500 Utilities 14S&P 500 Sectors Dividend Yield 15S&P 500 Sectors Buyback Yield 16S&P 500 Sectors Dividends + Buybacks Yield 17Dividends + Buybacks as % of Operating Earnings 18Buybacks as % of Market Cap 19S&P 500 Sectors Buybacks 20S&P 500 Sectors Cumulative Buybacks Since Q1-2009 21
0
200
400
600
800
1000
1200
1400
0
200
400
600
800
1000
1200
1400
Q1
Q1
Q1Q1
1999 2000 2001 2002 2003 2004 2005 2006 2007 2008 2009 2010 2011 2012 2013 2014 2015 2016 2017 2018 201950
75
100
125
150
50
75
100
125
150
Q1
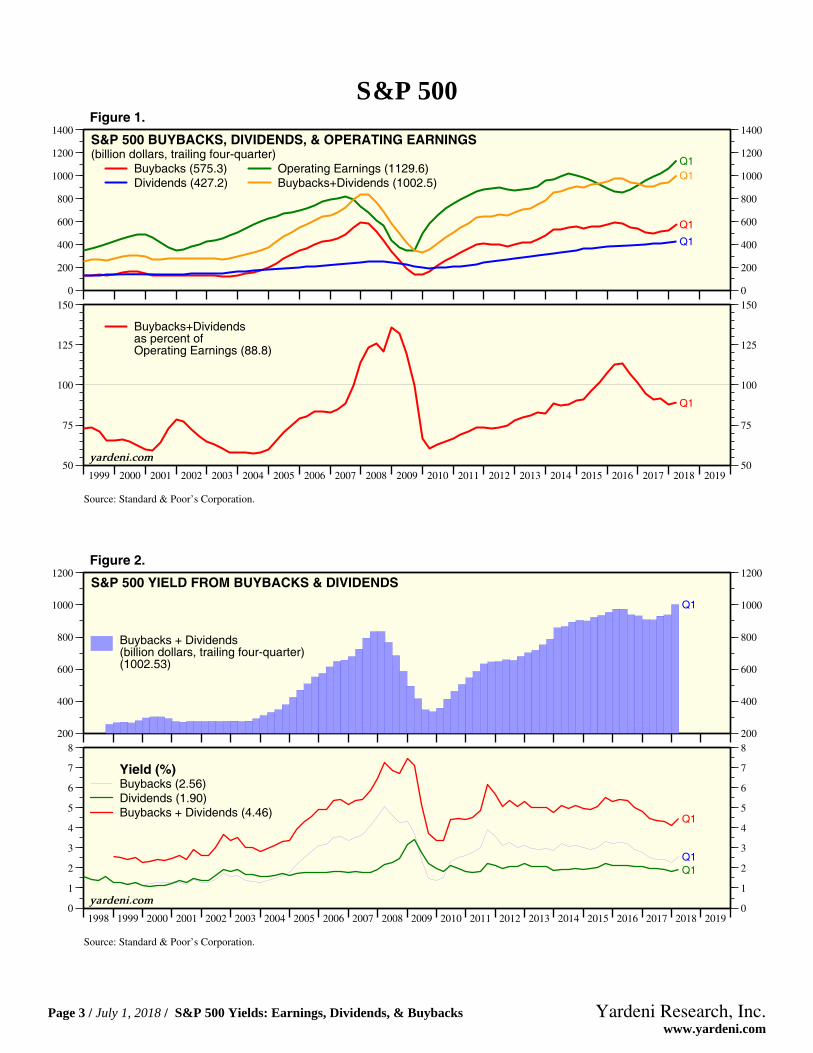
S&P 500 BUYBACKS, DIVIDENDS, & OPERATING EARNINGS(billion dollars, trailing four-quarter)
Buybacks (575.3)Dividends (427.2)
Operating Earnings (1129.6)Buybacks+Dividends (1002.5)
Buybacks+Dividendsas percent ofOperating Earnings (88.8)
Source: Standard & Poor’s Corporation.
yardeni.com
Figure 1.
200
400
600
800
1000
1200
200
400
600
800
1000
1200
Q1
1998 1999 2000 2001 2002 2003 2004 2005 2006 2007 2008 2009 2010 2011 2012 2013 2014 2015 2016 2017 2018 20190
1
2
3
4
5
6
7
8
0
1
2
3
4
5
6
7
8
Q1
Q1Q1
S&P 500 YIELD FROM BUYBACKS & DIVIDENDS
Buybacks + Dividends(billion dollars, trailing four-quarter)(1002.53)
Yield (%)Buybacks (2.56)Dividends (1.90)Buybacks + Dividends (4.46)
Source: Standard & Poor’s Corporation.
yardeni.com
Figure 2.
S&P 500
Page 3 / July 1, 2018 / S&P 500 Yields: Earnings, Dividends, & Buybacks www.yardeni.com
Yardeni Research, Inc.
0
25
50
75
100
125
150
175
200
0
25
50
75
100
125
150
175
200Q1
1998 1999 2000 2001 2002 2003 2004 2005 2006 2007 2008 2009 2010 2011 2012 2013 2014 2015 2016 2017 2018 2019.0
.2
.4
.6
.8
1.0
1.2
1.4
.0
.2
.4
.6
.8
1.0
1.2
1.4
Q1
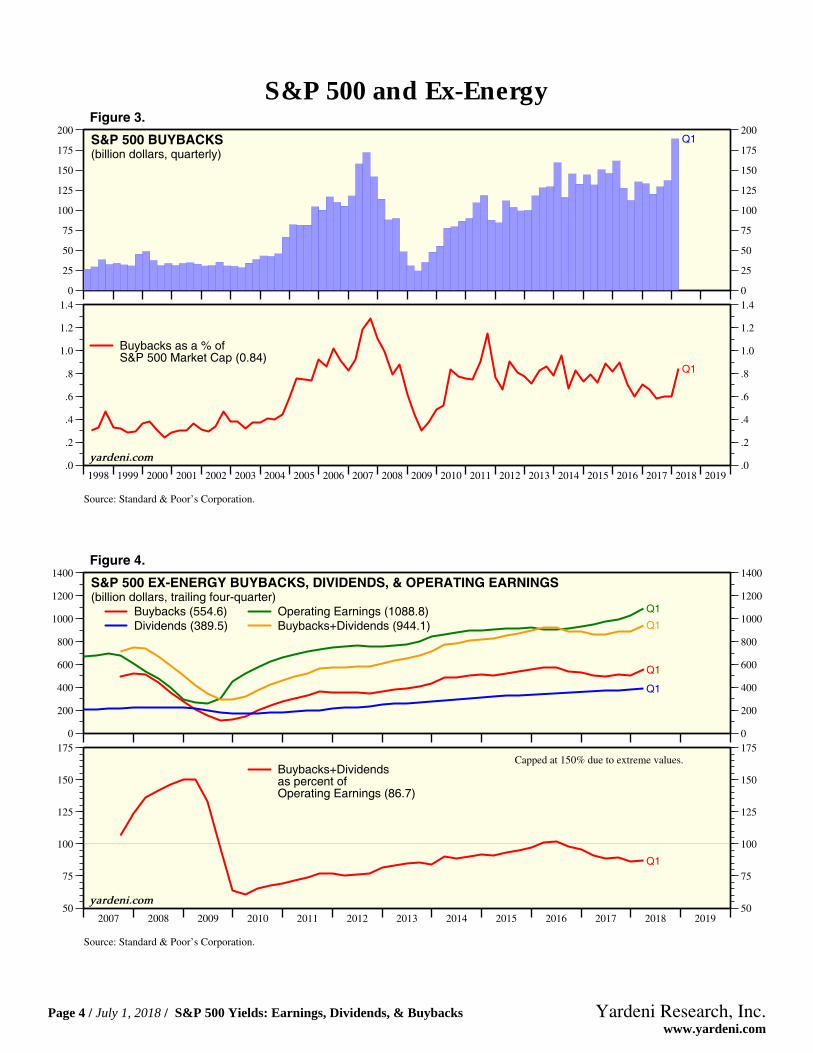
S&P 500 BUYBACKS(billion dollars, quarterly)
Buybacks as a % ofS&P 500 Market Cap (0.84)
Source: Standard & Poor’s Corporation.
yardeni.com
Figure 3.
0
200
400
600
800
1000
1200
1400
0
200
400
600
800
1000
1200
1400
Q1
Q1
Q1
Q1
2007 2008 2009 2010 2011 2012 2013 2014 2015 2016 2017 2018 201950
75
100
125
150
175
50
75
100
125
150
175
Q1
S&P 500 EX-ENERGY BUYBACKS, DIVIDENDS, & OPERATING EARNINGS(billion dollars, trailing four-quarter)
Buybacks (554.6)Dividends (389.5)
Operating Earnings (1088.8)Buybacks+Dividends (944.1)
Buybacks+Dividendsas percent ofOperating Earnings (86.7)
Capped at 150% due to extreme values.
Source: Standard & Poor’s Corporation.
yardeni.com
Figure 4.
S&P 500 and Ex-Energy
Page 4 / July 1, 2018 / S&P 500 Yields: Earnings, Dividends, & Buybacks www.yardeni.com
Yardeni Research, Inc.
0
25
50
75
100
125
150
175
0
25
50
75
100
125
150
175
Q1
Q1
Q1Q1
2008 2009 2010 2011 2012 2013 2014 2015 2016 2017 2018 201925
50
75
100
125
150
175
25
50
75
100
125
150
175
Q1
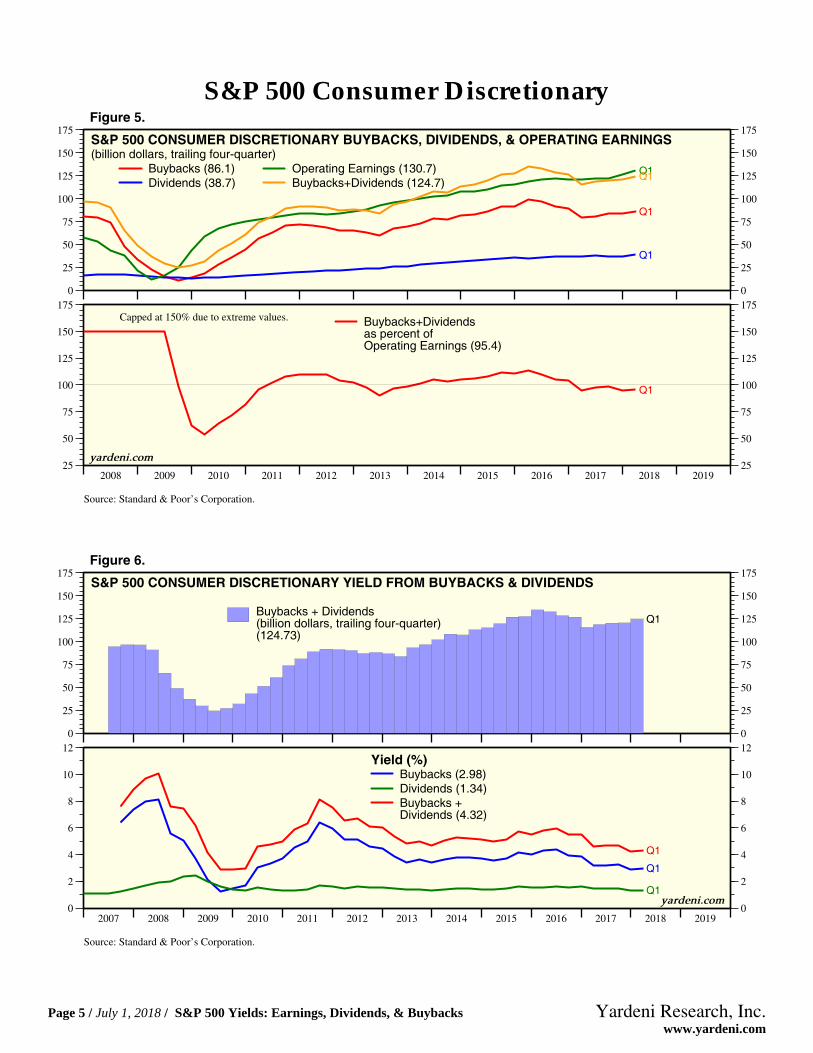
S&P 500 CONSUMER DISCRETIONARY BUYBACKS, DIVIDENDS, & OPERATING EARNINGS(billion dollars, trailing four-quarter)
Buybacks (86.1)Dividends (38.7)
Operating Earnings (130.7)Buybacks+Dividends (124.7)
Buybacks+Dividendsas percent ofOperating Earnings (95.4)
Capped at 150% due to extreme values.
Source: Standard & Poor’s Corporation.
yardeni.com
Figure 5.
0
25
50
75
100
125
150
175
0
25
50
75
100
125
150
175
Q1
2007 2008 2009 2010 2011 2012 2013 2014 2015 2016 2017 2018 20190
2
4
6
8
10
12
0
2
4
6
8
10
12
Q1
Q1
Q1
S&P 500 CONSUMER DISCRETIONARY YIELD FROM BUYBACKS & DIVIDENDS
Buybacks + Dividends(billion dollars, trailing four-quarter)(124.73)
Yield (%)Buybacks (2.98)Dividends (1.34)Buybacks +Dividends (4.32)
Source: Standard & Poor’s Corporation.
yardeni.com
Figure 6.
S&P 500 Consumer Discretionary
Page 5 / July 1, 2018 / S&P 500 Yields: Earnings, Dividends, & Buybacks www.yardeni.com
Yardeni Research, Inc.

0
25
50
75
100
125
150
0
25
50
75
100
125
150
Q1Q1
Q1Q1
2008 2009 2010 2011 2012 2013 2014 2015 2016 2017 2018 201950
75
100
125
150
50
75
100
125
150
Q1
S&P 500 CONSUMER STAPLES BUYBACKS, DIVIDENDS, & OPERATING EARNINGS(billion dollars, trailing four-quarter)
Buybacks (43.6)Dividends (50.1)
Operating Earnings (90.3)Buybacks+Dividends (93.7)
Buybacks+Dividendsas percent ofOperating Earnings (103.8)
Source: Standard & Poor’s Corporation.
yardeni.com
Figure 7.
0
20
40
60
80
100
120
140
0
20
40
60
80
100
120
140
Q1
2007 2008 2009 2010 2011 2012 2013 2014 2015 2016 2017 2018 20190
2
4
6
8
10
0
2
4
6
8
10
Q1
Q1Q1
S&P 500 CONSUMER STAPLES YIELD FROM BUYBACKS & DIVIDENDSBuybacks + Dividends(billion dollars, trailing four-quarter)(93.73)
Yield (%)Buybacks (2.53)Dividends (2.91)Buybacks + Dividends (5.45)
Source: Standard & Poor’s Corporation.
yardeni.com
Figure 8.
S&P 500 Consumer Staples
Page 6 / July 1, 2018 / S&P 500 Yields: Earnings, Dividends, & Buybacks www.yardeni.com
Yardeni Research, Inc.
-75
0
75
150
225
300
-75
0
75
150
225
300
Q1Q1Q1Q1
2008 2009 2010 2011 2012 2013 2014 2015 2016 2017 2018 201925
50
75
100
125
150
175
25
50
75
100
125
150
175
Q1
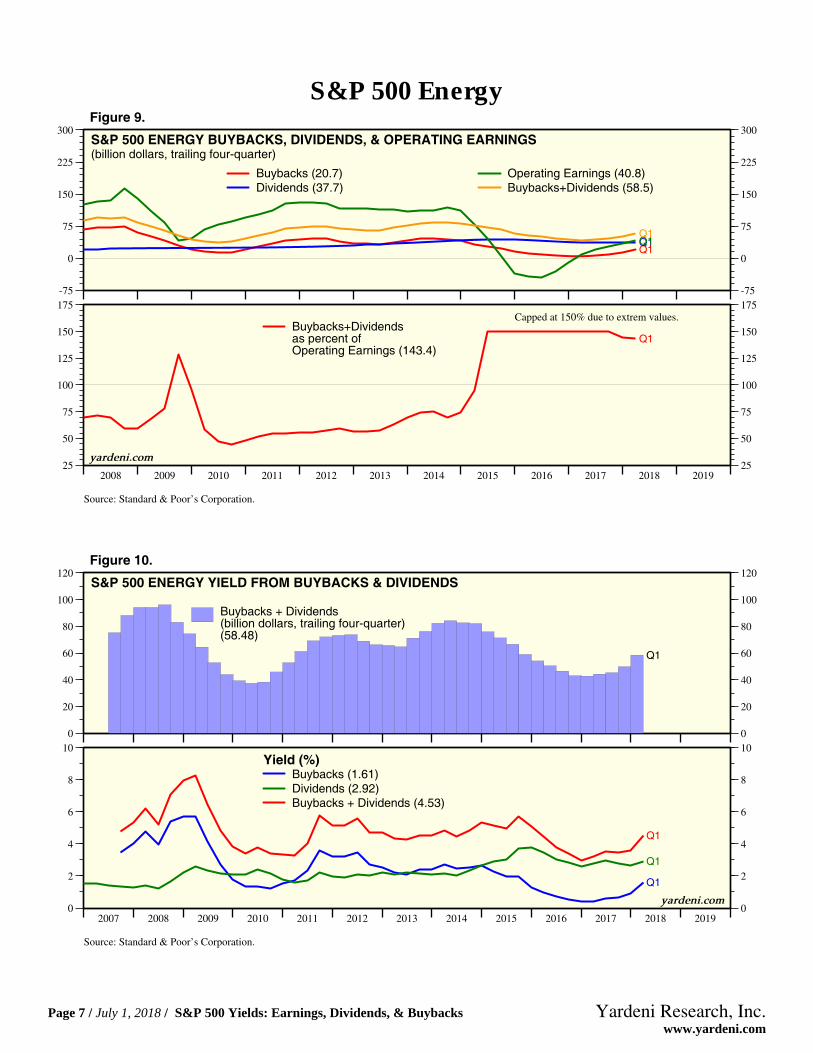
S&P 500 ENERGY BUYBACKS, DIVIDENDS, & OPERATING EARNINGS(billion dollars, trailing four-quarter)
Buybacks (20.7)Dividends (37.7)
Operating Earnings (40.8)Buybacks+Dividends (58.5)
Buybacks+Dividendsas percent ofOperating Earnings (143.4)
Capped at 150% due to extrem values.
Source: Standard & Poor’s Corporation.
yardeni.com
Figure 9.
0
20
40
60
80
100
120
0
20
40
60
80
100
120
Q1
2007 2008 2009 2010 2011 2012 2013 2014 2015 2016 2017 2018 20190
2
4
6
8
10
0
2
4
6
8
10
Q1
Q1
Q1
S&P 500 ENERGY YIELD FROM BUYBACKS & DIVIDENDS
Buybacks + Dividends(billion dollars, trailing four-quarter)(58.48)
Yield (%)Buybacks (1.61)Dividends (2.92)Buybacks + Dividends (4.53)
Source: Standard & Poor’s Corporation.
yardeni.com
Figure 10.
S&P 500 Energy
Page 7 / July 1, 2018 / S&P 500 Yields: Earnings, Dividends, & Buybacks www.yardeni.com
Yardeni Research, Inc.
-150
-100
-50
0
50
100
150
200
250
300
-150
-100
-50
0
50
100
150
200
250
300
Q1
Q1
Q1Q1
2008 2009 2010 2011 2012 2013 2014 2015 2016 2017 2018 201925
50
75
100
125
150
175
25
50
75
100
125
150
175
Q1
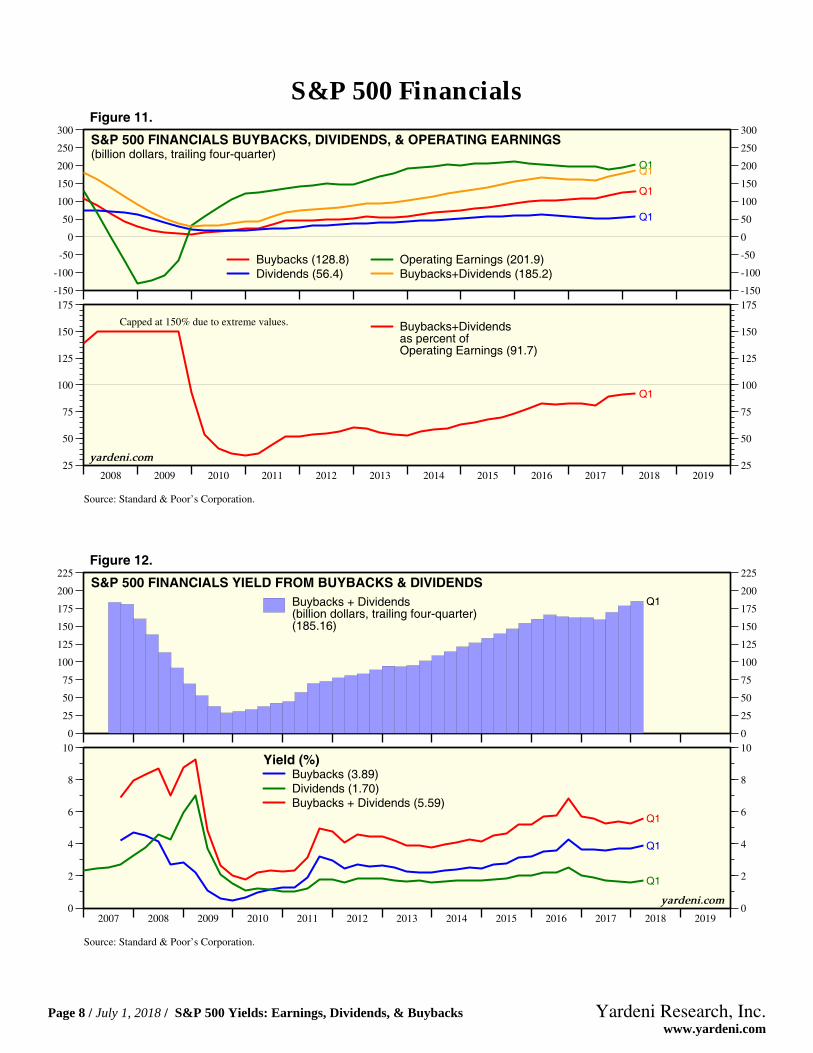
S&P 500 FINANCIALS BUYBACKS, DIVIDENDS, & OPERATING EARNINGS(billion dollars, trailing four-quarter)
Buybacks (128.8)Dividends (56.4)
Operating Earnings (201.9)Buybacks+Dividends (185.2)
Buybacks+Dividendsas percent ofOperating Earnings (91.7)
Capped at 150% due to extreme values.
Source: Standard & Poor’s Corporation.
yardeni.com
Figure 11.
0
25
50
75
100
125
150
175
200
225
0
25
50
75
100
125
150
175
200
225
Q1
2007 2008 2009 2010 2011 2012 2013 2014 2015 2016 2017 2018 20190
2
4
6
8
10
0
2
4
6
8
10
Q1
Q1
Q1
S&P 500 FINANCIALS YIELD FROM BUYBACKS & DIVIDENDSBuybacks + Dividends(billion dollars, trailing four-quarter)(185.16)
Yield (%)Buybacks (3.89)Dividends (1.70)Buybacks + Dividends (5.59)
Source: Standard & Poor’s Corporation.
yardeni.com
Figure 12.
S&P 500 Financials
Page 8 / July 1, 2018 / S&P 500 Yields: Earnings, Dividends, & Buybacks www.yardeni.com
Yardeni Research, Inc.
0
25
50
75
100
125
150
175
200
0
25
50
75
100
125
150
175
200
Q1
Q1
Q1
Q1
2008 2009 2010 2011 2012 2013 2014 2015 2016 2017 2018 201925
50
75
100
125
25
50
75
100
125
Q1
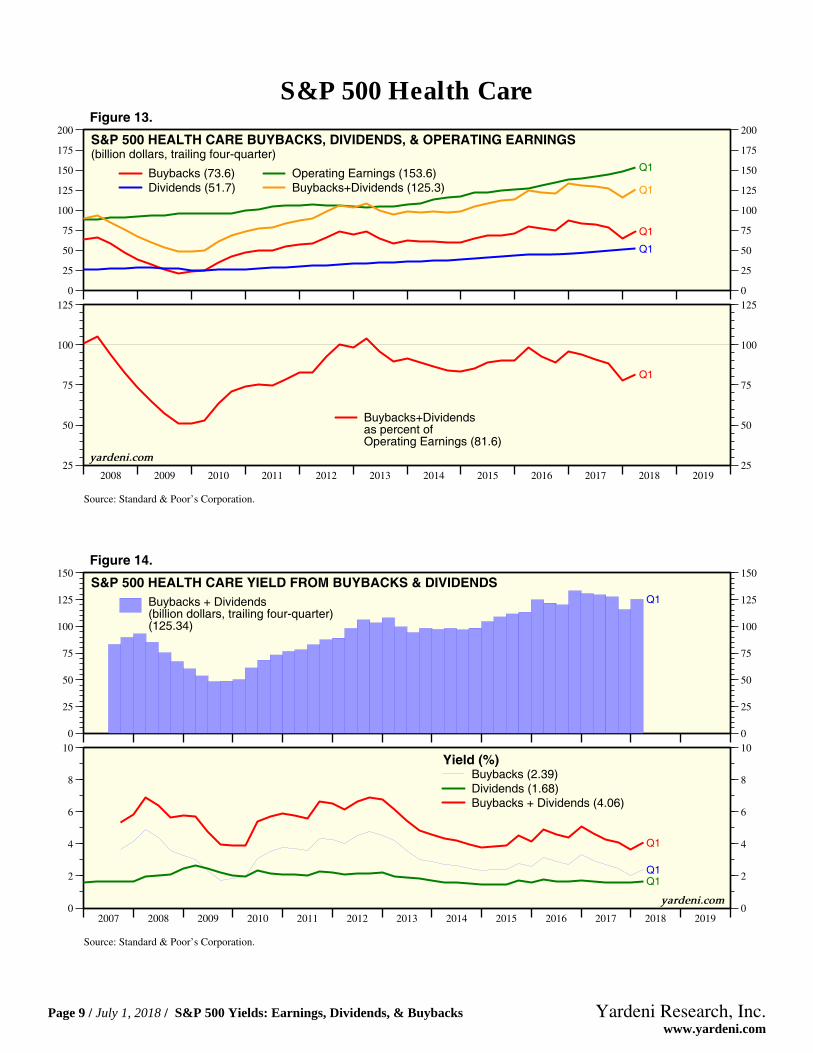
S&P 500 HEALTH CARE BUYBACKS, DIVIDENDS, & OPERATING EARNINGS(billion dollars, trailing four-quarter)
Buybacks (73.6)Dividends (51.7)
Operating Earnings (153.6)Buybacks+Dividends (125.3)
Buybacks+Dividendsas percent ofOperating Earnings (81.6)
Source: Standard & Poor’s Corporation.
yardeni.com
Figure 13.
0
25
50
75
100
125
150
0
25
50
75
100
125
150
Q1
2007 2008 2009 2010 2011 2012 2013 2014 2015 2016 2017 2018 20190
2
4
6
8
10
0
2
4
6
8
10
Q1
Q1Q1
S&P 500 HEALTH CARE YIELD FROM BUYBACKS & DIVIDENDSBuybacks + Dividends(billion dollars, trailing four-quarter)(125.34)
Yield (%)Buybacks (2.39)Dividends (1.68)Buybacks + Dividends (4.06)
Source: Standard & Poor’s Corporation.
yardeni.com
Figure 14.
S&P 500 Health Care
Page 9 / July 1, 2018 / S&P 500 Yields: Earnings, Dividends, & Buybacks www.yardeni.com
Yardeni Research, Inc.

0
25
50
75
100
125
150
175
0
25
50
75
100
125
150
175
Q1Q1
Q1
Q1
2008 2009 2010 2011 2012 2013 2014 2015 2016 2017 2018 201950
75
100
125
150
50
75
100
125
150
Q1
S&P 500 INDUSTRIALS BUYBACKS, DIVIDENDS, & OPERATING EARNINGS(billion dollars, trailing four-quarter)
Buybacks (56.1)Dividends (44.6)
Operating Earnings (120.4)Buybacks+Dividends (100.6)
Buybacks+Dividendsas percent ofOperating Earnings (83.6)
Source: Standard & Poor’s Corporation.
yardeni.com
Figure 15.
0
25
50
75
100
125
150
0
25
50
75
100
125
150
Q1
2007 2008 2009 2010 2011 2012 2013 2014 2015 2016 2017 2018 20190
2
4
6
8
10
12
0
2
4
6
8
10
12
Q1
Q1Q1
S&P 500 INDUSTRIALS YIELD FROM BUYBACKS & DIVIDENDS
Buybacks + Dividends(billion dollars, trailing four-quarter)(100.63)
Yield (%)Buybacks (2.44)Dividends (1.94)Buybacks + Dividends (4.38)
Source: Standard & Poor’s Corporation.
yardeni.com
Figure 16.
S&P 500 Industrials
Page 10 / July 1, 2018 / S&P 500 Yields: Earnings, Dividends, & Buybacks www.yardeni.com
Yardeni Research, Inc.

0
50
100
150
200
250
300
350
0
50
100
150
200
250
300
350
Q1
Q1
Q1
Q1
2008 2009 2010 2011 2012 2013 2014 2015 2016 2017 2018 201925
50
75
100
125
150
175
25
50
75
100
125
150
175
Q1
S&P 500 INFORMATION TECHNOLOGY BUYBACKS, DIVIDENDS, & OPERATING EARNINGS(billion dollars, trailing four-quarter)
Buybacks (154.8)Dividends (68.2)
Operating Earnings (272.9)Buybacks+Dividends (223.0)
Buybacks+Dividendsas percent ofOperating Earnings (81.7)
Source: Standard & Poor’s Corporation.
yardeni.com
Figure 17.
0
50
100
150
200
250
0
50
100
150
200
250
Q1
2007 2008 2009 2010 2011 2012 2013 2014 2015 2016 2017 2018 20190
2
4
6
8
10
0
2
4
6
8
10
Q1
Q1
Q1
S&P 500 INFORMATION TECHNOLOGY YIELD FROM BUYBACKS & DIVIDENDS
Buybacks + Dividends(billion dollars, trailing four-quarter)(223.00)
Yield (%)Buybacks (2.77)Dividends (1.22)Buybacks + Dividends (3.99)
Source: Standard & Poor’s Corporation.
yardeni.com
Figure 18.
S&P 500 Information Technology
Page 11 / July 1, 2018 / S&P 500 Yields: Earnings, Dividends, & Buybacks www.yardeni.com
Yardeni Research, Inc.

0
10
20
30
40
50
60
0
10
20
30
40
50
60
Q1Q1
Q1
Q1
2008 2009 2010 2011 2012 2013 2014 2015 2016 2017 2018 201925
50
75
100
125
150
175
200
25
50
75
100
125
150
175
200
Q1
S&P 500 MATERIALS BUYBACKS, DIVIDENDS, & OPERATING EARNINGS(billion dollars, trailing four-quarter)
Buybacks (6.8)Dividends (12.4)
Operating Earnings (32.3)Buybacks+Dividends (19.2)
Buybacks+Dividendsas percent ofOperating Earnings (59.4)
Capped at 175% due to extreme values.
Source: Standard & Poor’s Corporation.
yardeni.com
Figure 19.
0
10
20
30
40
50
0
10
20
30
40
50
Q1
2007 2008 2009 2010 2011 2012 2013 2014 2015 2016 2017 2018 20190
1
2
3
4
5
6
7
8
0
1
2
3
4
5
6
7
8
Q1
Q1
Q1
S&P 500 MATERIALS YIELD FROM BUYBACKS & DIVIDENDS
Buybacks + Dividends(billion dollars, trailing four-quarter)(19.21)
Yield (%)Buybacks (1.06)Dividends (1.93)Buybacks + Dividends (2.99)
Source: Standard & Poor’s Corporation.
yardeni.com
Figure 20.
S&P 500 Materials
Page 12 / July 1, 2018 / S&P 500 Yields: Earnings, Dividends, & Buybacks www.yardeni.com
Yardeni Research, Inc.

0
10
20
30
40
50
60
0
10
20
30
40
50
60
Q1
Q1
Q1
Q1
2008 2009 2010 2011 2012 2013 2014 2015 2016 2017 2018 201950
75
100
125
150
175
50
75
100
125
150
175
Q1
S&P 500 TELECOMMUNICATION SERVICES BUYBACKS, DIVIDENDS, & OPERATING EARNINGS(billion dollars, trailing four-quarter)
Buybacks (0.5)Dividends (23.2)
Operating Earnings (31.7)Buybacks+Dividends (23.7)
Buybacks+Dividendsas percent ofOperating Earnings (74.6)
Capped at 150% due to extreme values.
Source: Standard & Poor’s Corporation.
yardeni.com
Figure 21.
0
10
20
30
40
50
0
10
20
30
40
50
Q1
2007 2008 2009 2010 2011 2012 2013 2014 2015 2016 2017 2018 20190
2
4
6
8
10
12
0
2
4
6
8
10
12
Q1
Q1
Q1
S&P 500 TELECOMMUNICATION SERVICES YIELD FROM BUYBACKS & DIVIDENDSBuybacks + Dividends(billion dollars, trailing four-quarter)(23.66)
Yield (%)Buybacks (0.11)Dividends (5.37)Buybacks +Dividends (5.47)
Source: Standard & Poor’s Corporation.
yardeni.com
Figure 22.
S&P 500 Telecommunication Services
Page 13 / July 1, 2018 / S&P 500 Yields: Earnings, Dividends, & Buybacks www.yardeni.com
Yardeni Research, Inc.

0
10
20
30
40
50
0
10
20
30
40
50
Q1
Q1
Q1
Q1
2008 2009 2010 2011 2012 2013 2014 2015 2016 2017 2018 201950
75
100
125
50
75
100
125
Q1
S&P 500 UTILITIES BUYBACKS, DIVIDENDS, & OPERATING EARNINGS(billion dollars, trailing four-quarter)
Buybacks (0.2)Dividends (23.1)
Operating Earnings (38.1)Buybacks+Dividends (23.4)
Buybacks+Dividendsas percent ofOperating Earnings (61.3)
Source: Standard & Poor’s Corporation.
yardeni.com
Figure 23.
0
10
20
30
0
10
20
30
Q1
2007 2008 2009 2010 2011 2012 2013 2014 2015 2016 2017 2018 20190
1
2
3
4
5
6
7
8
0
1
2
3
4
5
6
7
8
Q1
Q1
Q1
S&P 500 UTILITIES YIELD FROM BUYBACKS & DIVIDENDSBuybacks + Dividends(billion dollars, trailing four-quarter)(23.38)
Yield (%)Buybacks (0.04)Dividends (3.60)Buybacks + Dividends (3.63)
Source: Standard & Poor’s Corporation.
yardeni.com
Figure 24.
S&P 500 Utilities
Page 14 / July 1, 2018 / S&P 500 Yields: Earnings, Dividends, & Buybacks www.yardeni.com
Yardeni Research, Inc.

Figure 25.
2007 2008 2009 2010 2011 2012 2013 2014 2015 2016 2017 2018 20191.5
2.0
2.5
3.0
3.5
4.0
Q1
S&P 500
% Dividend Yield (1.90)
2007 2008 2009 2010 2011 2012 2013 2014 2015 2016 2017 2018 20191
2
3
4
5
6
Q1
INDUSTRIALS
(1.94)
2007 2008 2009 2010 2011 2012 2013 2014 2015 2016 2017 2018 20191.0
1.5
2.0
2.5
3.0
Q1
CONSUMER DISCRETIONARY
(1.34)
2007 2008 2009 2010 2011 2012 2013 2014 2015 2016 2017 2018 2019.5
1.0
1.5
2.0
Q1
INFORMATION TECHNOLOGY
(1.22)
2007 2008 2009 2010 2011 2012 2013 2014 2015 2016 2017 2018 20192.0
2.5
3.0
3.5
4.0
Q1
CONSUMER STAPLES
(2.91)
2007 2008 2009 2010 2011 2012 2013 2014 2015 2016 2017 2018 20191
2
3
4
5
Q1
MATERIALS
(1.93)
2007 2008 2009 2010 2011 2012 2013 2014 2015 2016 2017 2018 20191
2
3
4
Q1
ENERGY
(2.92)
2007 2008 2009 2010 2011 2012 2013 2014 2015 2016 2017 2018 20192
4
6
8
10
Q1
REAL ESTATE
(3.46)
2007 2008 2009 2010 2011 2012 2013 2014 2015 2016 2017 2018 20190
2
4
6
8
Q1
FINANCIALS
(1.70)
2007 2008 2009 2010 2011 2012 2013 2014 2015 2016 2017 2018 20192
3
4
5
6
7
Q1
TELECOMMUNICATION SERVICES
(5.37)
2007 2008 2009 2010 2011 2012 2013 2014 2015 2016 2017 2018 20191.0
1.5
2.0
2.5
3.0
Q1
HEALTH CARE
Source: Standard & Poor’s Corporation.
(1.68)
2007 2008 2009 2010 2011 2012 2013 2014 2015 2016 2017 2018 20192
3
4
5
6
Q1
UTILITIES
(3.60)
yardeni.com
S&P 500 Sectors Dividend Yield
Page 15 / July 1, 2018 / S&P 500 Yields: Earnings, Dividends, & Buybacks www.yardeni.com
Yardeni Research, Inc.
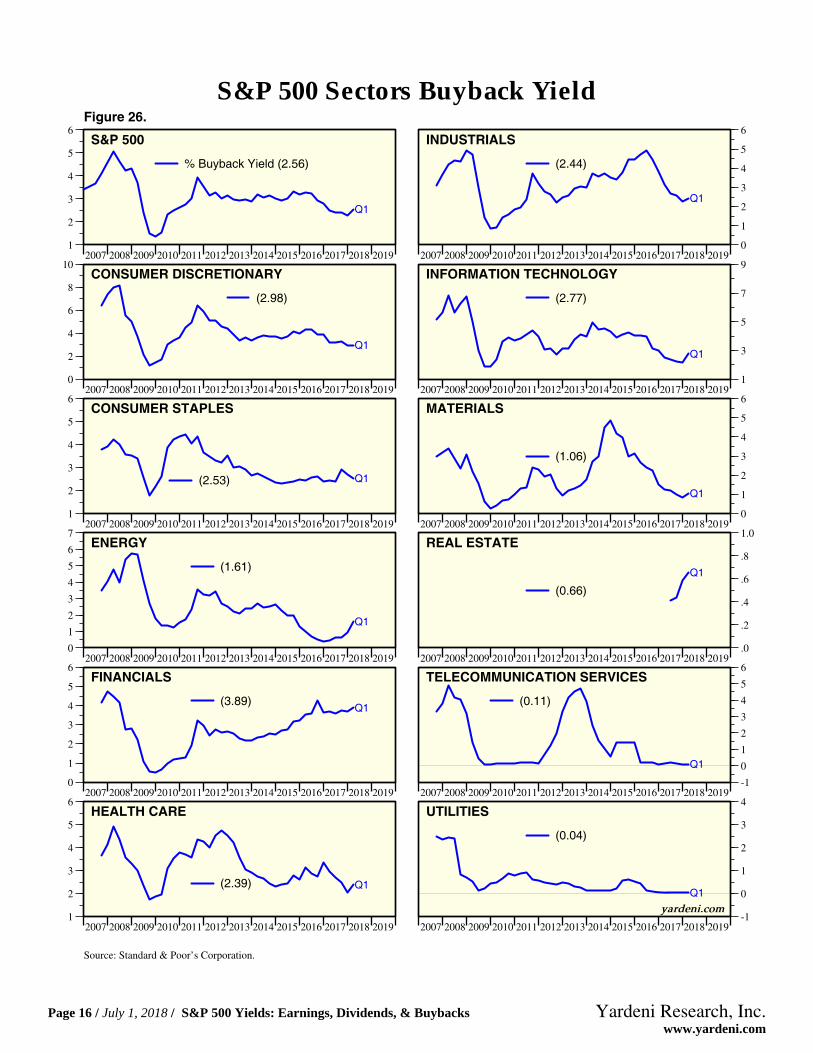
Figure 26.
2007 2008 2009 2010 2011 2012 2013 2014 2015 2016 2017 2018 20191
2
3
4
5
6
Q1
S&P 500
% Buyback Yield (2.56)
2007 2008 2009 2010 2011 2012 2013 2014 2015 2016 2017 2018 20190
1
2
3
4
5
6
Q1
INDUSTRIALS
(2.44)
2007 2008 2009 2010 2011 2012 2013 2014 2015 2016 2017 2018 20190
2
4
6
8
10
Q1
CONSUMER DISCRETIONARY
(2.98)
2007 2008 2009 2010 2011 2012 2013 2014 2015 2016 2017 2018 20191
3
5
7
9
Q1
INFORMATION TECHNOLOGY
(2.77)
2007 2008 2009 2010 2011 2012 2013 2014 2015 2016 2017 2018 20191
2
3
4
5
6
Q1
CONSUMER STAPLES
(2.53)
2007 2008 2009 2010 2011 2012 2013 2014 2015 2016 2017 2018 20190
1
2
3
4
5
6
Q1
MATERIALS
(1.06)
2007 2008 2009 2010 2011 2012 2013 2014 2015 2016 2017 2018 20190
1
2
3
4
5
6
7
Q1
ENERGY
(1.61)
2007 2008 2009 2010 2011 2012 2013 2014 2015 2016 2017 2018 2019.0
.2
.4
.6
.8
1.0
Q1
REAL ESTATE
(0.66)
2007 2008 2009 2010 2011 2012 2013 2014 2015 2016 2017 2018 20190
1
2
3
4
5
6
Q1
FINANCIALS
(3.89)
2007 2008 2009 2010 2011 2012 2013 2014 2015 2016 2017 2018 2019-1
0
1
2
3
4
5
6
Q1
TELECOMMUNICATION SERVICES
(0.11)
2007 2008 2009 2010 2011 2012 2013 2014 2015 2016 2017 2018 20191
2
3
4
5
6
Q1
HEALTH CARE
Source: Standard & Poor’s Corporation.
(2.39)
2007 2008 2009 2010 2011 2012 2013 2014 2015 2016 2017 2018 2019-1
0
1
2
3
4
Q1
UTILITIES
(0.04)
yardeni.com
S&P 500 Sectors Buyback Yield
Page 16 / July 1, 2018 / S&P 500 Yields: Earnings, Dividends, & Buybacks www.yardeni.com
Yardeni Research, Inc.

Figure 27.
2007 2008 2009 2010 2011 2012 2013 2014 2015 2016 2017 2018 20193
4
5
6
7
8
9
Q1
S&P 500% Buybacks + Dividends Yield (4.46)
2007 2008 2009 2010 2011 2012 2013 2014 2015 2016 2017 2018 20190
2
4
6
8
10
12
Q1
INDUSTRIALS
(4.38)
2007 2008 2009 2010 2011 2012 2013 2014 2015 2016 2017 2018 20192
4
6
8
10
12
Q1
CONSUMER DISCRETIONARY(4.32)
2007 2008 2009 2010 2011 2012 2013 2014 2015 2016 2017 2018 20192
4
6
8
10
Q1
INFORMATION TECHNOLOGY
(3.99)
2007 2008 2009 2010 2011 2012 2013 2014 2015 2016 2017 2018 20194
5
6
7
8
9
Q1
CONSUMER STAPLES
(5.45)
2007 2008 2009 2010 2011 2012 2013 2014 2015 2016 2017 2018 20190
2
4
6
8
10
Q1
MATERIALS
(2.99)
2007 2008 2009 2010 2011 2012 2013 2014 2015 2016 2017 2018 20192
4
6
8
10
Q1
ENERGY
(4.53)
2007 2008 2009 2010 2011 2012 2013 2014 2015 2016 2017 2018 20193.0
3.5
4.0
4.5
Q1
REAL ESTATE
(4.12)
2007 2008 2009 2010 2011 2012 2013 2014 2015 2016 2017 2018 20190
2
4
6
8
10
12
Q1
FINANCIALS
(5.59)
2007 2008 2009 2010 2011 2012 2013 2014 2015 2016 2017 2018 20194
6
8
10
12
Q1
TELECOMMUNICATION SERVICES
(5.47)
2007 2008 2009 2010 2011 2012 2013 2014 2015 2016 2017 2018 20193
4
5
6
7
8
Q1
HEALTH CARE
Source: Standard & Poor’s Corporation.
(4.06)
2007 2008 2009 2010 2011 2012 2013 2014 2015 2016 2017 2018 20192
3
4
5
6
7
Q1
UTILITIES
(3.63)
yardeni.com
S&P 500 Sectors Dividends + Buybacks Yield
Page 17 / July 1, 2018 / S&P 500 Yields: Earnings, Dividends, & Buybacks www.yardeni.com
Yardeni Research, Inc.

Figure 28.
2007 2008 2009 2010 2011 2012 2013 2014 2015 2016 2017 2018 201950
75
100
125
150
Q1
S&P 500Buybacks+Dividends as % ofOperating Earnings (88.8)
Capped at 150% due to extreme values.
2007 2008 2009 2010 2011 2012 2013 2014 2015 2016 2017 2018 201940
60
80
100
120
140
Q1
INDUSTRIALS(83.6)
2007 2008 2009 2010 2011 2012 2013 2014 2015 2016 2017 2018 201950
75
100
125
150
175
Q1
CONSUMER DISCRETIONARY(95.4)
Capped at 150% due to extreme values.
2007 2008 2009 2010 2011 2012 2013 2014 2015 2016 2017 2018 201950
75
100
125
150
175
Q1
INFORMATION TECHNOLOGY
(81.7)
2007 2008 2009 2010 2011 2012 2013 2014 2015 2016 2017 2018 201960
80
100
120
140
Q1
CONSUMER STAPLES(103.8)
2007 2008 2009 2010 2011 2012 2013 2014 2015 2016 2017 2018 201925
50
75
100
125
150
175
Q1
MATERIALS
(59.4)
Capped at 150% dueto extreme values.
2007 2008 2009 2010 2011 2012 2013 2014 2015 2016 2017 2018 201925
50
75
100
125
150
175
Q1ENERGY
(143.4)
Capped at 150% due to extreme values.
2007 2008 2009 2010 2011 2012 2013 2014 2015 2016 2017 2018 201975
100
125
150
175
Q1
REAL ESTATE
(140.7)
2007 2008 2009 2010 2011 2012 2013 2014 2015 2016 2017 2018 201925
50
75
100
125
150
175
Q1
FINANCIALS
(91.7)
Capped at150% due toextreme values.
2007 2008 2009 2010 2011 2012 2013 2014 2015 2016 2017 2018 201950
75
100
125
150
175
Q1
TELECOMMUNICATION SERVICES
(74.6)
Capped at 150% dueto extreme values.
2007 2008 2009 2010 2011 2012 2013 2014 2015 2016 2017 2018 201940
60
80
100
120
Q1
HEALTH CARE
Source: Standard & Poor’s Corporation.
(81.6)
2007 2008 2009 2010 2011 2012 2013 2014 2015 2016 2017 2018 201950
60
70
80
90
100
110
Q1
UTILITIES
(61.3)
yardeni.com
Dividends + Buybacks as % of Operating Earnings
Page 18 / July 1, 2018 / S&P 500 Yields: Earnings, Dividends, & Buybacks www.yardeni.com
Yardeni Research, Inc.

Figure 29.
2007 2008 2009 2010 2011 2012 2013 2014 2015 2016 2017 2018 2019.2
.4
.6
.8
1.0
1.2
1.4
1.6
Q1
S&P 500Buybacks as a % ofMarket Cap (0.84)
2007 2008 2009 2010 2011 2012 2013 2014 2015 2016 2017 2018 2019.0
.5
1.0
1.5
2.0
Q1
INDUSTRIALS(0.72)
2007 2008 2009 2010 2011 2012 2013 2014 2015 2016 2017 2018 2019.00
.75
1.50
2.25
3.00
3.75
Q1
CONSUMER DISCRETIONARY
(0.65)
2007 2008 2009 2010 2011 2012 2013 2014 2015 2016 2017 2018 2019.0
.5
1.0
1.5
2.0
2.5
Q1
INFORMATION TECHNOLOGY(1.13)
2007 2008 2009 2010 2011 2012 2013 2014 2015 2016 2017 2018 2019.0
.5
1.0
1.5
2.0
Q1
CONSUMER STAPLES
(0.42)
2007 2008 2009 2010 2011 2012 2013 2014 2015 2016 2017 2018 2019.0
.5
1.0
1.5
2.0
Q1
MATERIALS
(0.36)
2007 2008 2009 2010 2011 2012 2013 2014 2015 2016 2017 2018 2019-.5
.0
.5
1.0
1.5
2.0
2.5
3.0
Q1
ENERGY(0.34)
2007 2008 2009 2010 2011 2012 2013 2014 2015 2016 2017 2018 2019.00
.05
.10
.15
.20
.25
Q1
REAL ESTATE
(0.13)
2007 2008 2009 2010 2011 2012 2013 2014 2015 2016 2017 2018 2019.0
.5
1.0
1.5
Q1
FINANCIALS(1.02)
2007 2008 2009 2010 2011 2012 2013 2014 2015 2016 2017 2018 2019-.5
.0
.5
1.0
1.5
2.0
Q1
TELECOMMUNICATION SERVICES
(0.04)
2007 2008 2009 2010 2011 2012 2013 2014 2015 2016 2017 2018 2019.0
.5
1.0
1.5
2.0
Q1
HEALTH CARE
Source: Standard & Poor’s Corporation.
(1.16)
2007 2008 2009 2010 2011 2012 2013 2014 2015 2016 2017 2018 2019-.5
.0
.5
1.0
1.5
2.0
Q1
UTILITIES(0.03)
yarden
i.comBuybacks as % of Market Cap
Page 19 / July 1, 2018 / S&P 500 Yields: Earnings, Dividends, & Buybacks www.yardeni.com
Yardeni Research, Inc.
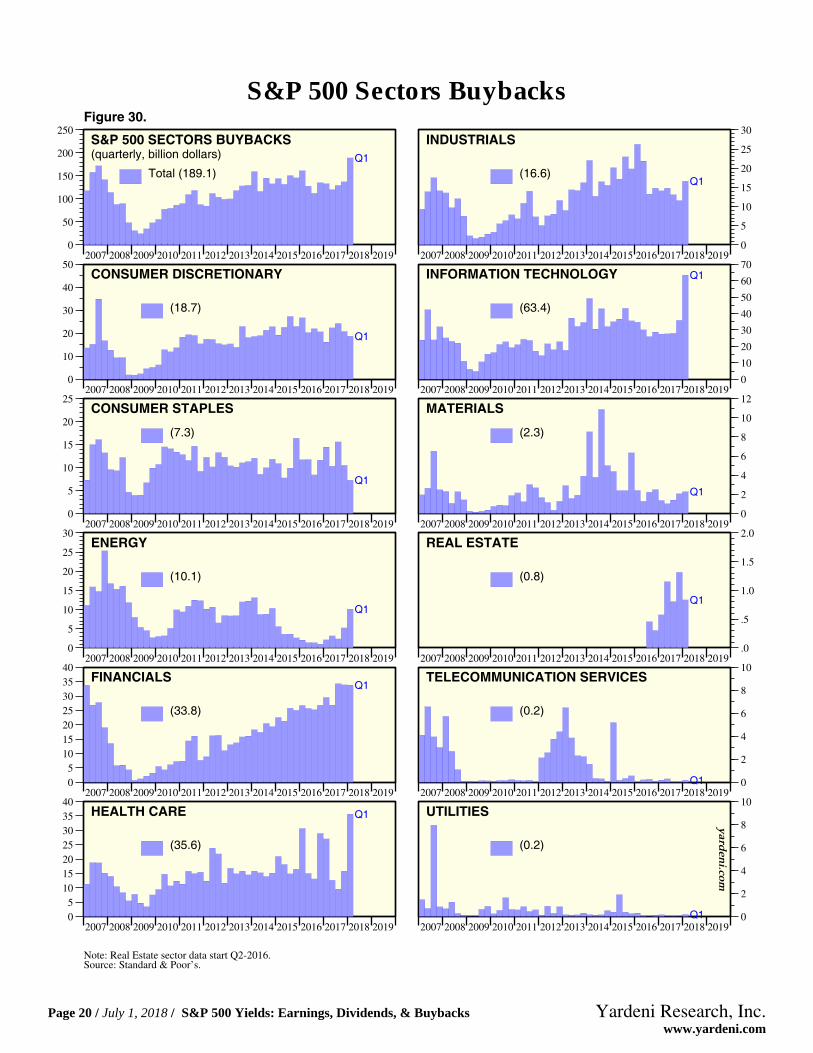
Figure 30.
2007 2008 2009 2010 2011 2012 2013 2014 2015 2016 2017 2018 20190
50
100
150
200
250
Q1
S&P 500 SECTORS BUYBACKS(quarterly, billion dollars)
Total (189.1)
2007 2008 2009 2010 2011 2012 2013 2014 2015 2016 2017 2018 20190
5
10
15
20
25
30
Q1
INDUSTRIALS
(16.6)
2007 2008 2009 2010 2011 2012 2013 2014 2015 2016 2017 2018 20190
10
20
30
40
50
Q1
CONSUMER DISCRETIONARY
(18.7)
2007 2008 2009 2010 2011 2012 2013 2014 2015 2016 2017 2018 20190
10
20
30
40
50
60
70Q1INFORMATION TECHNOLOGY
(63.4)
2007 2008 2009 2010 2011 2012 2013 2014 2015 2016 2017 2018 20190
5
10
15
20
25
Q1
CONSUMER STAPLES
(7.3)
2007 2008 2009 2010 2011 2012 2013 2014 2015 2016 2017 2018 20190
2
4
6
8
10
12
Q1
MATERIALS
(2.3)
2007 2008 2009 2010 2011 2012 2013 2014 2015 2016 2017 2018 20190
5
10
15
20
25
30
Q1
ENERGY
(10.1)
2007 2008 2009 2010 2011 2012 2013 2014 2015 2016 2017 2018 2019.0
.5
1.0
1.5
2.0
Q1
REAL ESTATE
(0.8)
2007 2008 2009 2010 2011 2012 2013 2014 2015 2016 2017 2018 201905
10152025303540
Q1FINANCIALS
(33.8)
2007 2008 2009 2010 2011 2012 2013 2014 2015 2016 2017 2018 20190
2
4
6
8
10
Q1
TELECOMMUNICATION SERVICES
(0.2)
2007 2008 2009 2010 2011 2012 2013 2014 2015 2016 2017 2018 201905
10152025303540
Q1HEALTH CARE
(35.6)
Note: Real Estate sector data start Q2-2016.Source: Standard & Poor’s.
2007 2008 2009 2010 2011 2012 2013 2014 2015 2016 2017 2018 20190
2
4
6
8
10
Q1
UTILITIES
(0.2)
yarden
i.comS&P 500 Sectors Buybacks
Page 20 / July 1, 2018 / S&P 500 Yields: Earnings, Dividends, & Buybacks www.yardeni.com
Yardeni Research, Inc.

Figure 31.
2009 2010 2011 2012 2013 2014 2015 2016 2017 2018 20190
1000
2000
3000
4000
5000
Q1S&P 500 SECTORS CUMULATIVEBUYBACKS SINCE Q1-2009(quarterly, billion dollars)
Total (4086.3)
2009 2010 2011 2012 2013 2014 2015 2016 2017 2018 20190
100
200
300
400
500Q1INDUSTRIALS
(450.0)
2009 2010 2011 2012 2013 2014 2015 2016 2017 2018 20190
100
200
300
400
500
600
700Q1CONSUMER DISCRETIONARY
(631.5)
2009 2010 2011 2012 2013 2014 2015 2016 2017 2018 20190
200
400
600
800
1000
1200
Q1INFORMATION TECHNOLOGY
(1006.9)
2009 2010 2011 2012 2013 2014 2015 2016 2017 2018 20190
100
200
300
400
500
Q1CONSUMER STAPLES
(404.8)
2009 2010 2011 2012 2013 2014 2015 2016 2017 2018 20190
20
40
60
80
100Q1MATERIALS
(89.4)
2009 2010 2011 2012 2013 2014 2015 2016 2017 2018 20190
50
100
150
200
250
300
Q1ENERGY
(248.1)
2009 2010 2011 2012 2013 2014 2015 2016 2017 2018 20190
1
2
3
4
5
6Q1REAL ESTATE
(5.4)
2009 2010 2011 2012 2013 2014 2015 2016 2017 2018 20190
100
200
300
400
500
600
700Q1FINANCIALS
(618.9)
2009 2010 2011 2012 2013 2014 2015 2016 2017 2018 20190
10
20
30
40
50
Q1
TELECOMMUNICATION SERVICES
(38.7)
2009 2010 2011 2012 2013 2014 2015 2016 2017 2018 20190
100
200
300
400
500
600
700
Q1HEALTH CARE
(578.1)
Note: Real Estate sector data start Q2-2016.Source: Standard & Poor’s.
2009 2010 2011 2012 2013 2014 2015 2016 2017 2018 20190
5
10
15
20
Q1
UTILITIES
(14.5)
yarden
i.comS&P 500 Sectors Cumulative Buybacks Since Q1-2009
Page 21 / July 1, 2018 / S&P 500 Yields: Earnings, Dividends, & Buybacks www.yardeni.com
Yardeni Research, Inc.

http://blog.yardeni.com
http://blog.yardeni.com
Copyright (c) Yardeni Research, Inc. 2018. All rights reserved. The informationcontained herein has been obtained from sources believed to be reliable, but is notnecessarily complete and its accuracy cannot be guaranteed. No representation orwarranty, express or implied, is made as to the fairness, accuracy, completeness, orcorrectness of the information and opinions contained herein. The views and the otherinformation provided are subject to change without notice. All reports posted onwww.yardeni.com, blog.yardeni.com, and YRI’s Apps for iPads and iPhones are issuedwithout regard to the specific investment objectives, financial situation, or particular needsof any specific recipient and are not to be construed as a solicitation or an offer to buy or sellany securities or related financial instruments. Past performance is not necessarily a guideto future results. Company fundamentals and earnings may be mentioned occasionally, butshould not be construed as a recommendation to buy, sell, or hold the company’s stock.Predictions, forecasts, and estimates for any and all markets should not be construed asrecommendations to buy, sell, or hold any security--including mutual funds, futurescontracts, and exchange traded funds, or any similar instruments.
The text, images, and other materials contained or displayed on any Yardeni Research, Inc.product, service, report, email or website are proprietary to Yardeni Research, Inc. andconstitute valuable intellectual property. No material from any part of www.yardeni.com, blog.yardeni.com, and YRI’s Apps for iPads and iPhones may be downloaded, transmitted,broadcast, transferred, assigned, reproduced or in any other way used or otherwisedisseminated in any form to any person or entity, without the explicit written consent ofYardeni Research, Inc. All unauthorized reproduction or other use of material from YardeniResearch, Inc. shall be deemed willful infringement(s) of this copyright and other proprietaryand intellectual property rights, including but not limited to, rights of privacy. YardeniResearch, Inc. expressly reserves all rights in connection with its intellectual property,including without limitation the right to block the transfer of its products and services and/orto track usage thereof, through electronic tracking technology, and all other lawful means,now known or hereafter devised. Yardeni Research, Inc. reserves the right, without furthernotice, to pursue to the fullest extent allowed by the law any and all criminal and civilremedies for the violation of its rights.
The recipient should check any email and any attachments for the presence of viruses.Yardeni Research, Inc. accepts no liability for any damage caused by any virus transmittedby this company’s emails, website, blog and Apps. Additional information available onrequest.