s&p dow jones volatility indices performance - cboe · source: s&p dow jones indices llc,...
TRANSCRIPT

For Financial Professionals. Not for Public Distribution. PROPRIETARY. Permission to reprint or distribute any content from this presentation requires the written approval of S&P Dow Jones Indices.
S&P Dow Jones Volatility Indices Performance
Tim Edwards
November 30, 2015

For Financial Professionals. Not for Public Distribution. PROPRIETARY.
Permission to reprint or distribute any content from this presentation requires the written approval of S&P Dow Jones Indices.
0%
100%
200%
300%
400%
500%
600%
11-2006 11-2007 11-2008 11-2009 11-2010 11-2011 11-2012 11-2013 11-2014
S&P 500 (TR) S&P 500 Dynamic VEQTOR Index S&P 500 VIX Mid-Term Futures
S&P 500 Dynamic VIX Futures S&P 500 VEQTOR Switch S&P 500 VIX Short-Term Futures
S&P Volatility Indices
2
Source: S&P Dow Jones Indices LLC. Data as of November, 2015. Total return index in USD. Chart is provided for illustrative purposes. Past performance is no guarantee of future results. These
charts and graphs may reflect hypothetical historical performance. Please see the Performance Disclosure at the end of this document for more information regarding the inherent limitations
associated with back-tested performance.

For Financial Professionals. Not for Public Distribution. PROPRIETARY.
Permission to reprint or distribute any content from this presentation requires the written approval of S&P Dow Jones Indices.
Live Performance
3
• S&P 500 VIX Short-Term Futures Index: Jan 2009 – Nov 2015
Source: S&P Dow Jones Indices LLC. Data as of November, 2015. Total return index in USD. Chart is provided for illustrative purposes. Past performance is no guarantee of future results.
-99.67%

For Financial Professionals. Not for Public Distribution. PROPRIETARY.
Permission to reprint or distribute any content from this presentation requires the written approval of S&P Dow Jones Indices.
Outline
4
Investable Volatility
• Features of volatility as a hedge
• Increasing focus on volatility risk premia
• How much contango is “normal”?
• Applications to indices and ETFs

For Financial Professionals. Not for Public Distribution. PROPRIETARY.
Permission to reprint or distribute any content from this presentation requires the written approval of S&P Dow Jones Indices. 5
Section 1: Drivers of Demand for Long Volatility Exposures

For Financial Professionals. Not for Public Distribution. PROPRIETARY.
Permission to reprint or distribute any content from this presentation requires the written approval of S&P Dow Jones Indices.
300
3000
100
1,000
10,000
100,000
1,000,000
10,000,000
100,000,000
Jan2009
Jun2009
Nov2009
Apr2010
Sep2010
Feb2011
Jul2011
Dec2011
May2012
Oct2012
Mar2013
Aug2013
Jan2014
Jun2014
Nov2014
Apr2015
Sep2015
S&P Short Term VIX Futures (Left Axis, Logarithmic) S&P 500 (Right Axis, Logarithmic)
Negative Correlation
6
• S&P 500 VIX Short-Term Futures Index: Live Performance Jan 2009 – Nov 2015
Source: S&P Dow Jones Indices LLC. Data as of November, 2015. Total return index in USD. Chart is provided for illustrative purposes. Past performance is no guarantee of future results.
For Financial Professionals. Not for Public Distribution. PROPRIETARY.
Permission to reprint or distribute any content from this presentation requires the written approval of S&P Dow Jones Indices.
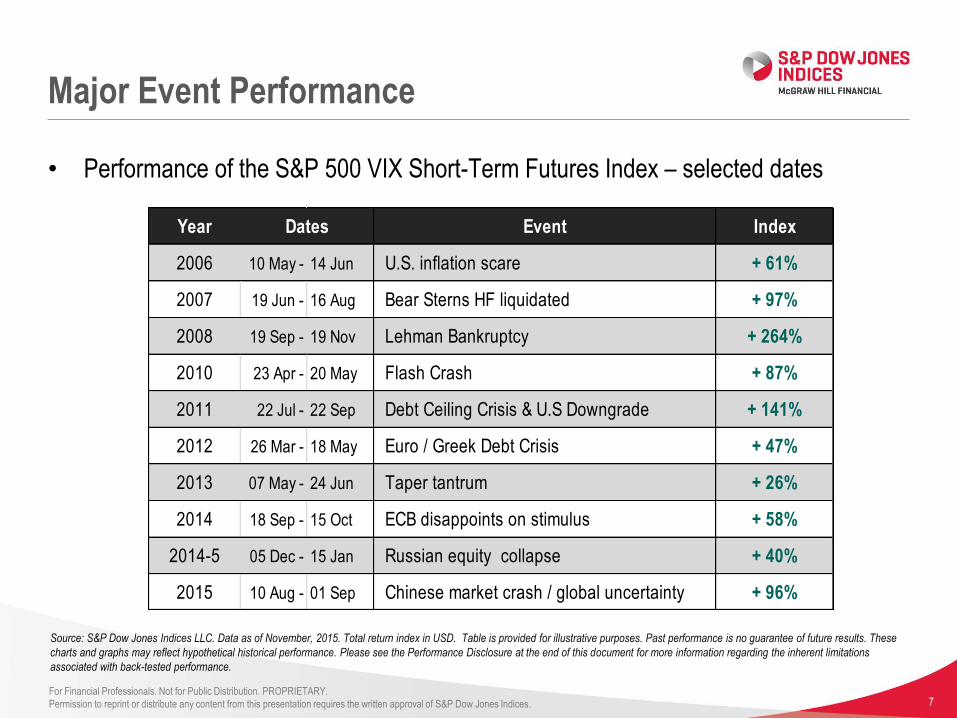
Major Event Performance
7
• Performance of the S&P 500 VIX Short-Term Futures Index – selected dates
Source: S&P Dow Jones Indices LLC. Data as of November, 2015. Total return index in USD. Table is provided for illustrative purposes. Past performance is no guarantee of future results. These
charts and graphs may reflect hypothetical historical performance. Please see the Performance Disclosure at the end of this document for more information regarding the inherent limitations
associated with back-tested performance.
Year Event Index
2006 10 May - 14 Jun U.S. inflation scare + 61%
2007 19 Jun - 16 Aug Bear Sterns HF liquidated + 97%
2008 19 Sep - 19 Nov Lehman Bankruptcy + 264%
2010 23 Apr - 20 May Flash Crash + 87%
2011 22 Jul - 22 Sep Debt Ceiling Crisis & U.S Downgrade + 141%
2012 26 Mar - 18 May Euro / Greek Debt Crisis + 47%
2013 07 May - 24 Jun Taper tantrum + 26%
2014 18 Sep - 15 Oct ECB disappoints on stimulus + 58%
2014-5 05 Dec - 15 Jan Russian equity collapse + 40%
2015 10 Aug - 01 Sep Chinese market crash / global uncertainty + 96%
Dates

For Financial Professionals. Not for Public Distribution. PROPRIETARY.
Permission to reprint or distribute any content from this presentation requires the written approval of S&P Dow Jones Indices.
Convexity
8
-50%
0%
50%
100%
150%
200%
-40% -30% -20% -10% 0% 10% 20% 30%
S&
P S
ho
rt-t
erm
VIX
Fu
ture
s In
dex
TR
21-t
radi
ng d
ay %
cha
nge
S&P 500 - 21 trading day % change
• S&P 500 VIX Short-Term Futures Index versus S&P 500 (Dec 2005 – Nov 2015)
Source: S&P Dow Jones Indices LLC. Data as of November, 2015. Total return index in USD. Chart is provided for illustrative purposes. Past performance is no guarantee of future results. These
charts and graphs may reflect hypothetical historical performance. Please see the Performance Disclosure at the end of this document for more information regarding the inherent limitations
associated with back-tested performance.

For Financial Professionals. Not for Public Distribution. PROPRIETARY.
Permission to reprint or distribute any content from this presentation requires the written approval of S&P Dow Jones Indices.
Persistence of Diversification Effects
9
• Correlations between the S&P 500® and various indices, past 10 years
24M Trailing Correlation to S&P 500 (Dec 2005 – Nov 2015)
Ave Max
S&P Developed BMI 1.0 1.0
S&P Europe 350® 0.9 0.9
S&P Emerging BMI 0.8 0.9
S&P GSCI® 0.5 0.9
S&P GSCI Gold 0.1 0.5
S&P 30Yr U.S. Treasury Futures -0.3 0.2
U.S. Dollar Index -0.5 0.2
S&P 500 VIX Short-Term Futures Index -0.8 -0.7
Source: S&P Dow Jones Indices LLC. Data as of November 30, 2015. All index performance considered was total return index in USD. Table provided for illustrative purposes. Past performance
is no guarantee of future results. These charts and graphs may reflect hypothetical historical performance. Please see the Performance Disclosure at the end of this document for more information
regarding the inherent limitations associated with back-tested performance.

For Financial Professionals. Not for Public Distribution. PROPRIETARY.
Permission to reprint or distribute any content from this presentation requires the written approval of S&P Dow Jones Indices.
Demand expression via ETPs
10
0.0
0.5
1.0
1.5
2.0
2.5
3.0
3.5
4.0
4.5
Jan2009
Aug2009
Mar2010
Oct2010
May2011
Dec2011
Jul2012
Feb2013
Sep2013
Apr2014
Nov2014
Jun2015
Top
6 V
ola
tilit
y E
TP
Ass
ets
($ b
ns)
• AUM in the six largest volatility-only exchange traded products Jan 2009 – Nov 2015
Source: S&P Dow Jones Indices LLC, Barclays Capital, ProShares, Credit Suisse / Velocityshares. Data as of November, 2015. Chart is provided for illustrative purposes. Past performance is no
guarantee of future results.

For Financial Professionals. Not for Public Distribution. PROPRIETARY.
Permission to reprint or distribute any content from this presentation requires the written approval of S&P Dow Jones Indices. 11
Section 2: Longer Term Performance

For Financial Professionals. Not for Public Distribution. PROPRIETARY.
Permission to reprint or distribute any content from this presentation requires the written approval of S&P Dow Jones Indices.
HY Returns
12
• S&P 500 VIX Short-Term Futures Index: years & quarters (Dec 2006 – Nov 2015)
Full Year Total Return Q1 Q2 Q3 Q4
2007 43% 0% -3% 27% 16%
2008 126% 12% -22% 23% 109%
2009 -65% 17% -40% -27% -32%
2010 -72% -37% 49% -45% -46%
2011 -10% -21% -29% 157% -38%
2012 -76% -50% -16% -35% -14%
2013 -66% -35% 0% -27% -27%
2014 -26% -1% -32% 10% 1%
2015 (to date) -41% -18% -21% 28% -29%
Source: S&P Dow Jones Indices LLC. Data as of November, 2015. Total return index in USD. Table is provided for illustrative purposes. Past performance is no guarantee of future results. These
charts and graphs may reflect hypothetical historical performance. Please see the Performance Disclosure at the end of this document for more information regarding the inherent limitations
associated with back-tested performance.

For Financial Professionals. Not for Public Distribution. PROPRIETARY.
Permission to reprint or distribute any content from this presentation requires the written approval of S&P Dow Jones Indices.
Short Volatility
13
0%
50%
100%
150%
200%
250%
01-2009 01-2010 01-2011 01-2012 01-2013 01-2014 01-2015
Notional Short Position
S&P 500 VIX Short-Term Futures
Source: S&P Dow Jones Indices LLC. Data as of November, 2015. Total return index in USD. Hypothetical short position does not reflect transaction costs,, borrowing costs and is not intended to
reflect a realistic investment strategy. Chart is provided for illustrative purposes only. Past performance is no guarantee of future results.

For Financial Professionals. Not for Public Distribution. PROPRIETARY.
Permission to reprint or distribute any content from this presentation requires the written approval of S&P Dow Jones Indices.
Short Volatility - Rebalanced
14
0
50
100
150
200
250
300
350
400
450
Jan2006
Aug2006
Mar2007
Oct2007
May2008
Dec2008
Jul2009
Feb2010
Sep2010
Apr2011
Nov2011
Jun2012
Jan2013
Aug2013
Mar2014
Oct2014
May2015
• S&P 500 VIX Short-Term Futures Inverse Daily Index: Dec 2006 – Nov 2015
Source: S&P Dow Jones Indices LLC. Data as of November, 2015. Total return index in USD. Chart is provided for illustrative purposes. Past performance is no guarantee of future results. These
charts and graphs may reflect hypothetical historical performance. Please see the Performance Disclosure at the end of this document for more information regarding the inherent limitations
associated with back-tested performance.

For Financial Professionals. Not for Public Distribution. PROPRIETARY.
Permission to reprint or distribute any content from this presentation requires the written approval of S&P Dow Jones Indices. 15
Section 3: VIX Futures Term Structure Dynamics

For Financial Professionals. Not for Public Distribution. PROPRIETARY.
Permission to reprint or distribute any content from this presentation requires the written approval of S&P Dow Jones Indices.
Contango: Example
16
12.9
14.0
15.1
16.5
17.5
18.118.6
19.019.3
19.6
12
13
14
15
16
17
18
19
20
Spot Nov-13 Dec-13 Jan-14 Feb-14 Mar-14 Apr-14 May-14 Jun-14 Jul-14
• VIX Futures Term Structure as of 4th November, 2013
Source: CBOE. Chart is provided for illustrative purposes. Past performance is no guarantee of future results.

For Financial Professionals. Not for Public Distribution. PROPRIETARY.
Permission to reprint or distribute any content from this presentation requires the written approval of S&P Dow Jones Indices.
…
Arbitrage
Channel
Contango – Hypothetical Attribution
17
VIX
Future
Next VIX
Future
= Previous Future ±
expected change±
demand premium
…
subject to arbitrage
bounds
Reversion
to mean?
Major
Event?
Always > 0
No
Change?
Historical Max 80.86 80
Long-Term
Average
Demand for
Short VIX
Futures
Demand for
Long VIX
Futures Source: S&P Dow Jones Indices LLC. Provided for illustrative purposes only.

For Financial Professionals. Not for Public Distribution. PROPRIETARY.
Permission to reprint or distribute any content from this presentation requires the written approval of S&P Dow Jones Indices.
0.90 0.87
0.82
0.64
0.02
0.46
0.60
0.86
0.00
0.20
0.40
0.60
0.80
1.00
1 Day 1 Month 1 Quarter 1 Year
Cor
rela
tion
to S
&P
500
VIX
Sho
rt-T
erm
Fut
ures
In
dex
Ret
urn
VIX Index Average 1st vs 2nd Future contango over period
What Drives Performance?
18
• Correlations of changes in the S&P 500 VIX Short-Term Futures Index to changes in
the VIX index, and to futures curvature (Feb 2009 – Nov 2015)
Source: S&P Dow Jones Indices LLC. Data as of November, 2015. “1st to 2d Futures Contango” is the average percentage difference – taken over the performance measurement period -
between the then-current first and second monthly future from expiry. Performance is total return index in USD. Chart is provided for illustrative purposes. Past performance is no guarantee of
future results.

For Financial Professionals. Not for Public Distribution. PROPRIETARY.
Permission to reprint or distribute any content from this presentation requires the written approval of S&P Dow Jones Indices. 19
Section 4: Supply / Demand Dynamics

For Financial Professionals. Not for Public Distribution. PROPRIETARY.
Permission to reprint or distribute any content from this presentation requires the written approval of S&P Dow Jones Indices.
y = 0.9336x + 2.5006
0
10
20
30
40
50
60
0 10 20 30 40 50 60
2nd Future
Front Future
Linear Regression
20
• Historical 1st & 2nd VIX Futures Prices, Daily (Jan 2009 – Nov 2015)
Source: CBOE. Chart is provided for illustrative purposes. Past performance is no guarantee of future results.

For Financial Professionals. Not for Public Distribution. PROPRIETARY.
Permission to reprint or distribute any content from this presentation requires the written approval of S&P Dow Jones Indices.
Consequences of Linearity
21
VIX Futures as current ± mean reversion ± premium
• F2 = 0.9333 F1 + 2.5
= F1 + (1/15)*( 20 – F1) + 1.14
• Equation describes mean reversion to 20 (at 1/15 per month) plus 1.14 premium
• Current prices compared to those predicted by linear regression
• (Loosely) defines the current premium, and tell if it is above/below average

For Financial Professionals. Not for Public Distribution. PROPRIETARY.
Permission to reprint or distribute any content from this presentation requires the written approval of S&P Dow Jones Indices.
Reality Check
22
S&P 500 VIX Short Term Futures Index performance interpreted
• Total return January 30, 2009 to November 17, 2015 of -99.67%
• VIX from 44.84 to 18.84 (fall of 58%) over the same period
• Adjusted performance of -99.22%, equivalent to -5.78% per month
• -5.78% x 21 (average VIX Futures price) = 1.20 VIX points (vs 1.14 estimated)
Sources: S&P, CBOE. Past performance is no guarantee of future results.

For Financial Professionals. Not for Public Distribution. PROPRIETARY.
Permission to reprint or distribute any content from this presentation requires the written approval of S&P Dow Jones Indices.
Historical Premium
23
• Approximation to the “premium” in near VIX futures
Source: S&P Dow Jones Indices LLC, CBOE. Data as of November, 2015. “Model implied premium” is a trailing 21-day average of the difference between the price of the then-current 2nd VIX
Future and that approximated by the model, i.e. 87.5% of the then-current 1st VIX Future, plus 2.5. Chart is provided for illustrative purposes. Past performance is no guarantee of future results.
-10
-8
-6
-4
-2
0
2
4
6
Feb2006
Feb2007
Feb2008
Feb2009
Feb2010
Feb2011
Feb2012
Feb2013
Feb2014
Feb2015
Front Future Price > 35 Model-implied premium

For Financial Professionals. Not for Public Distribution. PROPRIETARY.
Permission to reprint or distribute any content from this presentation requires the written approval of S&P Dow Jones Indices.
Net VIX ETP Exposures
24
0.0
0.5
1.0
1.5
2.0
2.5
3.0
3.5
4.0
4.5
Jan2009
Jul2009
Jan2010
Jul2010
Jan2011
Jul2011
Jan2012
Jul2012
Jan2013
Jul2013
Jan2014
Jul2014
Jan2015
Jul2015
Top
6 V
ola
tilit
y E
TP
Ass
ets
($ b
ns) ETP total assets
Net Exposure (accounting for leverage)
• Accounting for inverse and leveraged VIX exchange-traded products
Source: S&P Dow Jones Indices LLC, Barclays Capital, ProShares, Credit Suisse / Velocityshares. Data as of November, 2015. Chart is provided for illustrative purposes. Past performance is no
guarantee of future results.

For Financial Professionals. Not for Public Distribution. PROPRIETARY.
Permission to reprint or distribute any content from this presentation requires the written approval of S&P Dow Jones Indices.
ETP Net Assets and Futures Premium
25
Source: S&P Dow Jones Indices LLC, Barclays Capital, ProShares, Credit Suisse / Velocityshares as of November 2015. Chart is provided for illustrative purposes. Past performance is no
guarantee of future results.
0
0.5
1
1.5
2
2.5
3
3.5
-3.0
-2.0
-1.0
0.0
1.0
2.0
3.0
4.0
5.0
Jan2009
Sep2009
May2010
Jan2011
Sep2011
May2012
Jan2013
Sep2013
May2014
Jan2015
Sep2015
Net ETP Exposure (adjusted for leverage,
$bns)
Model Implied Premium
Model-Implied Premium (Left Axis) Net Exposure ($bn, Right Axis)

For Financial Professionals. Not for Public Distribution. PROPRIETARY.
Permission to reprint or distribute any content from this presentation requires the written approval of S&P Dow Jones Indices.
Conclusions
26
VIX Futures indices
• Potentially attractive hedging properties; yet poor performance 2009-2015
• Different drivers dominate long-term returns than short-term returns
• As demand changes, the past may become particularly poor guide to the future
• Current marketplace suggests a balance between long and short demand for ETPs

For Financial Professionals. Not for Public Distribution. PROPRIETARY.
Permission to reprint or distribute any content from this presentation requires the written approval of S&P Dow Jones Indices. 27
Contact Us
Tim Edwards, PhD
THANK YOU

For Financial Professionals. Not for Public Distribution. PROPRIETARY.
Permission to reprint or distribute any content from this presentation requires the written approval of S&P Dow Jones Indices.
PERFORMANCE DISCLOSURE
28
The S&P 500 VIX Short Term Futures Index and the S&P 500 Mid-Term Futures Index were launched on December 22, 2008; The S&P 500 VIX Short Term Futures Inverse Daily Index was
launched on August 5th, 2012. All information presented prior to the launch date is back-tested. Back-tested performance is not actual performance, but is hypothetical. The back-test calculations are
based on the same methodology that was in effect when the index was officially launched. Complete index methodology details are available at www.spdji.com. It is not possible to invest directly in
an index.
S&P Dow Jones Indices defines various dates to assist our clients in providing transparency on their products. The First Value Date is the first day for which there is a calculated value (either live or
back-tested) for a given index. The Base Date is the date at which the Index is set at a fixed value for calculation purposes. The Launch Date designates the date upon which the values of an index
are first considered live: index values provided for any date or time period prior to the index’s Launch Date are considered back-tested. S&P Dow Jones Indices defines the Launch Date as the date
by which the values of an index are known to have been released to the public, for example via the company’s public website or its datafeed to external parties. For Dow Jones-branded indicates
introduced prior to May 31, 2013, the Launch Date (which prior to May 31, 2013, was termed “Date of introduction”) is set at a date upon which no further changes were permitted to be made to the
index methodology, but that may have been prior to the Index’s public release date.
Past performance of the Index is not an indication of future results. Prospective application of the methodology used to construct the Index may not result in performance commensurate with the
back-test returns shown. The back-test period does not necessarily correspond to the entire available history of the Index. Please refer to the methodology paper for the Index, available at
www.spdji.com for more details about the index, including the manner in which it is rebalanced, the timing of such rebalancing, criteria for additions and deletions, as well as all index calculations.
Another limitation of using back-tested information is that the back-tested calculation is generally prepared with the benefit of hindsight. Back-tested information reflects the application of the index
methodology and selection of index constituents in hindsight. No hypothetical record can completely account for the impact of financial risk in actual trading. For example, there are numerous factors
related to the equities, fixed income, or commodities markets in general which cannot be, and have not been accounted for in the preparation of the index information set forth, all of which can affect
actual performance.
The Index returns shown do not represent the results of actual trading of investable assets/securities. S&P Dow Jones Indices LLC maintains the Index and calculates the Index levels and
performance shown or discussed, but does not manage actual assets. Index returns do not reflect payment of any sales charges or fees an investor may pay to purchase the securities underlying the
Index or investment funds that are intended to track the performance of the Index. The imposition of these fees and charges would cause actual and back-tested performance of the securities/fund to
be lower than the Index performance shown. As a simple example, if an index returned 10% on a US $100,000 investment for a 12-month period (or US $10,000) and an actual asset-based fee of
1.5% was imposed at the end of the period on the investment plus accrued interest (or US $1,650), the net return would be 8.35% (or US $8,350) for the year. Over a three year period, an annual
1.5% fee taken at year end with an assumed 10% return per year would result in a cumulative gross return of 33.10%, a total fee of US $5,375, and a cumulative net return of 27.2% (or US $27,200).

For Financial Professionals. Not for Public Distribution. PROPRIETARY.
Permission to reprint or distribute any content from this presentation requires the written approval of S&P Dow Jones Indices.
GENERAL DISCLAIMER
29
Copyright © 2015 by S&P Dow Jones Indices LLC, a part of McGraw Hill Financial. All rights reserved. Standard & Poor’s and S&P are registered trademarks of Standard & Poor’s Financial Services
LLC (“S&P”), a part of McGraw Hill Financial. Dow Jones is a registered trademark of Dow Jones Trademark Holdings LLC (“Dow Jones”). Trademarks have been licensed to S&P Dow Jones Indices
LLC. Redistribution, reproduction and/or photocopying in whole or in part are prohibited without written permission. This document does not constitute an offer of services in jurisdictions where S&P
Dow Jones Indices LLC, Dow Jones, S&P or their respective affiliates (collectively “S&P Dow Jones Indices”) do not have the necessary licenses. All information provided by S&P Dow Jones Indices
is impersonal and not tailored to the needs of any person, entity or group of persons. S&P Dow Jones Indices receives compensation in connection with licensing its indices to third parties. Past
performance of an index is not a guarantee of future results.
It is not possible to invest directly in an index. Exposure to an asset class represented by an index is available through investable instruments based on that index. S&P Dow Jones Indices does not
sponsor, endorse, sell, promote or manage any investment fund or other investment vehicle that is offered by third parties and that seeks to provide an investment return based on the performance of
any index. S&P Dow Jones Indices makes no assurance that investment products based on the index will accurately track index performance or provide positive investment returns. S&P Dow Jones
Indices LLC is not an investment advisor, and S&P Dow Jones Indices makes no representation regarding the advisability of investing in any such investment fund or other investment vehicle. A
decision to invest in any such investment fund or other investment vehicle should not be made in reliance on any of the statements set forth in this document. Prospective investors are advised to
make an investment in any such fund or other vehicle only after carefully considering the risks associated with investing in such funds, as detailed in an offering memorandum or similar document
that is prepared by or on behalf of the issuer of the investment fund or other vehicle. Inclusion of a security within an index is not a recommendation by S&P Dow Jones Indices to buy, sell, or hold
such security, nor is it considered to be investment advice. Closing prices for S&P US benchmark indices and Dow Jones US benchmark indices are calculated by S&P Dow Jones Indices based on
the closing price of the individual constituents of the index as set by their primary exchange. Closing prices are received by S&P Dow Jones Indices from one of its third party vendors and verified by
comparing them with prices from an alternative vendor. The vendors receive the closing price from the primary exchanges. Real-time intraday prices are calculated similarly without a second
verification.
These materials have been prepared solely for informational purposes based upon information generally available to the public and from sources believed to be reliable. No content contained in
these materials (including index data, ratings, credit-related analyses and data, research, valuations, model, software or other application or output therefrom) or any part thereof (Content) may be
modified, reverse-engineered, reproduced or distributed in any form or by any means, or stored in a database or retrieval system, without the prior written permission of S&P Dow Jones Indices. The
Content shall not be used for any unlawful or unauthorized purposes. S&P Dow Jones Indices and its third-party data providers and licensors (collectively “S&P Dow Jones Indices Parties”) do not
guarantee the accuracy, completeness, timeliness or availability of the Content. S&P Dow Jones Indices Parties are not responsible for any errors or omissions, regardless of the cause, for the
results obtained from the use of the Content. THE CONTENT IS PROVIDED ON AN “AS IS” BASIS. S&P DOW JONES INDICES PARTIES DISCLAIM ANY AND ALL EXPRESS OR IMPLIED
WARRANTIES, INCLUDING, BUT NOT LIMITED TO, ANY WARRANTIES OF MERCHANTABILITY OR FITNESS FOR A PARTICULAR PURPOSE OR USE, FREEDOM FROM BUGS, SOFTWARE
ERRORS OR DEFECTS, THAT THE CONTENT’S FUNCTIONING WILL BE UNINTERRUPTED OR THAT THE CONTENT WILL OPERATE WITH ANY SOFTWARE OR HARDWARE
CONFIGURATION. In no event shall S&P Dow Jones Indices Parties be liable to any party for any direct, indirect, incidental, exemplary, compensatory, punitive, special or consequential damages,
costs, expenses, legal fees, or losses (including, without limitation, lost income or lost profits and opportunity costs) in connection with any use of the Content even if advised of the possibility of such
damages.
VIX® is a registered trademark of Chicago Board Options Exchange, Incorporated. The VIX methodology is the property of the Chicago Board Options Exchange ("CBOE"). CBOE has granted
Standard & Poor’s Financial Services LLC ("S&P"), a license to use the VIX methodology to create the S&P 500 VIX Futures Index Series.