sp manweb use of system charging statement notice of ... · use of system charging statement....
TRANSCRIPT
1 ATLANTIC QUAY, ROBERTSON STREET, GLASGOW, G2 8SP
SC189125
SP MANWEB PLC DECEMBER 2017
SP Manweb
Use of System Charging Statement
NOTICE OF CHARGES
Effective from 1st April 2019
Version 0.2
This statement is in a form to be approved by the Gas and Electricity Markets Authority.

1 ATLANTIC QUAY, ROBERTSON STREET, GLASGOW, G2 8SP
SC189125
SP MANWEB PLC DECEMBER 2017
Version Control
Version Date Description of version and any changes made
0.2 02.01.2019 Annex 5 & 6 updated
A change-marked version of this statement can be provided upon request.
PAGE 3 OF 56 SP MANWEB PLC DECEMBER 2017
Contents
1. Introduction 4
Validity period 5 Contact details 5
2. Charge application and definitions 7
Supercustomer billing and payment 7 Site-specific billing and payment 9 Application of capacity charges 11 Application of charges for excess reactive power 13 Incorrectly allocated charges 15 Generation charges for pre-2005 designated EHV properties 16 Provision of billing data 17 Out of area use of system charges 17 Licensed distribution network operator charges 17 Licence exempt distribution networks 18
3. Schedule of charges for use of the distribution system 21
4. Schedule of line loss factors 22
Role of line loss factors in the supply of electricity 22 Calculation of line loss factors 22 Publication of line loss factors 23
5. Notes for Designated EHV Properties 24
EDCM network group costs 24 Charges for new Designated EHV Properties 24 Charges for amended Designated EHV Properties 24 Demand-side management 24
6. Electricity distribution rebates 26
7. Accounting and administration services 26
8. Charges for electrical plant provided ancillary to the grant of use of system 26
Appendix 1 - Glossary 27
Appendix 2 - Guidance notes 34
Background 34 Meter point administration 34 Your charges 36 Reducing your charges 36 Reactive power and reactive power charges 37 Site-specific EDCM charges 38
Annex 1 - Schedule of charges for use of the distribution system by LV and HV Designated Properties 40
Annex 2 - Schedule of charges for use of the distribution system by Designated EHV Properties (including LDNOs with Designated EHV Properties/end-users) 41
Annex 3 - Schedule of charges for use of the distribution system by preserved/additional LLF classes 46
Annex 4 - Charges applied to LDNOs with LV and HV end-users 47
Annex 5 - Schedule of line loss factors 51
Annex 6 - Charges for New or Amended Designated EHV Properties 56
PAGE 4 OF 56 SP MANWEB PLC DECEMBER 2017
1. Introduction
1.1. This statement tells you about our charges and the reasons behind them. It has
been prepared consistent with Standard Licence Condition 14 of our Electricity
Distribution Licence. The main purpose of this statement is to provide our
schedule of charges1 for the use of our Distribution System and to provide the
schedule of adjustment factors2 that should be applied in Settlement to account
for losses from the Distribution System. We have also included guidance notes
in Appendix 2 to help improve your understanding of the charges we apply.
1.2. Within this statement we use terms such as ‘Users’ and ‘Customers’ as well as
other terms which are identified with initial capitalisation. These terms are
defined in the glossary.
1.3. The charges in this statement are calculated using the following methodologies
as per the Distribution Connection and Use of System Agreement (DCUSA)3:
Common Distribution Charging Methodology (CDCM); for Low Voltage (LV)
and High Voltage (HV) Designated Properties as per DCUSA Schedule 16;
and
Extra High Voltage (EHV) Distribution Charging Methodology (EDCM); for
Designated EHV Properties as per DCUSA Schedule 17.
1.4. Separate charges are calculated depending on the characteristics of the
connection and whether the use of the Distribution System is for demand or
generation purposes. Where a generation connection is seen to support the
Distribution System the charges will be negative and the Supplier will receive
credits for exported energy.
1.5. The application of charges to premises can usually be referenced using the
Line Loss Factor Class (LLFC) contained in the charge tables. Further
information on how to identify and calculate the charge that will apply for your
premises is provided in the guidance notes in Appendix 2.
1 Charges can be positive or negative.
2 Also known as Loss Adjustment Factors or Line Loss Factors. The schedule of adjustment factors will be provided in a
revised statement shortly after the adjustment factors for the relevant year have been successfully audited by Elexon. 3 The Distribution and Connection Use of System Agreement (DCUSA) available from
http://www.dcusa.co.uk/SitePages/Documents/DCUSA-Document.aspx

PAGE 5 OF 56 SP MANWEB PLC DECEMBER 2017
1.6. All charges in this statement are shown exclusive of VAT. Invoices will include
VAT at the applicable rate.
1.7. The annexes that form part of this statement are also available in spreadsheet
format. This spreadsheet contains supplementary information used for
charging purposes and a simple model to assist you to calculate charges. This
spreadsheet can be downloaded from
https://www.scottishpower.com/pages/connections_use_of_system_and_meter
ing_services.aspx.
Validity period
1.8. This charging statement is valid for services provided from the effective date
stated on the front of the statement and remains valid until updated by a revised
version or superseded by a statement with a later effective date.
1.9. When using this charging statement, care should be taken to ensure that the
relevant statement or statements covering the period that is of interest are
used.
1.10. Notice of any revision to the statement will be provided to Users of our
Distribution System. The latest statements can be downloaded from
https://www.scottishpower.com/pages/connections_use_of_system_and_meter
ing_services.aspx.
Contact details
1.11. If you have any questions about this statement please contact us at this
address:
SP Energy Networks, Network Planning & Regulation
Prenton Way
Birkenhead
Merseyside
CH43 3ET
Email: [email protected]
Telephone: 0141 614 1605
1.12. All enquiries regarding reductions to existing maximum capacities should be
addressed to:
SP Energy Networks, Network Planning and Regulation
55 Fullarton Drive
PAGE 6 OF 56 SP MANWEB PLC DECEMBER 2017
Cambuslang Investment Park
Glasgow
G32 8FA
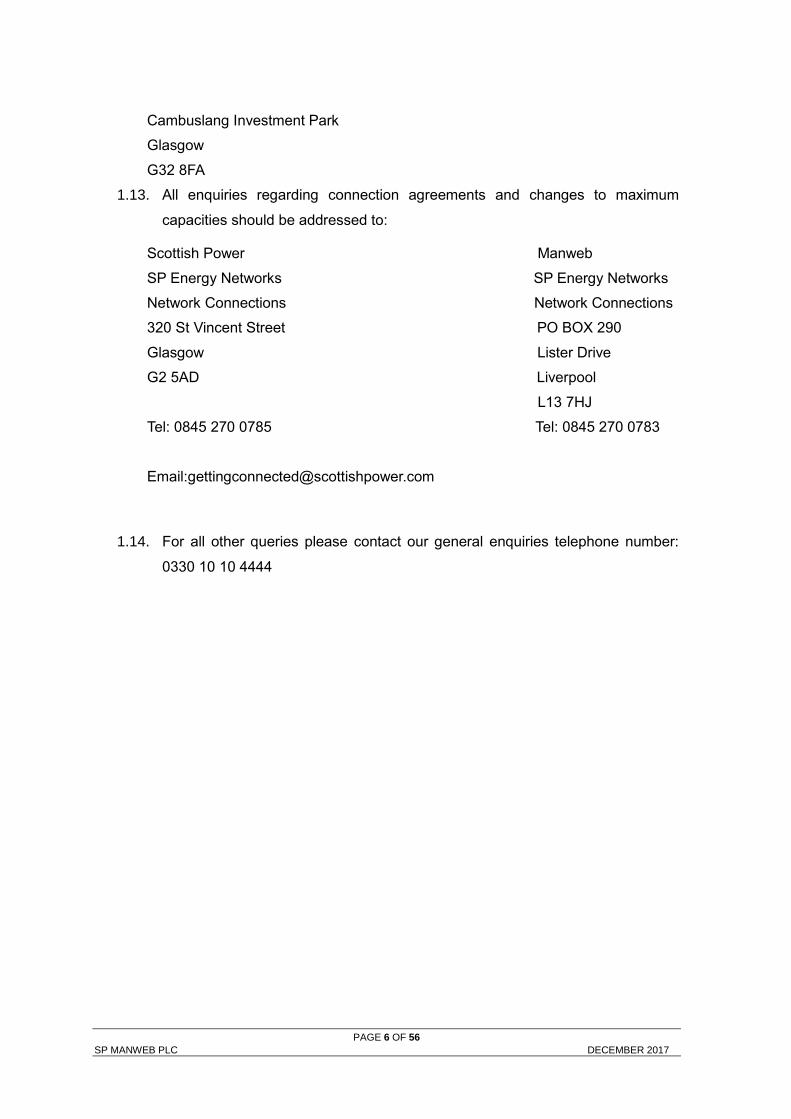
1.13. All enquiries regarding connection agreements and changes to maximum
capacities should be addressed to:
Scottish Power Manweb
SP Energy Networks SP Energy Networks
Network Connections Network Connections
320 St Vincent Street PO BOX 290
Glasgow Lister Drive
G2 5AD Liverpool
L13 7HJ
Tel: 0845 270 0785 Tel: 0845 270 0783
Email:[email protected]
1.14. For all other queries please contact our general enquiries telephone number:
0330 10 10 4444
PAGE 7 OF 56 SP MANWEB PLC DECEMBER 2017
2. Charge application and definitions
2.1. The following section details how the charges in this statement are applied and
billed to Users of our Distribution System.
2.2. We utilise two billing approaches depending on the type of metering data
received. The ‘Supercustomer’ approach is used for Non-Half Hourly (NHH)
metered, NHH unmetered, Half Hourly (HH) metered premises with whole
current metering systems, and all domestic premises. The ‘Site-specific’
approach is used for non-domestic current transformer (CT) metered premises
or pseudo HH unmetered premises.
2.3. Typically, NHH metered or HH metered premises with whole current Metering
Systems are domestic and small businesses; premises with non-domestic CT
Metering Systems are generally larger businesses or industrial sites; and
unmetered premises are normally streetlights.
Supercustomer billing and payment
2.4. Supercustomer billing and payment applies to Meter Point Administration
Numbers (MPANs) registered as NHH metered, NHH unmetered or aggregated
HH metered. The Supercustomer approach makes use of aggregated data
obtained from Suppliers using the ‘Aggregated Distribution Use of System
(DUoS) Report’ data flow.
2.5. Invoices are calculated on a periodic basis and sent to each User for whom we
transport electricity through our Distribution System. Invoices are reconciled
over a period of approximately 14 months to reflect later and more accurate
consumption figures.
2.6. The charges are applied on the basis of the LLFC assigned to the MPAN, and
the units consumed within the time periods specified in this statement. These
time periods may not necessarily be the same as those indicated by the Time
Pattern Regime (TPR) assigned to the Standard Settlement Configuration
(SSC). All LLFCs are assigned at our sole discretion, based on the tariff
application rules set out in the appropriate charging methodology or elsewhere
in this statement. Please refer to the section ‘Incorrectly allocated charges’ if
you believe the allocated LLFC or tariff is incorrect.
PAGE 8 OF 56 SP MANWEB PLC DECEMBER 2017
Supercustomer charges
2.7. Supercustomer charges include the following components:
a fixed charge, pence/MPAN/day; there will only be one fixed charge
applied to each MPAN; and
unit charges, pence/kilowatt-hour (kWh); more than one kWh charge may
apply depending on the type of tariff for which the MPAN is registered.
2.8. Users who supply electricity to a Customer whose MPAN is registered as
Measurement Class A, B, F or G will be allocated the relevant charge structure
set out in Annex 1.
2.9. Measurement Class A charges apply to Exit/Entry Points where NHH metering
is used for Settlement.
2.10. Measurement Class B charges apply to Exit Points deemed to be suitable as
Unmetered Supplies as permitted in the Electricity (Unmetered Supply)
Regulations 20014 and where operated in accordance with Balancing and
Settlement Code (BSC) procedure 5205.
2.11. Measurement Class F charges apply to Exit/Entry points at domestic premises
where HH metering is used for Settlement.
2.12. Measurement Class G charges apply to Exit/Entry points at non-domestic
premises with whole current Metering Systems where HH metering is used for
Settlement.
2.13. Identification of the appropriate charge can be made by cross-reference to the
LLFC.
2.14. Valid Settlement Profile Class (PC)/Standard Settlement Class (SSC)/Meter
Timeswitch Code (MTC) combinations for LLFCs where the Metering System is
Measurement Class A or B are detailed in Market Domain Data (MDD).
2.15. Where an MPAN has an invalid Settlement combination, the ‘Domestic
Unrestricted’ fixed and unit charges will be applied as default until the invalid
combination is corrected. Where there are multiple SSC/TPR combinations,
4 The Electricity (Unmetered Supply) Regulations 2001 available from http://www.legislation.gov.uk/uksi/2001/3263/made
5 Balancing and Settlement Code Procedures on unmetered supplies are available from https://www.elexon.co.uk/bsc-
related-documents/related-documents/bscps/
PAGE 9 OF 56 SP MANWEB PLC DECEMBER 2017
the default ‘Domestic Unrestricted’ fixed and unit charges will be applied for
each invalid SSC/TPR combination
2.16. The time periods for unit charges where the Metering System is Measurement
Class A or B are as specified by the SSC. To determine the appropriate charge
rate for each SSC/TPR a lookup table is provided in the spreadsheet that
accompanies this statement6.
2.17. The time periods for unit charges where the Metering System is Measurement
Class F or G are set out in the table ‘Time Bands for Half Hourly Metered
Properties’ in Annex 1.
2.18. The ‘Domestic Off-Peak’ and ‘Small Non-Domestic Off-Peak’ charges are
supplementary to either an unrestricted or a two-rate charge.
Site-specific billing and payment
2.19. Site-specific billing and payment applies to MPANs registered as Measurement
Class C, D and E or any other relevant Metering System Identifier (MSID). The
site-specific billing and payment approach to Use of System (UoS) billing
makes use of HH metering data at premises level received through Settlement.
2.20. Invoices are calculated on a periodic basis and sent to each User for whom we
transport electricity through our Distribution System. Where an account is
based on estimated data, the account shall be subject to any adjustment that
may be necessary following the receipt of actual data from the User.
2.21. The charges are applied on the basis of the LLFCs assigned to the MPAN (or
the MSID) for Central Volume Allocation (CVA) sites), and the units consumed
within the time periods specified in this statement
2.22. All LLFCs are assigned at our sole discretion, based on the tariff application
rules set out in the appropriate charging methodology or elsewhere in this
statement. Please refer to the section ‘Incorrectly allocated charges if you
believe the allocated LLFC or tariff is incorrect.Where an incorrectly applied
LLFC is identified, we may at our sole discretion apply the correct LLFC and/or
charges.
Site-specific billed charges
2.23. Site-specific billed charges may include the following components:
6 SP Manweb - Schedule of charges and other tables – Version 1.xlsx
PAGE 10 OF 56 SP MANWEB PLC DECEMBER 2017
a fixed charge, pence/MPAN/day or pence/MSID/day;
a capacity charge, pence/kilovolt-ampere(kVA)/day, for Maximum Import
Capacity (MIC) and/or Maximum Export Capacity (MEC);
an excess capacity charge, pence/kVA/day, if a site exceeds its MIC and/or
MEC;
unit charges, pence/kWh, more than one unit charge may be applied; and
an excess reactive power charge, pence/kilovolt-ampere reactive
hour(kVArh), for each unit in excess of the reactive charge threshold.
2.24. Users who wish to supply electricity to Customers whose Metering System is
Measurement Class C, D or E or is settled via CVA will be allocated the relevant
charge structure dependent upon the voltage and location of the Metering
Point.
2.25. Measurement Class C, E or CVA charges apply to Exit/Entry Points where HH
metering data is used for Settlement purposes for non-domestic premises that
have CT metering.
2.26. Measurement Class D charges apply to Exit Points deemed to be suitable as
Unmetered Supplies as permitted in the Electricity (Unmetered Supply)
Regulations 2001 and where operated in accordance with BSC procedure 5207.
2.27. Fixed charges are generally levied on a pence per MPAN/MSID per day basis.
2.28. LV and HV Designated Properties will be charged in accordance with the
CDCM and allocated the relevant charge structure set out in Annex 1.
2.29. For LV and HV Designated Properties that utilise a combination of Intermittent
and Non-Intermittent generation technologies metered through a single
MPAN/MSID, we will allocate the tariff based on the dominant technology. The
dominant technology will have a higher combined installed capacity as
evidenced in ratings contained in the Connection Agreement.
2.30. Designated EHV Properties will be charged in accordance with the EDCM and
allocated the relevant charge structure set out in Annex 2.
7 Balancing and Settlement Code Procedures on unmetered supplies and available from https://www.elexon.co.uk/bsc-
related-documents/related-documents/bscps/
PAGE 11 OF 56 SP MANWEB PLC DECEMBER 2017
2.31. Where LV and HV Designated Properties or Designated EHV Properties have
more than one point of connection (as identified in the Connection Agreement)
then separate charges will be applied to each point of connection.
2.32. Due to the seasonal nature of charges for Unmetered Supplies, changes
between Measurement Classes B and D (or vice versa) shall not be agreed
except with effect from 1 April in any charging year.
Time periods for half hourly metered properties
2.33. The time periods for the application of unit charges to LV and HV Designated
Properties that are HH metered are detailed in Annex 1. We have not issued a
notice to change the time bands
2.34. The time periods for the application of unit charges to Designated EHV
Properties are detailed in Annex 2. We have not issued a notice to change the
time bands
Time periods for pseudo half hourly unmetered properties
2.35. The time periods for the application of unit charges to Unmetered Supply Exit
Points that are pseudo HH metered are detailed in Annex 1. We have not
issued a notice to change the time bands
Application of capacity charges
2.36. The following sections explain the application of capacity charges and
exceeded capacity charges.
Chargeable capacity
2.37. The chargeable capacity is, for each billing period, the MIC/MEC, as detailed
below.
2.38. The MIC/MEC will be agreed with us at the time of connection or pursuant to a
later change in requirements. Following such an agreement (be it at the time of
connection or later) no reduction in MIC/MEC will be allowed for a 12 month
period.
2.39. Reductions to the MIC and/or MEC may only be permitted once in a 12 month
period. Where the MIC and/or MEC is reduced the new lower level will be
agreed with reference to the level of the Customer’s maximum demand. The
new MIC and/or MEC will be applied from the start of the next billing period
after the date that the request was received. It should be noted that, where a
PAGE 12 OF 56 SP MANWEB PLC DECEMBER 2017
new lower level is agreed, the original capacity may not be available in the
future without the need for network reinforcement and associated charges.
2.40. In the absence of an agreement, the chargeable capacity, save for error or
omission, will be based on the last MIC and/or MEC previously agreed by the
distributor for the relevant premises’ connection. A Customer can seek to agree
or vary the MIC and/or MEC by contacting us using the contact details in
section 1.
Exceeded capacity
2.41. Where a Customer takes additional unauthorised capacity over and above the
MIC/MEC, the excess will be classed as exceeded capacity. The exceeded
portion of the capacity will be charged at the excess capacity charge p/kVA/day
rate, based on the difference between the MIC/MEC and the actual capacity
used. This will be charged for the full duration of the billing period in which the
breach occurs.
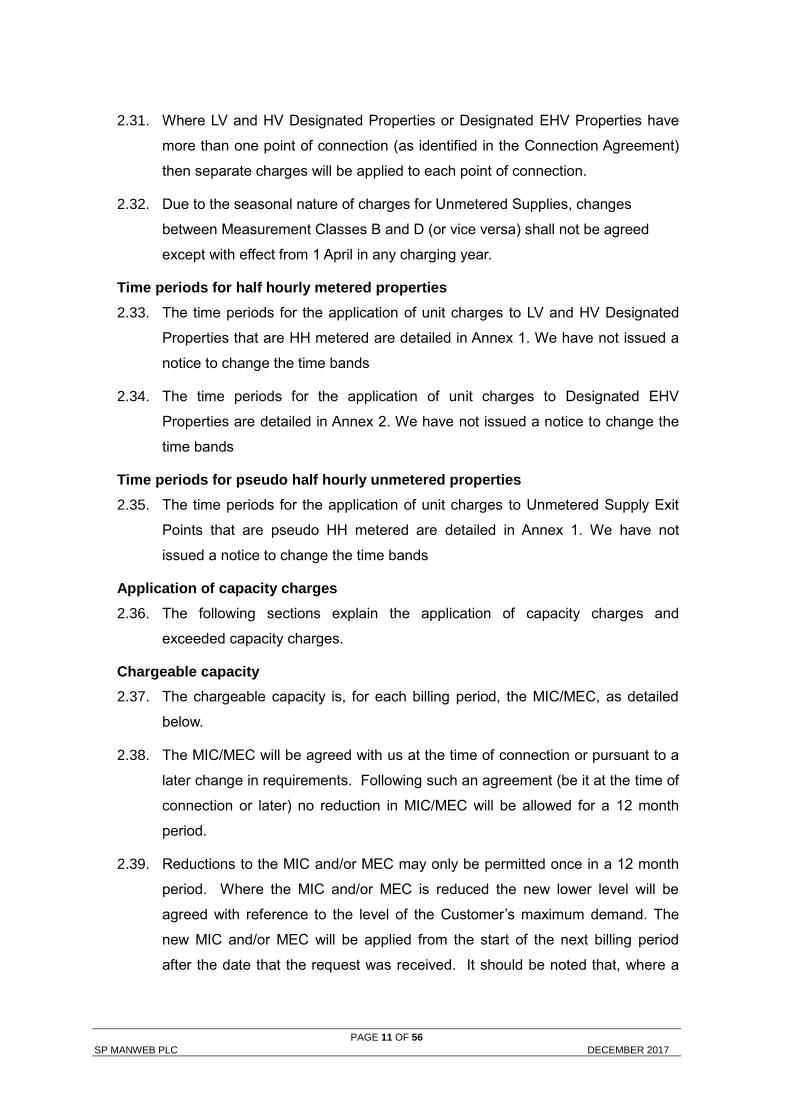
Demand exceeded capacity
),),max(max(2 capacity exceeded Demand 2 02 MICRERIAI
Where:
AI = Active import (kWh)
RI = Reactive import (kVArh)
RE = Reactive export (kVArh)
MIC = Maximum import capacity (kVA)
2.42. Only reactive import and reactive export values occurring at times of active
import are used in the calculation. For sites which are importing and exporting
in the same HH, i.e. where active import is not equal to zero and active export
is not equal to zero, use zero for reactive import and reactive export when
calculating capacity taken.
2.43. This calculation is completed for every half hour and the maximum value from
the billing period is applied.
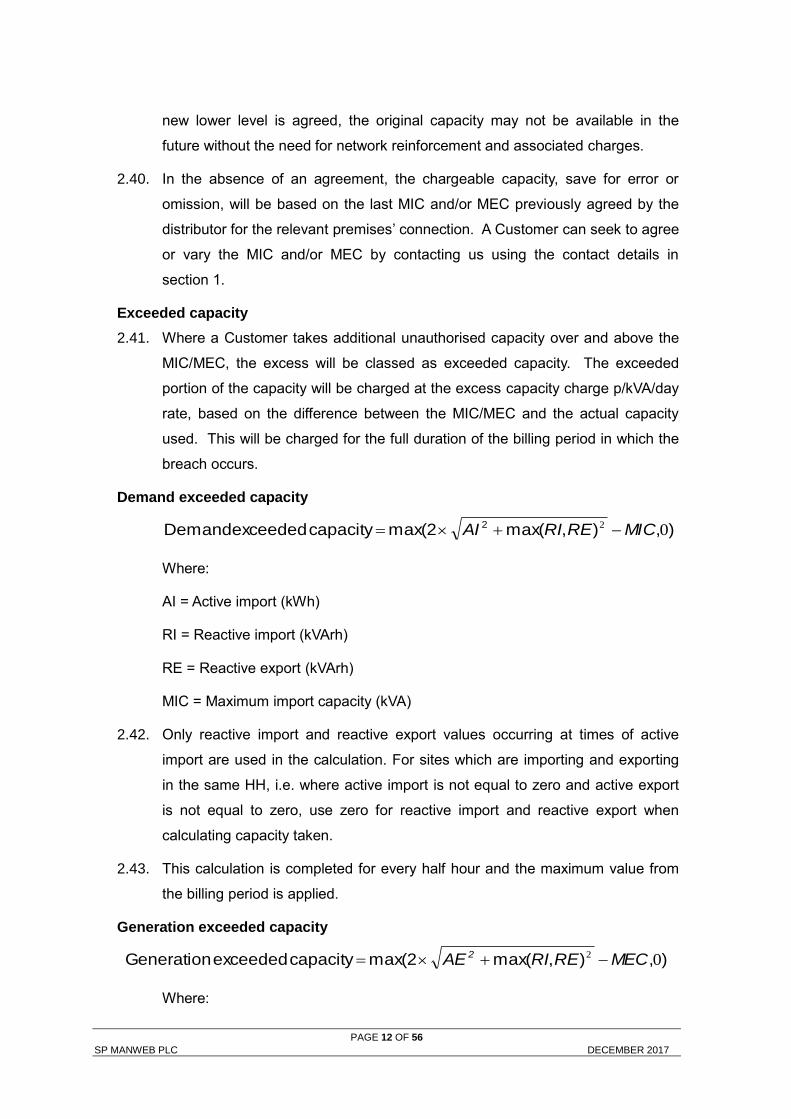
Generation exceeded capacity
),),max(max(2 capacity exceeded Generation 02 MECRERIAE 2
Where:
PAGE 13 OF 56 SP MANWEB PLC DECEMBER 2017
AE = Active export (kWh)
RI = Reactive import (kVArh)
RE = Reactive export (kVArh)
MEC = Maximum export capacity (kVA)
2.44. Only reactive import and reactive export values occurring at times of active
export are used in the calculation. For sites which are importing and exporting
in the same HH, i.e. where active import is not equal to zero and active export
is not equal to zero, use zero for reactive import and reactive export when
calculating capacity taken.
2.45. This calculation is completed for every half hour and the maximum value from
the billing period is applied.
Standby capacity for additional security on site
2.46. Where standby capacity charges are applied, the charge will be set at the same
rate as that applied to normal MIC. Should a Customer’s request for additional
security of supply require the provision of capacity from two different sources,
we reserve the right to charge for the capacity held at each source.
Minimum capacity levels
2.47. There is no minimum capacity threshold.
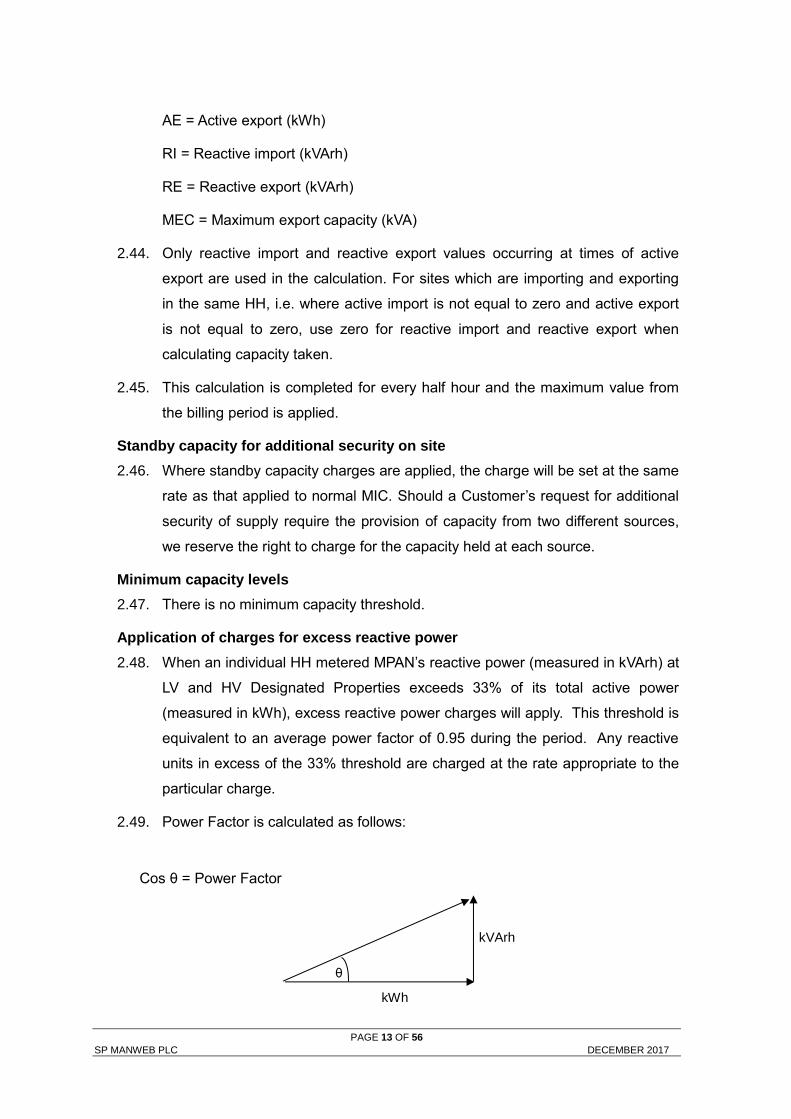
Application of charges for excess reactive power
2.48. When an individual HH metered MPAN’s reactive power (measured in kVArh) at
LV and HV Designated Properties exceeds 33% of its total active power
(measured in kWh), excess reactive power charges will apply. This threshold is
equivalent to an average power factor of 0.95 during the period. Any reactive
units in excess of the 33% threshold are charged at the rate appropriate to the
particular charge.
2.49. Power Factor is calculated as follows:
Cos θ = Power Factor
kWh
kVArh
θ
PAGE 14 OF 56 SP MANWEB PLC DECEMBER 2017
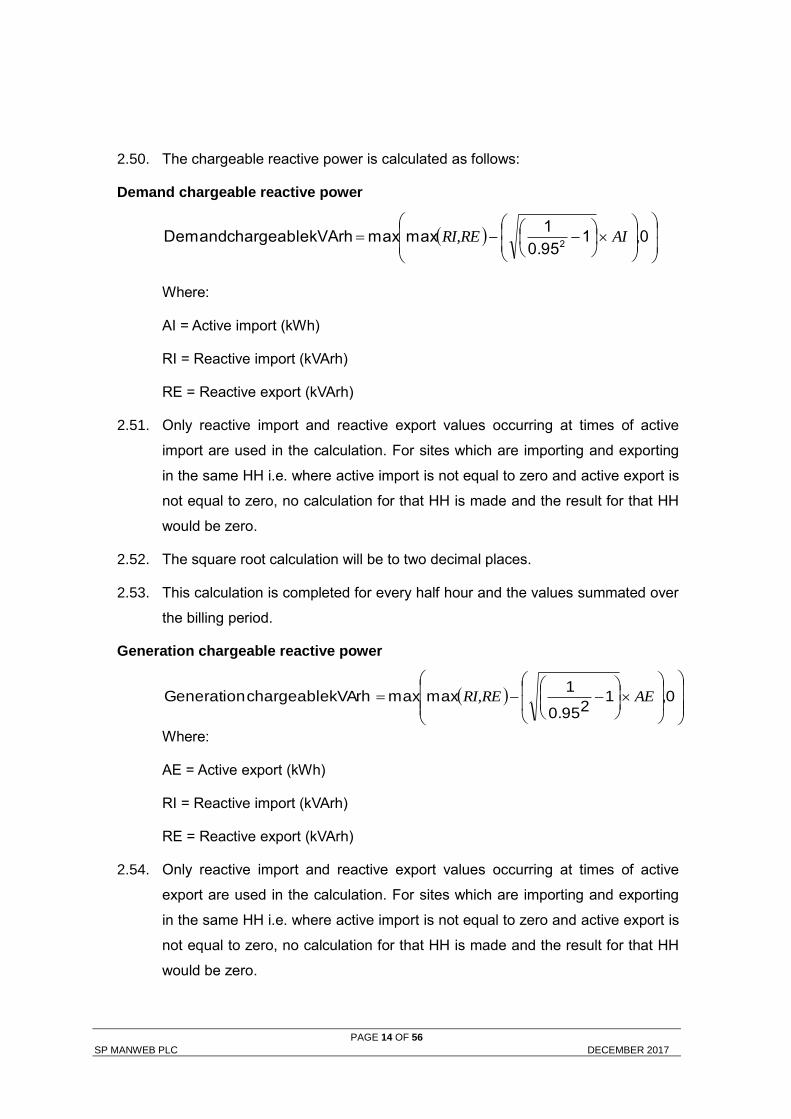
2.50. The chargeable reactive power is calculated as follows:
Demand chargeable reactive power
,01
0.95
1maxmax kVArh chargeable Demand
2AIRI,RE
Where:
AI = Active import (kWh)
RI = Reactive import (kVArh)
RE = Reactive export (kVArh)
2.51. Only reactive import and reactive export values occurring at times of active
import are used in the calculation. For sites which are importing and exporting
in the same HH i.e. where active import is not equal to zero and active export is
not equal to zero, no calculation for that HH is made and the result for that HH
would be zero.
2.52. The square root calculation will be to two decimal places.
2.53. This calculation is completed for every half hour and the values summated over
the billing period.
Generation chargeable reactive power
,01
20.95
1maxmax kVArh chargeable Generation AERI,RE
Where:
AE = Active export (kWh)
RI = Reactive import (kVArh)
RE = Reactive export (kVArh)
2.54. Only reactive import and reactive export values occurring at times of active
export are used in the calculation. For sites which are importing and exporting
in the same HH i.e. where active import is not equal to zero and active export is
not equal to zero, no calculation for that HH is made and the result for that HH
would be zero.
PAGE 15 OF 56 SP MANWEB PLC DECEMBER 2017
2.55. The square root calculation will be to two decimal places.
2.56. This calculation is completed for every half hour and the values summated over
the billing period.
Incorrectly allocated charges
2.57. It is our responsibility to apply the correct charges to each MPAN/MSID. The
allocation of charges is based on the voltage of connection, import/export
details including multiple MPANs, metering information and, for some tariffs, the
metering location. Where an MPAN/MSID is used for export purposes in
relation to an LV or HV Designated Property, the type of generation (Intermittent
or Non-Intermittent) also determines the allocation of charges.
2.58. We are responsible for deciding the voltage of connection. Generally, this is
determined by where the metering is located and where responsibility for the
electrical equipment transfers from us to the connected Customer.
2.59. The Supplier determines and provides us with the metering information and
data. This enables us to allocate charges where there is more than one charge
per voltage level. The metering information and data is likely to change over
time if, for example, a Supplier changes from a two rate meter to a single rate
meter. When we are notified this has happened we will change the allocation of
charges accordingly.
2.60. If it has been identified that a charge may have been incorrectly allocated due
to the metering information and/or data then a request for investigation should
be made to the Supplier.
2.61. Where it has been identified that a charge may have been incorrectly allocated
due to the voltage of connection, import/export details or metering location then
a request to investigate the applicable charges should be made to us. Requests
from persons other than the Customer or the current Supplier must be
accompanied by a Letter of Authority from the Customer; the current Supplier
must also acknowledge that they are aware a request has been made. Any
request must be supported by an explanation of why it is believed that the
current charge should be changed, along with supporting information including,
where appropriate, photographs of metering positions or system diagrams. Any
request to change the current charge that also includes a request for
backdating must include justification as to why it is considered appropriate to
backdate the change.
PAGE 16 OF 56 SP MANWEB PLC DECEMBER 2017
2.62. An administration charge (covering our reasonable costs) may be made if a
technical assessment or site visit is required, but we will not apply any charge
where we agree to the change request.
2.63. Where we agree that the current LLFC/charge should be changed, we will then
allocate the appropriate set of charges for the connection. Any adjustment will
be applied from the date of the request, back to either the date of the incorrect
allocation, or; up to the maximum period specified by the Limitation Act (1980)
in England and Wales, which covers a six year period from the date of request,
and the Prescription and Limitation (Scotland) Act 1973, which covers a five
year period from the date of request; whichever is the shorter.
2.64. Any credit or additional charge will be issued to the relevant Supplier(s)
effective during the period of the change.
2.65. Should we reject the request a justification will be provided to the requesting
party. We shall not unreasonably withhold or delay any decision on a request to
change the charges applied and would expect to confirm our position on the
request within three months of the date of request.
Generation charges for pre-2005 designated EHV properties
2.66. Designated EHV Properties that were connected to the Distribution System
under a pre-2005 connection charging policy are eligible for exemption from
UoS charges for generation unless one of the following criteria has been met:
25 years have passed since their first energisation/connection date (i.e.
Designated EHV Properties with Connection Agreements dated prior to 1st
April 2005, and for which 25 years has passed since their first
energisation/connection date will receive use of system charges for
generation from the next charging year following the expiry of their 25 years
exemption, (starting 1st April), or
the person responsible for the Designated EHV Property has provided
notice to us that they wish to opt in to UoS charges for generation.
If a notice to opt in has been provided there will be no further opportunity to opt
out.
2.67. Furthermore, if an exempt Customer makes an alteration to its export
requirement then the Customer may be eligible to be charged for the additional
capacity required or energy imported or exported. For example, where a
PAGE 17 OF 56 SP MANWEB PLC DECEMBER 2017
generator increases its export capacity the incremental increase in export
capacity will attract UoS charges as with other non-exempt generators.
Provision of billing data
2.68. Where HH metering data is required for UoS charging and this is not provided
in accordance with the BSC or DCUSA, such metering data shall be provided to
us by the User of the system in respect of each calendar month within five
working days of the end of that calendar month.
2.69. The metering data shall identify the amount of energy conveyed across the
Metering System in each half hour of each day and shall separately identify
active and reactive import and export. Metering data provided to us shall be
consistent with that received through the metering equipment installed.
2.70. Metering data shall be provided in an electronic format specified by us from
time to time and, in the absence of such specification, metering data shall be
provided in a comma-separated text file in the format of Master Registration
Agreement (MRA) data flow D00368 (as agreed with us). The data shall be
emailed to [email protected] .
2.71. We require details of reactive power imported or exported to be provided for all
Measurement Class C and E sites. It is also required for CVA sites and Exempt
Distribution Network boundaries with difference metering. We reserve the right
to levy a charge on Users who fail to provide such reactive data. In order to
estimate missing reactive data, a power factor of 0.95 lag will be applied to the
active consumption in any half hour.
Out of area use of system charges
2.72. We do not operate networks outside our Distribution Services Area
Licensed distribution network operator charges
2.73. Licensed Distribution Network Operator (LDNO) charges are applied to LDNOs
who operate Embedded Networks within our Distribution Services Area.
2.74. The charge structure for LV and HV Designated Properties embedded in
networks operated by LDNOs will mirror the structure of the ‘All-the-way’ charge
and is dependent upon the voltage of connection of each embedded network to
the host DNO’s network. The relevant charge structures are set out in Annex 4.
8 MRA Data Transfer Catalogue available from https://dtc.mrasco.com/
PAGE 18 OF 56 SP MANWEB PLC DECEMBER 2017
2.75. Where a NHH metered MPAN has an invalid Settlement combination, the
‘LDNO LV: Domestic Unrestricted’ fixed and unit charges will be applied as
default until the invalid combination is corrected. Where there are multiple
SSC/TPR combinations, the default ‘LDNO LV: Domestic Unrestricted’ fixed and
unit charges will be applied for each invalid SSC/TPR combination.
2.76. The charge structure for Designated EHV Properties embedded in networks
operated by LDNOs will be calculated individually using the EDCM. The
relevant charge structures are set out in Annex 2.
2.77. For Nested Networks the relevant charging principles set out in DCUSA
Schedule 21 will apply.
Licence exempt distribution networks
2.78. The Electricity and Gas (Internal Market) Regulations 20119 introduced new
obligations on owners of licence exempt distribution networks (sometimes
called private networks) including a duty to facilitate access to electricity and
gas suppliers for Customers within those networks.
2.79. When Customers (both domestic and commercial) are located within a licence
exempt distribution network and require the ability to choose their own Supplier
this is called ‘third party access’. These embedded Customers will require an
MPAN so that they can have their electricity supplied by a Supplier of their
choice.
2.80. Licence exempt distribution networks owners can provide third party access
using either full settlement metering or the difference metering approach.
Full settlement metering
2.81. This is where a licence exempt distribution network is set up so that each
embedded installation has an MPAN and Metering System and therefore all
Customers purchase electricity from their chosen Supplier. In this case there
are no Settlement Metering Systems at the boundary between the licensed
Distribution System and the licence exempt distribution network.
2.82. In this approach our UoS charges will be applied to each MPAN.
9 The Electricity and Gas (Internal Market) Regulations 2011 available from
http://www.legislation.gov.uk/uksi/2011/2704/contents/made
PAGE 19 OF 56 SP MANWEB PLC DECEMBER 2017
Difference metering
2.83. This is where one or more, but not all, Customers on a licence exempt
distribution network choose their own Supplier for electricity supply to their
premises. Under this approach, the Customers requiring third party access on
the licence exempt distribution network will have their own MPAN and must
have a HH Metering System.
PAGE 20 OF 56 SP MANWEB PLC DECEMBER 2017
Gross settlement
2.84. Where one of our MPANs (prefix) is embedded within a licence exempt
distribution network connected to our Distribution System, and difference
metering is in place for Settlement purposes and we receive gross
measurement data for the boundary MPAN, we will continue to charge the
boundary MPAN Supplier for use of our Distribution System. No charges will be
levied by us directly to the Customer or Supplier of the embedded MPAN(s)
connected within the licence exempt distribution network.
2.85. We require that gross metered data for the boundary of the connection is
provided to us. Until a new industry data flow is introduced for the sending of
such gross data, gross metered data shall:
be provided in a text file in the format of the D0036 or D0275 MRA data
flow;
the text file shall be emailed to [email protected];
the title of the email should also contain the phrase “gross data for
difference metered private network” and contain the metering reference
specified by us in place of the Settlement MPAN; and
the text filename shall be formed of the metering reference specified by us
followed by a hyphen and followed by a timestamp in the format
YYYYMMDDHHMMSS and followed by “.txt”.
2.86. For the avoidance of doubt, the reduced difference metered measurement data
for the boundary connection that is to enter Settlement should continue to be
sent using the Settlement MPAN.
PAGE 21 OF 56 SP MANWEB PLC DECEMBER 2017
3. Schedule of charges for use of the distribution system
3.1. Tables listing the charges for use of our Distribution System are published in
annexes to this document.
3.2. These charges are also listed in a spreadsheet which is published with this
statement and can be downloaded from
https://www.scottishpower.com/pages/connections_use_of_system_and_meter
ing_services.aspx.
3.3. Annex 1 contains the charges applied to LV and HV Designated Properties.
3.4. Annex 2 contains the charges applied to our Designated EHV Properties and
charges applied to LDNOs for Designated EHV Properties connected within
their embedded Distribution System.
3.5. Annex 3 contains details of any preserved and additional charges that are valid
at this time. Preserved charges are mapped to an appropriate charge and are
closed to new Customers.
3.6. Annex 4 contains the charges applied to LDNOs in respect of LV and HV
Designated Properties connected in their embedded Distribution System.
3.7. Annex 4 contains the charges applied to LV and HV Designated Properties that
are embedded in an Exempt Distribution Network where Net Settlement of
metered data is applied.
PAGE 22 OF 56 SP MANWEB PLC DECEMBER 2017
4. Schedule of line loss factors
Role of line loss factors in the supply of electricity
4.1. Electricity entering or exiting our Distribution System is adjusted to take account
of energy that is lost10 as it is distributed through the network. This adjustment
does not affect distribution charges but is used in energy settlement to take
metered consumption to a notional Grid Supply Point so that Suppliers’
purchases take account of the energy lost on the Distribution System.
4.2. We are responsible for calculating the Line Loss Factors11 (LLFs) and providing
these to Elexon. Elexon is the company that manages the BSC.
4.3. LLFs are used to adjust the Metering System volumes to take account of losses
on the Distribution System.
Calculation of line loss factors
4.4. LLFs are calculated in accordance with BSC procedure 128. BSCP128 sets out
the procedure and principles with which our LLF methodology must comply. It
also defines the procedure and timetable by which LLFs are reviewed and
submitted.
4.5. LLFs are calculated for a set number of time periods during the year using
either a generic or site-specific method. The generic method is used for sites
connected at LV or HV and the site-specific method is used for sites connected
at EHV or where a request for site-specific LLFs has been agreed. Generic
LLFs will be applied as a default to all new EHV sites until sufficient data is
available for a site-specific calculation.
4.6. The definition of EHV used for LLF purposes differs from the definition used for
defining Designated EHV Properties in the EDCM. The definition used for LLF
purposes can be found in our LLF methodology.
4.7. The Elexon website12 contains more information on LLFs.
10
Energy can be lost for technical and non-technical reasons and losses normally occur by heat dissipation through power
flowing in conductors and transformers. Losses can also reduce if a customer’s action reduces power flowing in the
distribution network. This might happen when a customer generates electricity and the produced energy is consumed
locally. 11
Also referred to as Loss Adjustment Factors. 12
The following page has links to BSCP128 and to our LLF methodology: http://www.elexon.co.uk/reference/technical-
operations/losses/
PAGE 23 OF 56 SP MANWEB PLC DECEMBER 2017
Publication of line loss factors
4.8. The LLFs used in Settlement are published on the Elexon Portal13. The website
contains the LLFs in standard industry data formats and in a summary form. A
user guide with details on registering and using the portal is also available.
4.9. BSCP128 sets out the timetable by which LLFs are submitted and audited. The
submission and audit occurs between September and December in the year
prior to the LLFs becoming effective. Only after the completion of the audit at
the end of December and BSC approval are the final LLFs published.
4.10. At the time that this charging statement is first published, Annex 5 will be
intentionally left blank, as this statement is published a complete year before
the LLFs have been calculated and audited. Once the final BSCP128 Audit
Report has been received, we will issue an updated version of Annex 5
containing the audited LLF values.
4.11. When using the tables in Annex 5, reference should be made to the LLFC
allocated to the MPAN to find the appropriate values.
13
The Elexon Portal can be accessed from www.elexonportal.co.uk
PAGE 24 OF 56 SP MANWEB PLC DECEMBER 2017
5. Notes for Designated EHV Properties
EDCM network group costs
5.1. A table is provided in the accompanying spreadsheet which shows the
underlying Forward Cost Pricing (FCP) network group costs used to calculate
the current EDCM charges. This spreadsheet. “SPM – Schedule of Charges
and Other Tables.xlsx” is available to download from our website.
5.2. These are illustrative of the modelled costs at the time that this statement was
published. A new connection will result in changes to current network
utilisations, which will then form the basis of future prices. The charge
determined in this statement will not necessarily be the charge in subsequent
years because of the interaction between new and existing network
connections and any other changes made to our Distribution System which may
affect charges.
Charges for new Designated EHV Properties
5.3. Charges for any new Designated EHV Properties calculated after publication of
the current statement will be published on our website in an addendum to that
statement as and when necessary. The addendum will include charge
information of the type found in Annex 2, and LLFs as found in Annex 5.
5.4. The form of the addendum is detailed in Annex 6 to this statement.
5.5. The addendum will also be sent to all relevant DCUSA parties (i.e. the
registered Supplier) and where requested the Customer.
5.6. The new Designated EHV Properties’ charges will be added to Annex 2 in the
next full statement released.
Charges for amended Designated EHV Properties
5.7. Where an existing Designated EHV Property is modified and energised in the
charging year, we may revise the EDCM charges for the modified Designated
EHV Property. If revised charges are appropriate, an addendum will be sent to
all relevant parties and published as a revised ‘Schedule of Charges and other
tables' spreadsheet on our website. The modified Designated EHV Property
charges will be added to Annex 2 in the next full statement released.
Demand-side management
5.8. New or existing Designated EHV Property Customers may wish to offer part of
their MIC to be interruptible by us (for active network management purposes
PAGE 25 OF 56 SP MANWEB PLC DECEMBER 2017
other than normal planned or unplanned outages) in order to benefit from any
reduced UoS charges calculated using the EDCM.
5.9. Several options exist in which we may agree for some or the entire MIC to be
interruptible. Under the EDCM the applicable demand capacity costs would be
based on the MIC minus the capacity subject to interruption.
5.10. If you are interested in making part or all of your MIC interruptible as an integral
irrevocable feature of a new connection or modification to an existing
connection you should in the first instance contact our connections function;
By email: [email protected]
By address:
Scottish Power Manweb
SP Energy Networks SP Energy Networks
Network Connections Network Connections
320 St Vincent Street PO BOX 290
Glasgow Lister Drive
G2 5AD Liverpool
L13 7HJ
Tel: 0845 270 0785 Tel: 0845 270 0783
PAGE 26 OF 56 SP MANWEB PLC DECEMBER 2017
6. Electricity distribution rebates
6.1. We have neither given nor announced any DUoS rebates to Users in the 12
months preceding the date of publication of this version of the statement.
7. Accounting and administration services
7.1. We reserve the right to impose payment default remedies. The remedies are as
set out in DCUSA where applicable or else as detailed in the following
paragraph.
7.2. If any invoices that are not subject to a valid dispute remain unpaid on the due
date, late payment interest (calculated at base rate plus 8%) and administration
charges may be imposed.
7.3. Our administration charges are detailed in the following table. These charges
are set at a level which is in line with the Late Payment of Commercial Debts
Act;
Size of Unpaid Debt Late Payment Fee
Up to £999.99 £40.00
£1,000 to £9,999.99 £70.00
£10,000 or more £100.00
8. Charges for electrical plant provided ancillary to the grant of use of
system
8.1. None
PAGE 27 OF 56 SP MANWEB PLC DECEMBER 2017
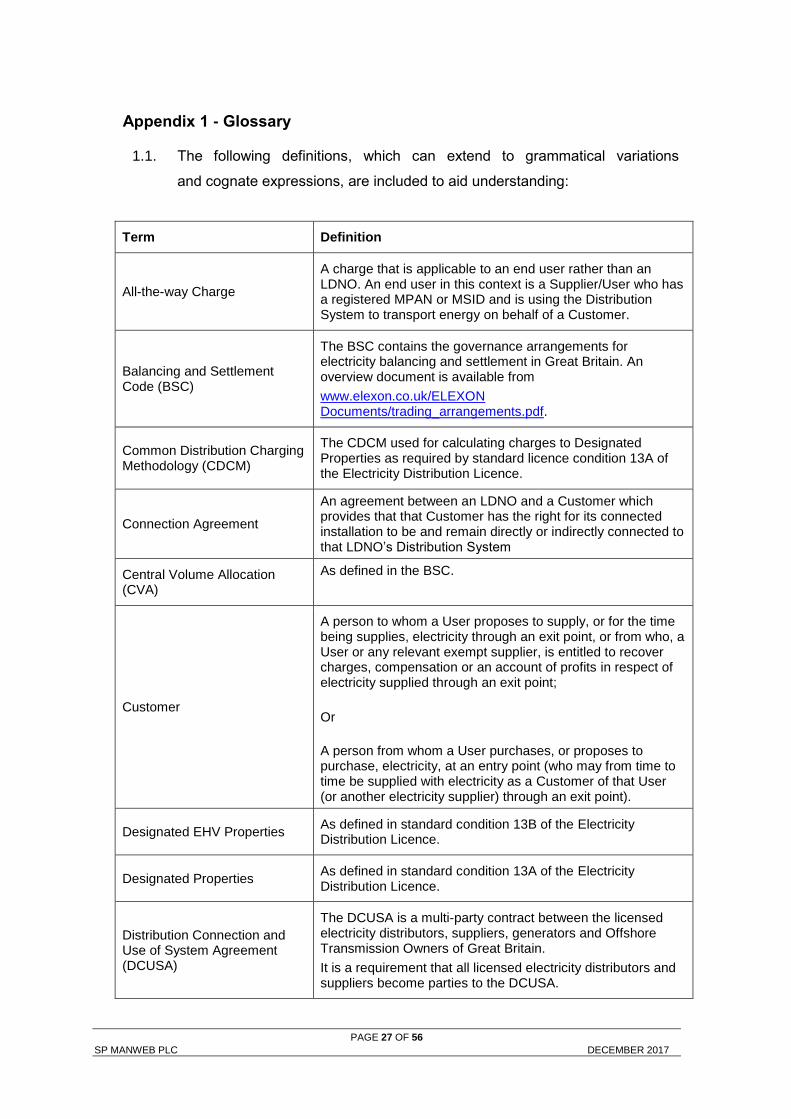
Appendix 1 - Glossary
1.1. The following definitions, which can extend to grammatical variations
and cognate expressions, are included to aid understanding:
Term Definition
All-the-way Charge
A charge that is applicable to an end user rather than an LDNO. An end user in this context is a Supplier/User who has a registered MPAN or MSID and is using the Distribution System to transport energy on behalf of a Customer.
Balancing and Settlement Code (BSC)
The BSC contains the governance arrangements for electricity balancing and settlement in Great Britain. An overview document is available from
www.elexon.co.uk/ELEXON Documents/trading_arrangements.pdf.
Common Distribution Charging Methodology (CDCM)
The CDCM used for calculating charges to Designated Properties as required by standard licence condition 13A of the Electricity Distribution Licence.
Connection Agreement
An agreement between an LDNO and a Customer which provides that that Customer has the right for its connected installation to be and remain directly or indirectly connected to that LDNO’s Distribution System
Central Volume Allocation (CVA)
As defined in the BSC.
Customer
A person to whom a User proposes to supply, or for the time being supplies, electricity through an exit point, or from who, a User or any relevant exempt supplier, is entitled to recover charges, compensation or an account of profits in respect of electricity supplied through an exit point;
Or
A person from whom a User purchases, or proposes to purchase, electricity, at an entry point (who may from time to time be supplied with electricity as a Customer of that User (or another electricity supplier) through an exit point).
Designated EHV Properties As defined in standard condition 13B of the Electricity Distribution Licence.
Designated Properties As defined in standard condition 13A of the Electricity Distribution Licence.
Distribution Connection and Use of System Agreement (DCUSA)
The DCUSA is a multi-party contract between the licensed electricity distributors, suppliers, generators and Offshore Transmission Owners of Great Britain.
It is a requirement that all licensed electricity distributors and suppliers become parties to the DCUSA.

PAGE 28 OF 56 SP MANWEB PLC DECEMBER 2017
Term Definition
Distributor IDs
These are unique IDs that can be used, with reference to the MPAN, to identify your LDNO. The charges for other network operators can be found on their website.
ID Distribution Service Area Company
10 East of England UK Power Networks
11 East Midlands Western Power Distribution
12 London UK Power Networks
13 Merseyside and North Wales
Scottish Power
14 Midlands Western Power Distribution
15 Northern Northern Powergrid
16 North Western Electricity North West
17 Scottish Hydro Electric (and embedded networks in other areas)
Scottish Hydro Electric Power Distribution plc
18 South Scotland Scottish Power
19 South East England UK Power Networks
20 Southern Electric (and embedded networks in other areas)
Southern Electric Power Distribution plc
21 South Wales Western Power Distribution
22 South Western Western Power Distribution
23 Yorkshire Northern Powergrid
24 All Independent Power Networks
25 All ESP Electricity
26 All Energetics Electricity Ltd
27 All The Electricity Network Company Ltd
29 All Harlaxton Energy Networks
30 All Peel Electricity Networks Ltd
31 All UK Power Distribution Ltd
Distribution Network Operator (DNO)
An electricity distributor that operates one of the 14 distribution services areas and in whose Electricity Distribution Licence the requirements of Section B of the standard conditions of that licence have effect.
PAGE 29 OF 56 SP MANWEB PLC DECEMBER 2017
Term Definition
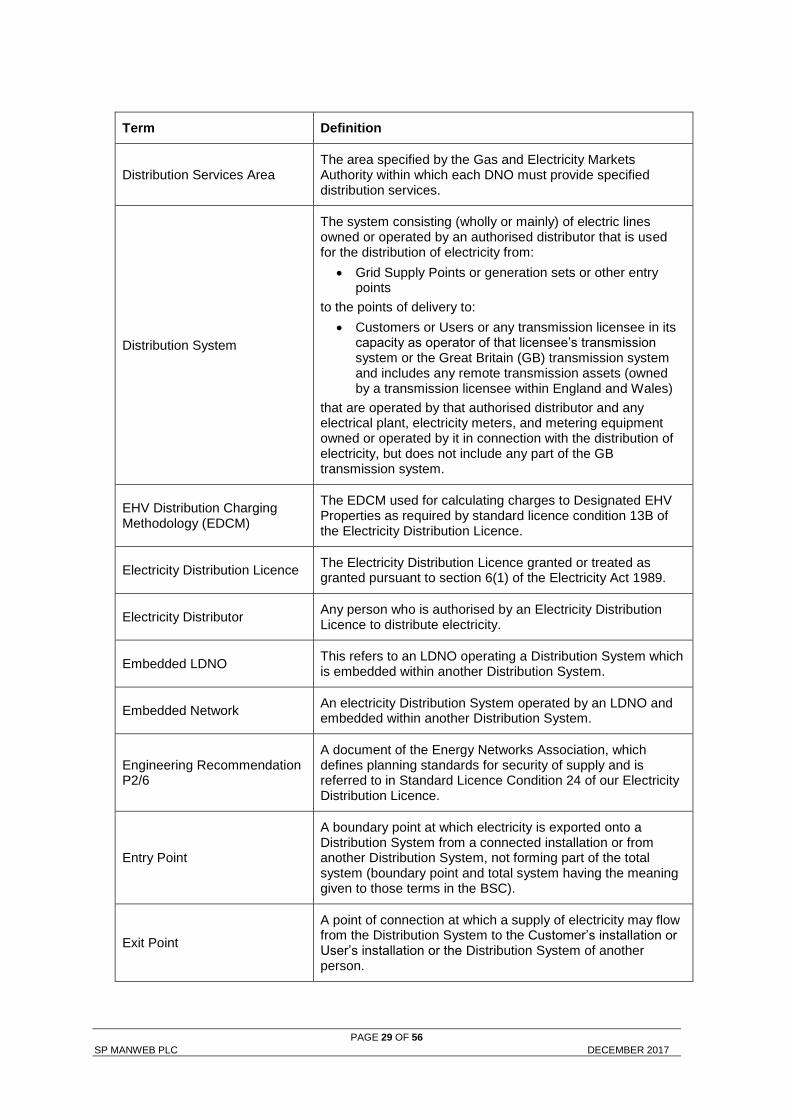
Distribution Services Area The area specified by the Gas and Electricity Markets Authority within which each DNO must provide specified distribution services.
Distribution System
The system consisting (wholly or mainly) of electric lines owned or operated by an authorised distributor that is used for the distribution of electricity from:
Grid Supply Points or generation sets or other entry points
to the points of delivery to:
Customers or Users or any transmission licensee in its capacity as operator of that licensee’s transmission system or the Great Britain (GB) transmission system and includes any remote transmission assets (owned by a transmission licensee within England and Wales)
that are operated by that authorised distributor and any electrical plant, electricity meters, and metering equipment owned or operated by it in connection with the distribution of electricity, but does not include any part of the GB transmission system.
EHV Distribution Charging Methodology (EDCM)
The EDCM used for calculating charges to Designated EHV Properties as required by standard licence condition 13B of the Electricity Distribution Licence.
Electricity Distribution Licence The Electricity Distribution Licence granted or treated as granted pursuant to section 6(1) of the Electricity Act 1989.
Electricity Distributor Any person who is authorised by an Electricity Distribution Licence to distribute electricity.
Embedded LDNO This refers to an LDNO operating a Distribution System which is embedded within another Distribution System.
Embedded Network An electricity Distribution System operated by an LDNO and embedded within another Distribution System.
Engineering Recommendation P2/6
A document of the Energy Networks Association, which defines planning standards for security of supply and is referred to in Standard Licence Condition 24 of our Electricity Distribution Licence.
Entry Point
A boundary point at which electricity is exported onto a Distribution System from a connected installation or from another Distribution System, not forming part of the total system (boundary point and total system having the meaning given to those terms in the BSC).
Exit Point
A point of connection at which a supply of electricity may flow from the Distribution System to the Customer’s installation or User’s installation or the Distribution System of another person.

PAGE 30 OF 56 SP MANWEB PLC DECEMBER 2017
Term Definition
Extra High Voltage (EHV) Nominal voltages of 22kV and above.
Gas and Electricity Markets Authority (GEMA)
As established by the Utilities Act 2000.
Grid Supply Point (GSP) A metered connection between the National Grid Electricity Transmission system and the licensee’s distribution system at which electricity flows to or from the Distribution System.
GSP group A distinct electrical system that is supplied from one or more GSPs for which total supply into the GSP group can be determined for each half hour.
High Voltage (HV) Nominal voltages of at least 1kV and less than 22kV.
Intermittent Generation
Defined in DCUSA Schedule 16 as a generation plant where the energy source of the prime mover cannot be made available on demand, in accordance to the definitions in Engineering Recommendation P2/6.
Invalid Settlement Combination
A Settlement combination that is not recognised as a valid combination in market domain data - see https://www.elexonportal.co.uk/MDDVIEWER.
kVA Kilovolt ampere.
kVArh Kilovolt ampere reactive hour.
kW Kilowatt.
kWh Kilowatt hour (equivalent to one “unit” of electricity).
Licensed Distribution Network Operator (LDNO)
The holder of a licence in respect of electricity distribution activities in Great Britain.
Line Loss Factor (LLF) The factor that is used in Settlement to adjust the metering system volumes to take account of losses on the distribution system.
Line Loss Factor Class (LLFC) An identifier assigned to an SVA metering system which is used to assign the LLF and use of system charges.
Load Factor =𝑎𝑛𝑛𝑢𝑎𝑙 𝑐𝑜𝑛𝑠𝑢𝑚𝑝𝑡𝑖𝑜𝑛 (𝑘𝑊ℎ)
𝑚𝑎𝑥𝑖𝑚𝑢𝑚 𝑑𝑒𝑚𝑎𝑛𝑑 (𝑘𝑊) × ℎ𝑜𝑢𝑟𝑠 𝑖𝑛 𝑦𝑒𝑎𝑟
Low Voltage (LV) Nominal voltages below 1kV.
Market Domain Data (MDD) MDD is a central repository of reference data available to all Users involved in Settlement. It is essential to the operation of SVA trading arrangements.
PAGE 31 OF 56 SP MANWEB PLC DECEMBER 2017
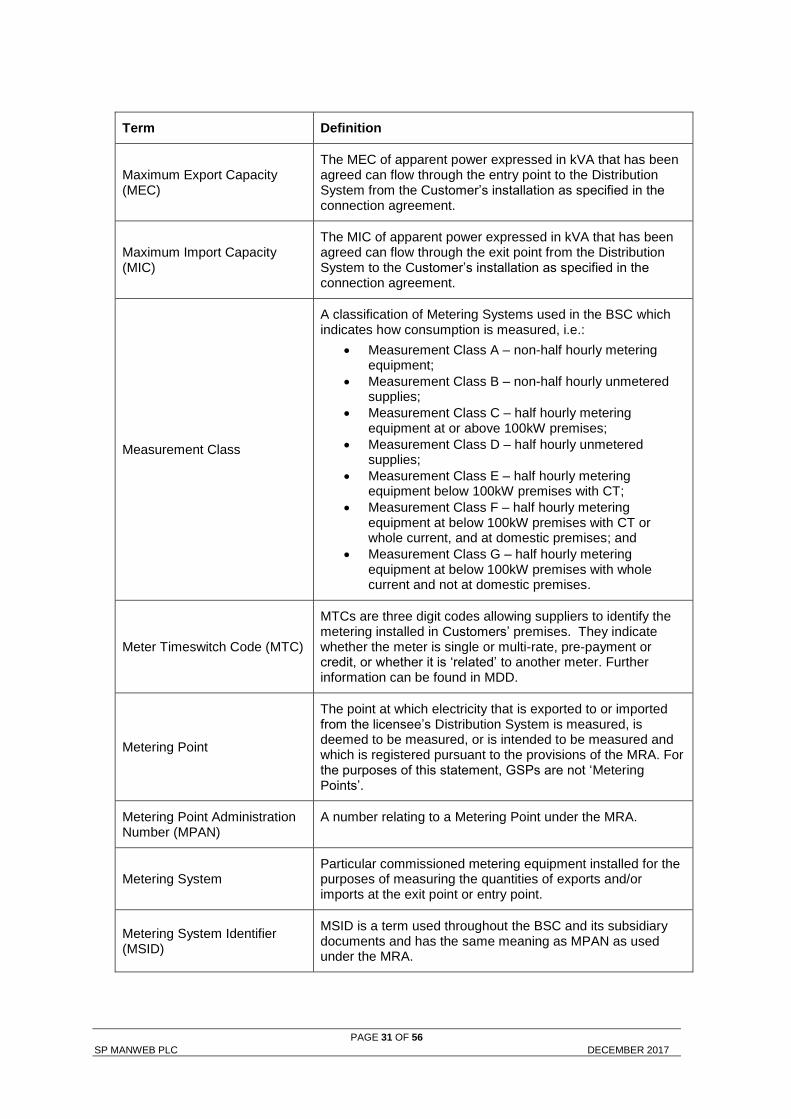
Term Definition
Maximum Export Capacity (MEC)
The MEC of apparent power expressed in kVA that has been agreed can flow through the entry point to the Distribution System from the Customer’s installation as specified in the connection agreement.
Maximum Import Capacity (MIC)
The MIC of apparent power expressed in kVA that has been agreed can flow through the exit point from the Distribution System to the Customer’s installation as specified in the connection agreement.
Measurement Class
A classification of Metering Systems used in the BSC which indicates how consumption is measured, i.e.:
Measurement Class A – non-half hourly metering equipment;
Measurement Class B – non-half hourly unmetered supplies;
Measurement Class C – half hourly metering equipment at or above 100kW premises;
Measurement Class D – half hourly unmetered supplies;
Measurement Class E – half hourly metering equipment below 100kW premises with CT;
Measurement Class F – half hourly metering equipment at below 100kW premises with CT or whole current, and at domestic premises; and
Measurement Class G – half hourly metering equipment at below 100kW premises with whole current and not at domestic premises.
Meter Timeswitch Code (MTC)
MTCs are three digit codes allowing suppliers to identify the metering installed in Customers’ premises. They indicate whether the meter is single or multi-rate, pre-payment or credit, or whether it is ‘related’ to another meter. Further information can be found in MDD.
Metering Point
The point at which electricity that is exported to or imported from the licensee’s Distribution System is measured, is deemed to be measured, or is intended to be measured and which is registered pursuant to the provisions of the MRA. For the purposes of this statement, GSPs are not ‘Metering Points’.
Metering Point Administration Number (MPAN)
A number relating to a Metering Point under the MRA.
Metering System Particular commissioned metering equipment installed for the purposes of measuring the quantities of exports and/or imports at the exit point or entry point.
Metering System Identifier (MSID)
MSID is a term used throughout the BSC and its subsidiary documents and has the same meaning as MPAN as used under the MRA.

PAGE 32 OF 56 SP MANWEB PLC DECEMBER 2017
Term Definition
Master Registration Agreement (MRA)
The Master Registration Agreement (MRA) provides a governance mechanism to manage the processes established between electricity suppliers and distribution companies to enable electricity suppliers to transfer customers. It includes terms for the provision of Metering Point Administration Services (MPAS) Registrations.
Nested Networks
This refers to a situation where there is more than one level of Embedded Network and therefore nested Distribution Systems between LDNOs (e.g. host DNOprimary nested DNO secondary nested DNOcustomer).
Non-Intermittent Generation
Defined in DCUSA Schedule 16 as a generation plant where the energy source of the prime mover can be made available on demand, in accordance to the definitions in Engineering Recommendation P2/6.
Ofgem Office of Gas and Electricity Markets – Ofgem is governed by GEMA and is responsible for the regulation of the distribution companies.
Profile Class (PC) A categorisation applied to NHH MPANs and used in settlement to group customers with similar consumption patterns to enable the calculation of consumption profiles.
Settlement The determination and settlement of amounts payable in respect of charges (including reconciling charges) in accordance with the BSC.
Settlement Class (SC) The combination of Profile Class, Line Loss Factor Class, Time Pattern Regime and Standard Settlement Configuration, by Supplier within a GSP group and used for Settlement.
Standard Settlement Configuration (SSC)
A standard metering configuration relating to a specific combination of Time Pattern Regimes.
Supercustomer
The method of billing Users for use of system on an aggregated basis, grouping together consumption and standing charges for all similar NHH metered Customers or aggregated HH metered Customers.
Supercustomer DUoS Report A report of profiled data by Settlement Class providing counts of MPANs and units consumed.
Supplier An organisation with a supply licence responsible for electricity supplied to and/or exported from a metering point.
Supplier Volume Allocation (SVA)
As defined in the BSC.
Time Pattern Regime (TPR) The pattern of switching behaviour through time that one or more meter registers follow.
PAGE 33 OF 56 SP MANWEB PLC DECEMBER 2017
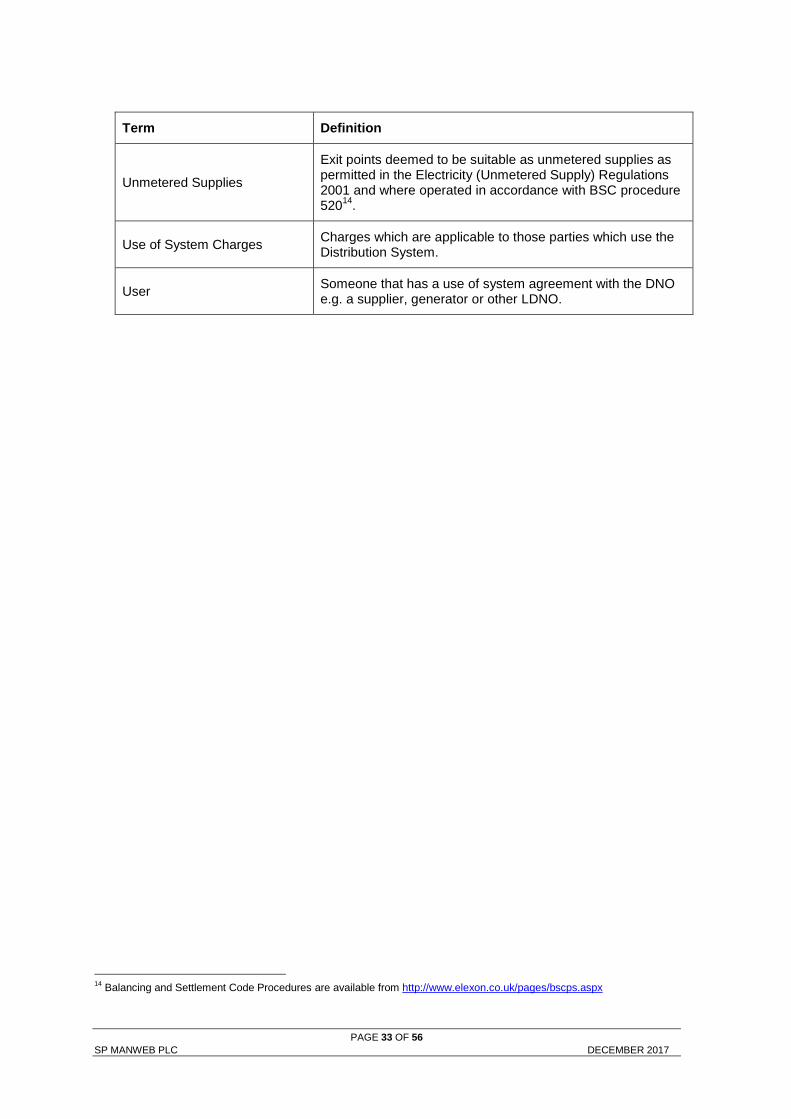
Term Definition
Unmetered Supplies
Exit points deemed to be suitable as unmetered supplies as permitted in the Electricity (Unmetered Supply) Regulations 2001 and where operated in accordance with BSC procedure 520
14.
Use of System Charges Charges which are applicable to those parties which use the Distribution System.
User Someone that has a use of system agreement with the DNO e.g. a supplier, generator or other LDNO.
14
Balancing and Settlement Code Procedures are available from http://www.elexon.co.uk/pages/bscps.aspx
PAGE 34 OF 56 SP MANWEB PLC DECEMBER 2017
Appendix 2 - Guidance notes15
Background
1.1. The electricity bill from your Supplier contains an element of charge to cover
electricity distribution costs. This distribution charge covers the cost of
operating and maintaining a safe and reliable Distribution System that forms the
‘wires’ that transport electricity between the national transmission system and
end users such as homes and businesses. Our Distribution System includes
overhead lines, underground cables, as well as substations and transformers.
1.2. In most cases, your Supplier is invoiced for the distribution charge and this is
normally part of your total bill. In some cases, for example business users, the
Supplier may pass through the distribution charge as an identifiable line item on
the electricity bill.
1.3. Where electricity is generated at a premises your Supplier may receive a credit
for energy that is exported on to the Distribution System. These credits are
intended to reflect that the exported generation may reduce the need for
traditional demand led reinforcement of the Distribution System.
1.4. Understanding your distribution charges could help you reduce your costs and
increase your credits. This is achieved by understanding the components of the
charge to help you identify whether there may be opportunities to change the
way you use the Distribution System.
Meter point administration
1.5. We are responsible for managing the electricity supply points that are
connected to our Distribution System. Typically, every supply point is identified
by a Meter Point Administration Number (MPAN). A few supply points may have
more than one MPAN depending on the metering configuration (e.g. a school
which may have an MPAN for the main supply and an MPAN for catering).
1.6. The full MPAN is a 21 digit number, preceded by an ‘S’ and includes
supplementary data. The MPAN applicable to a supply point is found on the
electricity bill from your Supplier. This number enables you to establish who
your electricity distributor is, details of the characteristics of the supply and
importantly the distribution charges that are applicable to your premises.
15
These guidance notes are provided for additional information and do not form part of the application of charges.
PAGE 35 OF 56 SP MANWEB PLC DECEMBER 2017
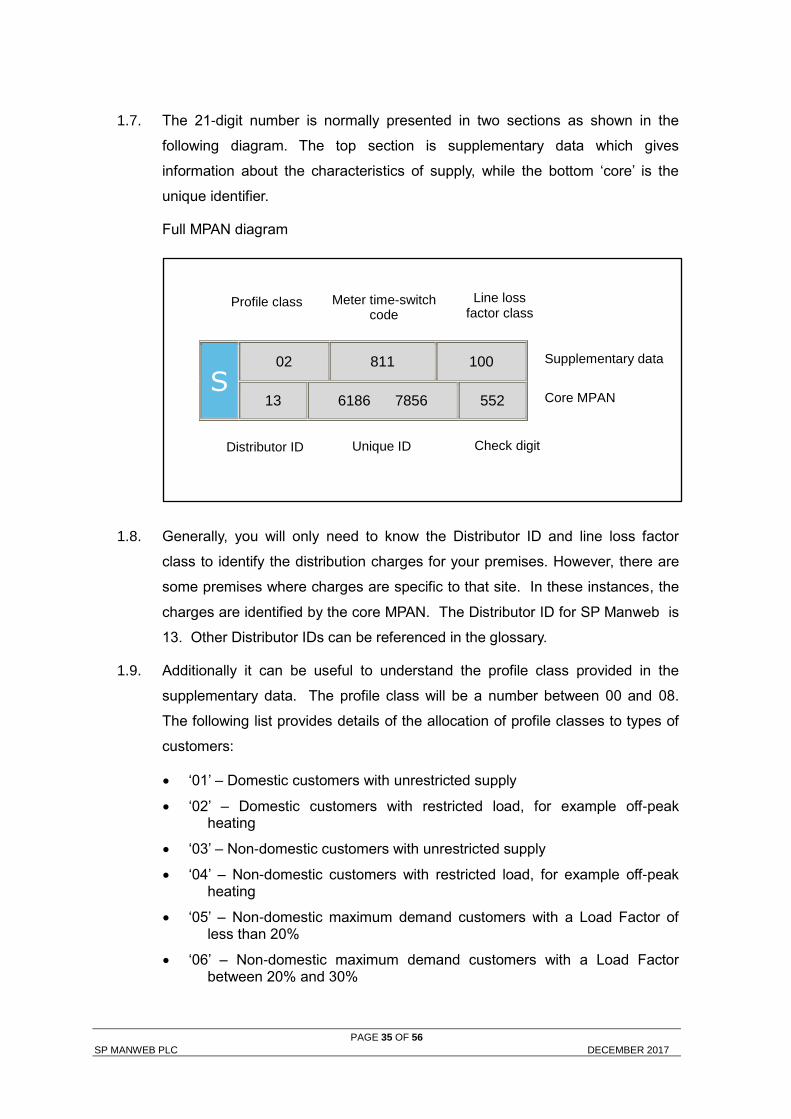
1.7. The 21-digit number is normally presented in two sections as shown in the
following diagram. The top section is supplementary data which gives
information about the characteristics of supply, while the bottom ‘core’ is the
unique identifier.
Full MPAN diagram
1.8. Generally, you will only need to know the Distributor ID and line loss factor
class to identify the distribution charges for your premises. However, there are
some premises where charges are specific to that site. In these instances, the
charges are identified by the core MPAN. The Distributor ID for SP Manweb is
13. Other Distributor IDs can be referenced in the glossary.
1.9. Additionally it can be useful to understand the profile class provided in the
supplementary data. The profile class will be a number between 00 and 08.
The following list provides details of the allocation of profile classes to types of
customers:
‘01’ – Domestic customers with unrestricted supply
‘02’ – Domestic customers with restricted load, for example off-peak heating
‘03’ – Non-domestic customers with unrestricted supply
‘04’ – Non-domestic customers with restricted load, for example off-peak heating
‘05’ – Non-domestic maximum demand customers with a Load Factor of less than 20%
‘06’ – Non-domestic maximum demand customers with a Load Factor between 20% and 30%
S
02 811 100
13 6186 7856 552
Profile class Meter time-switch code
Line loss factor class
Distributor ID Unique ID Check digit
Supplementary data
Core MPAN
PAGE 36 OF 56 SP MANWEB PLC DECEMBER 2017
‘07’ – Non-domestic maximum demand customers with a Load Factor between 30% and 40%
‘08’ – Non-domestic maximum demand customers with a Load Factor over 40% or non-half hourly metered generation customers
‘00’ – Half-hourly metered demand and generation customers
1.10. Unmetered Supplies will be allocated to profile class 01, 08 or 00 depending on
the type of load or the measurement method of the load.
1.11. The allocation of the profile class will affect your charges. If you feel that you
have been allocated the wrong profile class, please contact your Supplier as
they are responsible for this.
Your charges
1.12. All distribution charges that relate to our Distributor ID 13 are provided in this
statement.
1.13. You can identify your charges by referencing your line loss factor class, from
Annex 1. If the MPAN is for a Designated EHV Property, then the charges will
be found in Annex 2. In a few instances, the charges may be contained in
Annex 3 or Annex 6. When identifying charges in Annex 2, please note that
some line loss factor classes have more than one charge. In this instance you
will need to select the correct charge by cross referencing with the core MPAN
provided in the table.
1.14. Once you have identified which charge structure applies to your MPAN then
you will be able to calculate an estimate of your distribution charge using the
calculator provided in the spreadsheet ‘Schedule of charges and other tables’
found in the sheet called ‘Charge Calculator’. This spreadsheet can be
downloaded from
https://www.scottishpower.com/pages/connections_use_of_system_and_meteri
ng_services.aspx .
Reducing your charges
1.15. The most effective way to reduce your energy charges is to reduce your
consumption by switching off or using more energy efficient appliances.
However, there are also other potential opportunities to reduce your distribution
charges; for example, it may be beneficial to shift demand or generation to a
better time period. Demand use is likely to be cheaper outside peak periods
PAGE 37 OF 56 SP MANWEB PLC DECEMBER 2017
and generation credits more beneficial, although the ability to directly benefit
will be linked to the structure of your supply charges.
1.16. The calculator mentioned above provides the opportunity to establish a forecast
of the change in distribution charges that could be achieved if you are able to
change any of the consumption related inputs.
Reactive power and reactive power charges
1.17. Reactive power is a separately charged component of connections that are half
hourly metered. Reactive power charges are generally avoidable if ‘best
practice’ design of the properties’ electrical installation has been provided in
order to maintain a power factor between 0.95 and unity at the Metering Point.
1.18. Reactive Power (kVArh) is the difference between working power (active power
measured in kW) and total power consumed (apparent power measured in
kVA). Essentially it is a measure of how efficiently electrical power is
transported through an electrical installation or a Distribution System.
1.19. Power flowing with a power factor of unity results in the most efficient loading of
the Distribution System. Power flowing with a power factor of less than 0.95
results in much higher losses in the Distribution System, a need to potentially
provide higher capacity electrical equipment and consequently a higher bill for
you the consumer. A comparatively small improvement in power factor can
bring about a significant reduction in losses since losses are proportional to the
square of the current.
1.20. Different types of electrical equipment require some ‘reactive power’ in addition
to ‘active power’ in order to work effectively. Electric motors, transformers and
fluorescent lighting, for example, may produce poor power factors due to the
nature of their inductive load. However, if good design practice is applied then
the poor power factor of appliances can be corrected as near as possible to
source. Alternatively, poor power factor can be corrected centrally near to the
meter.
1.21. There are many advantages that can be achieved by correcting poor power
factor. These include: reduced energy bills through lower reactive charges,
lower capacity charges and reduced power consumption and reduced voltage
drop in long cable runs.
PAGE 38 OF 56 SP MANWEB PLC DECEMBER 2017
Site-specific EDCM charges
1.22. A site classified as a Designated EHV Property is subject to a locational-based
charging methodology (referred to as EDCM) for higher voltage network users.
Distributors use one of two approved approaches: Long Run Incremental Cost
(LRIC) or Forward Cost Pricing (FCP); we use the FCP. The EDCM will apply to
Customers connected at Extra High Voltage or connected at High Voltage and
metered at a high voltage substation.
1.23. EDCM charges and credits are site-specific, reflecting the degree to which the
local and higher voltage networks have the capacity to serve more demand or
generation without the need to upgrade the electricity infrastructure. The
charges also reflect the networks specifically used to deliver the electricity to
the site as well as the usage at the site. Generators with non-intermittent
output and deemed to be providing beneficial support to our networks may
qualify to receive credit.
1.24. The charges under the EDCM comprise of the following individual components:
a) Fixed charge (pence/MPAN/day) - This charge recovers operational costs
associated with those connection assets that are provided for the ‘sole’ use of
the customer. The value of these assets is used as a basis to derive the
charge.
b) Capacity charge (pence/kVA/day) - This charge comprises the relevant
FCP/ component, the National Grid Electricity Transmission cost and other
regulated costs.
Capacity charges are levied on the MIC, MEC, and any exceeded capacity. You
may wish to review your MIC or MEC periodically to ensure it remains
appropriate for your needs as you may be paying for more capacity than you
require. If you wish to make changes contact us via the details in paragraph
1.12
FCP cost is locational and reflects our assessment of future network
reinforcement necessary at the voltage of connection (local) and beyond at all
higher voltages (remote) relevant to the customer’s connection. This results in
the allocation of higher costs in more capacity congested parts of the network
reflecting the greater likelihood of future reinforcement in these areas, and the
allocation of lower costs in less congested parts of the network. The local FCP
cost is included in the capacity charge.
PAGE 39 OF 56 SP MANWEB PLC DECEMBER 2017
Our regulated costs include direct and indirect operational costs and a residual
amount to ensure recovery of our regulated allowed revenue. The capacity
charge recovers these costs using the customer usage profile and the relevant
assets being used to transport electricity between the source substation and
customer’s Metering Point.
c) Super-red unit charge (pence/kWh) - This charge recovers the remote FCP
component. The charge is positive for import and negative for export which
means you can either reduce your charges by minimising consumption or
increasing export at those times. The charge is applied to consumption during
the Super-red time period as detailed in Annex 2.
1.25. Future charge rates may be affected by consumption during the Super-red
period, therefore reducing consumption in the Super-red time period may be
beneficial.
1.26. Reactive Power - The EDCM does not include a separate charge component
for any reactive power flows (kVAr) for either demand or generation. However,
the EDCM charges do reflect the effect on the network of the customer’s power
factor, for example unit charges can increase if your site power factor is poor
(lower than 0.95). Improving your site’s power factor will also reduce the
maximum demand (kVA) for the same power consumed in kW thus providing
scope to reduce your agreed capacity requirements.
PAGE 40 OF 56 SP MANWEB PLC DECEMBER 2017
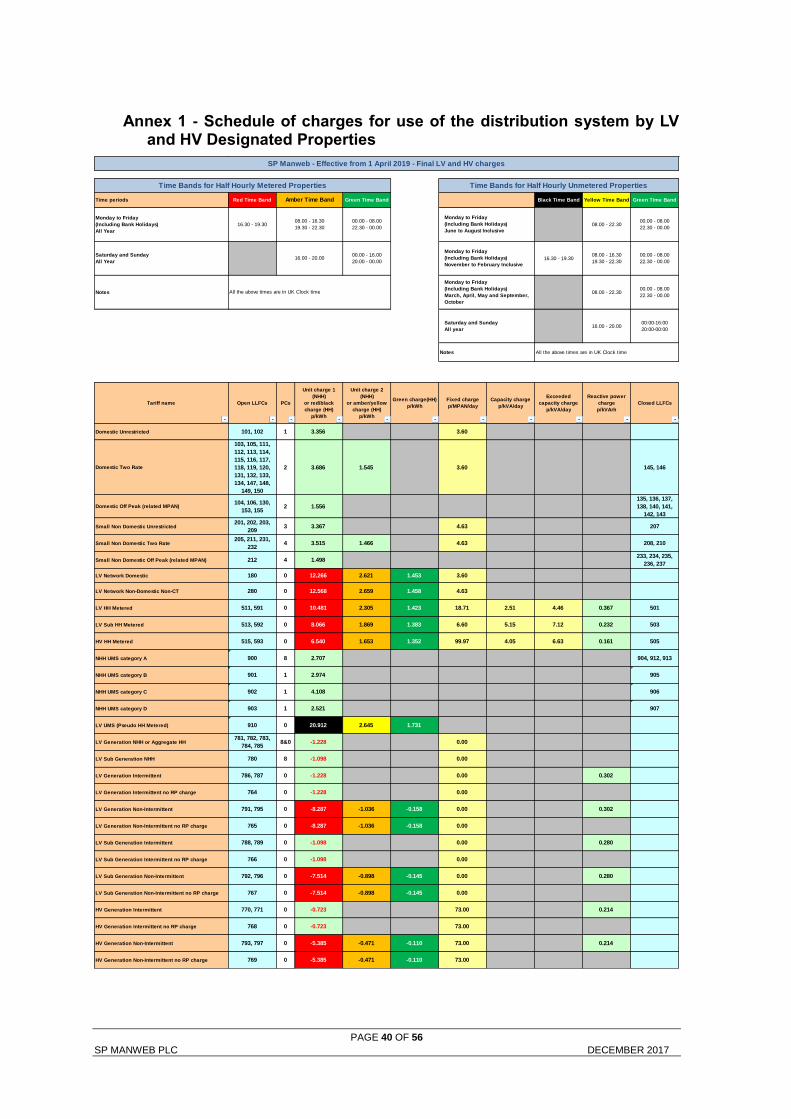
Annex 1 - Schedule of charges for use of the distribution system by LV and HV Designated Properties
Time periods Red Time Band Green Time Band Black Time Band Yellow Time Band Green Time Band
Monday to Friday
(Including Bank Holidays)
All Year
16.30 - 19.3000.00 - 08.00
22.30 - 00.0008.00 - 22.30
00.00 - 08.00
22.30 - 00.00
Saturday and Sunday
All Year
00.00 - 16.00
20.00 - 00.0016.30 - 19.30
08.00 - 16.30
19.30 - 22.30
00.00 - 08.00
22.30 - 00.00
Notes 08.00 - 22.3000.00 - 08.00
22.30 - 00.00
16.00 - 20.0000:00-16:00
20:00-00:00
Tariff name Open LLFCs PCs
Unit charge 1
(NHH)
or red/black
charge (HH)
p/kWh
Unit charge 2
(NHH)
or amber/yellow
charge (HH)
p/kWh
Green charge(HH)
p/kWh
Fixed charge
p/MPAN/day
Capacity charge
p/kVA/day
Exceeded
capacity charge
p/kVA/day
Reactive power
charge
p/kVArh
Closed LLFCs
Domestic Unrestricted 101, 102 1 3.356 3.60
Domestic Two Rate
103, 105, 111,
112, 113, 114,
115, 116, 117,
118, 119, 120,
131, 132, 133,
134, 147, 148,
149, 150
2 3.686 1.545 3.60 145, 146
Domestic Off Peak (related MPAN)104, 106, 130,
153, 1552 1.556
135, 136, 137,
138, 140, 141,
142, 143
Small Non Domestic Unrestricted201, 202, 203,
2093 3.367 4.63 207
Small Non Domestic Two Rate205, 211, 231,
2324 3.515 1.466 4.63 208, 210
Small Non Domestic Off Peak (related MPAN) 212 4 1.498233, 234, 235,
236, 237
LV Network Domestic 180 0 12.266 2.621 1.453 3.60
LV Network Non-Domestic Non-CT 280 0 12.568 2.659 1.458 4.63
LV HH Metered 511, 591 0 10.481 2.305 1.423 18.71 2.51 4.46 0.367 501
LV Sub HH Metered 513, 592 0 8.066 1.869 1.383 6.60 5.15 7.12 0.232 503
HV HH Metered 515, 593 0 6.540 1.653 1.352 99.97 4.05 6.63 0.161 505
NHH UMS category A 900 8 2.707 904, 912, 913
NHH UMS category B 901 1 2.974 905
NHH UMS category C 902 1 4.108 906
NHH UMS category D 903 1 2.521 907
LV UMS (Pseudo HH Metered) 910 0 20.912 2.645 1.731
LV Generation NHH or Aggregate HH781, 782, 783,
784, 785 8&0 -1.228 0.00
LV Sub Generation NHH 780 8 -1.098 0.00
LV Generation Intermittent 786, 787 0 -1.228 0.00 0.302
LV Generation Intermittent no RP charge 764 0 -1.228 0.00
LV Generation Non-Intermittent 791, 795 0 -8.287 -1.036 -0.158 0.00 0.302
LV Generation Non-Intermittent no RP charge 765 0 -8.287 -1.036 -0.158 0.00
LV Sub Generation Intermittent 788, 789 0 -1.098 0.00 0.280
LV Sub Generation Intermittent no RP charge 766 0 -1.098 0.00
LV Sub Generation Non-Intermittent 792, 796 0 -7.514 -0.898 -0.145 0.00 0.280
LV Sub Generation Non-Intermittent no RP charge 767 0 -7.514 -0.898 -0.145 0.00
HV Generation Intermittent 770, 771 0 -0.723 73.00 0.214
HV Generation Intermittent no RP charge 768 0 -0.723 73.00
HV Generation Non-Intermittent 793, 797 0 -5.385 -0.471 -0.110 73.00 0.214
HV Generation Non-Intermittent no RP charge 769 0 -5.385 -0.471 -0.110 73.00
Saturday and Sunday
All year
All the above times are in UK Clock timeNotes
SP Manweb - Effective from 1 April 2019 - Final LV and HV charges
Amber Time Band
08.00 - 16.30
19.30 - 22.30
Monday to Friday
(Including Bank Holidays)
June to August Inclusive
Time Bands for Half Hourly Unmetered PropertiesTime Bands for Half Hourly Metered Properties
16.00 - 20.00
All the above times are in UK Clock time
Monday to Friday
(Including Bank Holidays)
November to February Inclusive
Monday to Friday
(Including Bank Holidays)
March, April, May and September,
October

PAGE 41 OF 56 SP MANWEB PLC DECEMBER 2017
Annex 2 - Schedule of charges for use of the distribution system by Designated EHV Properties (including LDNOs with Designated EHV Properties/end-users)
Import
Unique
Identifier
LLFCImport
MPANs/MSIDs
Export Unique
IdentifierLLFC
Export
MPANs/MSIDsName
Import
Super Red
unit charge
(p/kWh)
Import
fixed charge
(p/day)
Import
capacity
charge
(p/kVA/day)
Import
exceeded
capacity
charge
(p/kVA/day)
Export
Super Red
unit charge
(p/kWh)
Export
fixed charge
(p/day)
Export
capacity
charge
(p/kVA/day)
Export
exceeded
capacity
charge
(p/kVA/day)
803 803 1300035361194 603 603 1300050649372 Shell Stanlow 19306.09 6.60 6.60 -0.262 2382.34 0.05 0.05
804 804 1300035352942 Jaguar & Land Rover 0.302 8711.76 8.49 8.49
805 805 1300035359423 Innospec 0.263 844.42 4.65 4.65
806 806 1300051060972 606 606 1300051060981 Bridgewater Paper 98.14 3.14 3.14
807 807 1300035359752 General Motors 0.266 14550.17 4.52 4.52
808 808 1300035360066 TATA Steel 38475.65 5.07 5.07
809 809 1300035362480 Urenco 4.09 4.09
810 810 1300051694818 618 618 1300060704603 Ineos Chlor Ltd (Lostock) 13181.11 1.56 1.56 2015.58 0.05 0.05
811 811 1300060704073 655 655 1300060704082 SafeGuard Bradwell 1.713 45.24 4.42 4.42 3528.34 0.05 0.05
812 812 1300035356130 Knauf Insulation 0.305 1697.93 7.75 7.75
813 813 1300035359585 Air Products 0.340 384.20 4.42 4.42
814 814 1300035359619 Shell Chemicals 0.275 1697.93 8.79 8.79
815 815 1300035359780 GrowHow 0.270 8712.75 9.18 9.18
816 816 1300053536398 Castle Cement 954.31 3.98 3.98
817 817 1300035361992 648 648 1300060640474 Kronospan 3839.57 14.85 14.88 388.97 0.05 0.05
819 819 1300035365082 619 619 1300051136210 Albion Inorganic 1.956 203.72 1.91 1.91
820 820 1300060563740 658 658 1300060563759 Tyn dryfol PV 8.05 3.68 3.68 2414.17 0.05 0.05
821 821 1300035367967 621 621 1300050649336 BHP 8456.62 2.89 2.89
822 822 1300060251601 Hole House Farm 9536.12 6.33 6.33
823 823 1300060652610 659 659 1300060652629 Williams Farm Solar Park 6.76 3.78 3.78 743.42 0.05 0.05
824 824 1300054940674 604 604 1300054940683 Port of Liverpool 27.66 2.62 2.62 1659.61 0.05 0.05
826 826 1300060579173 661 661 1300060579182 Combermere Abbey PV 14.30 5.02 5.02 2496.20 0.05 0.05
827 827 1300052785147 Kimberley Clark 677.72 14.05 14.05
828 828 1300060075390 628 628 1300060075405 Amegni 7.96 2.28 2.28 620.70 0.05 0.05
829 829 1300035400611 629 629 1300038004507 Salt Union 348.62 2.75 2.75
830 830 1300060584270 681 681 1300060584280 Parciau Solar Park 6.35 4.18 4.18 756.47 0.05 0.05
831 831 1300035437700 Ineos Chlor Ltd (Percival Lane) 416.27 5.85 5.85
833 833 1300035361803 Toyota 2830.69 5.57 5.57
834 834 1300051028551 Warmingham Gas Storage 3884.83 6.71 6.71
835 835 1300050648875 635 635 1300050931602 Arpley Landfill 1.713 11.68 3.29 3.29
836 836 1300035360800 Amcor 2010.87 10.64 10.64
838 838 1300052122840 638 638 1300052122859 Cemmaes C 8.94 2.78 2.78
839 839 1300051822667 639 639 1300051821478 PG Strand Gate 1848.81 2.54 2.54
840 840 1300052545267 640 640 1300052545276 Moel Maelogan (A) 20.74 2.90 2.90
16:30 - 19:30
All the above times are in UK Clock time
Time periods
Monday to Friday
(Including Bank Holidays)
June to August Inclusive
Monday to Friday
(Including Bank Holidays)
November to February Inclusive
Notes
Time Periods for Designated EHV Properties
Super Red Time Band
SP Manweb - Effective from 1 April 2019 - Final EDCM charges
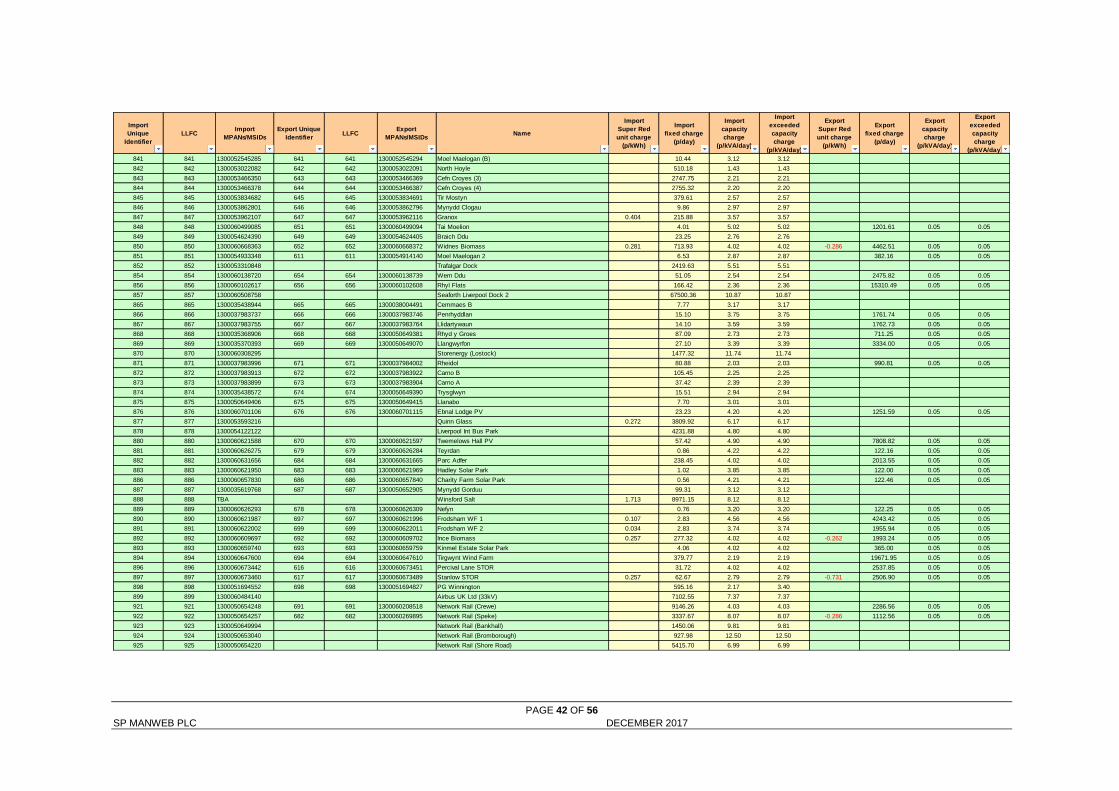
PAGE 42 OF 56 SP MANWEB PLC DECEMBER 2017
Import
Unique
Identifier
LLFCImport
MPANs/MSIDs
Export Unique
IdentifierLLFC
Export
MPANs/MSIDsName
Import
Super Red
unit charge
(p/kWh)
Import
fixed charge
(p/day)
Import
capacity
charge
(p/kVA/day)
Import
exceeded
capacity
charge
(p/kVA/day)
Export
Super Red
unit charge
(p/kWh)
Export
fixed charge
(p/day)
Export
capacity
charge
(p/kVA/day)
Export
exceeded
capacity
charge
(p/kVA/day)
841 841 1300052545285 641 641 1300052545294 Moel Maelogan (B) 10.44 3.12 3.12
842 842 1300053022082 642 642 1300053022091 North Hoyle 510.18 1.43 1.43
843 843 1300053466350 643 643 1300053466369 Cefn Croyes (3) 2747.75 2.21 2.21
844 844 1300053466378 644 644 1300053466387 Cefn Croyes (4) 2755.32 2.20 2.20
845 845 1300053834682 645 645 1300053834691 Tir Mostyn 379.61 2.57 2.57
846 846 1300053862801 646 646 1300053862796 Mynydd Clogau 9.86 2.97 2.97
847 847 1300053962107 647 647 1300053962116 Granox 0.404 215.88 3.57 3.57
848 848 1300060499085 651 651 1300060499094 Tai Moelion 4.01 5.02 5.02 1201.61 0.05 0.05
849 849 1300054624390 649 649 1300054624405 Braich Ddu 23.25 2.76 2.76
850 850 1300060668363 652 652 1300060668372 Widnes Biomass 0.281 713.93 4.02 4.02 -0.286 4462.51 0.05 0.05
851 851 1300054933348 611 611 1300054914140 Moel Maelogan 2 6.53 2.87 2.87 382.16 0.05 0.05
852 852 1300053310848 Trafalgar Dock 2419.63 5.51 5.51
854 854 1300060138720 654 654 1300060138739 Wern Ddu 51.05 2.54 2.54 2475.82 0.05 0.05
856 856 1300060102617 656 656 1300060102608 Rhyl Flats 166.42 2.36 2.36 15310.49 0.05 0.05
857 857 1300060508758 Seaforth Liverpool Dock 2 67500.36 10.87 10.87
865 865 1300035438944 665 665 1300038004491 Cemmaes B 7.77 3.17 3.17
866 866 1300037983737 666 666 1300037983746 Penrhyddlan 15.10 3.75 3.75 1761.74 0.05 0.05
867 867 1300037983755 667 667 1300037983764 Llidartywaun 14.10 3.59 3.59 1762.73 0.05 0.05
868 868 1300035368906 668 668 1300050649381 Rhyd y Groes 87.09 2.73 2.73 711.25 0.05 0.05
869 869 1300035370393 669 669 1300050649070 Llangwyrfon 27.10 3.39 3.39 3334.00 0.05 0.05
870 870 1300060308295 Storenergy (Lostock) 1477.32 11.74 11.74
871 871 1300037983996 671 671 1300037984002 Rheidol 80.88 2.03 2.03 990.81 0.05 0.05
872 872 1300037983913 672 672 1300037983922 Carno B 105.45 2.25 2.25
873 873 1300037983899 673 673 1300037983904 Carno A 37.42 2.39 2.39
874 874 1300035438572 674 674 1300050649390 Trysglwyn 15.51 2.94 2.94
875 875 1300050649406 675 675 1300050649415 Llanabo 7.70 3.01 3.01
876 876 1300060701106 676 676 1300060701115 Ebnal Lodge PV 23.23 4.20 4.20 1251.59 0.05 0.05
877 877 1300053593216 Quinn Glass 0.272 3809.92 6.17 6.17
878 878 1300054122122 Liverpool Int Bus Park 4231.88 4.80 4.80
880 880 1300060621588 670 670 1300060621597 Twemelows Hall PV 57.42 4.90 4.90 7808.82 0.05 0.05
881 881 1300060626275 679 679 1300060626284 Teyrdan 0.86 4.22 4.22 122.16 0.05 0.05
882 882 1300060631656 684 684 1300060631665 Parc Adfer 238.45 4.02 4.02 2013.55 0.05 0.05
883 883 1300060621950 683 683 1300060621969 Hadley Solar Park 1.02 3.85 3.85 122.00 0.05 0.05
886 886 1300060657830 686 686 1300060657840 Charity Farm Solar Park 0.56 4.21 4.21 122.46 0.05 0.05
887 887 1300035619768 687 687 1300050652905 Mynydd Gorduu 99.31 3.12 3.12
888 888 TBA Winsford Salt 1.713 8971.15 8.12 8.12
889 889 1300060626293 678 678 1300060626309 Nefyn 0.76 3.20 3.20 122.25 0.05 0.05
890 890 1300060621987 697 697 1300060621996 Frodsham WF 1 0.107 2.83 4.56 4.56 4243.42 0.05 0.05
891 891 1300060622002 699 699 1300060622011 Frodsham WF 2 0.034 2.83 3.74 3.74 1955.94 0.05 0.05
892 892 1300060609697 692 692 1300060609702 Ince Biomass 0.257 277.32 4.02 4.02 -0.262 1993.24 0.05 0.05
893 893 1300060659740 693 693 1300060659759 Kinmel Estate Solar Park 4.06 4.02 4.02 365.00 0.05 0.05
894 894 1300060647600 694 694 1300060647610 Tirgwynt Wind Farm 379.77 2.19 2.19 19671.95 0.05 0.05
896 896 1300060673442 616 616 1300060673451 Percival Lane STOR 31.72 4.02 4.02 2537.85 0.05 0.05
897 897 1300060673460 617 617 1300060673489 Stanlow STOR 0.257 62.67 2.79 2.79 -0.731 2506.90 0.05 0.05
898 898 1300051694552 698 698 1300051694827 PG Winnington 595.16 2.17 3.40
899 899 1300060484140 Airbus UK Ltd (33kV) 7102.55 7.37 7.37
921 921 1300050654248 691 691 1300060208518 Network Rail (Crewe) 9146.26 4.03 4.03 2286.56 0.05 0.05
922 922 1300050654257 682 682 1300060269895 Network Rail (Speke) 3337.67 8.07 8.07 -0.286 1112.56 0.05 0.05
923 923 1300050649994 Network Rail (Bankhall) 1450.06 9.81 9.81
924 924 1300050653040 Network Rail (Bromborough) 927.98 12.50 12.50
925 925 1300050654220 Network Rail (Shore Road) 5415.70 6.99 6.99
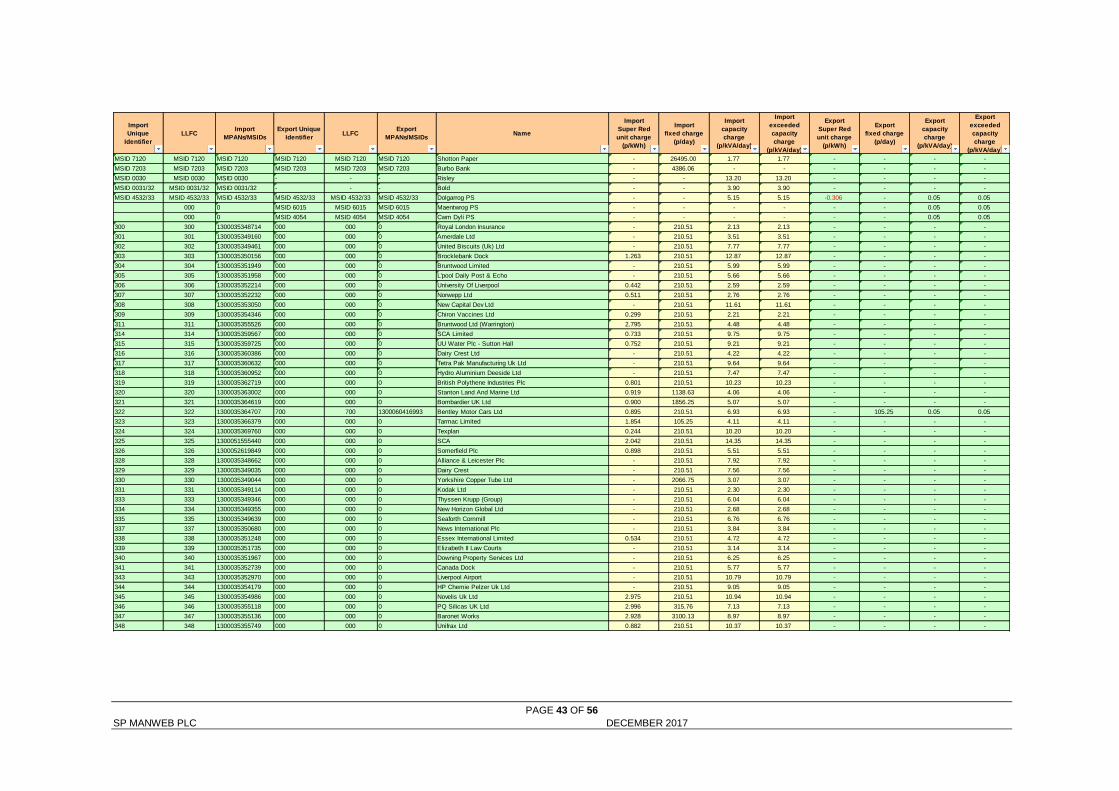
PAGE 43 OF 56 SP MANWEB PLC DECEMBER 2017
Import
Unique
Identifier
LLFCImport
MPANs/MSIDs
Export Unique
IdentifierLLFC
Export
MPANs/MSIDsName
Import
Super Red
unit charge
(p/kWh)
Import
fixed charge
(p/day)
Import
capacity
charge
(p/kVA/day)
Import
exceeded
capacity
charge
(p/kVA/day)
Export
Super Red
unit charge
(p/kWh)
Export
fixed charge
(p/day)
Export
capacity
charge
(p/kVA/day)
Export
exceeded
capacity
charge
(p/kVA/day)
MSID 7120 MSID 7120 MSID 7120 MSID 7120 MSID 7120 MSID 7120 Shotton Paper - 26495.00 1.77 1.77 - - - -
MSID 7203 MSID 7203 MSID 7203 MSID 7203 MSID 7203 MSID 7203 Burbo Bank - 4386.06 - - - - - -
MSID 0030 MSID 0030 MSID 0030 - - - Risley - - 13.20 13.20 - - - -
MSID 0031/32 MSID 0031/32 MSID 0031/32 - - - Bold - - 3.90 3.90 - - - -
MSID 4532/33 MSID 4532/33 MSID 4532/33 MSID 4532/33 MSID 4532/33 MSID 4532/33 Dolgarrog PS - - 5.15 5.15 -0.306 - 0.05 0.05
000 0 MSID 6015 MSID 6015 MSID 6015 Maentwrog PS - - - - - - 0.05 0.05
000 0 MSID 4054 MSID 4054 MSID 4054 Cwm Dyli PS - - - - - - 0.05 0.05
300 300 1300035348714 000 000 0 Royal London Insurance - 210.51 2.13 2.13 - - - -
301 301 1300035349160 000 000 0 Amerdale Ltd - 210.51 3.51 3.51 - - - -
302 302 1300035349461 000 000 0 United Biscuits (Uk) Ltd - 210.51 7.77 7.77 - - - -
303 303 1300035350156 000 000 0 Brocklebank Dock 1.263 210.51 12.87 12.87 - - - -
304 304 1300035351949 000 000 0 Bruntwood Limited - 210.51 5.99 5.99 - - - -
305 305 1300035351958 000 000 0 L'pool Daily Post & Echo - 210.51 5.66 5.66 - - - -
306 306 1300035352214 000 000 0 University Of Liverpool 0.442 210.51 2.59 2.59 - - - -
307 307 1300035352232 000 000 0 Norwepp Ltd 0.511 210.51 2.76 2.76 - - - -
308 308 1300035353050 000 000 0 New Capital Dev Ltd - 210.51 11.61 11.61 - - - -
309 309 1300035354346 000 000 0 Chiron Vaccines Ltd 0.299 210.51 2.21 2.21 - - - -
311 311 1300035355526 000 000 0 Bruntwood Ltd (Warrington) 2.795 210.51 4.48 4.48 - - - -
314 314 1300035359567 000 000 0 SCA Limited 0.733 210.51 9.75 9.75 - - - -
315 315 1300035359725 000 000 0 UU Water Plc - Sutton Hall 0.752 210.51 9.21 9.21 - - - -
316 316 1300035360386 000 000 0 Dairy Crest Ltd - 210.51 4.22 4.22 - - - -
317 317 1300035360632 000 000 0 Tetra Pak Manufacturing Uk Ltd - 210.51 9.64 9.64 - - - -
318 318 1300035360952 000 000 0 Hydro Aluminium Deeside Ltd - 210.51 7.47 7.47 - - - -
319 319 1300035362719 000 000 0 British Polythene Industries Plc 0.801 210.51 10.23 10.23 - - - -
320 320 1300035363002 000 000 0 Stanton Land And Marine Ltd 0.919 1138.63 4.06 4.06 - - - -
321 321 1300035364619 000 000 0 Bombardier UK Ltd 0.900 1856.25 5.07 5.07 - - - -
322 322 1300035364707 700 700 1300060416993 Bentley Motor Cars Ltd 0.895 210.51 6.93 6.93 - 105.25 0.05 0.05
323 323 1300035366379 000 000 0 Tarmac Limited 1.854 105.25 4.11 4.11 - - - -
324 324 1300035369760 000 000 0 Texplan 0.244 210.51 10.20 10.20 - - - -
325 325 1300051555440 000 000 0 SCA 2.042 210.51 14.35 14.35 - - - -
326 326 1300052619849 000 000 0 Somerfield Plc 0.898 210.51 5.51 5.51 - - - -
328 328 1300035348662 000 000 0 Alliance & Leicester Plc - 210.51 7.92 7.92 - - - -
329 329 1300035349035 000 000 0 Dairy Crest - 210.51 7.56 7.56 - - - -
330 330 1300035349044 000 000 0 Yorkshire Copper Tube Ltd - 2066.75 3.07 3.07 - - - -
331 331 1300035349114 000 000 0 Kodak Ltd - 210.51 2.30 2.30 - - - -
333 333 1300035349346 000 000 0 Thyssen Krupp (Group) - 210.51 6.04 6.04 - - - -
334 334 1300035349355 000 000 0 New Horizon Global Ltd - 210.51 2.68 2.68 - - - -
335 335 1300035349639 000 000 0 Seaforth Cornmill - 210.51 6.76 6.76 - - - -
337 337 1300035350680 000 000 0 News International Plc - 210.51 3.84 3.84 - - - -
338 338 1300035351248 000 000 0 Essex International Limited 0.534 210.51 4.72 4.72 - - - -
339 339 1300035351735 000 000 0 Elizabeth II Law Courts - 210.51 3.14 3.14 - - - -
340 340 1300035351967 000 000 0 Downing Property Services Ltd - 210.51 6.25 6.25 - - - -
341 341 1300035352739 000 000 0 Canada Dock - 210.51 5.77 5.77 - - - -
343 343 1300035352970 000 000 0 Liverpool Airport - 210.51 10.79 10.79 - - - -
344 344 1300035354179 000 000 0 HP Chemie Pelzer Uk Ltd - 210.51 9.05 9.05 - - - -
345 345 1300035354986 000 000 0 Novelis Uk Ltd 2.975 210.51 10.94 10.94 - - - -
346 346 1300035355118 000 000 0 PQ Silicas UK Ltd 2.996 315.76 7.13 7.13 - - - -
347 347 1300035355136 000 000 0 Baronet Works 2.928 3100.13 8.97 8.97 - - - -
348 348 1300035355749 000 000 0 Unifrax Ltd 0.882 210.51 10.37 10.37 - - - -
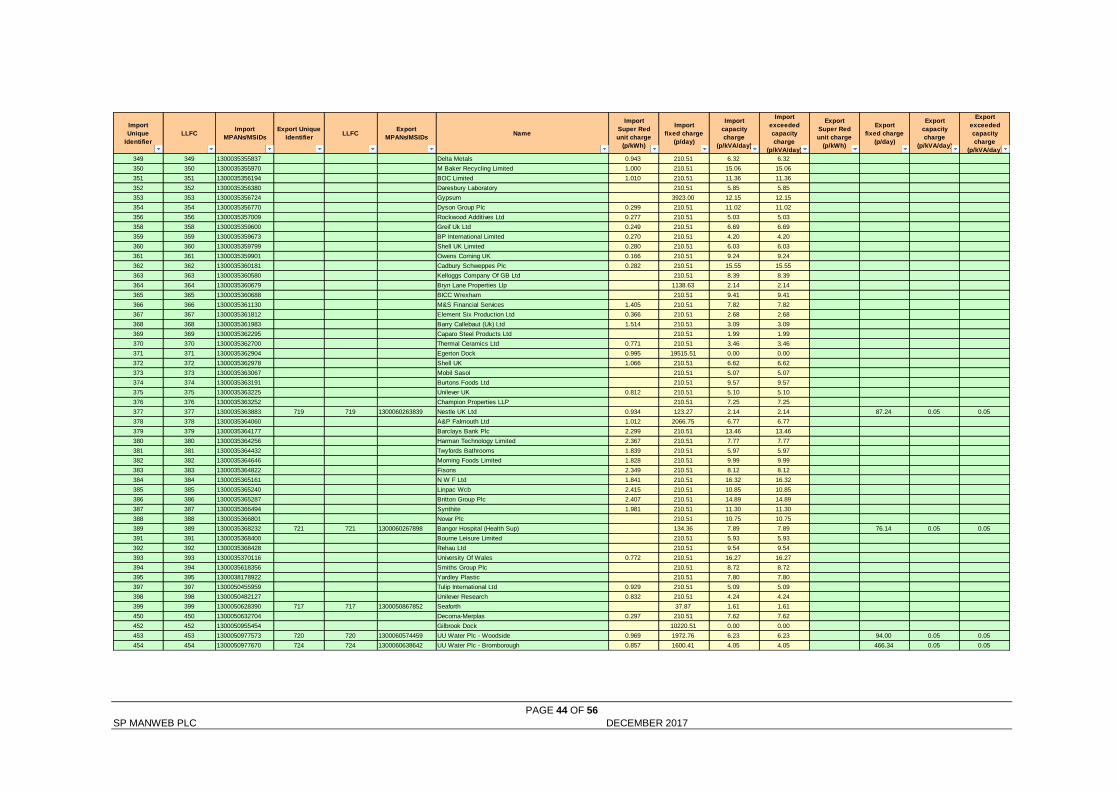
PAGE 44 OF 56 SP MANWEB PLC DECEMBER 2017
Import
Unique
Identifier
LLFCImport
MPANs/MSIDs
Export Unique
IdentifierLLFC
Export
MPANs/MSIDsName
Import
Super Red
unit charge
(p/kWh)
Import
fixed charge
(p/day)
Import
capacity
charge
(p/kVA/day)
Import
exceeded
capacity
charge
(p/kVA/day)
Export
Super Red
unit charge
(p/kWh)
Export
fixed charge
(p/day)
Export
capacity
charge
(p/kVA/day)
Export
exceeded
capacity
charge
(p/kVA/day)
349 349 1300035355837 Delta Metals 0.943 210.51 6.32 6.32
350 350 1300035355970 M Baker Recycling Limited 1.000 210.51 15.06 15.06
351 351 1300035356194 BOC Limited 1.010 210.51 11.36 11.36
352 352 1300035356380 Daresbury Laboratory 210.51 5.85 5.85
353 353 1300035356724 Gypsum 3923.00 12.15 12.15
354 354 1300035356770 Dyson Group Plc 0.299 210.51 11.02 11.02
356 356 1300035357009 Rockwood Additives Ltd 0.277 210.51 5.03 5.03
358 358 1300035359600 Greif Uk Ltd 0.249 210.51 6.69 6.69
359 359 1300035359673 BP International Limited 0.270 210.51 4.20 4.20
360 360 1300035359799 Shell UK Limited 0.280 210.51 6.03 6.03
361 361 1300035359901 Owens Corning UK 0.166 210.51 9.24 9.24
362 362 1300035360181 Cadbury Schweppes Plc 0.282 210.51 15.55 15.55
363 363 1300035360580 Kelloggs Company Of GB Ltd 210.51 8.39 8.39
364 364 1300035360679 Bryn Lane Properties Llp 1138.63 2.14 2.14
365 365 1300035360688 BICC Wrexham 210.51 9.41 9.41
366 366 1300035361130 M&S Financial Services 1.405 210.51 7.82 7.82
367 367 1300035361812 Element Six Production Ltd 0.366 210.51 2.68 2.68
368 368 1300035361983 Barry Callebaut (Uk) Ltd 1.514 210.51 3.09 3.09
369 369 1300035362295 Caparo Steel Products Ltd 210.51 1.99 1.99
370 370 1300035362700 Thermal Ceramics Ltd 0.771 210.51 3.46 3.46
371 371 1300035362904 Egerton Dock 0.995 19515.51 0.00 0.00
372 372 1300035362978 Shell UK 1.066 210.51 6.62 6.62
373 373 1300035363067 Mobil Sasol 210.51 5.07 5.07
374 374 1300035363191 Burtons Foods Ltd 210.51 9.57 9.57
375 375 1300035363225 Unilever UK 0.812 210.51 5.10 5.10
376 376 1300035363252 Champion Properties LLP 210.51 7.25 7.25
377 377 1300035363883 719 719 1300060263839 Nestle UK Ltd 0.934 123.27 2.14 2.14 87.24 0.05 0.05
378 378 1300035364060 A&P Falmouth Ltd 1.012 2066.75 6.77 6.77
379 379 1300035364177 Barclays Bank Plc 2.299 210.51 13.46 13.46
380 380 1300035364256 Harman Technology Limited 2.367 210.51 7.77 7.77
381 381 1300035364432 Twyfords Bathrooms 1.839 210.51 5.97 5.97
382 382 1300035364646 Morning Foods Limited 1.828 210.51 9.99 9.99
383 383 1300035364822 Fisons 2.349 210.51 8.12 8.12
384 384 1300035365161 N W F Ltd 1.841 210.51 16.32 16.32
385 385 1300035365240 Linpac Wcb 2.415 210.51 10.85 10.85
386 386 1300035365287 Britton Group Plc 2.407 210.51 14.89 14.89
387 387 1300035366494 Synthite 1.981 210.51 11.30 11.30
388 388 1300035366801 Novar Plc 210.51 10.75 10.75
389 389 1300035368232 721 721 1300060267898 Bangor Hospital (Health Sup) 134.36 7.89 7.89 76.14 0.05 0.05
391 391 1300035368400 Bourne Leisure Limited 210.51 5.93 5.93
392 392 1300035368428 Rehau Ltd 210.51 9.54 9.54
393 393 1300035370116 University Of Wales 0.772 210.51 16.27 16.27
394 394 1300035618356 Smiths Group Plc 210.51 8.72 8.72
395 395 1300038178922 Yardley Plastic 210.51 7.80 7.80
397 397 1300050455959 Tulip International Ltd 0.929 210.51 5.09 5.09
398 398 1300050482127 Unilever Research 0.832 210.51 4.24 4.24
399 399 1300050628390 717 717 1300050867852 Seaforth 37.87 1.61 1.61
450 450 1300050632704 Decoma-Merplas 0.297 210.51 7.62 7.62
452 452 1300050955454 Gilbrook Dock 10220.51 0.00 0.00
453 453 1300050977573 720 720 1300060574459 UU Water Plc - Woodside 0.969 1972.76 6.23 6.23 94.00 0.05 0.05
454 454 1300050977670 724 724 1300060638642 UU Water Plc - Bromborough 0.857 1600.41 4.05 4.05 466.34 0.05 0.05
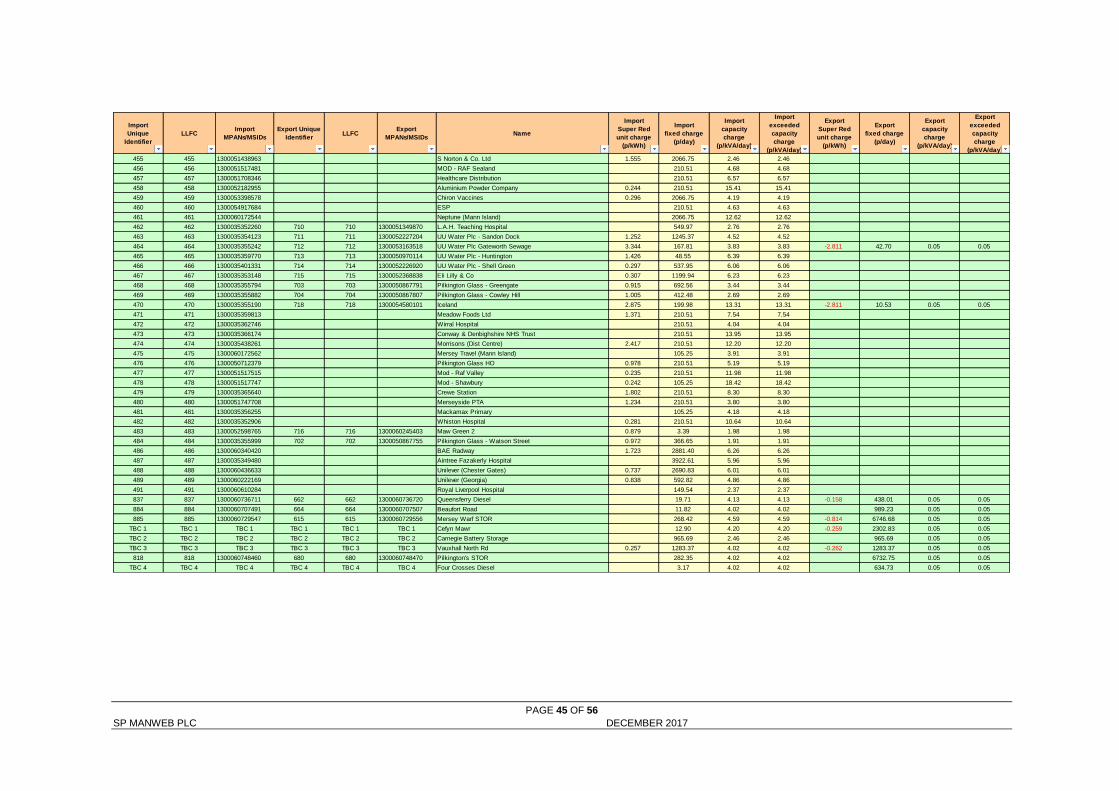
PAGE 45 OF 56 SP MANWEB PLC DECEMBER 2017
Import
Unique
Identifier
LLFCImport
MPANs/MSIDs
Export Unique
IdentifierLLFC
Export
MPANs/MSIDsName
Import
Super Red
unit charge
(p/kWh)
Import
fixed charge
(p/day)
Import
capacity
charge
(p/kVA/day)
Import
exceeded
capacity
charge
(p/kVA/day)
Export
Super Red
unit charge
(p/kWh)
Export
fixed charge
(p/day)
Export
capacity
charge
(p/kVA/day)
Export
exceeded
capacity
charge
(p/kVA/day)
455 455 1300051438963 S Norton & Co. Ltd 1.555 2066.75 2.46 2.46
456 456 1300051517481 MOD - RAF Sealand 210.51 4.68 4.68
457 457 1300051708346 Healthcare Distribution 210.51 6.57 6.57
458 458 1300052182955 Aluminium Powder Company 0.244 210.51 15.41 15.41
459 459 1300053398578 Chiron Vaccines 0.296 2066.75 4.19 4.19
460 460 1300054917684 ESP 210.51 4.63 4.63
461 461 1300060172544 Neptune (Mann Island) 2066.75 12.62 12.62
462 462 1300035352260 710 710 1300051349870 L.A.H. Teaching Hospital 549.97 2.76 2.76
463 463 1300035354123 711 711 1300052227204 UU Water Plc - Sandon Dock 1.252 1245.37 4.52 4.52
464 464 1300035355242 712 712 1300053163518 UU Water Plc Gateworth Sewage 3.344 167.81 3.83 3.83 -2.811 42.70 0.05 0.05
465 465 1300035359770 713 713 1300050970114 UU Water Plc - Huntington 1.426 48.55 6.39 6.39
466 466 1300035401331 714 714 1300052226920 UU Water Plc - Shell Green 0.297 537.95 6.06 6.06
467 467 1300035353148 715 715 1300052368838 Eli Lilly & Co 0.307 1199.94 6.23 6.23
468 468 1300035355794 703 703 1300050867791 Pilkington Glass - Greengate 0.915 692.56 3.44 3.44
469 469 1300035355882 704 704 1300050867807 Pilkington Glass - Cowley Hill 1.005 412.48 2.69 2.69
470 470 1300035355190 718 718 1300054580101 Iceland 2.875 199.98 13.31 13.31 -2.811 10.53 0.05 0.05
471 471 1300035359813 Meadow Foods Ltd 1.371 210.51 7.54 7.54
472 472 1300035362746 Wirral Hospital 210.51 4.04 4.04
473 473 1300035366174 Conway & Denbighshire NHS Trust 210.51 13.95 13.95
474 474 1300035438261 Morrisons (Dist Centre) 2.417 210.51 12.20 12.20
475 475 1300060172562 Mersey Travel (Mann Island) 105.25 3.91 3.91
476 476 1300050712379 Pilkington Glass HO 0.978 210.51 5.19 5.19
477 477 1300051517515 Mod - Raf Valley 0.235 210.51 11.98 11.98
478 478 1300051517747 Mod - Shawbury 0.242 105.25 18.42 18.42
479 479 1300035365640 Crewe Station 1.802 210.51 8.30 8.30
480 480 1300051747708 Merseyside PTA 1.234 210.51 3.80 3.80
481 481 1300035356255 Mackamax Primary 105.25 4.18 4.18
482 482 1300035352906 Whiston Hospital 0.281 210.51 10.64 10.64
483 483 1300052598765 716 716 1300060245403 Maw Green 2 0.879 3.39 1.98 1.98
484 484 1300035355999 702 702 1300050867755 Pilkington Glass - Watson Street 0.972 366.65 1.91 1.91
486 486 1300060340420 BAE Radway 1.723 2881.40 6.26 6.26
487 487 1300035349480 Aintree Fazakerly Hospital 3922.61 5.96 5.96
488 488 1300060436633 Unilever (Chester Gates) 0.737 2690.83 6.01 6.01
489 489 1300060222169 Unilever (Georgia) 0.838 592.82 4.86 4.86
491 491 1300060610284 Royal Liverpool Hospital 149.54 2.37 2.37
837 837 1300060736711 662 662 1300060736720 Queensferry Diesel 19.71 4.13 4.13 -0.158 438.01 0.05 0.05
884 884 1300060707491 664 664 1300060707507 Beaufort Road 11.82 4.02 4.02 989.23 0.05 0.05
885 885 1300060729547 615 615 1300060729556 Mersey Warf STOR 268.42 4.59 4.59 -0.814 6746.68 0.05 0.05
TBC 1 TBC 1 TBC 1 TBC 1 TBC 1 TBC 1 Cefyn Mawr 12.90 4.20 4.20 -0.259 2302.83 0.05 0.05
TBC 2 TBC 2 TBC 2 TBC 2 TBC 2 TBC 2 Carnegie Battery Storage 965.69 2.46 2.46 965.69 0.05 0.05
TBC 3 TBC 3 TBC 3 TBC 3 TBC 3 TBC 3 Vauxhall North Rd 0.257 1283.37 4.02 4.02 -0.262 1283.37 0.05 0.05
818 818 1300060748460 680 680 1300060748470 Pilkington's STOR 282.35 4.02 4.02 6732.75 0.05 0.05
TBC 4 TBC 4 TBC 4 TBC 4 TBC 4 TBC 4 Four Crosses Diesel 3.17 4.02 4.02 634.73 0.05 0.05

PAGE 46 OF 56 SP MANWEB PLC DECEMBER 2017
Annex 3 - Schedule of charges for use of the distribution system by preserved/additional LLF classes
Closed LLFCs PCs
Unit charge 1
(NHH)
or red/black
charge (HH)
p/kWh
Unit charge 2
(NHH)
or amber/yellow
charge (HH)
p/kWh
Green
charge(HH)
p/kWh
Fixed charge
p/MPAN/day
Capacity charge
p/kVA/day
Exceeded
capacity charge
p/kVA/day
Reactive power
charge
p/kVArh
Domestic Two Rate 145, 146 2 3.686 1.545 3.60
Domestic Off Peak (related MPAN)135, 136, 137, 138,
140, 141, 142, 1432 1.556
Small Non Domestic Unrestricted 207 3 3.367 4.63
Small Non Domestic Two Rate 208, 210 4 3.515 1.466 4.63
Small Non Domestic Off Peak (related MPAN)233, 234, 235, 236,
2374 1.498
LV Medium Non-Domestic 401, 402 5-8 3.452 1.434 20.58
LV Sub Medium Non-Domestic 403, 404 5-8 3.440 1.434 24.87
HV Medium Non-Domestic 405 5-8 2.533 1.378 190.08
Closed LLFCs PCs
Red/black charge
(HH)
p/kWh
Amber/yellow
charge (HH)
p/kWh
Green charge
(HH)
p/kWh
Fixed charge
p/MPAN/day
Capacity charge
p/kVA/day
Exceeded
capacity charge
p/kVA/day
Reactive power
charge
p/kVArh
LV HH Metered 501 0 10.481 2.305 1.423 18.71 2.51 4.46 0.367
LV Sub HH Metered 503 0 8.066 1.869 1.383 6.60 5.15 7.12 0.232
HV HH Metered 505 0 6.540 1.653 1.352 99.97 4.05 6.63 0.161
All times are UK clock-time.
Unit charges in the green time band apply – betw een [xx:xx] and [xx:xx], Monday to Friday including bank holidays, and [xx:xx] and [xx:xx] Saturday and Sunday.
SP Manweb - Effective from 1 April 2019 - Final LV and HV tariffs
NHH preserved charges/additional LLFCs
Unit time periods are as specif ied in the SSC.
Unit charges in the amber time band apply – betw een [xx:xx] and [xx:xx], Monday to Friday including bank holidays.
Notes:
HH preserved charges/additional LLFCs
Time periods
Unit charges in the red time band apply – betw een [xx:xx] and [xx:xx], Monday to Friday including bank holidays.
Notes:
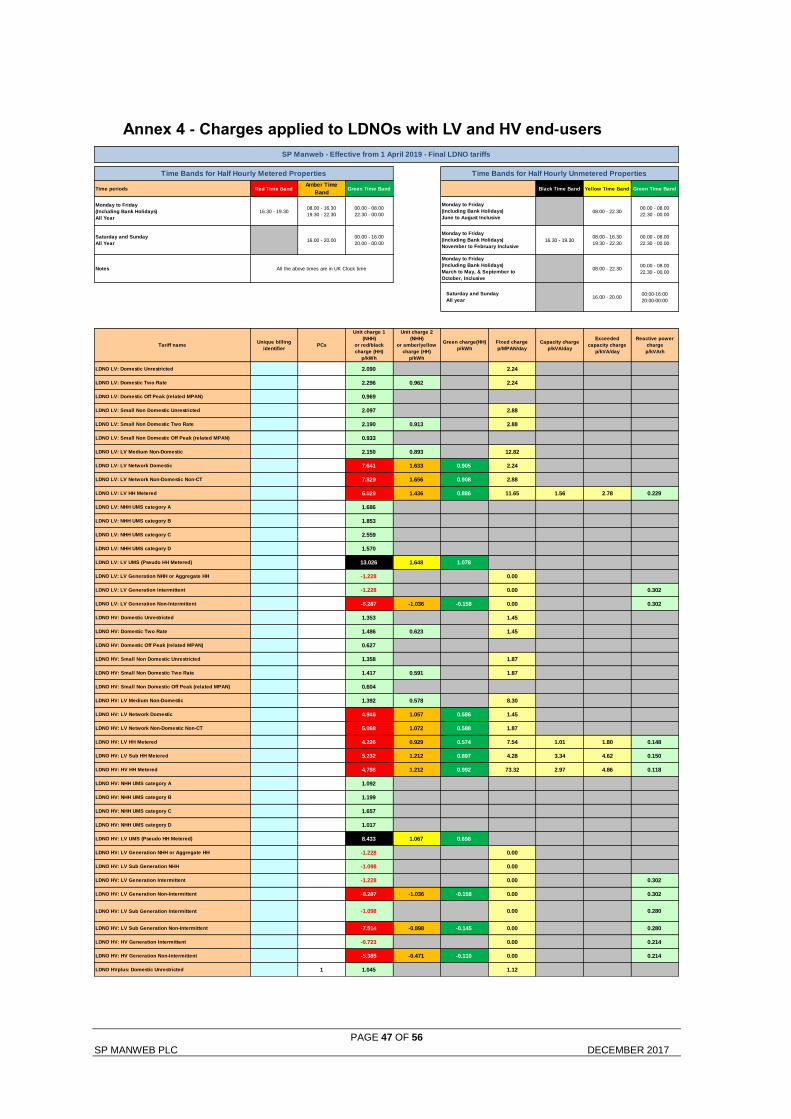
PAGE 47 OF 56 SP MANWEB PLC DECEMBER 2017
Annex 4 - Charges applied to LDNOs with LV and HV end-users
Time periods Red Time BandAmber Time
BandGreen Time Band Black Time Band Yellow Time Band Green Time Band
Monday to Friday
(Including Bank Holidays)
All Year
16.30 - 19.3008.00 - 16.30
19.30 - 22.30
00.00 - 08.00
22.30 - 00.0008.00 - 22.30
00.00 - 08.00
22.30 - 00.00
Saturday and Sunday
All Year16.00 - 20.00
00.00 - 16.00
20.00 - 00.0016.30 - 19.30
08.00 - 16.30
19.30 - 22.30
00.00 - 08.00
22.30 - 00.00
Notes 08.00 - 22.3000.00 - 08.00
22.30 - 00.00
16.00 - 20.0000:00-16:00
20:00-00:00
Tariff nameUnique billing
identifierPCs
Unit charge 1
(NHH)
or red/black
charge (HH)
p/kWh
Unit charge 2
(NHH)
or amber/yellow
charge (HH)
p/kWh
Green charge(HH)
p/kWh
Fixed charge
p/MPAN/day
Capacity charge
p/kVA/day
Exceeded
capacity charge
p/kVA/day
Reactive power
charge
p/kVArh
LDNO LV: Domestic Unrestricted 2.090 2.24
LDNO LV: Domestic Two Rate 2.296 0.962 2.24
LDNO LV: Domestic Off Peak (related MPAN) 0.969
LDNO LV: Small Non Domestic Unrestricted 2.097 2.88
LDNO LV: Small Non Domestic Two Rate 2.190 0.913 2.88
LDNO LV: Small Non Domestic Off Peak (related MPAN) 0.933
LDNO LV: LV Medium Non-Domestic 2.150 0.893 12.82
LDNO LV: LV Network Domestic 7.641 1.633 0.905 2.24
LDNO LV: LV Network Non-Domestic Non-CT 7.829 1.656 0.908 2.88
LDNO LV: LV HH Metered 6.529 1.436 0.886 11.65 1.56 2.78 0.229
LDNO LV: NHH UMS category A 1.686
LDNO LV: NHH UMS category B 1.853
LDNO LV: NHH UMS category C 2.559
LDNO LV: NHH UMS category D 1.570
LDNO LV: LV UMS (Pseudo HH Metered) 13.026 1.648 1.078
LDNO LV: LV Generation NHH or Aggregate HH -1.228 0.00
LDNO LV: LV Generation Intermittent -1.228 0.00 0.302
LDNO LV: LV Generation Non-Intermittent -8.287 -1.036 -0.158 0.00 0.302
LDNO HV: Domestic Unrestricted 1.353 1.45
LDNO HV: Domestic Two Rate 1.486 0.623 1.45
LDNO HV: Domestic Off Peak (related MPAN) 0.627
LDNO HV: Small Non Domestic Unrestricted 1.358 1.87
LDNO HV: Small Non Domestic Two Rate 1.417 0.591 1.87
LDNO HV: Small Non Domestic Off Peak (related MPAN) 0.604
LDNO HV: LV Medium Non-Domestic 1.392 0.578 8.30
LDNO HV: LV Network Domestic 4.946 1.057 0.586 1.45
LDNO HV: LV Network Non-Domestic Non-CT 5.068 1.072 0.588 1.87
LDNO HV: LV HH Metered 4.226 0.929 0.574 7.54 1.01 1.80 0.148
LDNO HV: LV Sub HH Metered 5.232 1.212 0.897 4.28 3.34 4.62 0.150
LDNO HV: HV HH Metered 4.796 1.212 0.992 73.32 2.97 4.86 0.118
LDNO HV: NHH UMS category A 1.092
LDNO HV: NHH UMS category B 1.199
LDNO HV: NHH UMS category C 1.657
LDNO HV: NHH UMS category D 1.017
LDNO HV: LV UMS (Pseudo HH Metered) 8.433 1.067 0.698
LDNO HV: LV Generation NHH or Aggregate HH -1.228 0.00
LDNO HV: LV Sub Generation NHH -1.098 0.00
LDNO HV: LV Generation Intermittent -1.228 0.00 0.302
LDNO HV: LV Generation Non-Intermittent -8.287 -1.036 -0.158 0.00 0.302
LDNO HV: LV Sub Generation Intermittent -1.098 0.00 0.280
LDNO HV: LV Sub Generation Non-Intermittent -7.514 -0.898 -0.145 0.00 0.280
LDNO HV: HV Generation Intermittent -0.723 0.00 0.214
LDNO HV: HV Generation Non-Intermittent -5.385 -0.471 -0.110 0.00 0.214
LDNO HVplus: Domestic Unrestricted 1 1.045 1.12
Saturday and Sunday
All year
SP Manweb - Effective from 1 April 2019 - Final LDNO tariffs
Time Bands for Half Hourly Unmetered Properties
All the above times are in UK Clock time
Time Bands for Half Hourly Metered Properties
Monday to Friday
(Including Bank Holidays)
June to August Inclusive
Monday to Friday
(Including Bank Holidays)
November to February Inclusive
Monday to Friday
(Including Bank Holidays)
March to May, & September to
October, Inclusive
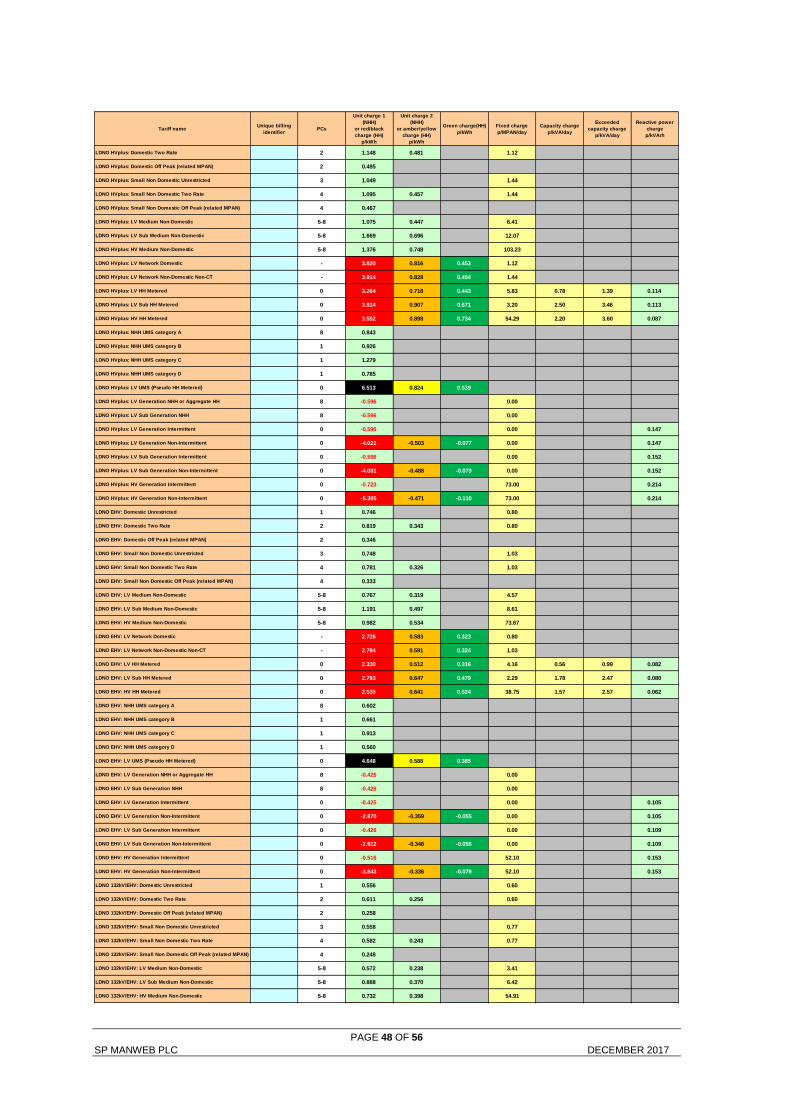
PAGE 48 OF 56 SP MANWEB PLC DECEMBER 2017
Tariff nameUnique billing
identifierPCs
Unit charge 1
(NHH)
or red/black
charge (HH)
p/kWh
Unit charge 2
(NHH)
or amber/yellow
charge (HH)
p/kWh
Green charge(HH)
p/kWh
Fixed charge
p/MPAN/day
Capacity charge
p/kVA/day
Exceeded
capacity charge
p/kVA/day
Reactive power
charge
p/kVArh
LDNO HVplus: Domestic Two Rate 2 1.148 0.481 1.12
LDNO HVplus: Domestic Off Peak (related MPAN) 2 0.485
LDNO HVplus: Small Non Domestic Unrestricted 3 1.049 1.44
LDNO HVplus: Small Non Domestic Two Rate 4 1.095 0.457 1.44
LDNO HVplus: Small Non Domestic Off Peak (related MPAN) 4 0.467
LDNO HVplus: LV Medium Non-Domestic 5-8 1.075 0.447 6.41
LDNO HVplus: LV Sub Medium Non-Domestic 5-8 1.669 0.696 12.07
LDNO HVplus: HV Medium Non-Domestic 5-8 1.376 0.748 103.23
LDNO HVplus: LV Network Domestic - 3.820 0.816 0.453 1.12
LDNO HVplus: LV Network Non-Domestic Non-CT - 3.914 0.828 0.454 1.44
LDNO HVplus: LV HH Metered 0 3.264 0.718 0.443 5.83 0.78 1.39 0.114
LDNO HVplus: LV Sub HH Metered 0 3.914 0.907 0.671 3.20 2.50 3.46 0.113
LDNO HVplus: HV HH Metered 0 3.552 0.898 0.734 54.29 2.20 3.60 0.087
LDNO HVplus: NHH UMS category A 8 0.843
LDNO HVplus: NHH UMS category B 1 0.926
LDNO HVplus: NHH UMS category C 1 1.279
LDNO HVplus: NHH UMS category D 1 0.785
LDNO HVplus: LV UMS (Pseudo HH Metered) 0 6.513 0.824 0.539
LDNO HVplus: LV Generation NHH or Aggregate HH 8 -0.596 0.00
LDNO HVplus: LV Sub Generation NHH 8 -0.596 0.00
LDNO HVplus: LV Generation Intermittent 0 -0.596 0.00 0.147
LDNO HVplus: LV Generation Non-Intermittent 0 -4.021 -0.503 -0.077 0.00 0.147
LDNO HVplus: LV Sub Generation Intermittent 0 -0.596 0.00 0.152
LDNO HVplus: LV Sub Generation Non-Intermittent 0 -4.081 -0.488 -0.079 0.00 0.152
LDNO HVplus: HV Generation Intermittent 0 -0.723 73.00 0.214
LDNO HVplus: HV Generation Non-Intermittent 0 -5.385 -0.471 -0.110 73.00 0.214
LDNO EHV: Domestic Unrestricted 1 0.746 0.80
LDNO EHV: Domestic Two Rate 2 0.819 0.343 0.80
LDNO EHV: Domestic Off Peak (related MPAN) 2 0.346
LDNO EHV: Small Non Domestic Unrestricted 3 0.748 1.03
LDNO EHV: Small Non Domestic Two Rate 4 0.781 0.326 1.03
LDNO EHV: Small Non Domestic Off Peak (related MPAN) 4 0.333
LDNO EHV: LV Medium Non-Domestic 5-8 0.767 0.319 4.57
LDNO EHV: LV Sub Medium Non-Domestic 5-8 1.191 0.497 8.61
LDNO EHV: HV Medium Non-Domestic 5-8 0.982 0.534 73.67
LDNO EHV: LV Network Domestic - 2.726 0.583 0.323 0.80
LDNO EHV: LV Network Non-Domestic Non-CT - 2.794 0.591 0.324 1.03
LDNO EHV: LV HH Metered 0 2.330 0.512 0.316 4.16 0.56 0.99 0.082
LDNO EHV: LV Sub HH Metered 0 2.793 0.647 0.479 2.29 1.78 2.47 0.080
LDNO EHV: HV HH Metered 0 2.535 0.641 0.524 38.75 1.57 2.57 0.062
LDNO EHV: NHH UMS category A 8 0.602
LDNO EHV: NHH UMS category B 1 0.661
LDNO EHV: NHH UMS category C 1 0.913
LDNO EHV: NHH UMS category D 1 0.560
LDNO EHV: LV UMS (Pseudo HH Metered) 0 4.648 0.588 0.385
LDNO EHV: LV Generation NHH or Aggregate HH 8 -0.425 0.00
LDNO EHV: LV Sub Generation NHH 8 -0.426 0.00
LDNO EHV: LV Generation Intermittent 0 -0.425 0.00 0.105
LDNO EHV: LV Generation Non-Intermittent 0 -2.870 -0.359 -0.055 0.00 0.105
LDNO EHV: LV Sub Generation Intermittent 0 -0.426 0.00 0.109
LDNO EHV: LV Sub Generation Non-Intermittent 0 -2.912 -0.348 -0.056 0.00 0.109
LDNO EHV: HV Generation Intermittent 0 -0.516 52.10 0.153
LDNO EHV: HV Generation Non-Intermittent 0 -3.843 -0.336 -0.079 52.10 0.153
LDNO 132kV/EHV: Domestic Unrestricted 1 0.556 0.60
LDNO 132kV/EHV: Domestic Two Rate 2 0.611 0.256 0.60
LDNO 132kV/EHV: Domestic Off Peak (related MPAN) 2 0.258
LDNO 132kV/EHV: Small Non Domestic Unrestricted 3 0.558 0.77
LDNO 132kV/EHV: Small Non Domestic Two Rate 4 0.582 0.243 0.77
LDNO 132kV/EHV: Small Non Domestic Off Peak (related MPAN) 4 0.248
LDNO 132kV/EHV: LV Medium Non-Domestic 5-8 0.572 0.238 3.41
LDNO 132kV/EHV: LV Sub Medium Non-Domestic 5-8 0.888 0.370 6.42
LDNO 132kV/EHV: HV Medium Non-Domestic 5-8 0.732 0.398 54.91
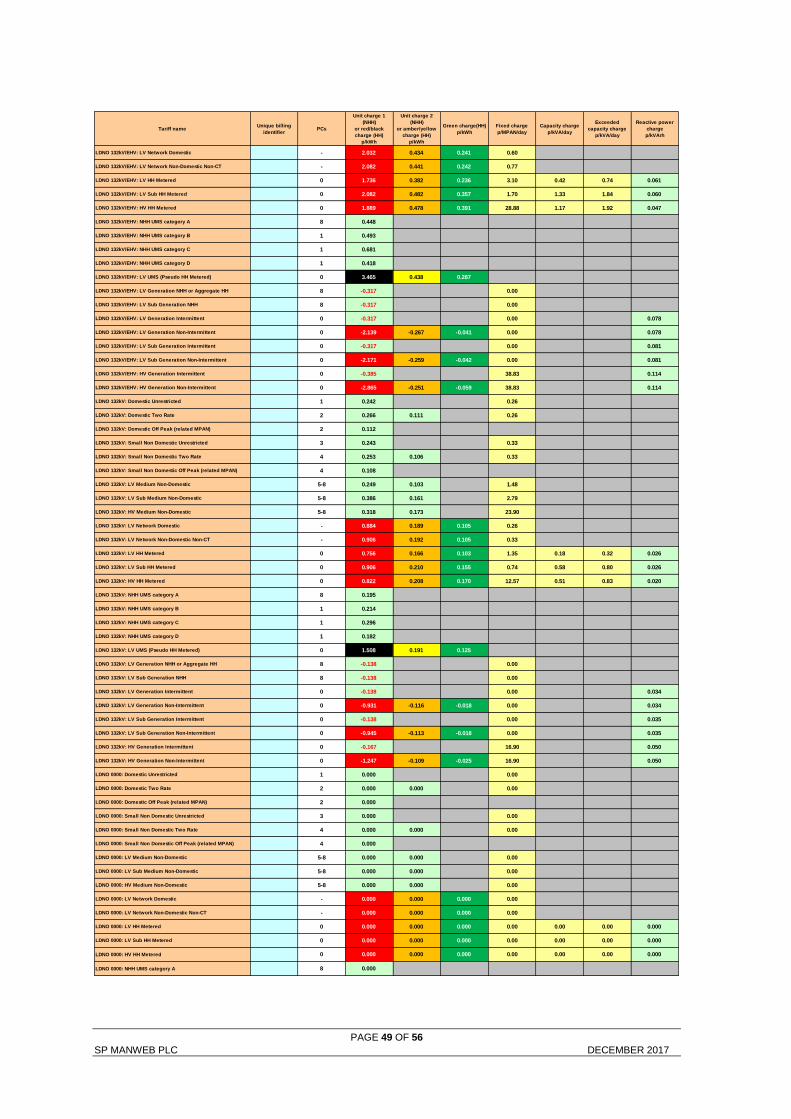
PAGE 49 OF 56 SP MANWEB PLC DECEMBER 2017
Tariff nameUnique billing
identifierPCs
Unit charge 1
(NHH)
or red/black
charge (HH)
p/kWh
Unit charge 2
(NHH)
or amber/yellow
charge (HH)
p/kWh
Green charge(HH)
p/kWh
Fixed charge
p/MPAN/day
Capacity charge
p/kVA/day
Exceeded
capacity charge
p/kVA/day
Reactive power
charge
p/kVArh
LDNO 132kV/EHV: LV Network Domestic - 2.032 0.434 0.241 0.60
LDNO 132kV/EHV: LV Network Non-Domestic Non-CT - 2.082 0.441 0.242 0.77
LDNO 132kV/EHV: LV HH Metered 0 1.736 0.382 0.236 3.10 0.42 0.74 0.061
LDNO 132kV/EHV: LV Sub HH Metered 0 2.082 0.482 0.357 1.70 1.33 1.84 0.060
LDNO 132kV/EHV: HV HH Metered 0 1.889 0.478 0.391 28.88 1.17 1.92 0.047
LDNO 132kV/EHV: NHH UMS category A 8 0.448
LDNO 132kV/EHV: NHH UMS category B 1 0.493
LDNO 132kV/EHV: NHH UMS category C 1 0.681
LDNO 132kV/EHV: NHH UMS category D 1 0.418
LDNO 132kV/EHV: LV UMS (Pseudo HH Metered) 0 3.465 0.438 0.287
LDNO 132kV/EHV: LV Generation NHH or Aggregate HH 8 -0.317 0.00
LDNO 132kV/EHV: LV Sub Generation NHH 8 -0.317 0.00
LDNO 132kV/EHV: LV Generation Intermittent 0 -0.317 0.00 0.078
LDNO 132kV/EHV: LV Generation Non-Intermittent 0 -2.139 -0.267 -0.041 0.00 0.078
LDNO 132kV/EHV: LV Sub Generation Intermittent 0 -0.317 0.00 0.081
LDNO 132kV/EHV: LV Sub Generation Non-Intermittent 0 -2.171 -0.259 -0.042 0.00 0.081
LDNO 132kV/EHV: HV Generation Intermittent 0 -0.385 38.83 0.114
LDNO 132kV/EHV: HV Generation Non-Intermittent 0 -2.865 -0.251 -0.059 38.83 0.114
LDNO 132kV: Domestic Unrestricted 1 0.242 0.26
LDNO 132kV: Domestic Two Rate 2 0.266 0.111 0.26
LDNO 132kV: Domestic Off Peak (related MPAN) 2 0.112
LDNO 132kV: Small Non Domestic Unrestricted 3 0.243 0.33
LDNO 132kV: Small Non Domestic Two Rate 4 0.253 0.106 0.33
LDNO 132kV: Small Non Domestic Off Peak (related MPAN) 4 0.108
LDNO 132kV: LV Medium Non-Domestic 5-8 0.249 0.103 1.48
LDNO 132kV: LV Sub Medium Non-Domestic 5-8 0.386 0.161 2.79
LDNO 132kV: HV Medium Non-Domestic 5-8 0.318 0.173 23.90
LDNO 132kV: LV Network Domestic - 0.884 0.189 0.105 0.26
LDNO 132kV: LV Network Non-Domestic Non-CT - 0.906 0.192 0.105 0.33
LDNO 132kV: LV HH Metered 0 0.756 0.166 0.103 1.35 0.18 0.32 0.026
LDNO 132kV: LV Sub HH Metered 0 0.906 0.210 0.155 0.74 0.58 0.80 0.026
LDNO 132kV: HV HH Metered 0 0.822 0.208 0.170 12.57 0.51 0.83 0.020
LDNO 132kV: NHH UMS category A 8 0.195
LDNO 132kV: NHH UMS category B 1 0.214
LDNO 132kV: NHH UMS category C 1 0.296
LDNO 132kV: NHH UMS category D 1 0.182
LDNO 132kV: LV UMS (Pseudo HH Metered) 0 1.508 0.191 0.125
LDNO 132kV: LV Generation NHH or Aggregate HH 8 -0.138 0.00
LDNO 132kV: LV Sub Generation NHH 8 -0.138 0.00
LDNO 132kV: LV Generation Intermittent 0 -0.138 0.00 0.034
LDNO 132kV: LV Generation Non-Intermittent 0 -0.931 -0.116 -0.018 0.00 0.034
LDNO 132kV: LV Sub Generation Intermittent 0 -0.138 0.00 0.035
LDNO 132kV: LV Sub Generation Non-Intermittent 0 -0.945 -0.113 -0.018 0.00 0.035
LDNO 132kV: HV Generation Intermittent 0 -0.167 16.90 0.050
LDNO 132kV: HV Generation Non-Intermittent 0 -1.247 -0.109 -0.025 16.90 0.050
LDNO 0000: Domestic Unrestricted 1 0.000 0.00
LDNO 0000: Domestic Two Rate 2 0.000 0.000 0.00
LDNO 0000: Domestic Off Peak (related MPAN) 2 0.000
LDNO 0000: Small Non Domestic Unrestricted 3 0.000 0.00
LDNO 0000: Small Non Domestic Two Rate 4 0.000 0.000 0.00
LDNO 0000: Small Non Domestic Off Peak (related MPAN) 4 0.000
LDNO 0000: LV Medium Non-Domestic 5-8 0.000 0.000 0.00
LDNO 0000: LV Sub Medium Non-Domestic 5-8 0.000 0.000 0.00
LDNO 0000: HV Medium Non-Domestic 5-8 0.000 0.000 0.00
LDNO 0000: LV Network Domestic - 0.000 0.000 0.000 0.00
LDNO 0000: LV Network Non-Domestic Non-CT - 0.000 0.000 0.000 0.00
LDNO 0000: LV HH Metered 0 0.000 0.000 0.000 0.00 0.00 0.00 0.000
LDNO 0000: LV Sub HH Metered 0 0.000 0.000 0.000 0.00 0.00 0.00 0.000
LDNO 0000: HV HH Metered 0 0.000 0.000 0.000 0.00 0.00 0.00 0.000
LDNO 0000: NHH UMS category A 8 0.000
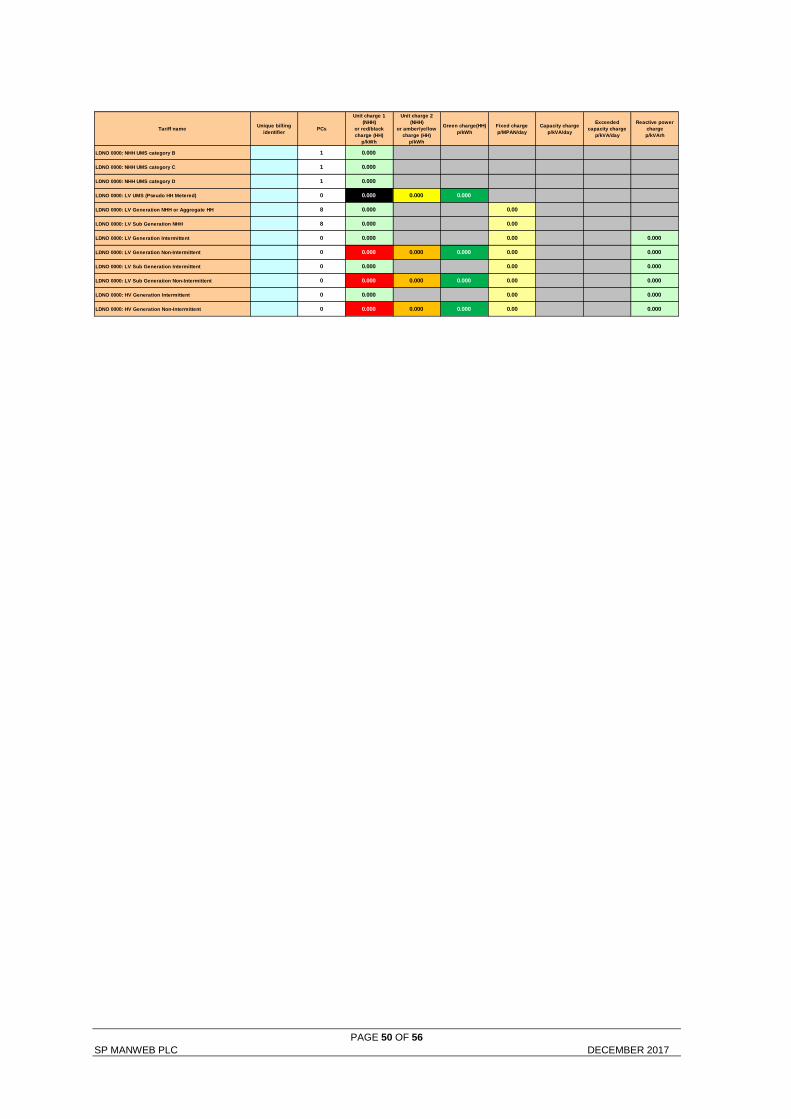
PAGE 50 OF 56 SP MANWEB PLC DECEMBER 2017
Tariff nameUnique billing
identifierPCs
Unit charge 1
(NHH)
or red/black
charge (HH)
p/kWh
Unit charge 2
(NHH)
or amber/yellow
charge (HH)
p/kWh
Green charge(HH)
p/kWh
Fixed charge
p/MPAN/day
Capacity charge
p/kVA/day
Exceeded
capacity charge
p/kVA/day
Reactive power
charge
p/kVArh
LDNO 0000: NHH UMS category B 1 0.000
LDNO 0000: NHH UMS category C 1 0.000
LDNO 0000: NHH UMS category D 1 0.000
LDNO 0000: LV UMS (Pseudo HH Metered) 0 0.000 0.000 0.000
LDNO 0000: LV Generation NHH or Aggregate HH 8 0.000 0.00
LDNO 0000: LV Sub Generation NHH 8 0.000 0.00
LDNO 0000: LV Generation Intermittent 0 0.000 0.00 0.000
LDNO 0000: LV Generation Non-Intermittent 0 0.000 0.000 0.000 0.00 0.000
LDNO 0000: LV Sub Generation Intermittent 0 0.000 0.00 0.000
LDNO 0000: LV Sub Generation Non-Intermittent 0 0.000 0.000 0.000 0.00 0.000
LDNO 0000: HV Generation Intermittent 0 0.000 0.00 0.000
LDNO 0000: HV Generation Non-Intermittent 0 0.000 0.000 0.000 0.00 0.000
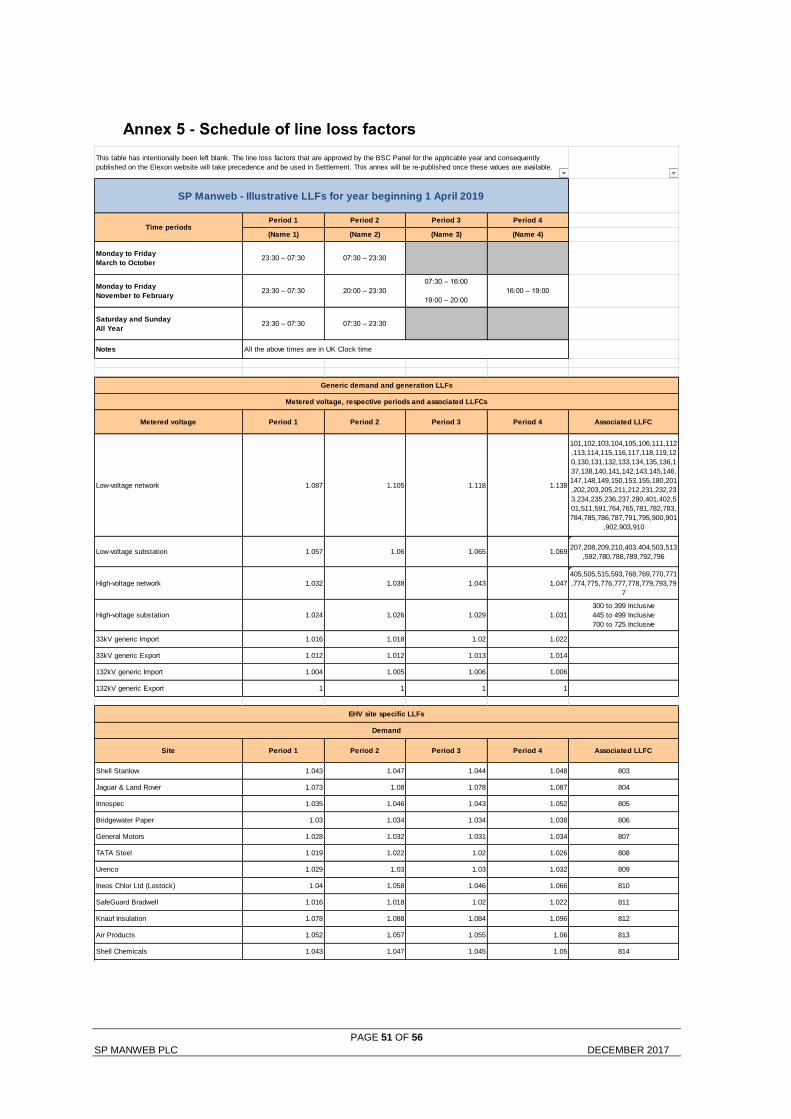
PAGE 51 OF 56 SP MANWEB PLC DECEMBER 2017
Annex 5 - Schedule of line loss factors
Period 1 Period 2 Period 3 Period 4
(Name 1) (Name 2) (Name 3) (Name 4)
Monday to Friday
March to October23:30 – 07:30 07:30 – 23:30
Monday to Friday
November to February23:30 – 07:30 20:00 – 23:30
07:30 – 16:00
19:00 – 20:00
16:00 – 19:00
Saturday and Sunday
All Year23:30 – 07:30 07:30 – 23:30
Notes
Metered voltage Period 1 Period 2 Period 3 Period 4 Associated LLFC
Low-voltage network 1.087 1.105 1.118 1.138
101,102,103,104,105,106,111,112
,113,114,115,116,117,118,119,12
0,130,131,132,133,134,135,136,1
37,138,140,141,142,143,145,146,
147,148,149,150,153,155,180,201
,202,203,205,211,212,231,232,23
3,234,235,236,237,280,401,402,5
01,511,591,764,765,781,782,783,
784,785,786,787,791,795,900,901
,902,903,910
Low-voltage substation 1.057 1.06 1.065 1.069207,208,209,210,403,404,503,513
,592,780,788,789,792,796
High-voltage network 1.032 1.038 1.043 1.047
405,505,515,593,768,769,770,771
,774,775,776,777,778,779,793,79
7
High-voltage substation 1.024 1.026 1.029 1.031
300 to 399 Inclusive
445 to 499 Inclusive
700 to 725 Inclusive
33kV generic Import 1.016 1.018 1.02 1.022
33kV generic Export 1.012 1.012 1.013 1.014
132kV generic Import 1.004 1.005 1.006 1.006
132kV generic Export 1 1 1 1
Site Period 1 Period 2 Period 3 Period 4 Associated LLFC
Shell Stanlow 1.043 1.047 1.044 1.048 803
Jaguar & Land Rover 1.073 1.08 1.078 1.087 804
Innospec 1.035 1.046 1.043 1.052 805
Bridgewater Paper 1.03 1.034 1.034 1.038 806
General Motors 1.028 1.032 1.031 1.034 807
TATA Steel 1.019 1.022 1.02 1.026 808
Urenco 1.029 1.03 1.03 1.032 809
Ineos Chlor Ltd (Lostock) 1.04 1.058 1.046 1.066 810
SafeGuard Bradwell 1.016 1.018 1.02 1.022 811
Knauf Insulation 1.078 1.088 1.084 1.096 812
Air Products 1.052 1.057 1.055 1.06 813
Shell Chemicals 1.043 1.047 1.045 1.05 814
This table has intentionally been left blank. The line loss factors that are approved by the BSC Panel for the applicable year and consequently
published on the Elexon website will take precedence and be used in Settlement. This annex will be re-published once these values are available.
All the above times are in UK Clock time
SP Manweb - Illustrative LLFs for year beginning 1 April 2019
Time periods
Generic demand and generation LLFs
Metered voltage, respective periods and associated LLFCs
EHV site specific LLFs
Demand
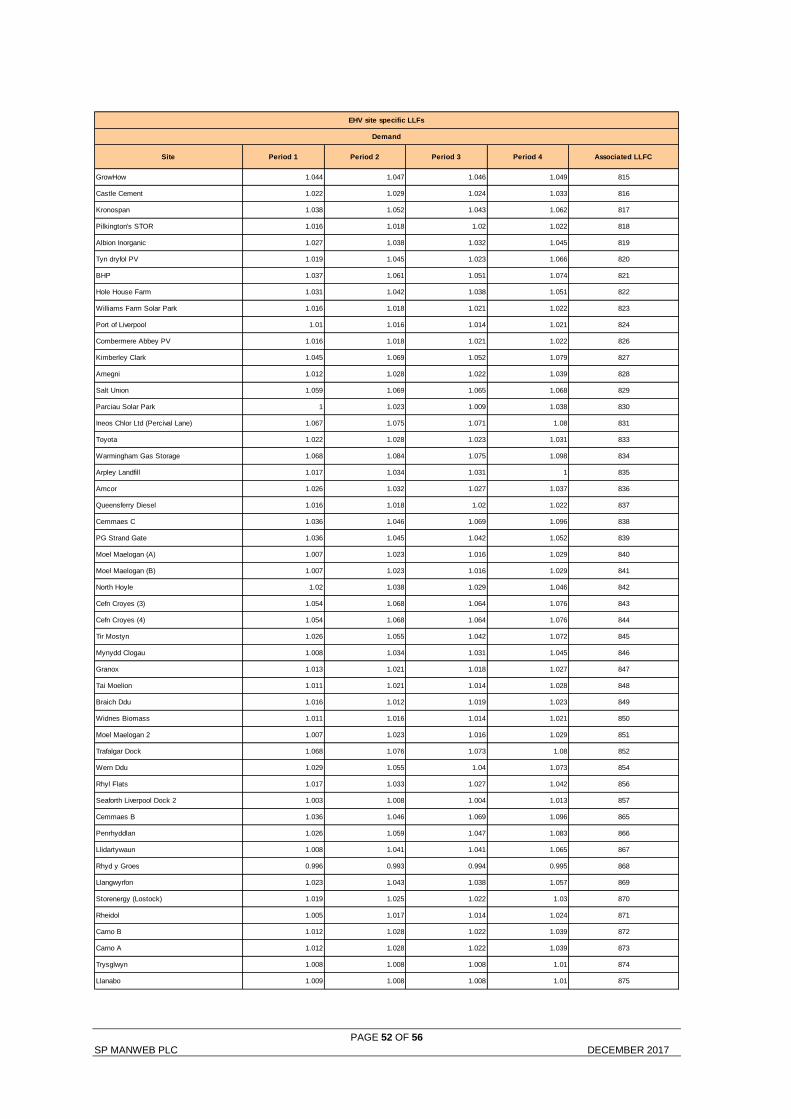
PAGE 52 OF 56 SP MANWEB PLC DECEMBER 2017
Site Period 1 Period 2 Period 3 Period 4 Associated LLFC
GrowHow 1.044 1.047 1.046 1.049 815
Castle Cement 1.022 1.029 1.024 1.033 816
Kronospan 1.038 1.052 1.043 1.062 817
Pilkington's STOR 1.016 1.018 1.02 1.022 818
Albion Inorganic 1.027 1.038 1.032 1.045 819
Tyn dryfol PV 1.019 1.045 1.023 1.066 820
BHP 1.037 1.061 1.051 1.074 821
Hole House Farm 1.031 1.042 1.038 1.051 822
Williams Farm Solar Park 1.016 1.018 1.021 1.022 823
Port of Liverpool 1.01 1.016 1.014 1.021 824
Combermere Abbey PV 1.016 1.018 1.021 1.022 826
Kimberley Clark 1.045 1.069 1.052 1.079 827
Amegni 1.012 1.028 1.022 1.039 828
Salt Union 1.059 1.069 1.065 1.068 829
Parciau Solar Park 1 1.023 1.009 1.038 830
Ineos Chlor Ltd (Percival Lane) 1.067 1.075 1.071 1.08 831
Toyota 1.022 1.028 1.023 1.031 833
Warmingham Gas Storage 1.068 1.084 1.075 1.098 834
Arpley Landfill 1.017 1.034 1.031 1 835
Amcor 1.026 1.032 1.027 1.037 836
Queensferry Diesel 1.016 1.018 1.02 1.022 837
Cemmaes C 1.036 1.046 1.069 1.096 838
PG Strand Gate 1.036 1.045 1.042 1.052 839
Moel Maelogan (A) 1.007 1.023 1.016 1.029 840
Moel Maelogan (B) 1.007 1.023 1.016 1.029 841
North Hoyle 1.02 1.038 1.029 1.046 842
Cefn Croyes (3) 1.054 1.068 1.064 1.076 843
Cefn Croyes (4) 1.054 1.068 1.064 1.076 844
Tir Mostyn 1.026 1.055 1.042 1.072 845
Mynydd Clogau 1.008 1.034 1.031 1.045 846
Granox 1.013 1.021 1.018 1.027 847
Tai Moelion 1.011 1.021 1.014 1.028 848
Braich Ddu 1.016 1.012 1.019 1.023 849
Widnes Biomass 1.011 1.016 1.014 1.021 850
Moel Maelogan 2 1.007 1.023 1.016 1.029 851
Trafalgar Dock 1.068 1.076 1.073 1.08 852
Wern Ddu 1.029 1.055 1.04 1.073 854
Rhyl Flats 1.017 1.033 1.027 1.042 856
Seaforth Liverpool Dock 2 1.003 1.008 1.004 1.013 857
Cemmaes B 1.036 1.046 1.069 1.096 865
Penrhyddlan 1.026 1.059 1.047 1.083 866
Llidartywaun 1.008 1.041 1.041 1.065 867
Rhyd y Groes 0.996 0.993 0.994 0.995 868
Llangwyrfon 1.023 1.043 1.038 1.057 869
Storenergy (Lostock) 1.019 1.025 1.022 1.03 870
Rheidol 1.005 1.017 1.014 1.024 871
Carno B 1.012 1.028 1.022 1.039 872
Carno A 1.012 1.028 1.022 1.039 873
Trysglwyn 1.008 1.008 1.008 1.01 874
Llanabo 1.009 1.008 1.008 1.01 875
EHV site specific LLFs
Demand
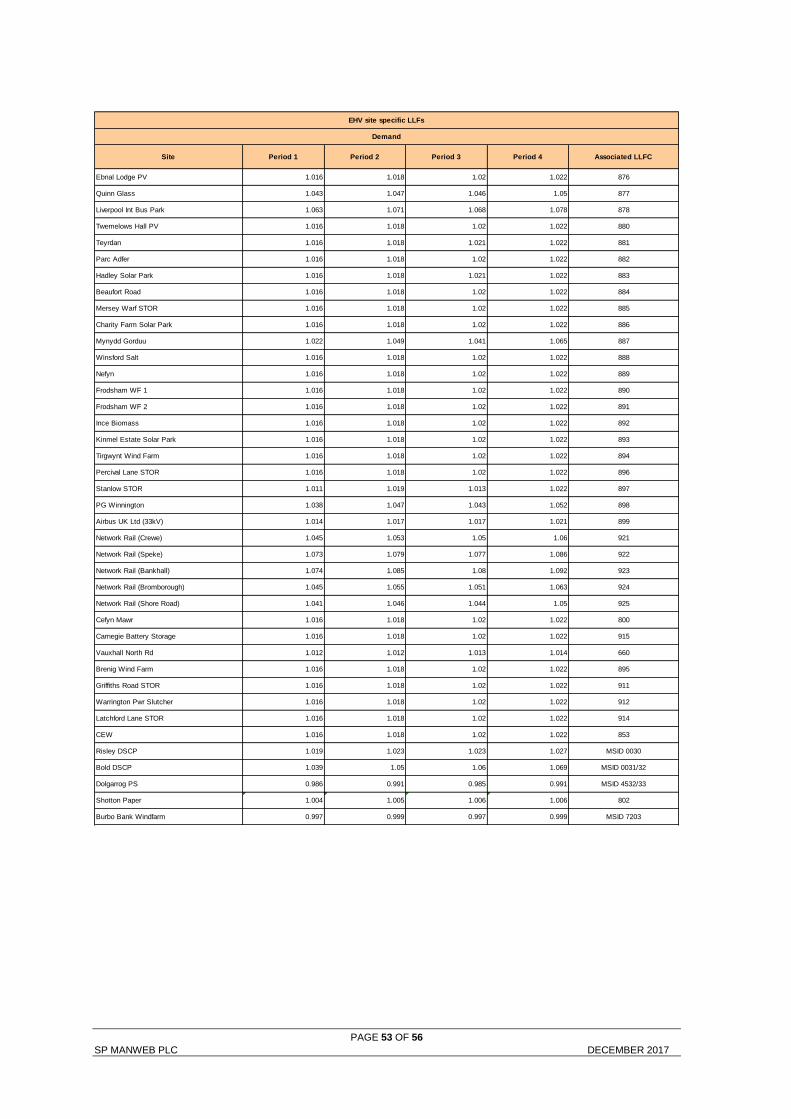
PAGE 53 OF 56 SP MANWEB PLC DECEMBER 2017
Site Period 1 Period 2 Period 3 Period 4 Associated LLFC
Ebnal Lodge PV 1.016 1.018 1.02 1.022 876
Quinn Glass 1.043 1.047 1.046 1.05 877
Liverpool Int Bus Park 1.063 1.071 1.068 1.078 878
Twemelows Hall PV 1.016 1.018 1.02 1.022 880
Teyrdan 1.016 1.018 1.021 1.022 881
Parc Adfer 1.016 1.018 1.02 1.022 882
Hadley Solar Park 1.016 1.018 1.021 1.022 883
Beaufort Road 1.016 1.018 1.02 1.022 884
Mersey Warf STOR 1.016 1.018 1.02 1.022 885
Charity Farm Solar Park 1.016 1.018 1.02 1.022 886
Mynydd Gorduu 1.022 1.049 1.041 1.065 887
Winsford Salt 1.016 1.018 1.02 1.022 888
Nefyn 1.016 1.018 1.02 1.022 889
Frodsham WF 1 1.016 1.018 1.02 1.022 890
Frodsham WF 2 1.016 1.018 1.02 1.022 891
Ince Biomass 1.016 1.018 1.02 1.022 892
Kinmel Estate Solar Park 1.016 1.018 1.02 1.022 893
Tirgwynt Wind Farm 1.016 1.018 1.02 1.022 894
Percival Lane STOR 1.016 1.018 1.02 1.022 896
Stanlow STOR 1.011 1.019 1.013 1.022 897
PG Winnington 1.038 1.047 1.043 1.052 898
Airbus UK Ltd (33kV) 1.014 1.017 1.017 1.021 899
Network Rail (Crewe) 1.045 1.053 1.05 1.06 921
Network Rail (Speke) 1.073 1.079 1.077 1.086 922
Network Rail (Bankhall) 1.074 1.085 1.08 1.092 923
Network Rail (Bromborough) 1.045 1.055 1.051 1.063 924
Network Rail (Shore Road) 1.041 1.046 1.044 1.05 925
Cefyn Mawr 1.016 1.018 1.02 1.022 800
Carnegie Battery Storage 1.016 1.018 1.02 1.022 915
Vauxhall North Rd 1.012 1.012 1.013 1.014 660
Brenig Wind Farm 1.016 1.018 1.02 1.022 895
Griffiths Road STOR 1.016 1.018 1.02 1.022 911
Warrington Pwr Slutcher 1.016 1.018 1.02 1.022 912
Latchford Lane STOR 1.016 1.018 1.02 1.022 914
CEW 1.016 1.018 1.02 1.022 853
Risley DSCP 1.019 1.023 1.023 1.027 MSID 0030
Bold DSCP 1.039 1.05 1.06 1.069 MSID 0031/32
Dolgarrog PS 0.986 0.991 0.985 0.991 MSID 4532/33
Shotton Paper 1.004 1.005 1.006 1.006 802
Burbo Bank Windfarm 0.997 0.999 0.997 0.999 MSID 7203
EHV site specific LLFs
Demand
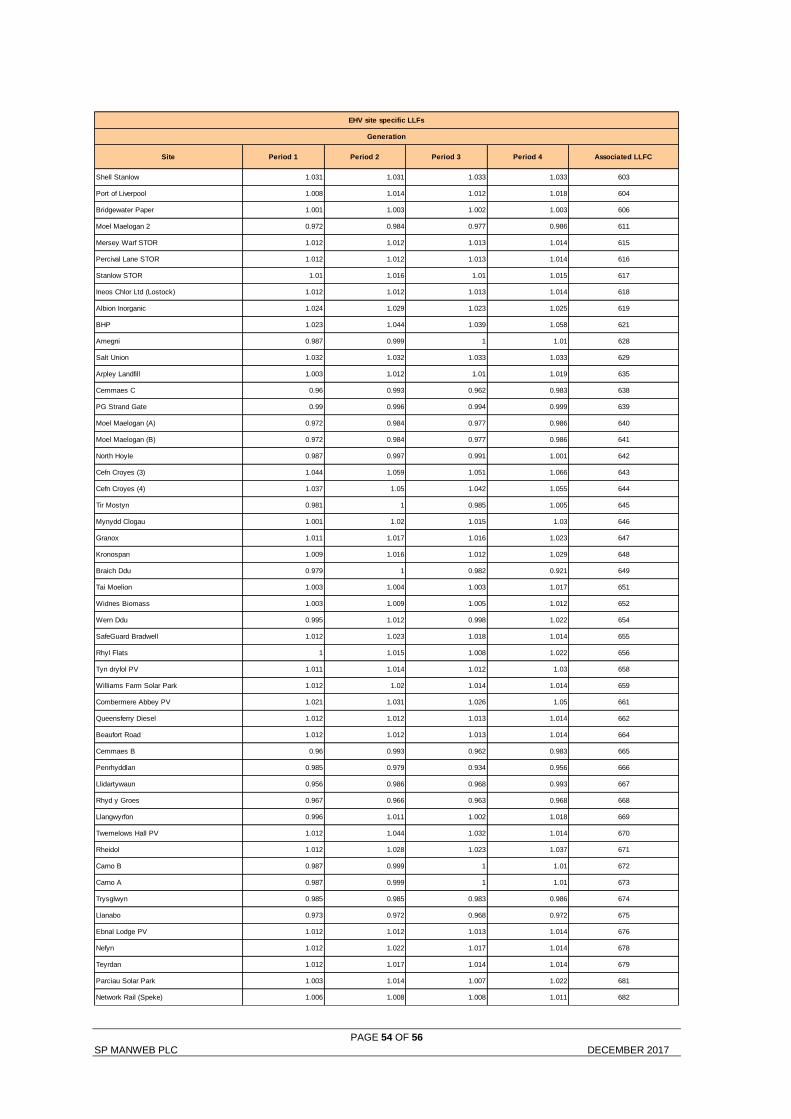
PAGE 54 OF 56 SP MANWEB PLC DECEMBER 2017
Site Period 1 Period 2 Period 3 Period 4 Associated LLFC
Shell Stanlow 1.031 1.031 1.033 1.033 603
Port of Liverpool 1.008 1.014 1.012 1.018 604
Bridgewater Paper 1.001 1.003 1.002 1.003 606
Moel Maelogan 2 0.972 0.984 0.977 0.986 611
Mersey Warf STOR 1.012 1.012 1.013 1.014 615
Percival Lane STOR 1.012 1.012 1.013 1.014 616
Stanlow STOR 1.01 1.016 1.01 1.015 617
Ineos Chlor Ltd (Lostock) 1.012 1.012 1.013 1.014 618
Albion Inorganic 1.024 1.029 1.023 1.025 619
BHP 1.023 1.044 1.039 1.058 621
Amegni 0.987 0.999 1 1.01 628
Salt Union 1.032 1.032 1.033 1.033 629
Arpley Landfill 1.003 1.012 1.01 1.019 635
Cemmaes C 0.96 0.993 0.962 0.983 638
PG Strand Gate 0.99 0.996 0.994 0.999 639
Moel Maelogan (A) 0.972 0.984 0.977 0.986 640
Moel Maelogan (B) 0.972 0.984 0.977 0.986 641
North Hoyle 0.987 0.997 0.991 1.001 642
Cefn Croyes (3) 1.044 1.059 1.051 1.066 643
Cefn Croyes (4) 1.037 1.05 1.042 1.055 644
Tir Mostyn 0.981 1 0.985 1.005 645
Mynydd Clogau 1.001 1.02 1.015 1.03 646
Granox 1.011 1.017 1.016 1.023 647
Kronospan 1.009 1.016 1.012 1.029 648
Braich Ddu 0.979 1 0.982 0.921 649
Tai Moelion 1.003 1.004 1.003 1.017 651
Widnes Biomass 1.003 1.009 1.005 1.012 652
Wern Ddu 0.995 1.012 0.998 1.022 654
SafeGuard Bradwell 1.012 1.023 1.018 1.014 655
Rhyl Flats 1 1.015 1.008 1.022 656
Tyn dryfol PV 1.011 1.014 1.012 1.03 658
Williams Farm Solar Park 1.012 1.02 1.014 1.014 659
Combermere Abbey PV 1.021 1.031 1.026 1.05 661
Queensferry Diesel 1.012 1.012 1.013 1.014 662
Beaufort Road 1.012 1.012 1.013 1.014 664
Cemmaes B 0.96 0.993 0.962 0.983 665
Penrhyddlan 0.985 0.979 0.934 0.956 666
Llidartywaun 0.956 0.986 0.968 0.993 667
Rhyd y Groes 0.967 0.966 0.963 0.968 668
Llangwyrfon 0.996 1.011 1.002 1.018 669
Twemelows Hall PV 1.012 1.044 1.032 1.014 670
Rheidol 1.012 1.028 1.023 1.037 671
Carno B 0.987 0.999 1 1.01 672
Carno A 0.987 0.999 1 1.01 673
Trysglwyn 0.985 0.985 0.983 0.986 674
Llanabo 0.973 0.972 0.968 0.972 675
Ebnal Lodge PV 1.012 1.012 1.013 1.014 676
Nefyn 1.012 1.022 1.017 1.014 678
Teyrdan 1.012 1.017 1.014 1.014 679
Parciau Solar Park 1.003 1.014 1.007 1.022 681
Network Rail (Speke) 1.006 1.008 1.008 1.011 682
Generation
EHV site specific LLFs
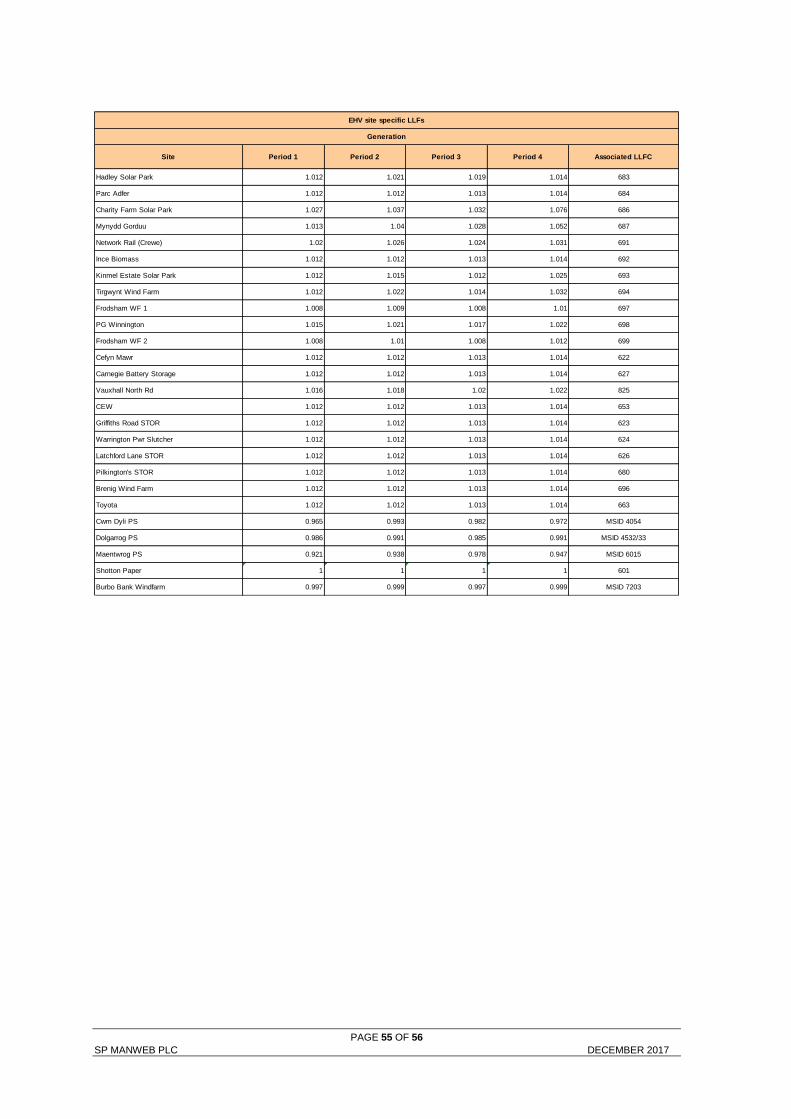
PAGE 55 OF 56 SP MANWEB PLC DECEMBER 2017
Site Period 1 Period 2 Period 3 Period 4 Associated LLFC
Hadley Solar Park 1.012 1.021 1.019 1.014 683
Parc Adfer 1.012 1.012 1.013 1.014 684
Charity Farm Solar Park 1.027 1.037 1.032 1.076 686
Mynydd Gorduu 1.013 1.04 1.028 1.052 687
Network Rail (Crewe) 1.02 1.026 1.024 1.031 691
Ince Biomass 1.012 1.012 1.013 1.014 692
Kinmel Estate Solar Park 1.012 1.015 1.012 1.025 693
Tirgwynt Wind Farm 1.012 1.022 1.014 1.032 694
Frodsham WF 1 1.008 1.009 1.008 1.01 697
PG Winnington 1.015 1.021 1.017 1.022 698
Frodsham WF 2 1.008 1.01 1.008 1.012 699
Cefyn Mawr 1.012 1.012 1.013 1.014 622
Carnegie Battery Storage 1.012 1.012 1.013 1.014 627
Vauxhall North Rd 1.016 1.018 1.02 1.022 825
CEW 1.012 1.012 1.013 1.014 653
Griffiths Road STOR 1.012 1.012 1.013 1.014 623
Warrington Pwr Slutcher 1.012 1.012 1.013 1.014 624
Latchford Lane STOR 1.012 1.012 1.013 1.014 626
Pilkington's STOR 1.012 1.012 1.013 1.014 680
Brenig Wind Farm 1.012 1.012 1.013 1.014 696
Toyota 1.012 1.012 1.013 1.014 663
Cwm Dyli PS 0.965 0.993 0.982 0.972 MSID 4054
Dolgarrog PS 0.986 0.991 0.985 0.991 MSID 4532/33
Maentwrog PS 0.921 0.938 0.978 0.947 MSID 6015
Shotton Paper 1 1 1 1 601
Burbo Bank Windfarm 0.997 0.999 0.997 0.999 MSID 7203
Generation
EHV site specific LLFs
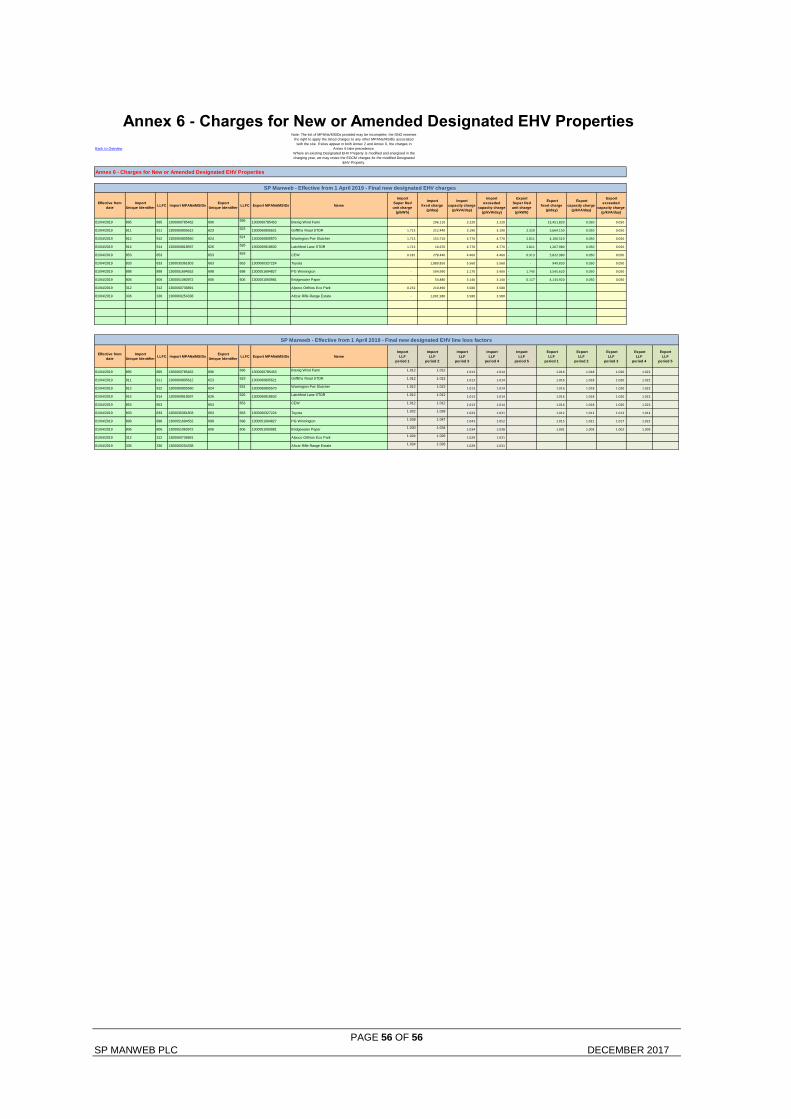
PAGE 56 OF 56 SP MANWEB PLC DECEMBER 2017
Annex 6 - Charges for New or Amended Designated EHV Properties
Back to Overview
Effective from
date
Import
Unique IdentifierLLFC Import MPANs/MSIDs
Export
Unique IdentifierLLFC Export MPANs/MSIDs Name
Import
Super Red
unit charge
(p/kWh)
Import
fixed charge
(p/day)
Import
capacity charge
(p/kVA/day)
Import
exceeded
capacity charge
(p/kVA/day)
Export
Super Red
unit charge
(p/kWh)
Export
fixed charge
(p/day)
Export
capacity charge
(p/kVA/day)
Export
exceeded
capacity charge
(p/kVA/day)
01/04/2019 895 895 1300060785462 696 696 1300060785453 Brenig Wind Farm - 296.110 3.220 3.220 - 23,451.820 0.050 0.050
01/04/2019 911 911 1300060805612 623 623 1300060805621 Griffiths Road STOR 1.713 212.440 3.190 3.190 2.320- 5,664.150 0.050 0.050
01/04/2019 912 912 1300060805560 624 624 1300060805570 Warrington Pwr Slutcher 1.713 153.710 4.770 4.770 2.811- 4,100.510 0.050 0.050
01/04/2019 914 914 1300060818597 626 626 1300060818602 Latchford Lane STOR 1.713 16.670 4.770 4.770 2.811- 1,267.980 0.050 0.050
01/04/2019 853 853 653 653 CEW 0.281 278.440 4.460 4.460 0.913- 5,822.980 0.050 0.050
01/04/2019 833 833 1300035361803 663 663 1300060327224 Toyota 1,880.850 5.560 5.560 - 949.830 0.050 0.050
01/04/2019 898 898 1300051694552 698 698 1300051694827 PG Winnington - 594.990 2.170 3.400 1.745- 3,545.620 0.050 0.050
01/04/2019 806 806 1300051060972 606 606 1300051060981 Bridgewater Paper - 54.880 3.140 3.140 0.117- 4,134.920 0.050 0.050
01/04/2019 312 312 1300060736891 Alpoco Orthios Eco Park 0.232 210.490 3.580 3.580
01/04/2019 336 336 1300060254338 Altcar Rifle Range Estate - 1,001.980 3.580 3.580
Effective from
date
Import
Unique IdentifierLLFC Import MPANs/MSIDs
Export
Unique IdentifierLLFC Export MPANs/MSIDs Name
Import
LLF
period 1
Import
LLF
period 2
Import
LLF
period 3
Import
LLF
period 4
Import
LLF
period 5
Export
LLF
period 1
Export
LLF
period 2
Export
LLF
period 3
Export
LLF
period 4
Export
LLF
period 5
01/04/2019 895 895 1300060785462 696 696 1300060785453 Brenig Wind Farm 1.012 1.012 1.013 1.014 1.016 1.018 1.020 1.022
01/04/2019 911 911 1300060805612 623 623 1300060805621 Griffiths Road STOR 1.012 1.012 1.013 1.014 1.016 1.018 1.020 1.022
01/04/2019 912 912 1300060805560 624 624 1300060805570 Warrington Pwr Slutcher 1.012 1.012 1.013 1.014 1.016 1.018 1.020 1.022
01/04/2019 914 914 1300060818597 626 626 1300060818602 Latchford Lane STOR 1.012 1.012 1.013 1.014 1.016 1.018 1.020 1.022
01/04/2019 853 853 653 653 CEW 1.012 1.012 1.013 1.014 1.016 1.018 1.020 1.022
01/04/2019 833 833 1300035361803 663 663 1300060327224 Toyota 1.022 1.028 1.023 1.031 1.012 1.012 1.013 1.014
01/04/2019 898 898 1300051694552 698 698 1300051694827 PG Winnington 1.038 1.047 1.043 1.052 1.015 1.021 1.017 1.022
01/04/2019 806 806 1300051060972 606 606 1300051060981 Bridgewater Paper 1.030 1.034 1.034 1.038 1.001 1.003 1.002 1.003
01/04/2019 312 312 1300060736891 Alpoco Orthios Eco Park 1.024 1.026 1.029 1.031
01/04/2019 336 336 1300060254338 Altcar Rifle Range Estate 1.024 1.026 1.029 1.031
SP Manweb - Effective from 1 April 2019 - Final new designated EHV charges
Annex 6 - Charges for New or Amended Designated EHV Properties
SP Manweb - Effective from 1 April 2019 - Final new designated EHV line loss factors
Note: The list of MPANs/MSIDs provided may be incomplete; the DNO reserves
the right to apply the listed charges to any other MPANs/MSIDs associated
with the site. If sites appear in both Annex 2 and Annex 6, the charges in
Annex 6 take precedence.
Where an existing Designated EHV Property is modified and energised in the
charging year, we may revise the EDCM charges for the modified Designated
EHV Property.