sp4 079-tr-1-e-e
TRANSCRIPT

Best Available Techniques for Control of Noise &Vibration
R&D Technical Report P4-079/TR/1
S Mitchell
Research Contractor:Environment Resources Management
R&D TECHNICAL REPORT P4-079/TR/1
Publishing OrganisationEnvironment Agency, Rio House, Waterside Drive, Aztec West, Almondsbury,BRISTOL, BS32 4UD.
Tel: 01454 624400 Fax: 01454 624409Website: www.environment-agency.gov.uk
© Environment Agency 2001 November 2001
ISBN 1 857 05722 8
All rights reserved. No part of this document may be reproduced, stored in a retrieval system,or transmitted, in any form or by any means, electronic, mechanical, photocopying, recordingor otherwise without the prior permission of the Environment Agency.
The views expressed in this document are not necessarily those of the Environment Agency.Its officers, servants or agents accept no liability whatsoever for any loss or damage arisingfrom the interpretation or use of the information, or reliance upon views contained herein.
Dissemination StatusInternal: Released to RegionsExternal: Released to Public Domain
Statement of UseThis project has considered the Best Available Techniques for the assessment and control ofboth noise and vibration from industrial and commercial sources. The information in thisdocument is for use as background information by Agency staff and others involved in theregulation of noise and vibration, however it is not intended to be a replacement for specialistadvice. At the date of publication of this report the Agency is consulting upon guidance noteson noise and vibration which describe the application of the general information given herein ina regulatory context.
Keywordsenvironmental noise, environmental vibration, best available techniques
Research ContractorThis document was produced under R&D Project P4-079 by:Environmental Resources Management, 8 Cavendish Square, London W1M 0ERTel: 020 7465 7200 Fax: 020 7465 7272 Website: www.erm.com
Environment Agency’s Project ManagerThe Environment Agency’s Project Manager for Project P4-079 was:Lorraine Powell, Environmental Protection National Service, Head Office, Bristol.

R&D TECHNICAL REPORT P4-079/TR/1 i
EXECUTIVE SUMMARY
This report provides a body of information on the measurement, assessment and control ofenvironmental noise from facilities and activities of the type covered by the IntegratedPollution Prevention & Control (IPPC) Directive and the Waste Management LicensingRegulations, although it could potentially be of wider application. Vibration is also addressedin an environmental context but detailed discussion on the subject is left to specialistpublications. This report forms an information source from which the Agency will developinternal guidance and training. The report is not intended to be used in isolation from therelevant Agency guidance for the purpose of regulatory decision-making.
Of necessity, the information is provided in summary form but reference is made to relevantstandards and guidance documents for further detail. The main topics covered include:
• an introduction to the effects of noise;• the measurement of noise and vibration;• calculation of noise levels;• prediction and modelling;• assessment techniques;• Best Available Techniques (BAT) for noise control, including; .
o principles of noise attenuation;o noise control equipment;o noise management practices;o planning noise control; ando costs, benefits and implications of noise control.
Almost inevitably noise permitting will require the setting of noise limits and there can becomplex issues associated with determining where limits should apply and an appropriatelevel to provide adequate environmental protection. Fortunately there is much existingguidance on noise assessment including British Standards and Planning Guidelines, elementsof which are applicable to the Agency’s regulatory remit. This report describes the scope andpurpose of the more relevant pieces of guidance material, but it has not been possible toextract a prescriptive method for establishing a noise limit as the setting of an appropriatelimit will always depend on local factors that cannot be discussed in general terms. AppendixD of the report outlines the standards that can be used and some of the additional factors thatneed to be considered in a given situation.
As part of the permitting process for IPPC the Agency will be involved in determining BATto prevent or minimise emissions of noise and vibration and balancing this against otheremissions or environmental impacts for a particular installation. The following optionswould normally be considered as part of the determination:
• use of inherently quiet processes• selection of quiet plant options;• site layout to maximise screening and separation distances;• orientation, bunding, barriers for noisy plant;• phasing of development/ operations ( eg landfill filling sequence);• noise attenuation equipment; and

R&D TECHNICAL REPORT P4-079/TR/1 ii
• noise management - plant maintenance, closing doors, locating mobile plant, restrictinghours of operation etc.
Community liaison is also an important element of noise management, and formal systemsare required which address complainants concerns and to feed into the central managementprocess for the operation.
Six case studies are included in the report to illustrate noise control in practice. Theydemonstrate a mixture of innovative and more standard ways to address noise emissions fromvarious facilities, and the difficulties, costs and benefits of each.

R&D TECHNICAL REPORT P4-079/TR/1 iii
CONTENTS
EXECUTIVE SUMMARY iii1 INTRODUCTION 11.1 Preamble 11.2 Background 11.3 Objectives of the Study 21.4 Structure of This Report 2
2 REVIEW OF NOISE AND VIBRATION ASSESSMENT METHODS 32.1 Introduction 32.2 The Effects of Noise 32.3 Measurement of Noise 52.4 Prediction of Noise 102.5 Assessment of Noise 11
3 BEST AVAILABLE TECHNIQUES FOR NOISE CONTROL 163.1 Introduction 163.2 How Sound is Attenuated 163.3 Sound Attenuation Through Structures 163.4 Noise Control Equipment 183.5 Noise management Practices 213.6 Planning Noise Control 23
4 COSTS, BENEFITS AND IMPLICATIONS OF NOISE CONTROL 254.1 Introduction 254.2 Cost Benefits 254.3 General Implications 264.4 Environmental Implications 27
5 CASE STUDIES 285.1 Introduction 285.2 Selection of Case Studies 285.3 Overview of Case Studies 285.4 Summary of Case Study 1 295.5 Summary of Case Study 2 295.6 Summary of Case Study 3 305.7 Summary of Case Study 4 305.8 Summary of Case Study 5 315.9 Summary of Case Study 6 315.10 Conclusions From Case Studies 32
BIBLIOGRAPHY 33
LIST OF FIGURES 34LIST OF TABLES 34
APPENDIX A GLOSSARY OF ACOUSTICS TERMINOLOGY 35APPENDIX B NOISE MEASUREMENTS AND CALCULATIONS 36APPENDIX C NOISE COMPLAINT AND NOISE MEASUREMENT FORMS 44APPENDIX D SUMMARY OF RELEVANT GUIDANCE DOCUMENTS
ON THE ASSESSMENT OF NOISE AND VIBRATION 46APPENDIX E NOISE CONTROL EQUIPMENT INFORMATION SHEETS 55APPENDIX F CASE STUDIES 66

R&D TECHNICAL REPORT P4-079/TR/1 1
1 INTRODUCTION
1.1 Preamble
Environmental Resources Management (ERM) were commissioned by the EnvironmentAgency under Contract HOC0335 to undertake a technical research study entitled;Determination of the Latest Best Available Techniques for Control of Noise and Vibrationand Their Applicability to Each of the Regimes with Regulatory Responsibility. The study isa desktop review of current noise assessment methodologies and noise and vibration controlpractices, including case studies. ERM appointed Acoustic Design Ltd as sub-consultants toassist in the case studies. The findings are presented in this R&D Technical Report in orderto assist the Agency in developing guidance material to Agency officers and the Operators offacilities covered by the Regulations.
1.2 Background
EC and UK environmental legislation has generally applied to separate aspects of theenvironment resulting in solutions for one environmental issue that may in some cases resultin adverse effects for another aspect. The Integrated Pollution Prevention and Control (IPPC)directive seeks to harmonise the process for a range of industrial activities.
In the UK noise is not currently considered under Integrated Pollution Control (IPC) exceptwhere recovery or disposal of waste is undertaken and, where there is a problem, regulation isdealt by Local Authorities, primarily through nuisance legislation. Noise is however aconsideration under the Waste Management Licensing Regulations which cover facilitiessuch as landfills, waste transfer stations and scrap metal processing. Noise is also a Planningconsideration and conditions may be imposed as part of the planning permission for a newindustrial development.
IPPC takes into account a range of environmental issues, including noise and vibration. As aresult of the new PPC Regulations (Pollution Prevention & Control (England & Wales)Regulations 2000), by which means the IPPC Directive is enacted in the UK, operators of awide range of activities will be required to make careful consideration of the noise emittedfrom their facilities as a part of the total environmental impact.
In future, permits issued under the PPC Regulations will seek to achieve a high level ofprotection for the environment as a whole and will require Best Available Techniques (BAT)to be employed. In determining BAT the technical characteristics of the installation, thegeographical location and local environmental conditions can, where appropriate, be takeninto consideration. The Environment Agency will be issuing guidance on what constitutesBest Available Techniques for different industry sectors and also for cross cutting issues suchas noise and vibration.
Permits will be issued according to a rolling timetable such that all industry sectors will bebrought under regulation by 2007. Administration of the PPC regime will be split betweenthe Agency and Local Authorities according to sector and, in some cases, throughput. Wherethe Agency is the primary regulator the view of the Local Authority will be sought as part ofthe formal consultation process. This is particularly relevant where there are issues relatingto noise and vibration. A protocol describing the interaction of the Agency and the LocalAuthorities at a local level has been drafted.
R&D TECHNICAL REPORT P4-079/TR/1 2
1.3 Objectives of the Study
The Environment Agency requires an up to date body of knowledge from which it candevelop guidance material on how to assess and control environmental noise from facilitiescovered by the IPPC Directive. This knowledge is to be assimilated into an R&D reportdescribing noise measurement protocols, assessment methodologies, the Best AvailableTechniques for noise control, and how these techniques fit into the new fully integratedapproach to pollution prevention. Whilst this report covers subject matter that is technical innature, it assumes no prior knowledge of acoustics and is not aimed at qualified acousticians.
1.4 Structure of This Repor t
The remainder of this report is structured as follows:
Section 2 provides an introduction to the effects of noise, describes measurementtechniques, and discusses assessment methodologies;
Section 3 summarises the Best Available Techniques for noise control;
Section 4 discusses the costs, benefits and environmental implications of noise control;
and
Section 5 summarises the case studies.
To aid the reader through the substantial volume of information that has been reviewed muchof the detailed information is given in the following Appendices:
Appendix A is a glossary of acoustics terminology;
Appendix B gives technical advice on noise measurement and calculations;
Appendix C gives forms for recording noise measurements;
Appendix D gives a review of relevant guidance material;
Appendix E contains 11 noise control information sheets; and
Appendix F gives full accounts of the case studies.

R&D TECHNICAL REPORT P4-079/TR/1 3
2 REVIEW OF NOISE & VIBRATION ASSESSMENT METHODS
2.1 Introduction
This chapter summarises best practice in noise and vibration measurement, prediction andassessment methodologies. In recent years several organisations have periodically producedguidance material on various aspects of environmental noise assessment, to the extent thatthere are now numerous guidelines that may be helpful in a given situation. Indeed, there isnow a vast extent of knowledge in the field of acoustics, as indicated by the size of the UK'sInstitute of Acoustics, which now has over 2000 members or associate members. Hence, it isnot appropriate to raise new issues in this section, but rather to summarise the consensus viewthat existing material provides for the situations likely to be encountered in the IPPCpermitting process.
There is a common approach that involves, measuring ambient noise levels, measuring orpredicting the new or problematic noise, and assessing the new noise against the backgroundnoise and/or absolute noise level criteria. However, a view shared by many experts inenvironmental noise assessment is that the impact of noise on a community, in a particularsituation, cannot be assessed by following a series of mechanical procedures. The process bywhich noise effects people is simply too complex and local conditions will call for flexibilityand judgement to be used. Indeed, this is recognised in Planning Policy Guidance 24,Planning and Noise (1994) which introduces the concept of Noise Exposure Categories ratherthan a simple set of yes/no noise criteria. Hence, this chapter does not include a proceduralmethod of assessing noise impacts, but rather guides the reader to existing guidance materialthat is particularly relevant in the context of the IPPC/Waste Management LicensingRegulations.
Whilst this chapter aims to provide easily accessible guidance on noise assessmenttechniques, it should be recognised that environmental noise is a complex scientific subjectworthy of further study. For example, the Institute of Acoustics offers a training courseleading to a certificate of competence for measuring environmental noise and there areseveral universities offering Bachelor and Masters of Science courses in acoustics andenvironmental noise.
A range of guidance has been reviewed during preparation of this document. Since thepurpose of this document is to offer the most recent appropriate guidance, sources that arenow obsolete have not been discussed in detail. Reference has been made to these documentsin the Bibliography. For example, guidance from the Institution of Gas Engineers is likely tohave been widely used when it was produced in 1990. However, it is now out of print andhas largely been superseded by the other more recent national standards that are discussed inthe following sections.
2.2 The Effects of Noise
The effects of noise on human beings are summarised in Figure 2.1. This illustrates hownoise complaints and annoyance can be caused through various effects. When considering apermit level, the potential for complaints should be considered. When complaints about anexisting facility that is licensed have been received, the reason for the complaints should beinvestigated. This is discussed further in Section 3.5.5.

R&D TECHNICAL REPORT P4-079/TR/1 4
Figure 2.1 Cause and Effect Relationships for Noise
Noise induced hearing loss is not a concern at the levels of noise experienced by neighboursof noise emitting facilities. It is only a potential hazard above noise levels of at least 80dB(A) and where exposure is over very long periods of time. The potential risk to workers isdealt with by the Health and Safety Executive and in some cases by Local Authorities.
A distinction is made between disturbance and annoyance. Someone is disturbed by noisewhen it prevents or inhibits them from undertaking an everyday activity such asconcentrating while reading (distraction), hearing spoken conversation, listening to the radioor sleeping. The feeling of displeasure caused by noise is annoyance. Annoyance is often aresult of disturbance but not necessarily, and it can be influenced by socio-psychologicalfactors, such as a bias for or against the facility or person making the noise, of theenvironmental expectations of an individual. Whereas disturbance can be assessedanalytically, annoyance is measured by social survey questioning, and over the years hasbeen used as a common indicator of overall community noise impact.
Other effects may occur as a result of vibration. These include: perceptible vibration,secondary rattling of windows, items on shelves and pictures hanging on walls. In addition,the sound radiated from vibrating walls may give rise to indirect effects. These effects maycontribute to annoyance.
7 Noise inducedhearing loss
8 Other health effects
Physiological
Disturbance:1 Distraction2 Speech3 Tasks4 Sleep
5 Annoyance6 Complaints/
Actions
Behavioural
Noise
Socio-psychological
factors
Biological Responses

R&D TECHNICAL REPORT P4-079/TR/1 5
2.3 Measurement of Noise
2.3.1 Noise Measurement Equipment
Various types of noise measurement equipment are commercially available. The rangeincludes equipment that is capable of measuring basic time varying sound pressure level andequipment that is capable of calculating statistical noise indices over time. The first level ofsophistication is an integrating or integrating averaging sound level meter that is capable ofmeasuring the ‘A’ weighted equivalent sound level, LAeq. Appendix A gives a glossary ofacoustic terminology. Appendix B describes the decibel scale and provides further details onnoise measurements techniques and calculations. The next level of sophistication is a meterthat can calculate statistical noise measurement parameters such as LA90, LA10, LA01, the levelsexceeded 90, 10 and 1 percent of the measurement period. This type of noise meter is calleda statistical analyser or a statistical sound level meter. A typical example is shown in Figure2.2.
Figure 2.2 A Statistical Sound Level Meter
The equipment may be switched on and off manually when sufficient data has been collected,or may be equipped with a noise logging facility. This will allow the meter to be set-up totake one sample over a pre-defined period, store the result in its memory, start anothermeasurement, and repeat the process continuously.
The above meters will all be able to measure in terms of dB(A) noise levels. This is the mostcommonly used scale for environmental noise studies. More sophisticated noise equipmenthas additional internal frequency filters that enable measurements to be made in frequencybands. The filters can measure the octave band components of the sound, and in some cases,the narrower 1/3rd octave bands. Measurements in these bands can generally be used todetermine if noise contains distinctive tonal components which can make the noise moreannoying and require special attention in one of the most commonly used assessmentmethods. Appendix B gives examples. It is also useful to know the frequency content of anoise source when calculating noise attenuation from screens and enclosures and whenconsidering ground absorption in predictions as these effects are all frequency dependent. Ingeneral it is harder to abate lower frequency noise (see Section 3.3)

R&D TECHNICAL REPORT P4-079/TR/1 6
The human ear is an extremely sensitive organ with a very large dynamic range over a widerange of frequencies. To cater for this dynamic range the decibel (dB) scale is logarithmicallowing the full range of audible sound levels to be expressed as a number between 1 dB(the threshold of perception) and about 140 dB (the threshold of pain). The frequency rangethat most of us can hear falls within the range 20 to 20,000 Hz. Because the ear is much lesssensitive to lower frequencies than to higher ones sound level meters are adjusted to mimicthis response. This is done by the inclusion of a sound filter, called the A-weighting. Usingthe A-weighting the levels measured by a sound level meter are comparable with the levelswe perceive.
In some circumstances, tape recorders provide a useful means of capturing an event for lateranalysis. This will be useful when the event is rare or when it is expensive to repeat a certainoperation for measurement purposes. An audio recording must be calibrated if absolutelevels are required. Audio recording for analytical purposes is probably best left to anexperienced consultant. Even an un-calibrated recording can be a useful memory aid whenwriting a report following a site visit. Generally, DAT recorders have now replacedtraditional tape machines. The use of mini-disk recorders is becoming more common in theacoustics industry, although care may be required if the equipment uses a signal compressionsystem.
Some meters are able to switch a tape recorder into record mode, and to start internal analysissoftware, during noise events above a specified noise level. This again allows measurementsto be made of occasional events without an operator present during the measurements.
It is often useful to record the variation in noise over time in a graphical form. This has beentraditionally done by calibrating a paper trace so that it displays a time history of the soundpressure level. However, with advances in electronics, noise graphs showing noise variationover time can be made electronically for presentation in reports (see Appendix B). The mostadvanced of the electronic systems allow individual events to be marked to identify the noisesource responsible for a particular noise level.
When it is important to isolate the contribution from a particular plant item to the total noiseoutput more complex measurements may be required. Sometimes a combination ofmeasurements with a sound level meter made close to different plant and calculations, can beused to predict the contributions. In a crowded plant area, an intensity meter may be used.An example of a situation in which this technique may be useful would be to estimate theeffect of silencing a particular machine. The advantage of this type of meter in this situationis that noise in only a particular direction can be measured. The noise contributions fromother plant in the area can be virtually eliminated. This type of meter is now generallyavailable but is expensive and complex to use. However, in the hands of a skilful userintensity meters can be used to identify the noise output of plant items in terms of theirindividual sound power level and to demonstrate that it would be useful to focus noise controleffort on certain key sources. The accuracy of results in all cases will also depend onpractical measurement constraints such as access limitations to key plant that could make itdifficult to take appropriate measurements.

R&D TECHNICAL REPORT P4-079/TR/1 7
2.3.2 Vibration Measurement Equipment
Vibration measurements are unlikely to be required in the majority of environmentalassessment situations since the vibration sensitive buildings are likely to be far enough fromthe plant to avoid vibration impacts.
However, equipment is available to carry out measurements in cases where vibration isperceptible off-site. The equipment used for an investigation should either be capable ofmeasuring peak particle velocity (ppv) or vibration dose values (VDV). The former isnormally used to assess the potential for building damage and the latter is used to assess thepotential for annoyance. VDV suffers from inherent complexities and a simpler approachmay be appropriate to establish if there is potential for perceptible effects in the first instance.It is possible to establish if vibration would be perceptible by a simpler measurement of eitherppv or rms velocity (root mean square velocity). Since the assessment of vibration is morecomplex than airborne noise, it is recommended that a subjective judgement is maderegarding perceptibility. If vibration may be an issue, then expert advice should be sought.
2.3.3 Measurement Techniques
Where to Measure
The choice of measurement location is often not straightforward where noise permitting isconcerned. Clearly as a general principle we are interested in the noise level that isexperienced by the effected person or people. This usually implies we would like to measureoutside the window to the buildings that they occupy. But there can be reasons why this isnot practical and measurement must be taken elsewhere. BS4142 Method for Ratingindustrial noise affecting mixed residential and industrial areas, is relevant, and states:
Choose measurement positions that are outside buildings that will give results that arerepresentative of the ... levels at the buildings where people are likely to be affected.
Clearly when investigating a complaint of excessive noise, measurements should be taken atthe complainants property, and access will not be a problem. Measurements may be takeninside and outside the building. Permit levels will be set outside the windows to noisesensitive rooms, on the basis that the attenuation through an open window will beapproximately equal for any noise sensitive building (this is the basis of applicable noisestandards for environmental noise). But it will not always be possible to carry out noisemonitoring at the receiver’s building because access may not be available.
The site boundary is a readily available location for setting a permit level which can bechecked. If receivers are close to the boundary the situation is straightforward, but if not itwould imply calculating noise levels at the receivers. Appendix B gives some examples ofhow this can be done, but calculation will not be as accurate as measurement and it shouldalways be considered preferable to enforce noise limits by measurement at sensitivereceivers.
A planning condition may already have been set limiting noise emissions beyond the siteboundary in order to safeguard future noise sensitive development in the vicinity. In caseswhere new noise sensitive development is possible then enforcing noise levels at the siteboundary may be appropriate.

R&D TECHNICAL REPORT P4-079/TR/1 8
There can be problems with measuring at site boundaries due to local screening effects, forexample by a boundary wall. In these cases the monitoring location should to chosen to bestmimic the screening effect at the nearest receivers, so that any interpolation by calculation isas simple as possible, in order to minimise the error in the calculation process. Judgementwill be required to determine the best compromise location to the adopted, but it shouldalways be chosen to be as representative of the levels at noise sensitive buildings as possible.
BS 7385 (1) describes a measurement method for vibration. Locations for measurement arerecommended. BS 6472 (2) relates to measurements affecting human exposure to vibration.The guidance in this standard suggests that measurements should be made at the locationswhere people will be affected by the vibration eg living or sleeping areas.
Measurement Procedures
Measurement microphones are prone to slight changes in sensitivity under changing climaticconditions and it is important that all equipment is calibrated so that measurements arerobust. The equipment will need to be returned to a laboratory for full calibration at intervalsof one to two years. Equipment should conform with the relevant standards (including BSEN 60651: 1994, BS EN 60804: 1994 and BS EN 60942: 1998). The calibration of noisemeasurement equipment should be checked on-site before and after measurement with anacoustic calibrator. Vibration calibrators are also available for some equipment which can beused in an equivalent way.
Standard measurement methodologies, for noise measurement, are contained in BS 7445 (3)
(which is equivalent to ISO 1996) and BS 4142 (4). The relevant conditions can besummarised as follows:
• measurements should be taken between 1.2 to 1.5 m above the ground;• measurements should either be taken under free-field conditions (more than 3.5 m from
any reflecting surface) or at 1 m from the facade of a building and results treatedaccordingly (when a noise source is incident on a facade, the effect of reflected noise fromthe facade is generally to increase the ‘facade level’ measured at 1m by 3 dB); and
• measurements should not be made if average wind speed exceeds 5 m/s.
Appendix C contains standard forms that can be used for recording noise complaints andmeasurements.
Environmental noise measurements are subject to an unavoidable tolerance that may be dueto:
• weather;• source term variation;• ground attenuation effects; and• time of measurement and duration.
(1) BS 7385 Evaluation and measurement for vibration in buildings Part 1 Guide for measurement of vibrations and evaluation of their effects onbuildings, BSi, 1990.(2) BS 6472 Guide to Evaluation of human exposure to vibration in buildings (1 Hz to 80 Hz), BSi, 1992.(3) BS 7445 Description and measurement of environmental noise Parts 1 to 4, BSi, 1991.(4) British Standard BS 4142 Method for rating industrial noise affecting mixed residential and industrial areas, Bsi (1997).

R&D TECHNICAL REPORT P4-079/TR/1 9
These are discussed below.
Weather - Noise propagation can be affected by wind and temperature gradients and changesin relative humidity. Fog, snow and thick mist may also affect the noise levels that arerecorded. Wind may affect the results by causing rustling of foliage, buffeting themicrophone or enhancing or inhibiting the propagation or sound. Wind speeds above 5 m/sshould be avoided. Measurements over large distances can show substantial variations withwind direction, with typically 2dB increases downwind and up to 10dB decreases upwindbeing possible. Dry weather and calm conditions are preferred.
Source Strength Variation - Variations in operating patterns of the licensed facility should beconsidered when taking measurements. The measurement should be taken over a period thatis sufficient to obtain a representative sample. If the noise is intermittent or cyclic, a numberof cycles may need to be recorded including the noisiest operational modes. Records ofoperational conditions during measurements should be obtained from the operator of thefacility.
Ground Attenuation Effects - The presence of acoustically soft ground can lead to a reductionin noise level at the receptor due to absorption of noise energy reflected from the groundparticularly where propagation distances are high. Examples of acoustically Soft ground aregrassed areas, areas under crops, and forests with ground covering vegetation. Areas that areconcreted or otherwise sealed, or areas of water are acoustically hard. The presence of softground between the facility and the receptor point should be noted. If the effect is seasonaldue to variations in ground cover, measurements may need to be taken at a time when groundcover is at a minimum if this corresponds to a time when public reaction is likely to behighest. Alternatively, measurements could be made close to items of plant and a predictioncould be made with no attenuation factor for ground attenuation included. This wouldindicate the highest likely noise levels that would be experienced at the receptors.Extrapolated levels may be subject to some uncertainty and it is not uncommon for predictedresults to be quoted along with an estimate of accuracy.
Time of Measurement and Duration - The time at which measurements are made may affectthe noise levels that are measured. If a survey is intended to establish background noise levelfrom which noise limits will be derived for a new facility the following should apply:
• the survey should include night-time measurements unless the facility will not operate atnight;
• night-time measurements will normally take place between midnight to 0400 hours (whentraffic noise and other human activity is at its lowest);
• if the maximum difference between the noise level from the facility and the backgroundnoise level is expected to occur during a time other than the night, a further survey shouldbe carried out during that period.
When a survey is designed to check ambient noise levels with a facility operating, the surveyshould include night-time measurements when background noise levels are normally at theirlowest so that the noise contribution from the plant is at its highest.
Measurements should be carried out over a sufficient period of time to establish typicalaverage noise levels, and if necessary, maximum noise levels, from the facility. Appendix B

R&D TECHNICAL REPORT P4-079/TR/1 10
gives further information on measurement periods. It is good practice to repeatmeasurements to gain extra certainty in the results because of all the factors described above.
Noise measurements made within buildings may require different considerations, and variousguidelines are available, such as those produced by the Association of Noise Consultants (5).
2.4 Prediction of Noise
2.4.1 Why Are Predictions Necessary?
Noise predictions are useful in two main situations:
• At a proposed facility where noise must be quantified before construction to ensure that nonoise problems will result from the facility and to allow a permit noise limit to be set.
• At existing sites where there is a need to review the effectiveness of various noise controltechniques and to enable a reasonable permit level to be established that takes into accountthe Best Available Techniques to limit noise.
It should however be noted that a predicted noise level will not be as accurate as a measuredone.
2.4.2 How Are Noise Predictions Car r ied Out?
Common prediction methods are discussed in this section. The main methods that are used topredict noise in the UK are CONCAWE (6) , EEMUA (7) , and BS 5228 (8). Otherstandards also exist for prediction.
For complex sites computer programs are useful. These implement a range of standardswhich is often dependent on the country of origin of the prediction program. Standardcomputer programs implement:
• ISO 9613 Part 1 /Part 2 (9)• CONCAWE• EEMUA• standards for industrial noise from Germany, Scandinavia, and Austria.
Whilst noise from mechanical plant can generally be quantified quite reliably, the predictionof variable source noise from gas flares etc can only be achieved by consulting the methodsdeveloped in specialist research papers. These specialist areas are not generally included inthe computer programs.
(5) Association of Noise Consultants Guidelines – Noise measurements in buildings (ANC-C9801) – Part 2: Noise from external sources (eg trafficnoise) within buildings, 1998, Association of Noise Consultants.(6) The propagation of noise from petroleum and petrochemical complexes to neighbouring communities, CONCAWE, Den Haag, 1981.(7)Guidance on the use of noise specification EEMUA publication 141, The Engineering Equipment and Materials Users Association (EEMUA),1985(8) Noise control on construction and open sites: BSi, 1997.(9) ISO9613 Acoustics - Attenuation of sound during propagation outdoors, ISO, 1993.

R&D TECHNICAL REPORT P4-079/TR/1 11
The basic method in BS 5228 can be implemented at a simple level if the factors such asground absorption and air absorption are not critical to the assessment. This will oftenprovide a quick method of carrying out an initial assessment. Care must be taken to applycorrection factors that are appropriate to the source involved. For instance, the groundabsorption factors in BS 5228 are intended for use with construction plant and should not beused without checking that the frequency content of equipment under investigation is likelyto be consistent with the construction plant in BS 5228. BS 5228 does not include a methodof predicting noise from plane or line sources, such as buildings louvres and large plant.
2.4.3 Advantages and Disadvantages of Noise Predictions
Table 2.1 shows some advantages and disadvantages of various aspects of noise modelling.
Table 2.1 Advantages and Disadvantages of PredictionAdvantage Disadvantage CommentCost Reduces abortive/ineffective noise control spend
Cost Expensive to set up accurate prediction for small sites.Cost of software can be significant.
Strategicinformation
Focuses effort on important sources
Uncertainty inoutput
Any noise prediction is subject to variation due touncertainty in input parameters. Measurement may berequired to supplement the modelling approach.
Complex The complexity of a model will depend on variousfactors. Suitable qualified practitioners should beconsulted before establishing modelling technique.
At existing plants, a combination of modelling and measurement can be the most effectiveapproach. Measurements can be made to establish the noise output from the facility. Ifchanges to a particular plant item are being considered, the effect of replacing it with aquieter item can be predicted. Predictions are only required for the equipment items that maybe subject to change using this method.
2.5 Assessment of Noise
2.5.1 Introduction
The licensing system applies to two situations:
• greenfield sites where no industrial noise is currently audible and a new facility isproposed; and
• areas where noise from industrial and commercial facilities has been a significant featureof the environment for a long period.

R&D TECHNICAL REPORT P4-079/TR/1 12
• There is a need to consider the relevant assessment approach. In the UK, some guidance(eg BS 4142 (10)) compares background levels with the new noise from a plant. Absolutelevels can also be considered, for example to assess the effect on sleep which is triggeredat an absolute level independent of the location. Even when a noise limit is set as anabsolute level, one may need to consider the existing ambient levels if they are alreadyclose to the limit that is to be set.
In all cases, it will be important that the local conditions are taken into account. Consultationwith the Local Authority will be helpful when determining the approach to be adopted.
2.5.2 Relevant Methodologies
Guidance that is applicable to the IPPC and the waste management licensing regime aresummarised below. Appendix D gives a fuller explanation of each document.
Planning Policy Guidance PPG24
PPG24 outlines the Government’s view on noise and planning. The guidance focuses on theplanning of new noise-sensitive development in already noisy environments (PAN 56 (11) inScotland and TAN11 in Wales are very similar). In the case of proposed noise-producingdevelopment affecting existing noise-sensitive premises, PPG24 advises that British StandardBS 4142 can be used, within its own terms of reference, to predict the likelihood ofcomplaints. PPG24 draws attention to the greater potential for complaints to arise ifindustrial noise has tonal or impulsive characteristics.
British Standard BS 4142
The test that is generally applied to assess the potential for noise from fixed installations togive rise to community response is contained in British Standard BS 4142: 1997. BS 4142describes a method for desegregating industrial and background noise levels outsideresidential buildings and for assessing whether the industrial noise is likely to give rise tocomplaints from the occupants.
The BS 4142 assessment methodology involves comparing the existing background levelwith the noise from the industrial development. The industrial noise level is adjusted to allowfor any tonal or impulsive characteristics (+ 5 dB), and is called the Rating Level. Thedifference between the two levels can be used to indicate the likelihood of complaints arising.Appendix D gives further details.
There is a feeling within the industry that a revision to BS 4142 should be considered after itcomes up for review in 2002, particularly with regards to the rating method.
(10) British Standard BS 4142 (1997) Method for rating industrial noise affecting mixed residential and industrial areas.(11) Planning Advisory Note 56 Planning and Noise, Scottish Office, 1999.
R&D TECHNICAL REPORT P4-079/TR/1 13
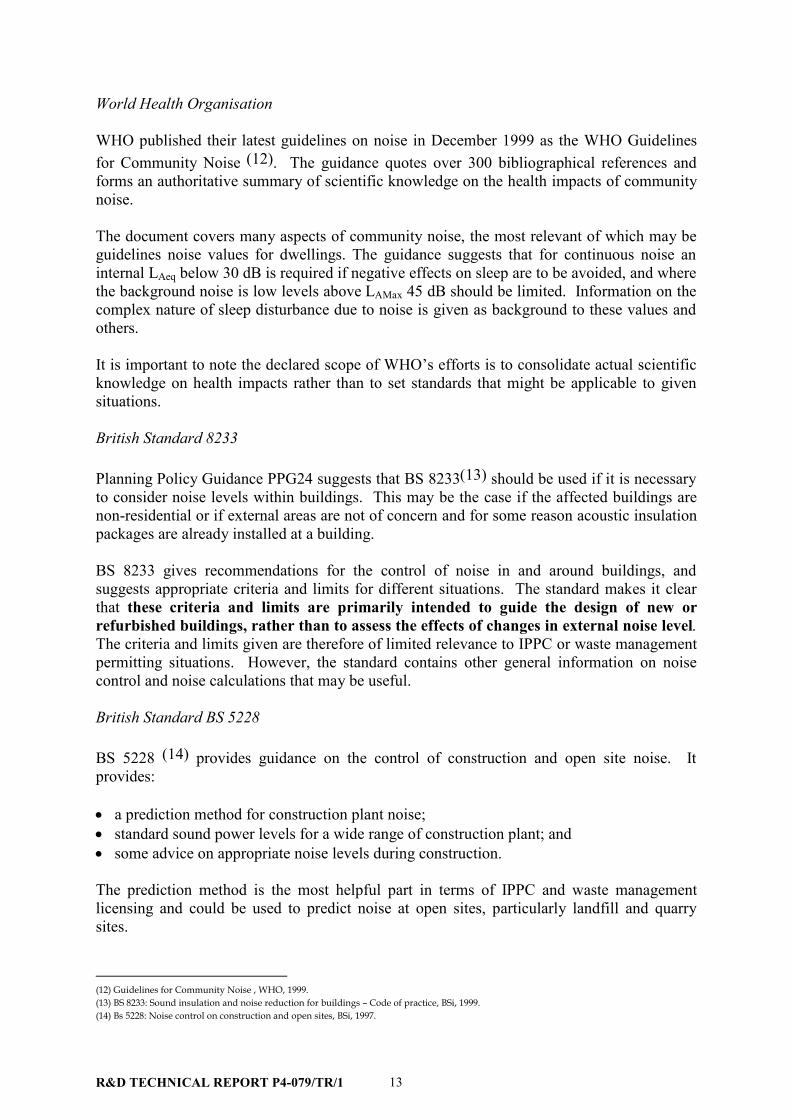
World Health Organisation
WHO published their latest guidelines on noise in December 1999 as the WHO Guidelinesfor Community Noise (12). The guidance quotes over 300 bibliographical references andforms an authoritative summary of scientific knowledge on the health impacts of communitynoise.
The document covers many aspects of community noise, the most relevant of which may beguidelines noise values for dwellings. The guidance suggests that for continuous noise aninternal LAeq below 30 dB is required if negative effects on sleep are to be avoided, and wherethe background noise is low levels above LAMax 45 dB should be limited. Information on thecomplex nature of sleep disturbance due to noise is given as background to these values andothers.
It is important to note the declared scope of WHO’s efforts is to consolidate actual scientificknowledge on health impacts rather than to set standards that might be applicable to givensituations.
British Standard 8233
Planning Policy Guidance PPG24 suggests that BS 8233(13) should be used if it is necessaryto consider noise levels within buildings. This may be the case if the affected buildings arenon-residential or if external areas are not of concern and for some reason acoustic insulationpackages are already installed at a building.
BS 8233 gives recommendations for the control of noise in and around buildings, andsuggests appropriate criteria and limits for different situations. The standard makes it clearthat these cr iter ia and limits are pr imar ily intended to guide the design of new orrefurbished buildings, rather than to assess the effects of changes in external noise level.The criteria and limits given are therefore of limited relevance to IPPC or waste managementpermitting situations. However, the standard contains other general information on noisecontrol and noise calculations that may be useful.
British Standard BS 5228
BS 5228 (14) provides guidance on the control of construction and open site noise. Itprovides:
• a prediction method for construction plant noise;• standard sound power levels for a wide range of construction plant; and• some advice on appropriate noise levels during construction.
The prediction method is the most helpful part in terms of IPPC and waste managementlicensing and could be used to predict noise at open sites, particularly landfill and quarrysites.
(12) Guidelines for Community Noise , WHO, 1999.(13) BS 8233: Sound insulation and noise reduction for buildings – Code of practice, BSi, 1999.(14) Bs 5228: Noise control on construction and open sites, BSi, 1997.

R&D TECHNICAL REPORT P4-079/TR/1 14
Minerals Planning Guidance MPG11
Minerals Planning Guidance MPG11 (15) describes the government’s policy on noise fromSurface Mineral Workings. MPG11 notes that waste disposal sites share many commonfeatures with surface mineral working, and much of the advice contained in these guidelineswill be appropriate to noise control for such operations. As such, MPG11 is useful forassessing the noise from landfill operations. MPG11 recommends the use of BS 5228 topredict noise levels. This document is under review at the date of writing.
The Engineering Equipment and Material Users Association Guide to the Use of NoiseProcedure Specification EEMUA publication 141 (1985).
The EEMUA method describes measurement of noise from plants, and using prediction toinvestigate the effect of implementing noise control. It also suggests low frequency noiselimits that may be appropriate for some sources.
British Standard BS 6472.
This standard gives a method of assessing vibration effects on human beings. Criteria areincluded that indicate likely levels of annoyance from vibration exposure.
Institute of Environmental Assessment and the Institute of Acoustics Guidelines onEnvironmental Impact Assessment
An important UK guidance document on assessment methods is expected to be published bythe Institute of Environmental Assessment and the Institute of Acoustics. This document willcover the main features of an environmental noise assessment.
• baseline;• prediction;• assessment;• mitigation;• presentation; and• follow up.
It will provide sufficient guidance to enable a reviewer to check that everything has beenproperly carried out in an environmental noise study. It is also likely to highlight that onesingle assessment method is not appropriate to all situations.
Further details of the above guidance documents are presented in Appendix D.
2.5.3 Future Trends
The European Commission published a Green Paper on Future Noise Policy in 1996. As partof the closer co-operation with other European countries, harmonisation of noise assessmentmethods is currently being investigated by European Commission Working Groups drawnfrom EU Member States. Prospective EU legislation concerning this Policy is likely to beimplemented between 2002 and 2003. The draft European Directive for the Assessment and (15) The control of Noise at Surface Mineral Workings, DoE, 1993.

R&D TECHNICAL REPORT P4-079/TR/1 15
Reduction of Environmental Noise (July 2000) is currently being progressed by the EuropeanParliament.
It is likely that the Directive will encourage environmental noise measurements to be basedon a variation of LAeq with adjustments made to the noise level if the noise occurs duringsensitive periods such as evening or night. Such standardised units will be used for reportingnoise exposure at a national level, but are unlikely to be appropriate to setting noise permitlevels in given situations.
It is also possible that the EC will propose noise targets. However, these will be long termnational population noise exposure targets, and are unlikely to have a major influence onlimits for industrial noise set in given situations. The new Directive is likely to raise publicawareness of noise pollution and could conceivably raise public expectations in the long termand add weight to the noise permitting process.
Part of this legislation will require ‘noise mapping’ of urban areas. The intention will be tohighlight sensitive urban/suburban areas that are affected by high ambient noise levels, and tohelp develop suitable mitigation procedures to help safeguard human health and reduce levelsof annoyance and disturbance. In the first instance, it is likely that the proposed legislationwill require conurbations with a population greater than 250,000 to be noise mapped by 2005.Noise Abatement Plans would then be produced to tackle the issues identified for these areasby 2006 (these dates are subject to revision). This requirement would also be applied toconurbations with a population greater than 100,000 a few years later.
By preparing a noise level map based on all noise sources information would be availableabout the effect of strategic changes on total noise levels. Local noise effects aroundparticular facilities will always need specific studies. The results of IPPC and wastemanagement licensing may be useful input to local authority efforts to carry out noisemapping and to progress abatement plans to improve overall noise exposure in the long term.
2.5.4 Conclusions/Setting Targets
The guidance that is summarised above can be used to establish suitable design targets for thepermit. Different guidance documents are most applicable to different situations. Much ofthis guidance is aimed at avoiding nuisance, and it should be noted that Best AvailableTechniques may go beyond the requirements for avoiding nuisance.
It is generally better to set noise permit levels at the nearest noise sensitive buildings, but itmay be appropriate to set them at the site boundary, for example for access reasons.
The inspector will need to take local circumstances into account in setting this target andconsultation with the Local Authority should be carried out at an early stage.
The target will also need to be reasonable and will need to take into account noise reductionsthat are achievable using Best Available Techniques. These are described in the followingsection.
R&D TECHNICAL REPORT P4-079/TR/1 16
3 BEST AVAILABLE TECHNIQUES FOR NOISE CONTROL
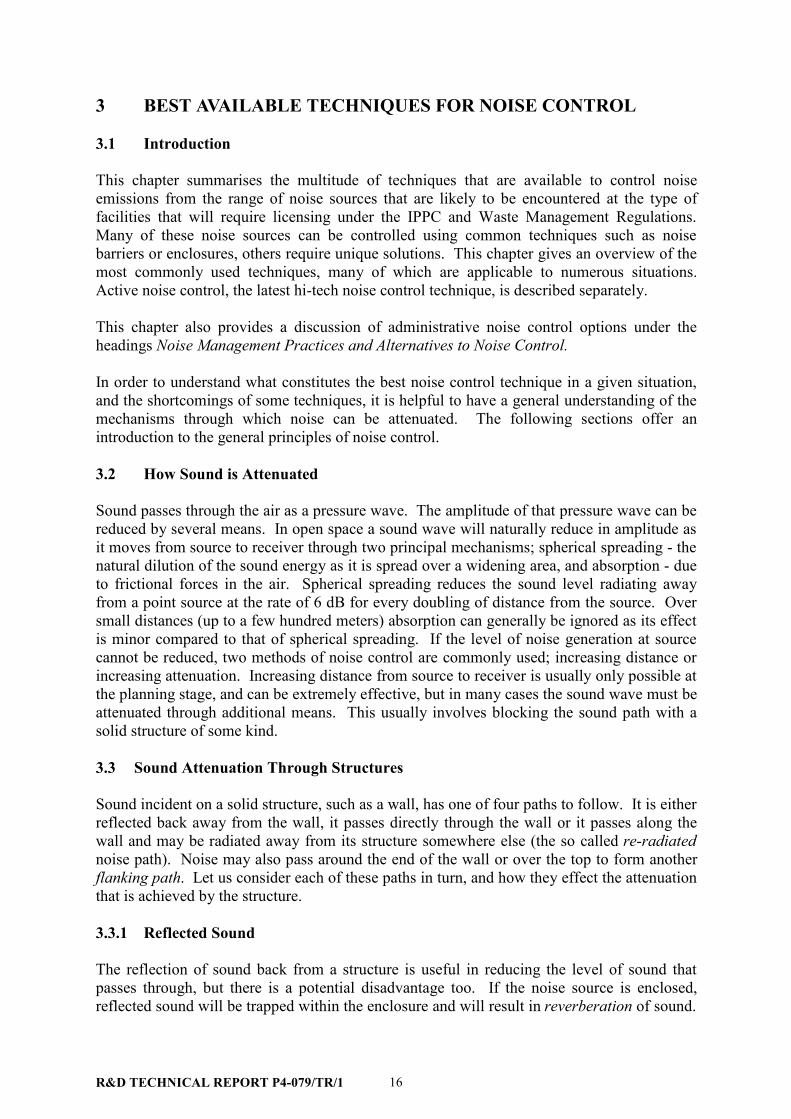
3.1 Introduction
This chapter summarises the multitude of techniques that are available to control noiseemissions from the range of noise sources that are likely to be encountered at the type offacilities that will require licensing under the IPPC and Waste Management Regulations.Many of these noise sources can be controlled using common techniques such as noisebarriers or enclosures, others require unique solutions. This chapter gives an overview of themost commonly used techniques, many of which are applicable to numerous situations.Active noise control, the latest hi-tech noise control technique, is described separately.
This chapter also provides a discussion of administrative noise control options under theheadings Noise Management Practices and Alternatives to Noise Control.
In order to understand what constitutes the best noise control technique in a given situation,and the shortcomings of some techniques, it is helpful to have a general understanding of themechanisms through which noise can be attenuated. The following sections offer anintroduction to the general principles of noise control.
3.2 How Sound is Attenuated
Sound passes through the air as a pressure wave. The amplitude of that pressure wave can bereduced by several means. In open space a sound wave will naturally reduce in amplitude asit moves from source to receiver through two principal mechanisms; spherical spreading - thenatural dilution of the sound energy as it is spread over a widening area, and absorption - dueto frictional forces in the air. Spherical spreading reduces the sound level radiating awayfrom a point source at the rate of 6 dB for every doubling of distance from the source. Oversmall distances (up to a few hundred meters) absorption can generally be ignored as its effectis minor compared to that of spherical spreading. If the level of noise generation at sourcecannot be reduced, two methods of noise control are commonly used; increasing distance orincreasing attenuation. Increasing distance from source to receiver is usually only possible atthe planning stage, and can be extremely effective, but in many cases the sound wave must beattenuated through additional means. This usually involves blocking the sound path with asolid structure of some kind.
3.3 Sound Attenuation Through Structures
Sound incident on a solid structure, such as a wall, has one of four paths to follow. It is eitherreflected back away from the wall, it passes directly through the wall or it passes along thewall and may be radiated away from its structure somewhere else (the so called re-radiatednoise path). Noise may also pass around the end of the wall or over the top to form anotherflanking path. Let us consider each of these paths in turn, and how they effect the attenuationthat is achieved by the structure.
3.3.1 Reflected Sound
The reflection of sound back from a structure is useful in reducing the level of sound thatpasses through, but there is a potential disadvantage too. If the noise source is enclosed,reflected sound will be trapped within the enclosure and will result in reverberation of sound.

R&D TECHNICAL REPORT P4-079/TR/1 17
This reverberant sound may build up within the enclosed space and increase the apparentstrength of the sound source. This can be combated by adding acoustic absorption to theenclosed space, for example with mineral fibre quilting in acoustic panels. Barriers may alsobe covered in absorptive material on the side facing the source to increase their effectiveness.
3.3.2 Flanking Paths and Re-radiated Noise
There are various types of flanking paths. Sound may pass along a structure for somedistance and radiate away from it somewhere else, for example as a result of vibration beingtransmitted through the plant supports into the floor, along the floor into the walls andradiating away from the walls to the outside of a building. Or sound may simply diffractaround the edge of the structure, for example under the eaves of a roof. Flanking paths canreduce the acoustic performance of the structure and should not be ignored when a highperformance is needed.
3.3.3 Transmitted Sound
The portion of the incident sound wave that passes through the structure is first convertedinto vibrational energy in the structure and then back to air-borne vibrational energy as it isradiated away from the far side. The extent to which this process attenuates the sounddepends on two key characteristics of the structure; its mass and its stiffness.
3.3.4 The Effect of Mass
It is mass that attenuates sound through frictional losses, the greater the mass the greater theattenuation. This attenuation depends on the frequency of the sound, higher frequencies areabsorbed more easily than low frequencies. As a result, a common feature of noise control isthat it is nearly always more difficult to attenuate low frequency noise than high frequencies.This problem is accentuated when a long propagation distance is involved because airabsorption will effect higher frequencies far more than lower frequencies. The result is thatlow frequency noise tends to ‘travel’ more than high frequency noise.
Mathematically, the relationship between sound reduction, mass (M), and frequency (f) aregiven in the ‘Mass Law’ of sound insulation as follows:
• Sound Reduction = 20 log Mf - 43
Or, stated in words:
• At a given frequency, sound reduction increases by about 6 dB for each doubling of mass;and
• For a given mass, the sound reduction increases by about 6 dB for each doubling offrequency.
These are idealised relationships that ignore other mechanisms that may effect attenuation ingiven materials, such as the effect of stiffness, discussed below.

R&D TECHNICAL REPORT P4-079/TR/1 18
3.3.5 The Effect of Stiffness
The stiffness of the structure will control the extent to which it flexes under the influence ofthe incident sound wave. A structure that is flexing will radiate sound as it oscillates at thefrequency of that oscillation. If a structure has very low stiffness this can form a veryefficient route for sound to pass through. Even heavy walls can allow sound to pass throughthem in this way because flat structures such as walls or windows have a natural frequency atwhich they will oscillate easily if energy of that frequency if put into them. Hence, only veryspecific frequencies of sound are transferred through structures in this way. Nonethelessbecause the process transfers noise very efficiently it can lead to substantial losses ofattenuation performance at given frequencies.
3.3.6 Holes, Openings, and Barr iers
For a noise attenuating structure to be effective it must completely block the soundtransmission path. Any hole or opening in the structure will greatly reduce its acousticperformance. For example, if a wall or partition capable of attenuating sound by 25 dB hasan opening in it with an area that is 10% of the area if the wall, its performance will bereduced from 25 dB to about 10 dB. Sound can be thought to behave rather like a liquid insuch cases, it will simply pour through the easiest route it can find. Similarly sound will flowround a structure if allowed to do so. More correctly speaking sound will diffract around theedge of a structure. It is the ease with which sound diffracts around structures that limits theperformance of noise barriers which only partly block the sound transmission path. This isalso the reason why tree planting is not usually an effective noise control technique. Sounddoes not move in straight lines.
3.4 Noise Control Equipment
3.4.1 Introduction
This section provides a description of noise control equipment that is available to attenuatenoise from commonly encountered sources of noise found at facilities covered by theregulations. The equipment is divided into two types; ‘conventional or passive noise controlequipment’ such as acoustic enclosures and barriers, and ‘active noise control’ which usesmodern electronics to produce an acoustic signal that partly cancels out the unwanted noise.Active systems are also available for vibration cancellation.
3.4.2 Conventional Noise Control Equipment
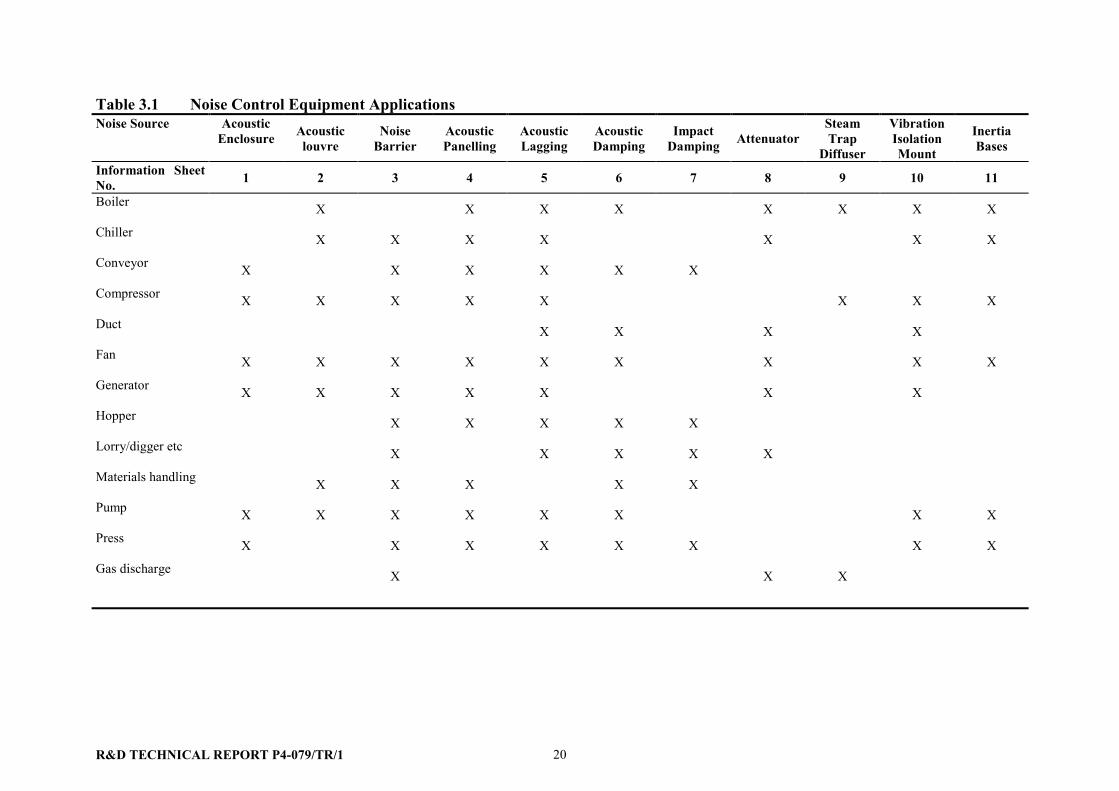
Noise control is a highly developed industry and there are numerous manufacturers producinga huge range of equipment designed for particular applications. However, there are commontypes of equipment that use particular techniques and materials to attenuate noise. Thissection provides descriptions of 11 generic types of noise control equipment that account forthe majority of the equipment used by the noise control industry.
The description of each type of equipment is presented in Appendix E as a one pageinformation sheet giving:
• a photograph or picture;• description - including some of its advantages and/or limitations;

R&D TECHNICAL REPORT P4-079/TR/1 19
• the application - a list of the noise sources to which it can be applied;• the acoustic performance; and• the cost.
The use of this standard information sheet format is intended to make the information conciseand accessible.
Table 3.1 cross-references the 11 types of noise control equipment with a list of noisy plantthat may commonly be encountered at regulated facilities. For many noise sources there aremore than one noise control option.
The costs, benefits and other implications of these types of noise control equipment arediscussed in Section 4.
R&D TECHNICAL REPORT P4-079/TR/1 20
Table 3.1 Noise Control Equipment ApplicationsNoise Source Acoustic
Enclosure Acousticlouvre
NoiseBar r ier
AcousticPanelling
AcousticLagging
AcousticDamping
ImpactDamping Attenuator
SteamTrap
Diffuser
VibrationIsolationMount
Iner tiaBases
Information SheetNo. 1 2 3 4 5 6 7 8 9 10 11
Boiler X X X X X X X X
Chiller X X X X X X X
Conveyor X X X X X X
Compressor X X X X X X X X
Duct X X X X
Fan X X X X X X X X X
Generator X X X X X X X
Hopper X X X X X
Lorry/digger etc X X X X X
Materials handling X X X X X
Pump X X X X X X X X
Press X X X X X X X X
Gas discharge X X X

R&D TECHNICAL REPORT P4-079/TR/1 21
3.4.3 Active Noise Control
Active noise control is the term used to describe the process through which noise is reducedby introducing a sound wave that is an inverse, or mirror-image of the unwanted noise. Thiscancellation wave, which is of equal amplitude and frequency, but of opposite phase,destructively interferes with the noise without physically blocking the sound path. It istherefore fundamentally different from conventional noise control techniques and haspotential advantages. But is also has limitations and is expensive. The main applications ofactive noise control up to now have been ear defenders, fan and pump noise in industry, noisefrom air-conditioning systems and aircraft interior noise.
A typical active noise control system consists of an input microphone that detect theunwanted noise, a controller system that generates the ‘anti-noise’, a loudspeaker that emitsthe anti-noise and a further error microphone that is used to refine the anti-noise signal via thecontroller. The main limitation of the process is the speed at which the system can react to arapidly varying noise signal. So, it is most effective for noise signals that are predictable likepure tones, and it is less effective on higher frequency noise because the higher thefrequency, the more rapid the signal fluctuates and the electronics cannot keep up.Attenuations of 25 dB or more are achievable for pure tones, whilst 15-20 dB is a morerealistic upper limit for broad band noise (ie noise consisting of acoustic energy in a widerange of frequency bands).
A well developed and effective application of active noise control in industry is for in-ductfan noise attenuation. The earliest applications were built about 10 years ago. The problemof poor performance at higher frequency can sometimes be overcome by adding aconventional duct silencer that is inherently more effective at the higher frequencies. Activenoise control has one notable advantage in ducted fan noise application. Conventionalsilencers restrict airflow, which produces an additional load on the fan that drives the air andthus increases the energy consumption of the fan. The active control system itself uses verylittle power and overall power consumption savings can be 10-20%.
Active control systems can be damaged by high temperatures or wet conditions and aretherefore less suited to outside applications. Furthermore external applications tend torequire high levels of acoustic energy at the source and there are limitations as to how muchanti-noise energy can be generated at low frequencies. Nonetheless active noise control isused for reducing noise emissions from industrial sites, and is effective particularly wherelow frequency tonal noise cannot be attenuated by other means. In Case Study 3 active noisecontrol was considered but it was discarded largely because of costs which are typically about£4,000 for a single fan.
3.5 Noise Management Practices
3.5.1 Introduction
For some operational facilities there are effective ways of reducing noise simply by beingaware of its presence as an issue for the site, and by adopting appropriate procedures whencarrying out every day activities. Such procedures can be collectively called ‘noisemanagement’ and can be particularly important where substantial noise control has beenincorporated in a plant design. Noise management may be part of an overall Environmental

R&D TECHNICAL REPORT P4-079/TR/1 22
Management System, in which case it may be subject to routine auditing and reportingrequirements.
3.5.2 Routine Maintenance of Plant
Noise is usually generated in mechanical plant by the interaction of moving, and oftenrotating, parts. Over time these parts tend to wear, stretch or become distorted in some wayand the levels of noise generated tend to increase. Common examples include bearings, gearchains, rollers and engines. Routine maintenance or servicing of such equipment can have asignificant effect on noise output.
Noise control equipment can also degrade with time and require servicing or replacement.Engine silencers are a prime example. Acoustic panelling can become clogged, waterloggedand distorted and hence will become less effective.
3.5.3 Good Operational Site Practices
There are a number of common sense procedures that can help to reduce noise emissions.Although these tend to be specific to operations at particular facility some common examplesare listed as follows:
• closing doors and windows in noisy buildings and acoustic enclosures;• ensuring that generator or vehicle engine hatches are kept closed;• locating mobile plant away from noise sensitive receivers where possible;• avoiding dropping metallic materials from a height;• switching off plant when not in use;• stock piling materials (eg containers) so as to provide acoustic screening between noise
sources and receivers; and• arranging delivery or on site vehicle routes away from sensitive receivers.
Although the noise reduction benefits of these practices can be difficult to quantify, theyshould form a routine part of best practice to reduce overall noise emissions.
3.5.4 Restr icting Operating Hours
The sensitivity of neighbouring areas to noise impacts will vary with the time of day and ondifferent days of the week/weekend. Much of the guidance material described in Section 2recognises this by applying more stringent standards for the evening (generally taken as 1900to 2300 hours) and night (2300 to 0700 hours) compared to daytime. The Irish EPA IPClicensing guidelines on noise (16) are in line with other guidance in suggesting a 10 dBdifferential between day and night in the absence of more detailed information. Restrictingthe operating hours of noisy activities can be an extremely effective way of mitigatingcommunity noise impacts and is often used, to great effect, in planning conditions for newfacilities. Restricting operating hours can of course reduce productivity and createoperational difficulties, but it need not necessarily require a complete cessation of all activityon the site. In some cases it will be possible to schedule noisy operations to the less sensitivedaytime, weekday periods in order to keep noise emissions to a minimum at night.
(16) Integrated Pollution Control Licensing, Guidance Note for Noise In Relation to Scheduled Activities, Irish Environmental Protection Agency,1995.

R&D TECHNICAL REPORT P4-079/TR/1 23
3.5.5 Community Liaison
Some plants require occasional unavoidably noisy procedures to be followed such as'blowing down' pressurised systems and testing emergency generators. There is evidence thatthe impact of noise from such activities can be reduced simply by warning the communitybeforehand. Often, the fact that a member of the public has been informed, and is aware thatthe operator is being as considerate as possible will reduce the level of disturbance caused.For one thing people will tend to schedule particularly noise-sensitive activities away fromsuch periods. Of course the operator should try to schedule the noisy operationssympathetically too. An example of this is the testing of emergency generators incommercial areas where there are no residential buildings, on Sundays. More generally,keeping the community aware of noise control activities and plans will offer long termbenefits to all parties, and should be encouraged.
Complaints due to noise should be treated in a constructive manner. They can often providethe operator with guidance on the main source of concern and the best approach to mitigatingthe problem. Appendix C provides a standard form to illustrate the key information thatshould be sought from a complainant. A general procedure for handling a noise complaint isas follows:
1. The complaint is logged.
2. The facility under consideration is visited immediately to inquire:• if the operator knows what the source of the noise could be; and• if the noise could be due to an unusual activity.
3. The source of excessive noise is investigate by inspection to see if there is an obviousremedy, if so it is implemented and the complainant is updated.
4. If no remedy is implemented, and excessive noise is suspected, noise monitoring iscarried out to help identify the source and the extent of any noise impact.
5. If monitoring identifies a noise impact remedial work is planned and implemented, thecomplainant is advised of progress.
6. Repeat monitoring is carried out to establish whether the remedial work has beensuccessful.
7. The complainant is advised and the logged complaint is signed-off as having beenproperly addressed.
It is important that throughout this process the complainant is kept updated of progress,particularly if the investigations take some time.
3.6 Planning Noise Control
The ideal time to consider noise control is at the initial planning stage of a new facility.Similar opportunities may arise during the lifetime of a facility when planning an extensionor when old plant is being replaced (see Case Study 1). At this stage potential noise problems

R&D TECHNICAL REPORT P4-079/TR/1 24
can be 'designed out' rather than being left to be addressed later through a bolt on, end of pipesolution. This approach can not only produce more effective noise control but tends to bemore cost effective too.
In some cases there will be planning restrictions governing what can be done on the site andthese can limit the options for noise control, but in general consideration should be given thefollowing general principals:
• use of inherently quieter processes (eg Case Study 1, see Appendix F);• selection of inherently quiet plant or 'low noise options';• site layout to maximise natural screening, screening by buildings, and separation
distances;• orientation of directional noise sources away from sensitive receivers; and• noise barriers and bunding.
In the particular case of landfill sites the design of the filling sequence can influence theextent of noise screening by filled material, and hence can be used to maximise screening forparticular noise-sensitive areas.
Tree planting may provide effective mitigation of visual impacts but rarely reduces noise.For trees to have significant attenuation benefits they will need to be planted very closetogether and to cover a substantial propagation distance, for example a substantial maturewoodland.

R&D TECHNICAL REPORT P4-079/TR/1 25
4 COSTS, BENEFITS AND IMPLICATIONS OF NOISE CONTROL
4.1 Introduction
This section discusses the overall implications of the various noise control techniques thathave been described above. In addition to the acoustic benefit achieved, long-term costs inboth monetary and environmental terms are considered. It is not appropriate to attempt a costbenefits analysis of different noise control techniques because in most remedial situations thechoice of noise control options will be limited by practical operational factors and there maybe only one feasible solution.
4.2 Cost Benefits
4.2.1 Summary of Benefits
The methods of noise control described in this report have generally been in widespread usefor many years (with the exception of active noise control). It is because acoustic hardwareprovides tangible noise benefits for modest costs that it used so commonly. The installationof a suitable piece of acoustic hardware typically provides several decibels of attenuation andcan achieve up to about 50 dB, although this is rare in practice. Of course, the reduction inthe overall noise level from a facility tends to be less because there are usually many sourcesof noise that add up at the receiver point, all of which may potentially need acoustictreatment. Nonetheless, in environmental terms the noise benefits achieved representsignificant improvements in the noise climate experiences by local communities (Appendix Bdescribes how changes in noise are perceived, eg a 10 dB reduction is perceived as a halvingof noise level). Such reductions are commonly achievable through tried and testedtechniques. There are also benefits to the workforce who will experience a more pleasantwork environment.
4.2.2 Costs
The cost of acoustic hardware varies hugely depending on the application. A simple fansilencer may cost a few hundred pounds, whereas it is not uncommon for power stations toincur noise control costs measured in millions of pounds (see Case Study 5). Compared toinitial construction costs and ongoing operational costs, the costs of noise control are usuallyaffordable, except to businesses operating on very low margins where only the cheapermethods can be used.
Noise control through good planning generally has minimal costs and potentially substantialnoise reduction benefits. Ongoing noise management has minimal costs but generally thebenefits are smaller. Figure 4.1 summarises, in general terms, the relative cost benefits ofsome of the noise control methods that have been discussed in this report.

R&D TECHNICAL REPORT P4-079/TR/1 26
Figure 4.1 Cost Benefits of Noise Control
Noise management may be cost effective, but will rarely offer a complete solution to aserious noise problem. Low cost acoustic hardware, represented in the central part of thefigure, may be affordable and may offer sufficient noise reduction in many cases, but insevere cases where acoustic enclosure and silencers are required costs will be higher. Activenoise control is a relatively expensive method, but can provide a solution where othertechniques cannot, ie for severe low frequency noise problems. This figure illustrates onceagain that planning for noise control will invariably offer the most cost-effective solution.
4.3 General Implications
For an operational facility there will usually be restrictions as to which choice of noisecontrol method to pursue because of the practicalities of retrofitting equipment and the longterm implications of having it in place. There may be a lack of space, insufficient access formaintenance, safety implications or any number of difficulties to contend with.
Noise control equipment may also interfere with the correct operation of the plant, forexample by placing it under increased load. Most noise control equipment works by blockingthe path by which noise is emitted. This will tend to also block airflow and cooling whichcould increase wear in the plant and have long term maintenance and cost implications.These problems are not incurred by active noise control, although some maintenance will berequired and speakers do wear out.
Noise management practices will rarely conflict with the safe operation of the plant as theyare aimed at ensuring operatives use noise control features as they were designed to be used.
When planning a site layout with noise control in mind there will be numerous otherconsiderations that will require careful consideration in achieving an optimal site and plantlayout. However, in the past noise control has tended to be left until last and it should beconsidered along with all other factors in a balanced way during the conceptual and detaileddesign process.
Noi
se B
enef
it
Cost
40 dB
Plan
ning
for N
oise
Dam
ping
&La
ggin
g
Bar
riers
&Lo
uvre
s Encl
osur
es &
Sile
ncer
s
0 dB
Act
ive
Noi
seC
ontro
l
Noi
sem
anag
em
ent
R&D TECHNICAL REPORT P4-079/TR/1 27
4.4 Environmental Implications
4.4.1 Energy Consumption
Passive equipment added to a plant has the capacity to increase energy consumption byadding mass and restricting the free operation of the plant. Attenuators fitted to fans impedeair flow and hence put additional load on the fan. This increased load, quantified as ‘pressuredrop’ can be minimised by using a silencer with more open splitters but of greater length ifthere is space. Sometimes performance is increased by using two silencers in series.However, inevitably some extra load is created and more energy is required to drive the airflow. This effect is more severe when adding attenuators to high velocity air flows, such asin the inlet and discharge stacks to gas turbines in power stations. In high velocity air flowsattenuators produce higher pressure drops which can have an appreciable effect on theefficiency of the gas turbine and hence the whole power generation process. For example, astack silencer producing a pressure drop of 30 millibars can reduce overall power generatingefficiency by 2%. Consequently acoustic engineers work to tight guidelines when designingand selecting such attenuators.
4.4.2 Raw Mater ial Usage
The manufacture, servicing, replacement and decommissioning of acoustic hardware allrequire natural resources. There are clear advantages in choosing an inherently quiet processor low noise plant option rather than bolting on noise control equipment. Where acoustichardware creates additional mechanical or heat load the life of the plant may potentially beshortened which will also have resource implications. These will not be major concerns forsmaller installations, but they may be more important in sectors such as the power industrywhere more substantial resources are involved.
Acoustic hardware generally has a lifetime of many years and is largely maintenance free.As such it generates very little waste when operational. Acoustic panels can degenerateunder adverse conditions, for example if they became very wet the infill material may needreplacing from time to time. There has been concern that very fine mineral fibres can behazardous, but safer products have been developed.

R&D TECHNICAL REPORT P4-079/TR/1 28
5 CASE STUDIES
5.1 Introduction
The Study Brief put a clear emphasis on case studies to illustrate how noise control is used inpractice. In particular case studies were requested to:
• demonstrate cost-effective solutions;• show simple 'low tech' but effective solutions;• show novel or innovative solutions;• explain how difficult issues have been tackled;• give examples not limited to heavy industry;• include photographs and diagrams; and• demonstrate co-operation of the operator.
This chapter describes how six case studies were selected, summarises each and how itdemonstrates Best Available Techniques, and then draws conclusions from all six. A fulleraccount of each case study is provided in Appendix F.
5.2 Selection of Case Studies
Case studies were selected based on the following criteria.
• industries and processes that are covered by the IPPC and Waste ManagementRegulations;
• preference to industries and processes that are most common in the UK in order tomake the case studies as relevant to as many sites as possible;
• a mix of new facilities and remedial situations; and
• the inclusion of a wide range of noise control techniques and solutions.
5.3 Overview of Case Studies
The case studies provide descriptions of how various noise control techniques were employedin real situations. In most cases a combination of techniques was used. In order to helplocate an example of a particular technique Table 5.1 gives a summary of the techniquesapplied in each case.

R&D TECHNICAL REPORT P4-079/TR/1 29
Table 5.1 Noise Control Techniques Covered in Each Case StudyCase Study Facility Noise Control Techniques Covered1. Foundry Change of process used to re-house noisy plant in acoustically
designed building.Use of building screening.
2. Maltings Fan attenuators.Acoustic damping to conveyor systems.Acoustic enclosures on conveyor drive engines.
3. Paper ProductsFactory
Partial acoustic enclosure.Helmholtz resonators for elimination of tonal noise.
4. Mineral FibreFactory
Vibrating screens adjusted to reduce low frequency tonal noise.
5. Combined Heat andPower Plant
Acoustic design of a new power station.Building design, acoustic enclosures, doors, specialist attenuators,plant planning.
6. Landfill Noise bunding.A Noise Management System for a Landfill.
5.4 Summary of Case Study 1
Case Study 1 concerns a foundry run by a company that produces malleable metal casings.Noise from a cupola furnace system, scrap metal handling operations, and dust and fumeextraction systems was apparent in residential areas some distance from the site. Measurednoise levels were up to 20 dB above background noise in nearby residential areas and lowfrequency tonal noise was clearly audible.
For various reasons it was decided to replace the existing cupola melt facility with a newelectric melt operation. During the pre-planning stage a decision was made to address thenoise concerns early in the design. Acoustic consultants were employed to assist in thedesign of a new building to contain the electric melt furnaces and the raw materials store,which included an area for lorries tipping scrap metal, an overhead crane and the furnacecharger.
The noise reduction achieved following the opening of the new furnace system was 12dB(A). This case study illustrates how the incorporation of noise control within the design ofan updated process on the site was successful in achieving a substantial noise improvementfor the local community.
5.5 Summary of Case Study 2
Case Study 2 concerns a large Maltings operating near a rural community where the LocalAuthority were investigating reports of noise nuisance. The main noise sources that wereaddressed included tonal fan noise, clatter, screeches and clonks from conveyor systems, andhigh frequency hissing sounds from grain chutes.

R&D TECHNICAL REPORT P4-079/TR/1 30
Fan noise was addressed using in-line absorptive silencers. Noise reductions of about 5dB(A) were achieved and tonal noise was eliminated. Some fans also required acousticlagging to reduce noise breaking out from the fan casings.
Conveyor and elevator casings were fitted with a dense PVC matting to provide acousticdamping. A grain chute treated in this way showed a noise reduction of over 10 dB(A).Drive mechanisms forming particular noise sources were boxed in with small localenclosures manufactured on site from sheet steel and mineral fibre board.
An overall noise reduction of 7 dB(A) was achieved and whilst noise levels remainedsignificantly above the background noise they were reduced to below recognised absolutenoise standards. This case study is an example of how acoustic treatments can be built by anoperator to fit a particular situation without the need of expensive high-tech equipment.
5.6 Summary of Case Study 3
Case Study 3 concerns an international paper product manufacturer who was experiencingneighbourhood noise problems, and reduced tonal noise from air-handling material transportsystems and impulsive noise from high pressure blow-off exhausts, using low cost,innovative technology.
The factory is located in a rural setting but two neighbours had complained of tonal,intermittent, impulsive noise. The main source of the problem was identified as a series offans used to drive air through a system that transports paper pulp around the site. For safetyreasons (fear of fire ignition) standard attenuators could not be used and several otheralternatives were ruled out, including active noise control. A solution was finally found usingHelmholtz resonators. The Helmholtz principle uses a vessel, or side branch, to produce anair spring which absorbs energy from sound waves in the main duct. Although resonatorscannot operate over wide bandwidths, they control pure tones effectively. As the materialshandling system emitted a tone at 160 Hertz, this option was considered to be a suitable one.
Following research into a suitable design a simple Helmholtz resonator was fabricated in-house using a 250 mm steel tubing, 1 metre in length. This was attached to the 600 mm ductby a 75 mm right angled branch, bolted directly to the duct. An adjustable piston was fittedinside the resonator operated by a screw thread in the closed end.
Eventually four Helmholtz resonators were manufactured on site at a total cost of less than£1,000. A noise reduction of 10 dB(A) was achieved and the tonal noise was eliminated.
This case study illustrates an innovative low-cost solution that was extremely effective withno long-term disbenefits.
5.7 Summary of Case Study 4
Case study 4 concerns a mineral fibre manufacturing factory which was reported to beproducing very low frequency noise at unacceptable levels in a nearby house. Severalsources of noise were audible at the site boundary, including noise from various process fans,pumps, and a low-frequency rumble from the filter plant. Noise also arises from lorry trafficservicing the plant. However, the source of the low frequency noise was traced to somerecently installed vibrating screens used to process the fibres.

R&D TECHNICAL REPORT P4-079/TR/1 31
The screens were driven by an eccentric weight which produces an out of balance force androtates at low frequency. Detailed 1/3rd octave band analysis in the complainant’s houseshowed a tonal peak in the 20 Hertz 1/3rd octave band, but during the survey it could not beheard above background noise.
The solution was to reduce the speed of rotation of the driving motor from 1450 rpm to 825rpm. This solution took some time to find, but reduced the offending tone by 10 dB. Therewere no long-term implications to the plant and minimal cost in making the requiredadjustment.
5.8 Summary of Case Study 5
Case Study 5 describes some of the acoustic design work undertaken for a new CombineHeat and Power (CHP) plant. The plant was to be located 200m from housing and the LocalAuthority set a stringent noise criterion in order to prevent ambient noise levels ‘creeping’over time. This is a reasonably common practice where there is concern that multipledevelopments in the future could each add incrementally to background noise levels andtogether produce significant increase in ambient noise levels in the future.
It was decided that the best approach to attenuating the numerous major noise sources was tohouse them together in a single acoustically designed building. Turbines and major plantrequired substantial acoustic enclosures. Conventional attenuators were used extensively andspecialist attenuators were required in the exhaust stack to cope with very high temperatures.
On commissioning of the plant, noise surveys at the nearest residential dwellingsdemonstrated that there had been no increase in ambient noise. In addition, noise from theCHP building was not detectable at the noise sensitive location previously identified duringthe initial noise survey.
This case study illustrates the extent of noise control measures that may be required for amajor plant such as a power station.
5.9 Summary of Case Study 6
Case Study 6 concerns a Landfill operation in the vicinity of two properties at which theLocal Authority had prescribed noise limits. The noise limits were set in accordance withMPG11 and modelling of possible future noise levels using BS 5228 methodologiessuggested that substantial noise control was required.
Two bunds were constructed of soil removed from the site for cell construction. During theirconstruction, noise levels at the two receptors occasionally reached levels of 70 dB(A) forshort periods. Noise impacts arising from the construction of bunds in this way is identifiedin MPG 11, which also points out the necessity to construct bunds in such cases. As a result,an agreement was reached with the Planning Authority regarding the exceedance of noiselimiting criteria whilst bund construction took place.
A package of noise management practices was developed including maintenance andswitching off of equipment, limiting plant sound power levels, restricted operating time,limited use of audible warning alarms, and noise monitoring.

R&D TECHNICAL REPORT P4-079/TR/1 32
The overall noise reduction achieved was about 10 dB(A) and although levels were stillabove background noise levels they met the requirements of the Local Authority.
5.10 Conclusions From Case Studies
The six case studies illustrate a wide range of noise control techniques applied to a variety ofsituations. The fuller account of each study given in Appendix F describes the reasonsbehind the choice of noise control method in each case and the difficulties that had to beovercome.
Where possible cost information has been provided. In some cases the costs involved aresurprisingly low, particularly where innovative solutions have been found and the requiredhardware has been built on site. Also discussed in Appendix F are some other costs andbenefits associated with the noise control that was undertaken.
The case studies also illustrate how noise limits were set for two new facilities and how BestAvailable Techniques were used to reduce noise from existing facilities such that acceptableoutcomes were reached.

R&D TECHNICAL REPORT P4-079/TR/1 33
BIBLIOGRAPHY
Berglund & Lindvall, 1995. Community Noise, Archives of the Centre for Sensory Research,Stockholm University, Vol 2. Issue 1.
BSi, 1999. BS8233, 1999 Sound insulation & noise reduction for buildings – Code ofpractice
BSi, 1997. BS4142 (1997), Method for rating industrial noise affecting mixed residential &industrial areas.
BSi, 1997. BS5228, Noise & vibration control on construction & open sites, parts 1,2,3 & 4
BSi, 1992. BS6472: 1992 Guide to Evaluation of human exposure to vibration in buildings (1Hz to 80 Hz)
BSi, 1990. BS7385, Evaluation & measurement for vibration in buildings Part 1 Guide formeasurement of vibrations & evaluation of their effects on buildings
BSi, 1991. BS7445, Description & measurement of environmental noise Parts 1 to 4
CONCAWE, Den Haag, 1981. The propagation of noise from petroleum & petrochemicalcomplexes to neighbouring communities
DoE, 1994. Planning Policy Guidance 24 Planning & Noise
DoE, 1993. Minerals Planning Guidance 11, The control of Noise at Surface MineralWorkings.
EEMUA, 1985. The Engineering Equipment & Material Users Association Guide to the Useof Noise Procedure Specification EEMUA publication 141 (1985)
Health and Safety Executive, 1995. Sound Solutions, techniques to reduce noise at work
Health and Safety Executive, 1993. Control of Noise in Quarries
The Institute of Gas Engineers, 1990. Recommendations on Environmental PracticeIGE/ER/2: 1990. Communication 1432, Assessment & Control of Environmental NoiseLevels
Irish Environmental Protection Agency, 1995. Integrated Pollution Control Licensing,Guidance Note for Noise In Relation to Scheduled Activities
ISO, 1993. ISO9613, Acoustics - Attenuation of sound during propagation outdoors.
The Scottish Office Development Department, 1999. Planning Advice Note 56, Planning &Noise
WHO, 1999. Guidelines on Community Noise

R&D TECHNICAL REPORT P4-079/TR/1 34
LIST OF FIGURES
Figure 2.1 Cause and Effect Relationships for Noise 4Figure 2.2 A Statistical Sound Level Meter 5Figure 4.1 Cost Benefits of Noise Control 26Figure B1.1 Noise Levels in Everyday Situations 37Figure B2.1 A Time History Plot for Road Traffic Noise 38Figure B3.1 Noise Spectrum from Cooling Plant 40Figure B3.2 Sample NR Curves 41Figure B4.1 Subtracting Noise Levels 42Figure F1.1 Site Location Plan showing Noise Sources and Noise Sensitive Areas 67Figure F1.2 Building Layout 70Figure F1.3 Before and After Noise Survey Results 71Figure F2.1 Centrifugal Blower 74Figure F3.1 Helmholtz Resonator Design 79Figure F4.1 Northern Boundary of the Site Adjacent to the Residential Area 81Figure F4.2 Site Plan Showing Residential Area to the North West 82Figure F4.3 The Vibrating Screens Installed at the Factory 84Figure F5.1 Plant Layout Plan 86Figure F5.2 Turbine and Boiler Installation 89Figure F6.1 Overview of Cell Construction and Waste Infill Operations at the Site 93Figure F6.2 Map of the Site Showing Workings and Nearby Noise Sensitive Receptors 94Figure F6.3 Cell Construction with Dumper and Bulldozer 96Figure F6.4 Typical Earth Bund 97
LIST OF TABLES
Table 2.1 Advantages and Disadvantages of Prediction 11Table 3.1 Noise Control Equipment Applications 20Table 5.1 Noise Control Techniques Covered in Each Case Study 29Table B1.1 Approximate Noise Level of Common Sources of Noise 36Table C.1 Typical Form for the Reporting of a Noise Complaint 44Table C.2 Noise Measurement Form 45Table D2.1 Recommended Noise Exposure Categories for New Dwellings
Near Existing Noise Sources. 47Table D2.2 Interpretation of Noise Level Difference 49Table D2.3 Guideline Values for Community Noise in Residential Environments 51Table F1.1 Measured Noise Frequency Spectrum at Site Boundary 68Table F4.1 Noise Levels Measured Outside the Property of Concern 83Table F4.2 Variation in Noise Emission at Different Operating Speeds 85Table F4.3 Comparison of Measured Noise Levels in the Bedroom with the
Screen at Various Speeds 85Table F5.1 Gas Turbine Air Intake Sound Power Level 89Table F5.2 Gas Turbine Air Intake Attenuator Insertion Loss 89Table F5.3 Wall Sound Reduction Indices 91Table F5.4 Roof Sound Reduction Indices 91Table F6.1 Identification of Individual Noise Sources 96

R&D TECHNICAL REPORT P4-079/TR/1 35
Appendix A - Glossary of Acoustics Terminology
Sound PowerLevel andSound PressureLevel
Any source of noise has a characteristic Sound Power, a basic measure of its acousticoutput, but the Sound Pressure Levels it gives rise to depend on many external factors,which include the distance and orientation of the receiver, the temperature andvelocity gradients in the medium, and the environment. Sound power on the otherhand is a fundamental physical property of the source alone, and is therefore animportant absolute parameter which is widely used for rating and comparing soundsources.
dB (decibel) This is the scale on which sound pressure level is expressed. It is defined as 20 timesthe logarithm of the ratio between the root-mean-square pressure of the sound fieldand the reference pressure (0.00002 N/m2).
dB(A) This is a measure of the overall noise level of sound across the audible spectrum witha frequency weighting (i.e. `A' weighting) to compensate for the varying sensitivity ofthe human ear to sound at different frequencies.
LAeq,T This is the equivalent steady sound level in dB(A) containing the same acousticenergy as the actual fluctuating sound level over the given period, T.
Background The A-weighted sound pressure level of the residual
Noise Level noise in decibels exceeded for 90% of a given time
LA90,T This is the dB(A) level exceeded 90% of the time, T.
LA10,T This is the dB(A) level exceeded 10% of the time, T.
LA50,T This is the dB(A) level exceeded 50% of the time, T.
LAmax This is maximum dB(A) level
Residual Noise The noise level in the area without the noise source under investigation.
Facade Noise levels at locations 1m from the facade of a building are described by the termFacade and are subject to higher noise levels than those in open areas (Free-fieldconditions) due to reflection effects.
NR Noise Rating curves, similar to Noise Criteria (NC) curves form a set of noise criteriagiven in octave bands which are set with similar frequency weightings as the A-weighting.
PPV Peak Particle Velocity - vibration measurement parameter that corresponds to thehighest speed in a given direction during a sample period. Often used to assess thepotential for building damage but sometimes used to establish if vibration will beperceptible.
VDV Vibration Dose Value - vibration measurement parameter that combines themagnitude of vibration and the time for which it occurs. The measurement is basedon a form of acceleration which is frequency weighted to reflect human sensitivity tovarious frequencies (see BS 6472).
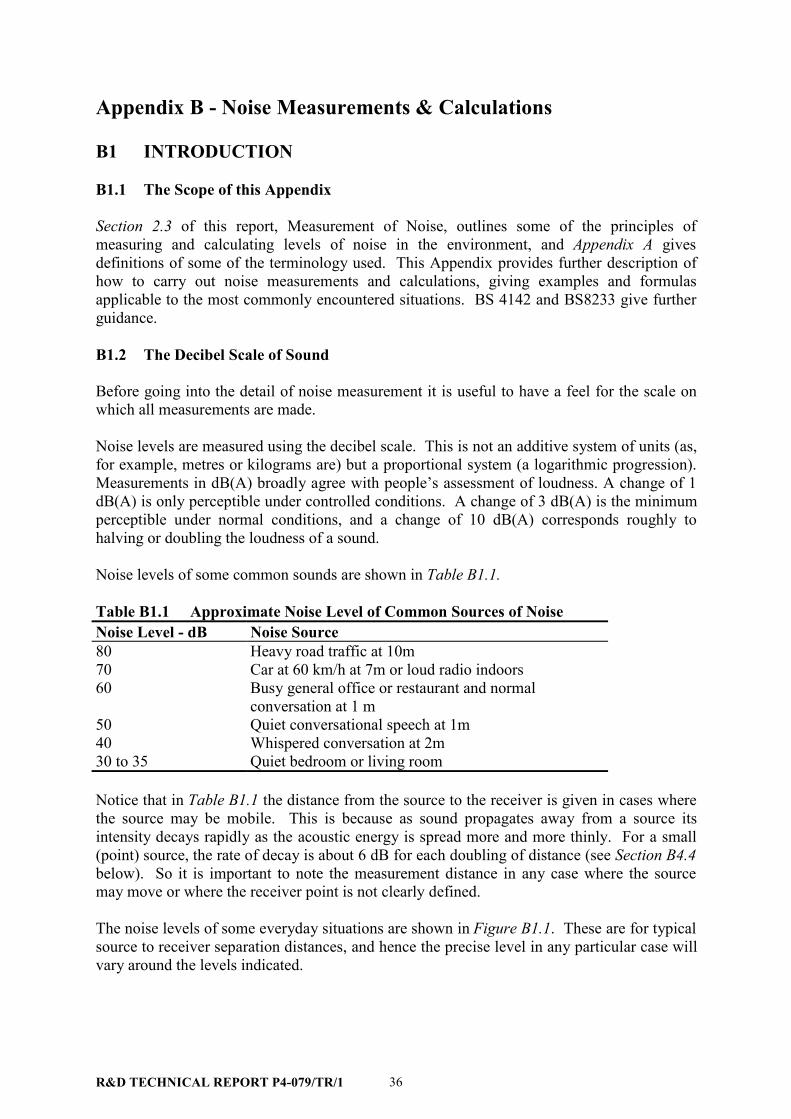
R&D TECHNICAL REPORT P4-079/TR/1 36
Appendix B - Noise Measurements & Calculations
B1 INTRODUCTION
B1.1 The Scope of this Appendix
Section 2.3 of this report, Measurement of Noise, outlines some of the principles ofmeasuring and calculating levels of noise in the environment, and Appendix A givesdefinitions of some of the terminology used. This Appendix provides further description ofhow to carry out noise measurements and calculations, giving examples and formulasapplicable to the most commonly encountered situations. BS 4142 and BS8233 give furtherguidance.
B1.2 The Decibel Scale of Sound
Before going into the detail of noise measurement it is useful to have a feel for the scale onwhich all measurements are made.
Noise levels are measured using the decibel scale. This is not an additive system of units (as,for example, metres or kilograms are) but a proportional system (a logarithmic progression).Measurements in dB(A) broadly agree with people’s assessment of loudness. A change of 1dB(A) is only perceptible under controlled conditions. A change of 3 dB(A) is the minimumperceptible under normal conditions, and a change of 10 dB(A) corresponds roughly tohalving or doubling the loudness of a sound.
Noise levels of some common sounds are shown in Table B1.1.
Table B1.1 Approximate Noise Level of Common Sources of NoiseNoise Level - dB Noise Source80 Heavy road traffic at 10m70 Car at 60 km/h at 7m or loud radio indoors60 Busy general office or restaurant and normal
conversation at 1 m50 Quiet conversational speech at 1m40 Whispered conversation at 2m30 to 35 Quiet bedroom or living room
Notice that in Table B1.1 the distance from the source to the receiver is given in cases wherethe source may be mobile. This is because as sound propagates away from a source itsintensity decays rapidly as the acoustic energy is spread more and more thinly. For a small(point) source, the rate of decay is about 6 dB for each doubling of distance (see Section B4.4below). So it is important to note the measurement distance in any case where the sourcemay move or where the receiver point is not clearly defined.
The noise levels of some everyday situations are shown in Figure B1.1. These are for typicalsource to receiver separation distances, and hence the precise level in any particular case willvary around the levels indicated.

R&D TECHNICAL REPORT P4-079/TR/1 37
Figure B1.1 Noise Levels in Everyday Situations
B2 QUANTIFYING A VARYING SOUND LEVEL
The sound levels we hear are rarely constant. This is because the sound pressure arriving atour ears is usually the result of numerous different sources of noise, each of which may bevarying in strength from one second to the next. Exceptions tend to be when one particularlyconstant source is very loud compared to the rest (eg close to a extract fan in a factory wall)or when all noise sources are at large distances from the receiver (eg in the bedroom of aremote house at night). So, to quantify a noise level we tend to measure it over a period ofseveral minutes by taking numerous very short samples (typically half a second long) and wereport a statistical analysis of sampled levels.
The simplest statistical metrics we can report include the level of the highest noise sample(LMax, the maximum level), the level of the lowest sample (LMin, the minimum level), and themedian (L50). These are commonly used, particularly LMax, as it a measure of the mostobtrusive facet of the noise, even though it may only occur for a split second. LMin is rarelyused, but can be a powerful way of measuring a constant noise in amongst other intermittentnoises.
L50, the median level, or 50th percentile, is hardly ever used. Instead, another form of'average' level is more common, Leq, the equivalent level. Leq is indeed an average of all thesampled levels, but to take account of the logarithmic nature of the decibel scale of sound, itis not the arithmetic mean, it is the logarithmic mean.
The L90 level will be a little above the LMin, and has been adopted as a good indicator of the'background' noise level. Whilst it is not the absolute lowest level measured in any of theshort samples, it gives a clear indication of the underlying noise level, or the level that isalmost always there in between intermittent noisy events.
L10, the tenth percentile, or the level which 10% of the samples exceed, has been shown togive a good indication of people's subjective response to road traffic noise, and in thiscountry is used in assessments of road traffic noise impact. This is presumably because it isthe general peakiness of road traffic noise that people notice, but not the absolute peaks(LMax) that occur only occasionally. It is relevant here, to reiterate the importance of always

R&D TECHNICAL REPORT P4-079/TR/1 38
noting the measurement duration - an LMax measured in a two minute sample of road trafficmay be lower than an LMax measured over a one hour period, depending on the frequency ofvehicle pass-bys. Indeed, for low traffic flows, L10 may be different too. The Calculation ofRoad Traffic Noise gives the following equation for determining the shortest measurementperiod that will give reliable L10 levels for a given traffic flow.
• Minimum period = (4000/hourly flow) + (120/sampling rate).
Usually a measurement period of 15 minutes is adequate to obtain repeatable results. If theobjective of the measurement is to measure the level of a noise source underlying road trafficat low flows (or some other intermittent noise event), a useful technique is to 'pause' thesound level meter during noisy events. Clearly, only part of the noise climate is beingquantified when using this technique.
Road traffic noise is by far the most common source of environmental noise. It variesthrough the time of day and the day of the week as the traffic flow varies. Other factorseffect traffic noise level, but in general there is a familiar pattern of noise levels through theday. Figure B2.1 gives a plot of noise level against time for a period of one week at alocation about 10m from a busy main road within a city.
Figure B2.1 A Time History Plot for Road Traffic Noise
3035404550556065707580859095
100
00:00 12:0026-Aug
00:00 12:0027-Aug
00:00 12:0028-Aug
00:00 12:0029-Aug
00:0012:0030-Aug
00:00 12:0031-Aug
00:0012:0001-Sep
00:00
Date / Time
SPL
dB(A
)
LAeq LA90 LA10 LAMax
SaturdaySunday

R&D TECHNICAL REPORT P4-079/TR/1 39
Figure B2.1 gives the values of LA10, LAeq, LA90, and LAmax for each hour of the day and night.The following typical observations can be made:
• On weekdays the morning and evening peak rush hours are visible.• At night noise levels drop by about 10 dB.• LAmax levels vary over a wide range from hour to hour.• Saturdays and Sundays are generally quieter during the day, but not at night.
Whilst these are typical observations, they are by no means predictable and the pattern ofnoise levels will depend on local conditions. This figure does however illustrate therelationship between the different noise metrics, and also some of the factors to be consideredwhen carrying out a noise measurement which will include road traffic noise.
So, there is a range of noise metrics to choose from to meet the needs of any particularmeasurement situation. Criteria used to assess noise impact have historically used variousmetrics, but in recent years there has been a move towards using LAeq, T wherever possible.This trend is continuing with the European Commission's work on future European noisepolicy.
B3 FREQUENCY ANALYSIS
Introduction
Just as a given noise is characterised by the way in which it varies over time, it will also bemade up of a wide range of different frequencies of noise. The spread of noise energy acrossthe audible frequency 'spectrum' (about 20Hz to 20,000 Hz) is one factor that helps to make itidentifiable to the human ear.
Tonal Noise
Often the highest levels of sound energy will be spread over a wide band of frequencies('broad-band' noise) and the frequency spectrum will follow a smooth curve. Sometimes,however, a noise source will emit noise that is concentrated in a 'narrow band' of thespectrum and contains a high proportion of energy at a single frequency (a 'pure tone').Examples of sources that can give rise to tonal noise include fans, compressors, motors, andtransforms. Most have moving parts that rotate or vibrate at a given, audible frequency.
For example, a fan with four blades, rotating at 600 revolutions per minute (10 times persecond) has a fan blade passing frequency of 40 Hz. Whilst noise from fans is commonly theresult of complex aerodynamic effects, this fan could potentially produce tonal noise at 40Hz. Mains electrical power is a common source of tonal noise, for example in transformers.The 'fundamental' frequency (ie the frequency of the driving force that generates the noise)for main electricity is 50 Hz. Other 'harmonics' may also be produced, at multiples of 50 Hz,(100 Hz, 200 Hz etc) as a result of further modes of vibration being set up in structures or inthe air.
Tonal noise is generally more noticeable and more annoying than non-tonal noise of the samelevel and can be penalised in assessments of noise impact, usually by 5 dB. Whilst tonalitycan be judged subjectively, it will often be useful to measure it. This is achieved through'frequency analysis'. The most common technique is 'third octave band analysis' whereby the

R&D TECHNICAL REPORT P4-079/TR/1 40
sound level meter divides the sound signal into band-widths of 1/3rd of an octave. Each bandis described by its centre frequency. Conventionally up to 10 octaves are covered, centred on32, 63, 125, 250, 500, 1000, 2000, 4000, 8000 and 16000 Hz. Often the first and last are notused. Third octaves split each octave into three, thus they centred at 32, 40, 50, 63 Hz etc.
Figure B3.1 gives an example of a 1/3rd octave band spectrum from a cooling plant inside aplant room.
Figure B3.1 Noise Spectrum from Cooling Plant
A distinct peak can be seen at 50 Hz which would be judged as tonal. BS 7445 givesguidance on tonality, and suggests that where a single 1/3rd octave band level is at least 5 dBhigher than the level in both of the two adjacent bands, then tonal character may be present.The broader peak around 700 Hz would not be judged as tonal.
Conditions or permit levels should require that tonal noise or noise with any other clearcharacter (see BS 4142) is avoided.
Low Frequency Noise
The A-weighting frequency network applies the highest attenuation to low frequencies (eg 26dB at 63 Hz) and when measuring noise with a high content of low frequency energy A-weighting can give non-representative results. There is a recent trend to use ‘linear’ noiselevels (ie with no frequency weighting at all) when quantifying a low frequency noise source.This is a valid technique but would generally require specialist advice.
50
55
60
65
70
75
80
85
90
95
10 100 1000 10000
1/3 rd Octave Band Centre Frequency
dB

R&D TECHNICAL REPORT P4-079/TR/1 41
Noise Rating (NR) Curves
Noise Rating (NR) and Noise Criterion (NC) curves were developed for setting noise limitsin internal rooms. The curves specify limiting sound pressure levels in each separate octaveband, but unlike A-weighting the levels in different bands are not summed in any way.Instead the NR level is taken as the highest NR level in any separate octave. Figure B3.2shows NR 35, 40, 45, and 50 dB curves and a spectrum from a noise source. This source hasits highest NR level of 45 dB in the 1000 Hz octave band and so is rated as NR 45.
Figure B3.2 Sample NR Curves
NR curves are rarely used for environmental noise but have in the past been considered as away of attempting to apply a tighter limit than a dB(A) so as to provide extra assurance thattonality will not be audible. However, even if an NR limit is set below the A-weightedbackground noise level it is still possible that a distinct tone in the new noise source will bediscernible. It is more usual to set noise limits in dB(A) and to specify that the noise shouldhave no discernible tonal character.
B4 CALCULATING NOISE LEVELS
B4.1 Introduction
The best way to establish the noise level in a particular place is to go there and measure it.Similarly, if a particular source of noise is of concern, it is best if there are no othersignificant noise sources to be heard when measuring it. Of course, in reality these idealconditions are not always possible. In these cases it may be necessary to adjust a measuredlevel by calculation to determine the level that is actually of interest. Some of thecalculations that can be used are explained below.
20
30
40
50
60
70
80
10 100 1000 10000Octave Band Centre Frequency (Hz)
dB
NR35
NR40
NR45
NR50

R&D TECHNICAL REPORT P4-079/TR/1 42
B4.2 Adding and Subtracting Noise Levels
In some situations it is possible to deduce the noise level you are interested in by adding ofsubtracting noise level from two or more measurements. For, example, a good way tomeasure the noise level from a piece of building serviced plant is to measure the total noiselevel at the receiver first with the plant running, and then with it switched off. The noiselevel of the plant is then calculated by subtracting the second level from the first. Thissubtraction must be done logarithmically, and can be looked up on Figure B4.1 below.
Figure B4.1 Subtracting Noise Levels
For example, if the difference between the second and the first measured levels is 1.5 dB thenthe plant noise must be at a level 4.0 dB lower than the first measurement.
This chart can be used similarly to add noise levels logarithmically. For example if thedifference between two separate noise levels is zero, then the additive effect is plus 3 dB.
The effect of multiple sources, each of equal level is calculated as+10 Log (number of sources).
B4.3 Façade Effects
When sound is incident on a building (or any acoustically 'hard' surface) the majority of it isreflected back off the façade. Thus a measurement made close to the façade will record thesummation of the noise incident on the façade and the noise reflected away from the façade.The reflected noise is rather like a second source of the same magnitude, and the effect is toadd approximately 3 dB to the level of the incident sound. Measurements should be madeeither at a façade location, approximately 1m from the façade, or in a 'free-field' location, atleast 4m away from any reflective surface (apart from the ground). If the receiver is theoccupant of a building it is better to measure at the façade, since façade effects can be lessthan 3 dB, for example if the noise is not incident perpendicular to the building.
0.0
0.5
1.0
1.5
2.0
2.5
3.0
0 1 2 3 4 5 6 7 8 9 10
Difference Between Separate
Noise Levels dB
Diff
eren
ce B
etw
een
Mea
sure
d N
oise
Leve
ls (d
B)

R&D TECHNICAL REPORT P4-079/TR/1 43
B4.4 Distance Attenuation
Where it is not possible to measure at the receiver it may be necessary to calculate the level atthe receiver from the level measured somewhere else. In general if a parallel location can beused that is the same distance from the source, and is next to the receiver (so it has the samescreening effects etc), then no correction will be needed. If measurements are made on thesite boundary it may be necessary to correct for the additional distance to the receiver. Thisis usually straight-forward.
The general relationships between noise level and distance from source for a point and linesource are as follows.
For a point source:Level at distance B = Level at distance A – (20 x Log (distance B / distance A)).
For a line source:Level at distance B = Level at distance A – (10 x Log (distance B / distance A)).
When measuring at the site boundary a relatively small piece of plant will general be a pointsource. A conveyor or road may be a line source if there is an unobstructed field of view of itfrom the measurement point.
So, for example, if a measurement of noise from a chiller on top if a building gives 60 dB atthe site boundary which is at a distance of 100 m, and the receiver is a further 50 m away,then the calculated level at the receiver is 60 - 20log(150/100)= 56.5 dB.
These simple relationships do not follow where there is significant levels of acousticscreening or acoustically 'soft' ground. BS 5228, Part 1 gives a simple method of calculatingthese effects. Soft ground effects can produce additional attenuation of up to about 3 dB(A)over distances of 100m and up to about 9 dB(A) over 1000m. ISO 9613 gives a moredetailed method that allows for weather conditions.
The more complex the calculation, the lower the certainty in the predicted level, so complexinterpolations of measured levels should be avoided wherever possible.

R&D TECHNICAL REPORT P4-079/TR/1 44
Appendix C - Noise Complaint and Noise Measurement FormsAppCTable C.1 Typical Form for the Repor ting of a Noise Complaint
Sheet No
Noise Complaint Report Form
Date Site Grid Reference
Name and address of complainant
Tel no. of complainantTime and date of complaintDate, time and duration of offending noise
Weather conditions (ie, dry, rain, fog, snow)
Wind strength and direction (ie, light, steady, strong, gusting)
Complainant's description of noise (ie, hiss, hum, rumble, continuous, intermittent)
Has complainant any other comments about offending noise?
Any other previous known complaints relating to installation (all aspects not just noise)
Any other relevant information
Type of installation
Plant and equipment installed
Items working at time offending noise occurred
Operating condition at time offending noise occurred(eg Flow rate, pressure at inlet and pressure at outlet)
Form completed by Signed

R&D TECHNICAL REPORT P4-079/TR/1 45
Table C.2 Noise Measurement Form
Sheet No. of Project No. and Name: Date: / /
Location Time Weather LAeq LA90 LA50 LA10 LAMax Comment
Filters: Frequency Weighting: Time Weighting: Signature: OFF/ 1/1/1/3 Lin/A PK/I/S/F

R&D TECHNICAL REPORT P4-079/TR/1 46
Appendix D - Summary of Relevant Guidance Documents on theAssessment of Noise and Vibration
D1 INTRODUCTION
This Appendix summarises and comments on key guidance documents that can be used toassess noise impacts from new and existing facilities.
The key features of each guidance document and their relevance to IPPC and wastemanagement licensing are highlighted in Section 2. This Appendix gives a fuller descriptionof each in order to offer further guidance of their applicability. However, if in doubt thereader should refer to the full document. A bibliography of all the guidance relevant to thisreport is given prior to the Appendices.
There is a need to consider the relevant assessment approach. In the UK, some guidance (egBS 4142(17)) compares background levels with the noise from a plant. Absolute levels canalso be considered, for example to assess the effect on sleep which may be triggered at anabsolute level. Even when a noise limit is set as an absolute level, one may need to considerthe existing ambient levels if they are already close to the limit that is to be set. AcrossEurope the more common approach is generally to use absolute levels, and European noisepolicy is likely to follow this approach.
In all cases, it will be important that the local conditions are taken into account. Consultationwith the Local Authority will be helpful when determining the approach to be adopted.
The Institute of Acoustics and Institute of Environmental Assessment working group on noiseassessment is also likely to make some important recommendations in their guidance onnoise assessment which is currently being developed. It has not been published at the time ofwriting but a description of the likely scope has been discussed in Section 2.
D2 RELEVANT NOISE GUIDELINES
D2.1 Planning Policy Guidance PPG24
D2.1.1 Introduction
PPG24 (18) establishes Noise Exposure Categories which are applicable when planning newresidential developments affected by transport noise or by mixed noise sources in whichindustrial noise does not dominate. In the case of proposed noise-producing developmentaffecting existing noise-sensitive premises, PPG24 advises that Br itish Standard BS 4142can be used, within its own terms of reference, to predict the likelihood of complaints.As such PPG24 is not as relevant as BS 4142 in most cases that will be encountered inthe permitting process under the IPPC and waste management licensing regime.
PPG24 also introduces the concept of Noise Exposure Categories (NECs). These categoriesare intended to be used to provide guidance on the levels of acceptable noise for new housing
(17) British Standard BS 4142 (1997) Method for rating industrial noise affecting mixed residential and industrial areas.(18) Planning Policy Guidance 24 Planning and Noise, 1994, DoE

R&D TECHNICAL REPORT P4-079/TR/1 47
developments that should be taken into account when determining planning permissionconditions relating to noise insulation. The NECs are not intended for use in reverse, ie forassessing noise impacts of new noise sources on existing housing. However, the derivationsof these are explained and this background research is often used to develop absolutecriterion for noise levels.
D2.1.2 Noise Exposure Categor ies
PPG24 does not offer a single set of criteria, but introducing the concept of Noise ExposureCategories (NECs) that provide flexibility to take account of local conditions and the needs ofthe local community and economy. There are four NECs:
A. Noise need not be considered as a determining factor in granting planning permission,although the noise level at the high end of the category should not be considered asdesirable.
B. Noise should be taken into account when determining planning applications and, whereappropriate, condition imposed to ensure an adequate level of protection against noise.
C. Planning permission should not normally be granted. Where it is considered thatpermission should be given, for example because there are no alternative quieter sitesavailable, conditions should be imposed to ensure a commensurate level of protectionagainst noise.
D. Planning permission should generally be refused.
Table D2.1 reproduces the table in PPG 24 that gives the noise levels for each NEC for eachsource of noise.
Table D2.1 Recommended Noise Exposure Categor ies for New Dwellings NearExisting Noise Sources.
Noise levels (a) Corresponding to the Noise Exposure Categor ies forNew Dwellings LAeq,T dB
Noise exposure categoryNoise source A B C DRoad traffic07.00 - 23.0023.00 - 07.00(b)
<55<45
55 - 6345 - 57
63 - 7257 - 66
>72>66
rail traffic07.00 - 23.0023.00 - 07.00(b)
<55<45
55 - 6645 - 59
66 - 7459 - 66
>74>66
air traffic(c)
07.00 - 23.0023.00 - 07.00(b)
<57<48
57 - 6648 - 57
66 - 7257 - 66
>72>66
Mixed sources(d)
07.00 - 23.0023.00 - 07.00(b)
<55<45
55 - 6345 - 57
63 - 7257 - 66
>72>66

R&D TECHNICAL REPORT P4-079/TR/1 48
D2.1.3 Der ivation of Noise Exposure Categor ies
The type of noise source covered by PPG24 that is most relevant to the IPPC and the wastemanagement licensing regime is 'mixed sources', ie a combination of road, rail, air anindustrial noise. PPG24 explains how the NEC levels for noise from mixed sources are set atthe lowest numerical values of the single source limits, reproduced in Table D2.1 above.
Annex 2 of PPG24 offers explanations of the how the NEC levels are set for each source ofnoise. It explains how for road and rail noise there is no recent major research from which toobtain the scale of noise effects. For aircraft noise several major studies have beenundertaken by the Department of Operational Research and Analysis (DORA) of NationalAir Traffic Services. However, for all types of noise source a common rationale separates theNECs, and this provides a useful indication of the magnitude of the noise impact that can beexpected in each category.
Boundary of NEC A/B : Taken as the onset of noise impacts taken from World HealthOrganisation research (see Section D2.3 below).
Boundary of NEC B/C : Based on the levels that trigger noise insulation for transportationnoise. Hence indicative of the threshold at which the severity of noise impacts become veryundesirable.
Boundary of NEC C/D : Taken as the level above which noise insulation becomes insufficientto mitigate noise impacts. Hence indicative of the level at which noise impacts become verysevere.
The day/night levels of LAeq, period 55/45 dB used as the boundary of NEC A and B have beenwidely adopted as the levels which represent the onset of community noise effects. Underdeveloping EU noise policy, for example, they are the long-term target noise levels forMember States to aim for. Whilst levels lower than this are frequently enjoyed in more rurallocations, it can be argued that even if noise levels in such areas are increased, provided theyremain below these levels a good standard of noise climate will be maintained. However,there are initiatives to preserve quiet. Evolving European noise policy is recognising thevalue of quiet or tranquil areas and the need to maintain them. Also the Council for theProtection of Rural England (CPRE) has defined tranquil areas and produced maps of them.
D2.2 British Standard BS 4142
Planning Policy Guidance PPG24 suggests that the approach in BS 4142 should form thebasis of the operational noise assessment. BS 4142 describes a method for determiningindustrial and background noise levels outside residential properties and for assessingwhether the industrial noise is likely to give rise to complaints from the occupants.
The BS 4142 assessment methodology involves the following procedure:
• background (LA90) noise levels (BNL) in the absence of the new noise source are measuredat noise-sensitive receptors;

R&D TECHNICAL REPORT P4-079/TR/1 49
• noise levels due to the facility are then quantified, ie predicted in the case of proposeddevelopments, for the receptor location as an LAeq (using the procedures set out in thestandard);
• noise levels are corrected, if appropriate, for duration and character, with the correctednoise levels being termed the rating levels and expressed in LAeq; and
• rating levels are then compared with the BNLs for the area.
The correction for tonal, impulsive or any distinctive character in the noise source is +5dB.
The interpretation of the difference between the rating level and the BNL is shown in TableD2.2.
Table D2.2 Interpretation of Noise Level DifferenceDifference in noise level (dB) Significance
Around +10 Complaints are likely
Around +5 Marginal
<+5 Decreasing likelihood of complaintwith decreasing difference in levels
-10 Positive indication that complaints areunlikely
BS 4142 requires that daytime assessments are based on the highest LAeq from the noisesource over a period of 1 hour, while at night-time an assessment period of 5 minutes isspecified.
Table D2.2 is useful in determining the likelihood of complaints in a given situation, but if itis to be used to determine an acceptable noise permit level then great care is needed. ThisBritish Standard is commonly misused in this way. When used for assessing acceptable noiselimits several factors that are unique to the local situation must be considered, including:
• the absolute levels of ambient noise in the area;• the types and characteristics of noise present;• the planning setting with regards to other future noise sources; and• local opinion on the noise environment.
Taken on face value Table D2.2 could be interpreted to indicate that if a new noise source isat a level between 10 dB below and 5 dB above the existing background noise level thencomplaints are not likely and hence such a level is 'acceptable'. In this sense BS4142 offerslimited guidance because this range of levels is large. It is the local conditions that will helpdetermine where in this range 'acceptability' lies. The following examples illustrate somesituations where certain interpretations of BS 4142 could be misleading.

R&D TECHNICAL REPORT P4-079/TR/1 50
Where background noise levels are very low, below LA90 30 dB, BS 4142 warns that theguidance may not apply. Applying a -10 dB limit of below LAeq, night 20 dB to ensure apositive indication that complaints are unlikely would therefore be inappropriate.
A new type of noise may be clearly more discernible above a very different type ofbackground noise, for example distant traffic that tends to form a steady broadband noise. Insuch cases a limit of background +5 dB for a new source may not be appropriate.
Adopting the +5 dB 'marginal' case as acceptable can be inappropriate if there is a likelihoodof other future developments adding further to ambient noise levels in the future. This is theso-called 'creeping background' concern that sometimes arises around developing industrialareas. This concern can be valid in some cases, but in others it my not be so serious, forexample if road traffic noise is the main source of noise actually experienced by the receiverlocations, and changes in industrial noise will have little effect on total noise levels at thereceivers. In some cases theoretical calculations of additive noise effects from futuredevelopments can be misleading. Noise levels from different sources may not add accordingto simple theory (see Appendix B). For example if they have different frequency components,different temporal patterns, different screening effects, or arrive at a property from differentdirections and so effect different facades or will not peak under any one set of meteorologicalconditions.
If little future development is expected adopting a cautious approach of setting permit level at-10 dB may be unnecessary, depending on other local factors, particularly if ambient noselevels are low in absolute terms.
Finally, in situations where there is a history of noise disturbance from whatever source, thelocal community may have become 'sensitised' to noise impacts. In such cases the 'average'dose-response relationships which form the basis of noise standards may not hold and theremay be more complaints. In such cases limits at the lower end of the BS4142 range may bemore appropriate, depending on other local factors.
Of course all these local factors interrelate, and for this reason it is not possible to offerprescriptive guidance on how to apply BS 4142. Indeed there is much criticism of the waythe standard is applied and this may lead to a revision after 2002. In the meantime BS 4142must be used with care when setting noise permit levels.
D2.3 World Health Organisation
In 1980 the World Health Organisation (WHO) proposed environmental health criteria forcommunity noise (19). In 1995 Stockholm University and Karolinska Institute published theessentials of WHO’s revised guidelines (20) and in December 1999 the latest guidance waspublished as the WHO Guidelines for Community Noise (21). The guidance quotes over 300bibliographical references and forms an authoritative summary of scientific knowledge on thehealth impacts of community noise. It is important to note the declared scope of WHO’sefforts is to consolidate actual scientific knowledge on health impacts rather than to set
(19) Environmental Health Criteria - 12 Noise, WHO, 1980(20) Community Noise, Archives of the Centre for Sensory Research, Stockholm University, Vol 2. Issue 1. Berglund & Lindvall, 1995.(21) Guidelines for Community Noise , WHO, 1999.

R&D TECHNICAL REPORT P4-079/TR/1 51
standards that might be applicable to given situations. The document is arranged in five mainchapters, the contents of which are discussed below.
Chapter 1 introduces the guidelines. It includes information on current levels of noiseexposure, and notes that in the European Union about 40% of the population is exposed toroad traffic noise with an equivalent noise level exceeding 55dB(A) during the day.
Chapter 2 discusses noise sources and measurement techniques.
Chapter 3 describes the adverse health effects of noise, such as hearing impairment, sleepdisturbance, physiological functions, social and behavioural effects, and vulnerable groups.
Chapter 4 gives guideline noise values for health effects and specific environments. Those ofmost relevance to this R&D report will generally be those that relate to dwellings andresidential areas, and are summarised in Table D2.3. Guidelines for other areas are alsogiven.
Table D2.3 Guideline Values for Community Noise in Residential EnvironmentsSpecificenvironment
Cr itical health effect(s) LAeq[dB(A)]
Time base[hours]
LAmaxfast[dB]
Outdoor living area Serious annoyance, daytime and eveningModerate annoyance, daytime and evening
5550
1616
--
Dwelling, indoors
Inside bedrooms
Speech intelligibility & moderateannoyance, daytime & evening
Sleep disturbance, night-time
35
30
16
8 45
Outside bedrooms Sleep disturbance, window open (outdoor values) 45 8 60
The guidance suggests that for continuous noise an internal LAeq below 30 dB is required ifnegative effects on sleep are to be avoided, and where the background noise is low levelsabove LAMax 45 dB should be limited. Information on the complex nature of sleepdisturbance due to noise is given as background to these values and others.
The guideline values given in this chapter can be converted to external noise levels, andapplied to industrial noise, say as limits at the nearest receptor, thus fulfilling the WHO’sobjective of avoiding health effects, but whether or not such limits would be appropriate andreasonable, and whether they would ensure BAT is employed to control noise emissions froma given site, will depend on the many local factors that should also be carefully considered insetting a permit level.
Chapter 5 offers general guidance on noise management, but is necessarily concerned withthe general situation rather than specifically with noise permitting for new or extendedindustrial facilities.

R&D TECHNICAL REPORT P4-079/TR/1 52
D2.4 British Standard BS 8233
Planning Policy Guidance PPG24 suggests that BS 8233(22) should be used if it is necessaryto consider noise levels within buildings. This may be the case if the affected buildings arenon-residential or if external areas are not of concern and for some reason acoustic insulationpackages are already installed at a building.
BS 8233 gives recommendations for the control of noise in and around buildings, andsuggests appropriate criteria and limits for different situations. The standard makes it clearthat these cr iter ia and limits are pr imar ily intended to guide the design of new orrefurbished buildings, rather than to assess the effects of changes in external noise level.The criteria and limits given are therefore of limited relevance to IPPC or waste managementlicensing situations. However, the standard contains other general information on noisecontrol and noise calculations that may be useful, including:
• Sound insulation data for various building elements.
• General noise calculation methods, such as adding and subtracting noise levels andcalculating noise insulation of composite building facades.
• A-weighting corrections and Noise Rating (NR) curves.
• Discussion on the Mass Law and special noise insulation problems that may requireexpert advice.
D2.5 Minerals Planning Guidance MPG11
Minerals Planning Guidance MPG11 (23) describes the government’s policy on noise fromSurface Mineral Workings. MPG11 notes that waste disposal sites share many commonfeatures with surface mineral working, and much of the advice contained in these guidelineswill be appropriate to noise control of such operations. As such, MPG11 will be useful forassessing the noise from landfill operations that are covered by IPPC. MPG11 recommendsthe use of BS 5228 to predict noise levels.
This planning guidance document adopts the approach of a single absolute noise limit. Thebasic criterion it recommends for daytime operations is a nominal noise limit of 55 dB LAeq,1
hour (free-field) at noise sensitive properties used as dwellings. In this case, 1 hour means anyof the one-hour periods during the defined working day.
However, it is recognised that in the case of quieter rural areas, where a 55 dB LAeq,1 hour(free-field) limit would exceed the existing background level by more than 10 dB(A), a lowerlimit may be appropriate. It is recommended that a limit below 45 dB LAeq,1 hour (free-field) isnot normally used since 45 dB LAeq,1 hour (free-field) should prove tolerable to most people inrural areas.
MPG11 also states that it will often be necessary to raise the noise limits to allow temporarybut exceptionally noisy phases in the mineral extraction operation which cannot meet the
(22) BS 8233: 1999 Sound insulation and noise reduction for buildings – Code of practice, BSi, 1987(23) The control of Noise at Surface Mineral Workings, DoE, 1993.

R&D TECHNICAL REPORT P4-079/TR/1 53
limits set for routine operations. It is suggested that any higher noise limit as well as theduration of any such temporary phases is agreed between the Mineral Planning Authority(MPA) and the mineral operators taking account of local circumstances.
The guidance suggests that noise limits of 70 dB LAeq,1 hour (free-field) for temporaryoperations may be appropriate.
D2.6 British Standard BS 5228
British Standard 5228 (24) Noise and vibration control on construction and open sites hasfour parts:
• Part 1. Code of practice for basic information and procedures for noise and vibrationcontrol (1997).
• Part 2. Guide to noise and vibration control legislation for construction and demolitionincluding road construction and maintenance (1997).
• Part 3. Code of practice applicable to surface coal extraction by opencast methods (1997).
• Part 4. Code of Practice for noise and vibration control applicable to piling operations(1992).
The standard forms a series of codes of practice for construction sites. However sections ofPart 1 provide useful guidance for any situation where noise is generated by plant outdoors,for example on landfill sites. The bulk of Part 1 provides a method of calculating noise fromconstruction plant, including:
• tables of source noise levels;• a methods for summing up contributions from intermittently operating plant;• a procedure for calculating noise propagation, over ‘soft’ or ‘hard’ ground;• a method for calculating noise screening effects; and• a way of predicting noise from mobile plant, such as those on haul roads;
Part 1 also provides guidance on the following subjects for construction sites that may also beuseful in other outdoor situations;
• legislative background;• community relations;• training;• noise and vibration neighbourhood nuisance;• project supervision; and• control of noise and vibration.
On the last subject, the standard gives examples of the noise control achievable throughvarious methods (such as exhaust silencers and enclosures) and also gives diagrams
(24) BS5228, Noise and vibration control on construction and open sites, parts 1,2,3 and 4: BSi, 1997.

R&D TECHNICAL REPORT P4-079/TR/1 54
illustrating simple designs of noise enclosures and barriers that can be built and used onconstruction sites.
In summary, BS 5228 provides guidance that may be useful when predicting noise andconsidering noise control techniques for plant operating outdoors, in particular for landfillsand waste transfer stations.
D2.7 The Engineer ing Equipment and Mater ial Users Association Guide to the Use ofNoise Procedure Specification EEMUA publication 141 (1985)
The EEMUA method describes measurement of noise from plants, setting noise limits, andusing prediction to investigate the effect of implementing noise control. A method forestablishing frequency band noise limits is also proposed to limit the potential for tonalelements in the noise that may be more distinctive than a broad-band noise. An absolute lowfrequency limit is proposed in the 31.5 Hz band to enable low frequency combustion sources(such as gas turbines and boilers) to be controlled.
D3 VIBRATION CRITERIA
D3.1 British Standard BS 5228
BS 5228 Part 4 (25) is strictly applicable to control of vibration from piling operations andnot operational facilities. However, it describes parameters to be measured during a vibrationassessment at various facilities and states that the human threshold of perceptibility rangefrom 0.15 to 0.3 mm/s (ppv) at frequencies between 8 to 80 Hz.
D3.2 British Standard BS 6472.
BS6472 (26) is a method of assessing vibration effects on human beings. Criteria areincluded that indicate likely levels of annoyance from vibration exposure. ppv curves areshown that indicate the point at which low probability of complaints will be expected. Thelowest value in any of the assessment curves, at any frequency, is 1.41 x 10⁻⁴ m/s. Significanthuman vibration issues should not be expected at this level. This level is slightly lower thanthe threshold of perceptibility described in BS 5228.
Vibration disturbance assessments are complex and they require the use of specialisedequipment (particularly to measure VDV). A screening assessment could be carried out toestablish if there is a potential for a vibration problem. If the following two conditions aremet, it may be appropriate to commission a detailed survey:
• the vibration is perceptible at the sensitive off-site areas; and• a ppv vibration measurement shows that the levels are higher than 1.41 x 10⁻⁴ m/s.
(25) Noise control on construction and open sites: part 4. Code of practice for noise and vibration control applicable to piling operations, BSi,1992.(26) Guide to Evaluation of human exposure to vibration in buildings (1 Hz to 80 Hz), BSi, 1992.

R&D TECHNICAL REPORT P4-079/TR/1 55
Appendix E - Noise Control Equipment Information Sheets
Sheet 1 Acoustic Enclosures
Picture used with the permission of Industrial Acoustics Ltd
Acoustic enclosures form a complete box around a piece of equipment and include acousticsdoors, windows and attenuated ventilation or cooling systems.
Description
Where equipment can operate ina confined space it can becompletely enclosed by highperformance metal acousticpanels. Doors, windows andother openings require specialattention and proprietaryenclosures ensure optimal design.Openings to provide adequate airflow for cooling are usually theacoustically weak points and highperformance attenuators arerequired.
Vibration isolation is usuallyrequired between the equipmentand the floor.
Application
Generators, compressors, pumps, process equipmentrequiring substantial attenuation but minimal accessand maintenance.
Performance
20-30 dB(A) limited mainly by silencing of openingsand doors.
Cost
Enclosures with surface areas of 30 m2, installed withattenuators:
20 dB - £5,00030 dB - £7,000

R&D TECHNICAL REPORT P4-079/TR/1 56
Sheet 2 Acoustic Louvres
Acoustic Louvres are similar to weather louvres but provide additional attenuation of noisethat passes through them.
Description
Acoustic Louvres can be used toreplace weather louvres inbuilding openings to reducenoise transfer to outside.Alternatively free-standingacoustic louvres can be placedaround external equipment thatrequires air flow for cooling.Air is allowed to flow betweenthe louvre blades, but noise isattenuated by absorptivematerial within each blade.
Acoustic louvres can producehigh pressure drops to the airflowing through them whichmay create heat load problems tothe plant.
Application
Chillers, compressors, pumps, heat pumps, otherexternal equipment requiring air flow.
Performance
Low frequency performance in limited. The noisepath over the top of a louvre screen will usually limitperformance to up to about 10 dB(A). Back to backacoustic louvres (ie two louvres fixed together) canincrease performance to about 15 dB(A).
Cost
Single acoustic louvres - £300 / m2
Back to back louvres - £400 / m2

R&D TECHNICAL REPORT P4-079/TR/1 57
Sheet 3 Noise Barr iers
Picture used with the permission of Industrial Acoustics Ltd
Acoustic Barriers are solid structures located close to equipment to provide acousticscreening between source and receiver.
Description
Noise barriers can be made fromacoustic panels, but usuallybrick/ block walls or solidwooden fences are adequateunless reverberation behind thebarrier is a concern. Barriersrequire a minimum density sothat noise passing through thebarrier is attenuated to belowthat passing over the top.Barriers are most effective whenlocated close to the noise sourceand can be painted or landscapedto minimise visual impact.Transparent materials have alsobeen used. Earth bunds can beeffective barriers, trees cannot.Barriers must be solid withoutany holes or openings.
Application
Most equipment whose noise sources are close to theground or a flat roof.
Performance
Performance increases with the ‘path difference’; thedifference between the direct path (through the barrier)and diffracted noise path over the top edge of thebarrier. A path difference of zero (ie when the line ofsight from noise source to the receiver is just broken)implies 5 dB(A) attenuation. In practice a performanceof greater than about 15 dB(A) requires very largebarriers and is rarely practicable.
Cost
Noise barrier fences can cost as little as £150 per linearmeter but can be considerably more expensive if theyare tall or made from superior materials.

R&D TECHNICAL REPORT P4-079/TR/1 58
Sheet 4 Acoustic Panelling
There are many types of acoustic panel, but most are designed to absorb sound incident fromone side.
Description
Acoustic panels are generallybetween 40 and 200 mm thick andare made from a sandwich of coatedsteel sheets, with a mineral fibre in-fill. On one side of the panel themetal sheet is perforated to allowsound to pass inside where it isabsorbed by the in-fill material.Acoustic panels can be designed tooffer very high attenuation to noisetransmission that is better than anequivalent solid structure of thesame weight. Also, their absorptiveproperties are used to controlreverberation in confined spaces.
Application
Acoustic Panels are the building blocks ofmany acoustic products. Used alone they canreplace conventional walls or partitions, or usedto line plant rooms within existing structures.
Performance
Attenuation to sound transmission can be up toabout 40 dB(A).
Absorption can be over 90% at middle and highfrequencies.
Cost
Acoustic panels need not be expensive, butprices increase if attractive finishes arerequired.£100-150 / m2

R&D TECHNICAL REPORT P4-079/TR/1 59
Sheet 5 Acoustic Lagging
A flexible material wrapped around noise sources in the same way as thermal lagging.
Description
Acoustic lagging is generallymade of a laminated quiltcomprising a tough outer skin,mineral fibre quilting and aheavy (often lead) internal layerproviding mass. Such lagging isflexible and can be fitted aroundcomplex shapes and is ideal forsealing holes and gaps aroundsolid acoustic elements. Asimilar product can be hung asacoustic curtain around plantthat is moved frequently of invery confined spaces.
Application
Lagging to pipes and ducts. Sealing around mostacoustic installations.
Acoustic curtain for pumps, fans, hand tools etc.
Performance
10 to 15 dB(A)
Cost
Relatively expensive per unit area, but generally used insmall quantities.
£15-30 per m2

R&D TECHNICAL REPORT P4-079/TR/1 60
Sheet 6 Vibration Damping
Damping materials applied as an adhesive, flexible ‘putty’ or sheeting to vibrating metalsheeting.
Description
Metal sheeting, has a tendency to‘ring’ when vibrated by heavymachinery. Large unsupportedareas of metal can be veryefficient at converting vibrationalenergy into audible frequenciesand radiating noise, rather like aloud speaker cone. Casings andguards can be damped usingvarious damping or ‘anti-drumming’ compounds.
Application
Casings and guards to most machinery, eg conveyors,pumps. Rotating parts.
Performance
Performance varies, but 10 dB(A) is achievable.Damping of machinery casing is most effective onlarge areas of thin gauge metal.
Cost
Variable depending on product.

R&D TECHNICAL REPORT P4-079/TR/1 61
Sheet 7 Impact Deadening
Noise generated by impacts on metal surfaces such as loading material into dump trucks, canbe reduced by applying a resilient surface treatment.
Description
Deadening materials can be useful onmetal floors, chutes or containers, butthere are practical problems with wearand tear. For metal floors blended resincompounds have been developed thatdamp noise generated by trolley wheelsand foot falls whilst offering adequategrip, strength and weatherproofing.Metal chutes and lorry holds can besurfaced with abrasion-resistant rubberto reduce noise generated by materialimpacts. Resilient materials can also beused to help reduce noise generated byinherently noisy material, eg barrels,scrap metal and pipes.
Application
Metal floors or wall coverings in warehousesor industrial stores.
Lorries, metal chutes, hoppers.
Performance
Impact noise can be reduced by 10 dB(A) ormore.
Cost
Metal floor treatment - approximately £66 perm2.
20 Tonne Dump Truck - £26,000.

R&D TECHNICAL REPORT P4-079/TR/1 62
Sheet 8 Attenuators
Attenuators are designed to allow air to flow between a series of splitters which absorb noise.They come in all shapes and sizes.
Description
Attenuators can be part of a ducted airflow system or can be inserted in a wall,partition or enclosure opening. Severalsplitters divide the air flow. Splitterscomprise perforated metal or rigid meshenclosing an acoustic in-fill which isgenerally some form of mineral fibre.Problems include degradation of the in-fill material and pressure loss (energyconsumption) due to restricting the airflow. Excessive air flow speed canregenerate noise. These problems do notprevent attenuators being very widelyused in industry.
Application
Standard attenuators : heating, ventilation andair conditioning systems, fans.
Specialist attenuators: as used on motorvehicles, modified materials allow hightemperature and corrosive gas discharges to besilenced.
Performance
Performance is a function of attenuator lengthand the ratio of the cross-sectional areas of thesplitters and the whole attenuator. Up to 45dB(A).
CostApproximately £250-400 /m3. Specialistapplications can be very expensive.

R&D TECHNICAL REPORT P4-079/TR/1 63
Sheet 9 Steam and Air Diffusers
Metal fittings attached to the outlets of high pressure steam or air discharge.
Description
Steam traps and compressed airvalves, used in petrochemical,food and other process plants torelease excessive pressure,generate noise because of the highpressure and velocity of thedischarge. The discharge flow canbe passed through a diffuser ofenlarged diameter filled with aflow resistant material such asstainless steel wool to slow downthe gas speed, thus reducing noisegeneration.
Application
Steam and high pressure air system discharges.
Performance
Performance is best at mid to high frequencies andtypically gives up to about 15 dB(A).
Cost
Simple steam trap diffuser - Approximately £20 each.
Specialist compressed air attenuators can beexpensive.

R&D TECHNICAL REPORT P4-079/TR/1 64
Sheet 10 Vibration Isolation Mounts
Spring or rubber mounts located between vibrating plant and their supporting structure reducethe transfer of vibrational energy into the structure where it may transferred and re-radiate asunwanted noise.
Description
Stiff springs or lowcompliance rubber/neoprenepads are housed in metalretaining fittings forming amount or hanger to which theplant is bolted. The mount isdesigned to be deflected understatic load and to absorb thepredominant frequencies atwhich the plant oscillates. Inpractice this means selecting amount whose naturalfrequency is well below thedriving frequencies in theplant. Poor installation canlead to flanking paths, poorperformance or amplification.
Application
Vibration isolation mounts can be fitted to mostmechanical equipment, including pumps, fans, generators,compressors, and also to pipes, and ductwork.
Performance
Vibration isolation can be almost complete for correctlyselected mounts. Installation is harder for large heavyplant and performance can be compromised at lowerfrequencies. Noise reduction performance will depend onthe surrounding structure and its noise transfer andradiation characteristics.
Cost
Modest costs for simple installations requiring typically 4to 10 mounts, depending on loading and supportrequirements (see Sheet 11).

R&D TECHNICAL REPORT P4-079/TR/1 65
Sheet 11 Iner tia Bases
A massive, usually concrete, block onto which the plant is mounted via anti-vibration mountsor pads.
Description
Mounting equipment on spring orrubber isolators makes the systeminherently unstable and can compromisethe safe operation of the plant. Theseproblems can usually be overcome withinertia bases which provide thefollowing benefits; lower centre ofgravity, reduced movement during startup, and even spreading of load.
Where plant is permitted a degree offreedom to move on such systems,flexible connectors may be required inpipework or other services to preventfatigue and vibration transfer viaflanking paths.
Application
Mainly applicable to large heavy machinery incombination with vibration isolation mounts orsometimes rubber/neoprene pads for extrastability.
Performance
See vibration isolation Mounts (sheet 10).
Cost
Inertia bases can increase the cost of vibrationisolation, particularly if one-off design isrequired.

R&D TECHNICAL REPORT P4-079/TR/1 66
Appendix F - Case Studiesp FF1 CHANGE OF PROCESS IN A FOUNDRY
F.1.1 Background
The organisation described in this study produce malleable metal castings for fluid movementsystems. For many years their foundry has been operating using a coke fired cupola furnaceto melt scrap metal and limestone to produce molten raw material.
A cupola furnace operates by melting metal in a large bowl or crucible which is heated, inthis case by solid fuel burnt in the crucible. Metal and other raw materials are added atregular intervals, melt in the heat produced by the solid fuel and form a flux which then runsout in a continuous stream of molten metal. The heating and melting of the various materialsproduces a large amount of fume which is drawn off by extraction systems and treated toreduce its toxicity before being discharged to atmosphere.
Noise from the cupola system and associated operations was apparent in residential areassome distance from the site. Concerns over noise emission from the site affecting both theexisting residential areas and proposed new developments prompted a comprehensive noisesurvey. A strategy to develop a noise control programme resulted which addressed bothexisting noise sources and future projects including a New Electric Melt Facility to replacethe old cupola system. The development of the Electric Melt significantly reduced the impactof site noise in residential areas.
F1.2 Descr iption of the Site
Originally a green field development, the 20 acre site produces castings for pumps and valvesusing scrap metal from local sources. A large number of dust and fume extraction systemsare located close to the boundary. Over many years residential developments have takenplace around the site, some of which are adjacent to the site boundary, with further residentialdevelopments planned (see Figure F1.1).
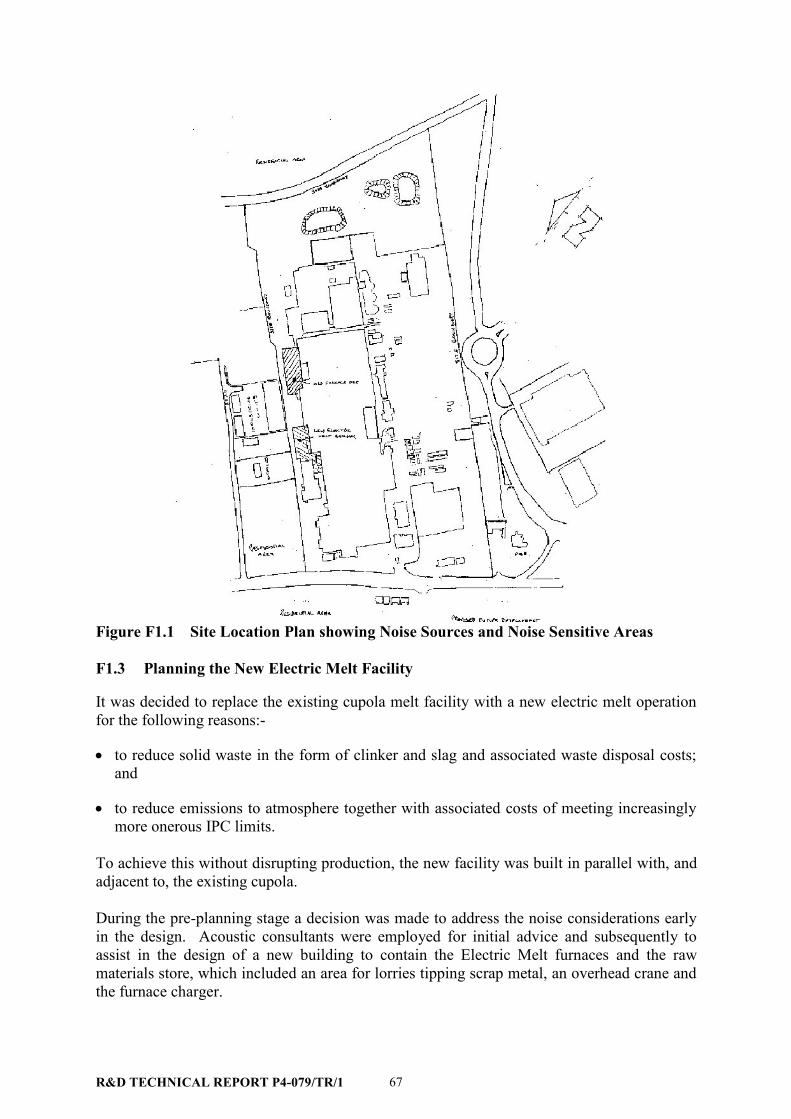
R&D TECHNICAL REPORT P4-079/TR/1 67
Figure F1.1 Site Location Plan showing Noise Sources and Noise Sensitive Areas
F1.3 Planning the New Electr ic Melt Facility
It was decided to replace the existing cupola melt facility with a new electric melt operationfor the following reasons:-
• to reduce solid waste in the form of clinker and slag and associated waste disposal costs;and
• to reduce emissions to atmosphere together with associated costs of meeting increasinglymore onerous IPC limits.
To achieve this without disrupting production, the new facility was built in parallel with, andadjacent to, the existing cupola.
During the pre-planning stage a decision was made to address the noise considerations earlyin the design. Acoustic consultants were employed for initial advice and subsequently toassist in the design of a new building to contain the Electric Melt furnaces and the rawmaterials store, which included an area for lorries tipping scrap metal, an overhead crane andthe furnace charger.

R&D TECHNICAL REPORT P4-079/TR/1 68
F1.4 Assessment of Noise Impact at Receivers
Noise from the existing stock yard, including handling of scrap metal, overhead crane andcharger operations and noise emission from the extraction systems, resulted in adverse noiseimpacts on nearby residential areas. Noise from the site included continuous tonal noise andhigh levels of intermittent impulsive noise.
Measurements of noise from the extraction systems taken at the adjacent site boundaryshowed the frequency spectrum given in Table F1.1, with a clear tone apparent at 250 Hertz:
Table F1.1 Measured Noise Frequency Spectrum at Site BoundaryFrequency 63 125 250 500 1000 2000 4000 Her tzDecibels 68 66 74 63 57 54 50 DB
Impulsive noise was apparent at the site boundary when the overhead crane dumped metalinto the feeder for the cupola charger. This operation took place every 45 minutes and lastedfor approximately 10 minutes. Other intermittent impulsive noise in the stock yard adjacentto the charger was produced by forklifts discharging coke, limestone and metal returns, anddelivery lorries tipping their loads of raw materials and scrap metal. These operationstypically produced LAmax levels 20 dB above the general site noise.
An environmental noise survey carried out in and around the foundry indicated LAeq noiselevels of 17dB above background in the nearby residential areas, a situation which wasclearly unacceptable.
Tonal noise from the cupola wet scrubber discharge chimney was apparent at a distance ofover 500 metres. Impact noise from lorries discharging metal was distinct at a greaterdistance. Low frequency noise from the dry dust extraction systems associated with thecupola melt was also apparent in nearby residential areas.
F1.5 Identification of Noise Sources
Following initial discussions to identify the requirements for noise control and possiblemethods of meeting those requirements, a further noise survey was conducted specifically toidentify noise levels associated with the operation of the cupola melt system. The surveycomprised of a number of measurements made near to the main noise sources in order toidentify their relative contribution to the overall noise level experienced at receivers outsidethe site. The noise survey was followed by a BS4142 noise assessment which showed RatingLevels 22dB(A) above daytime background noise levels, and 14dB(A) above night-timebackground noise levels, at the boundary adjacent to nearby noise sensitive receivers. As partof the on-going noise reduction programme, a target for total site noise emission at theseboundaries had been set. This target required an overall reduction in site noise Leq levels of17dB(A).
The cupola operated on a continuous 24 hour basis. It was fed with raw materials by avibrating conveyor charger and an overhead gantry crane, both of which were locatedexternally in a stock yard. The cupola extraction system operated through a wet scrubberwhich discharged at high level, with a secondary dry dust extraction system outlet exhaustingat low level.
R&D TECHNICAL REPORT P4-079/TR/1 69
Melt operations consisted of three distinct phases with the following associated levels ofnoise emission:
• Delivery lorries arriving and discharging scrap metal during the day producing maximumnoise levels during tipping of LAmax 110dB at 10m.
• Charger filling with the overhead crane dropping scrap metal into the charger producingintermittent noise levels of LAmax 96dB at 10m, and the vibrator conveyor producing acontinuous noise level of LAeq 78dB at 10m.
• Furnace operation with a continuous noise level of LAeq 79dB at 10m from the wetscrubber system with a distinct tone at 250 Hertz, and LAeq 73dB at 10m from the dry dustextraction system with large low frequency components at 63Hz and 125 Hz
The resultant cumulative noise level at the site boundary adjacent to the cupola stock yardwas LAeq 78dB with distinct tonal characteristics and intermittent high levels of impulsivenoise.
F1.6 Noise Control Techniques
The design of the new electric melt facility had to achieve the desired level of noise reductionwhilst addressing a number of operational requirements, including:
• the requirements of overhead crane movements for handling raw materials;
• access for delivery vehicles and forklifts;
• weather shielding for the electric furnaces; and
• the provision of a good working environment for employees.
With existing boundary noise levels from cupola melt operations of LAeq 78dB and a finaltarget for site noise at the boundary of LAeq 58dB, an overall reduction of melt operationnoise of LAeq 20dB was necessary.
It was decided to house the complete facility in a building giving adequate reduction of noiseto meet the requirements of the noise reduction programme.
The new building was constructed on a steel portal frame with dense concrete blockwork to aheight of two metres and double skinned composite profiled metal cladding above to theeaves. The roof of the building was also constructed of double skinned composite metalcladding.
The main access door was designed to be large enough to allow an articulated lorry with atipping trailer to exit with the trailer raised. This presented technical problems due to theeffects of wind on such a large area, and for sealing the door when closed. The solution wasto fit a top-hung door with flexible rubber strip seals all around the perimeter.
A new dust extraction plant was installed for the Electric Melt facility. During the design andplanning stage, noise emission limits based on predetermined targets, were set for this

R&D TECHNICAL REPORT P4-079/TR/1 70
extraction system. The system was placed where it was screened from nearby noise sensitivereceptors by the new Electric Melt building. Figure F1.2 shows the layout of the buildings.This resulted in a reduction of fan noise LAeq of 10dB at affected receptors.
Figure F1.2 Building Layout

R&D TECHNICAL REPORT P4-079/TR/1 71
F1.7 Overall Improvement Achieved
The average sound reduction performance of the new building was estimated at 40dB dB(A).Subsequent noise measurements have shown that overall site LAeq noise levels have beeneffectively reduced by 12dB at the boundary adjacent to the new facility indicating asignificant improvement gained by the development of the Electric Melt. Figure F1.3 givesthe results of the 24 hours noise surveys before and after work.
Figure F1.3 Before and After Noise Survey Results
The noise reduction achieved was due to:-
• the enclosure of the melt process and scrap handling in an acoustically designed building;
• the redundancy of the wet scrubber system;
• the replacement of old dry extraction systems with new low noise systems; and
• the location of noisy plant where it is screened from noise sensitive receptors by on-sitebuildings.
F1.8 Outcome of Noise Control Measures
A number of significant benefits have been realised with the change from coke firing toelectric melt.

R&D TECHNICAL REPORT P4-079/TR/1 72
F1.8.1 Environmental Benefits
• Reduction of solid waste in the form of slag and clinker;• reduction of emissions to atmosphere;• discontinuation of the use of coke and limestone as raw materials;• reduction in road traffic related to import of raw materials;• increased recycling of local waste materials in the form of high quality scrap metal;• transfer to cleaner power (electricity) from fossil fuel; and• substantial reduction in environmental noise emission;
F1.8.2 Financial benefits• Reduction in the cost of raw materials (coke and limestone).• reduction of waste disposal costs.• reduction of energy costs due to negotiation of favourable terms with the electricity supply
company.
The change from coke firing to electric melt has had two short-term disbenefits.
• Cost of building new facility.• disruption of site during construction.
F2 A MALTINGS REDUCES ENVIRONMENTAL NOISE IMPACTUSING LOW COST, LOW TECH SOLUTIONS
F.2.1 Introduction
A large maltings facility, operating in a rural community, was advised by their LocalAuthority that a possible noise nuisance existed due to high levels of noise arising from thesite. A large number of individual sources were found to be responsible for the allegednuisance, which were effectively attenuated using 'low tech' and cost effective solutions.
F2.2 Descr iption of the Site
The maltings facility covers an area of approximately 20 acres (8 hectares), and is situated ina rural location which is subject to very low background noise levels. The original facilitywas developed over 100 years ago when local housing for employees was provided in theimmediate vicinity of the site. However, these properties are no longer owned by thecompany, and are now occupied by residents who have recently moved into the area. Due toa lack of other industrial activities in the village, noise arising from the maltings makes asignificant contribution to ambient noise levels in the area.
Over the past 20 years, processes at the site have been modernised and levels of productionincreased. As a result, noise levels have also increased, causing disturbance to local residentsin the surrounding community.

R&D TECHNICAL REPORT P4-079/TR/1 73
F2.3 Assessment of Noise Impact at Receivers
Low background noise levels in the area, coupled with the nature of the noise, whichincluded discrete screeches and clatters from conveyor systems, hissing from grain chutesand fan noise, led to a number of complaints from local residents. As a result, the matter wastaken up by the Local Authority.
A noise survey and subsequent BS 4142 assessment carried out by the Local Authorityindicated that noise arising from the site exceeded background noise levels by around 26 dBat the nearest noise-sensitive dwellings, a situation which was clearly unacceptable. Thisnoise level was adjusted to take into account the tonal and impulsive nature of the noise,which can cause greater annoyance, and is called the Rating Level. A prominent tonalcomponent can be detected in one-third band spectra, if the level of one band exceeds thelevel in adjacent bands by more than 5 dB. The presence of a distinct tone like this can resultin a noise which is particularly annoying and intrusive.
To avoid the service of a Noise Abatement Notice under Part III of the EnvironmentalProtection Act 1990, the company were advised by the Local Authority that prompt actionshould be taken to reduce site noise.
F2.4 Identification of Individual Noise Sources
A large number of individual sources were identified on the site, including noise arising fromfans, conveyors, elevators and grain chutes. The sources were categorised as follows:
• continuous, tonal fan noise;• clatter, screeches and clonks from conveyor systems; and• high frequency hissing sounds from grain chutes.
Noise arising from fan systems was considered to be the most significant source, althoughintermittent, mechanical noise from grain transfer systems was found to be the cause of mostcommunity annoyance. Continuous fan noise from the drying and aeration plant was alsoaudible at the site boundary and contributed significantly to noise levels in the area. Thissource of noise was considered to be responsible for the underlying noise impact.
A specific noise survey of the site identified high levels of noise, with tonal characteristics,arising from three individual fan systems.
In the first fan system two fans (illustrated in Figure F2.1 Centrifugal Blower) operated an airdrying system which discharged directly into a small building containing the drying plant.Silencers were not fitted to the fan exhausts.
A noise level of 101 dB LAeq was measured at a distance of 1 metre from the fan exhausts,with a level in excess of 70 dB LAeq at the boundary of the site, around 30 metres away.Strong tonal characteristics of 107 dB at 250 Hertz and 99 dB at 1000 Hertz were alsoidentified.

R&D TECHNICAL REPORT P4-079/TR/1 74
Figure F2.1 Centr ifugal Blower
The maltings building, which is constructed from brickwork, with a corrugated sheet roof andopen eaves, provided little reduction in the noise arising from the plant.
For the second system, which operated a dust extraction unit for the main grain input fromdelivery lorries a noise level of 86 dB LAeq was measured at a distance of 5 metres. As thefilter unit was located in an open loading bay, no attenuation was provided by enclosure. Thedust extraction system bag filter utilised a self-cleaning mechanism which operated when thefan was switched off. As a result, when large volumes of dust built up in the bag filters, fannoise would increase by 5 dB(A) with a distinct tone of 84 dB at 1000 Hertz.
The third fan system operated an aeration plant for the fermentation process. Although theintake was fitted with an attenuator, noise levels in excess of 95 dB(A) were measured at adistance of 1 metre, with distinct tones of 93 dB at 250 Hertz and 96 dB at 500 Hertz.
Secondary noise sources were associated with grain transfer systems. Much of the plant onsite operates for 24 hours a day on a batch process system, with batches starting or finishinglate at night and early in the morning. At the start and finish of each batch conveyors andassociated equipment run empty without their loads of grain. As a result, mechanical noisewhich was reduced or damped when grain was in the system, often became more apparent.This included creaks and groans from the conveyor chains, clonks and clatters where chainsrounded conveyor ends and bearing/motor noise from conveyor and elevator drives. Thenature of this noise, in addition to the time of its occurrence, resulted in a number ofcomplaints from the local community.
When operated with a full load, many of the mechanical noises experienced when the transfersystem was empty, were reduced. However, mid to high frequency noise produced by graindropping down elevator towers and into chutes, became more apparent. Noise levels ataround 81 dB LAeq at a distance of 1 metre from the chutes, with tones of 72 dB at 2000 Hertzand 78 dB at 4000 Hertz were measured. The resulting hissing noise was apparent over muchof the site and audible at nearby residential properties.

R&D TECHNICAL REPORT P4-079/TR/1 75
F2.5 Noise Controls and Techniques
Each source of noise was addressed in terms of the significance of its impact on the localcommunity. Two factors influenced the resulting noise control programme:
• the results of the BS 4142 assessment which showed that there was a high level of noise atthe site boundary; and
• the addition of a 5 dB penalty to the Rating Level due to the intrusive characteristics ofmechanical noises.
Initially, a reduction in the overall level of noise arising from the site was achieved bysilencing the three major fan systems. Because only a small number of secondary sourceswere audible at nearby residential properties, attenuation of grain transfer systems wasconsidered to be unnecessary.
A target to reduce fan noise at the site boundary by at least 5 dB LAeq was established. Onceachieved, secondary noise control operations addressed the most significant mechanicalnoises individually, until they were no longer causing noise problems in the community.
F2.5.1 Fan Systems
In-line absorptive silencers costing around £250 each were fitted to the exhausts of theCentrifugal Blower, reducing noise levels by 20 dB LAeq.
A reduction in the level of noise arising from the dust extraction system bag filter unit, wasachieved through the use of a timer in the electrical control circuit, which switched thesystem off at hourly intervals, thus engaging the self cleaning mechanism. Overall noiselevels from the dust extraction system were reduced by 5 dB LAeq and the tone at 1000 Hertzwas eliminated.
Reducing noise levels arising from the aeration fan was more difficult. High noise levelswere emitted from the air intake, in addition to secondary noise which radiated from the fancasing. An additional splitter silencer was fitted to the fan intake, with an insertion loss (iethe amount by which noise is reduced) of around 10 dB at 500 Hertz. The fan casing wasfitted with an acoustic enclosure constructed from 16 gm sheet steel on a steel framework,with an internal sound absorption quilt of 50 mm thick Rockwool and an inner skin ofperforated metal. The resultant reduction in fan noise of around 10 dB LAeq, reducedboundary noise levels by 7 dB LAeq.
F2.5.2 Grain Transfer Systems
Following this reduction in site boundary noise levels, attention was turned to controllingmechanical noise from the grain transfer systems. Noise consisting of clonks and hissing,arising from around 20 grain transfer systems on the site, and had been a source of complaintin the local community.
A night time survey identified the systems responsible for the most intrusive noises. Whereconveyor and elevator casings were transmitting noise, acoustic damping material in the formof dense PVC matting was attached to the outer surface of the casing with adhesive. Where

R&D TECHNICAL REPORT P4-079/TR/1 76
conveyor and elevator drive mechanisms were directly responsible for high noise emission,small local enclosures were fabricated around the noisy area. These were constructed from18 g steel sheet on angle iron frames, lined internally with 50 mm of dense Rockwool held inplace by a perforated metal inner skin.
This reduced mechanical noise by between 5 dB(A) and 10 dB(A) at each grain transfersystem.
Grain transfer noise was also audible from several of the high level chutes. These weretreated in similar manner, by applying PVC matting to elevator casings. High frequencynoise, of the type arising from the chutes, is treated effectively by damping, and as a result, asignificant reduction in excess of 10 dB(A) from each treated chute was achieved.
F2.6 Overall Improvement Achieved
Mechanical noise from the grain transfer systems was controlled to the extent where theformerly intrusive clonks and groans were barely audible off-site. In addition, hissing fromgrain chutes was no longer audible at the site boundary.
A noise survey carried out following fan noise control demonstrated a reduction of 7 dB LAeqat the site boundary, reducing the BS 4142 Rating Level to 14 dB above background. Thisrepresented a major achievement in noise control for so large a site, although it did not meetLocal Authority’s expectations. Furthermore, residual noise impact at nearby residentialproperties were below that recognised by the World Health Organisation as likely to causeinterference with amenity.
F2.7 Outcome of Noise Control Measures
There have been no significant disbenefits to this exercise, with the exception of the costsrequired for equipment and in man hours for installation. Most of the work was carried outin-house with local enclosures manufactured on site.
The employees' working environment was also improved through a reduction in noise levelsin the drying shed and loading bay. Relations with the community and the Local Authorityhave also improved and the threat of Statutory Noise Nuisance action was withdrawn.
F3 A MANUFACTURER OF PAPER PRODUCTS REDUCESMATERIALS HANDLING NOISE USING INNOVATIVETECHNIQUES
F.3.1 Background
An international paper product manufacturer experiencing neighbourhood noise problemsreduced tonal noise from air-handling material transport systems, and impulsive noise fromhigh pressure blow-off exhausts, using low cost, innovative technology.
F3.2 Descr iption of the Site
The production facility is housed in a single factory building, covering some 14 acres.Fifteen production lines, running continuously, produce consumer goods manufactured from

R&D TECHNICAL REPORT P4-079/TR/1 77
paper pulp. Each production line is fed by one of two materials handling systems whichtransfer pulp pneumatically. There are over 30 paddle bladed axial fans in each system,ranging in size from 1.5 kW to 55 kW.
The facility is located in a coastal area, some distance from any major residentialdevelopment, although two farm houses are situated within 500 metres of the factory. Thesite lies in a natural depression which generally gives good acoustic screening. However, thetwo nearby farm houses are on high ground and have a direct line of site to the factorybuilding, which exposes them to noise arising from the site.
F3.3 Assessment of Noise Impact at Receivers
Complaints had been received from residents at both properties, one complaining of tonalnoise, and the other, of intermittent, impulsive noise.
A prominent tonal component can be detected in one-third band spectra, if the level of oneband exceeds the level in adjacent bands by more than 5 dB. The presence of a distinct tonelike this can result in a noise which is particularly annoying and intrusive.
A night time noise level of 53 dB LAeq with a prominent tone of 63 dB at 160 Hertz wasmeasured at the boundary of one property. This was compared to noise levels measured aspart of a BS 4142 assessment and environmental noise survey, carried out during anEnvironmental Impact Assessment conducted prior to the development of the factory. Anincrease in ambient noise levels of 10 dB(A) since the last noise survey were identified.When a 5 dB penalty for tonal characteristics, in line with the BS 4142 assessment, wasadded to the measured level (called the Specific Noise Level), the resultant Rating Level of 58dB(A) exceeded the background noise level by 15 dB(A), a situation which was considered tobe unacceptable.
At the second property, impulsive air exhaust noise was measured at 12 dB above ambientnoise levels with a peak of 68 dB at 2000 Hertz. This noise continued throughout the nightand created a severe disturbance to the residents.
F3.4 Identification of Individual Noise Sources
The factory operates over 24 hours, seven days a week and the materials handling systemsrun continuously throughout the week.
These systems transfer dry paper pulp between the raw materials input area and theproduction lines in a airborne suspension, via 600 mm ducting. The system is driven by alarge number of staging fans, with pressure fans at the input end and vacuum fans past theproduction lines. Surplus material is recycled via an in line reclaim facility. At the end of thesystem waste air is discharged through two large dust collection units containing standard bagfilters.
The 55 kW paddle bladed system exhaust fans produced noise levels of 67 dB LAeq at adistance of 100 metres from the exhaust louvres, with a distinct tone of 75 dB at 125 Hertz.Narrow band analysis was used to define the tone further, which was then identified at 160

R&D TECHNICAL REPORT P4-079/TR/1 78
Hertz, with associated harmonics at 250 and 500 Hertz. Calculations showed that this tonewas related to the blade passing frequency (27) of the exhaust fan.
Noise arising from two air pressure blow-off exhausts serving the reclaim area baler whichdischarges through the roof of the factory building were also identified. Because the exhaustswere screened by the roof line of the factory, exhaust noise was not audible at ground levelon the factory site. However, the exhausts produced distinct intermittent impulsive noisearound 12 dB above ambient levels in the 2000 Hertz Band, at one of the local farmhouseswhich is situated on high ground.
F3.5 Noise Controls and Techniques
A number of factors influenced the choice of noise control for the materials handling systemexhaust.
The systems handle dry paper pulp with a high dust content, which has the potential to causea dust explosion. The bag filter systems include a spark suppression system and it wasimportant to ensure that this was not compromised. Consequently, standard end of lineabsorptive attenuators could not be fitted to the bag house exhaust louvres. In line absorptiveand reactive silencers were considered but rejected due to the risk of clogging with paperresidues.
Reducing the fan speed, which would have reduced the noise output, was also rejected.Reworking the control systems would be expensive in terms of man-hours and would requirethe complete system to be shut down for a number of days while the new control systemswere installed. In addition, there was concern that a reduction in fan speed and associatedreduction in air flow, would have affected the efficiency of the system. Fan replacement withquieter centrifugal fans was dismissed as too costly.
Re-working the blades of the 55 kW exhaust with 600 mm ducting fans was also considered,but as the maximum reduction in noise levels was estimated at only 3 dB(A), this option wasnot considered to be cost effective.
The possibility of applying active noise control (ANC) to the exhaust fans was alsoexamined. A reduction of 10 dB at low frequencies was predicted, but due to the costsassociated with ANC (in the region of £4,000 per fan system) which would be required for aminimum of four fans, other methods of noise control were investigated.
A solution was finally found using Helmholtz resonators. The Helmholtz principle uses avessel, or side branch, to produce an air spring which absorbs energy from sound waves inthe main duct. Although resonators cannot operate over wide bandwidths, they control puretones effectively. As the materials handling system emitted a tone at 160 Hertz, this optionwas considered to be a suitable one.
A simple Helmholtz resonator was fabricated in-house using a 250 mm steel tubing, 1 metrein length. This was attached to the 600 mm duct by a 75 mm right angled branch, bolteddirectly to the duct. An adjustable piston was fitted inside the resonator operated by a screwthread in the closed end.
(27) The blade passing frequency is calculated by multiplying the number of fan blades by the fan speed in revolutions per second.

R&D TECHNICAL REPORT P4-079/TR/1 79
Figure F3.1 Helmholtz Resonator Design
The assembly was bolted to the main duct and in-duct noise levels measured with theresonator piston fully retracted, using a narrow band analyser. The piston was then screweddown until the 160 Hertz tone was reduced to its lowest measurable level at 16 dB. Theoperation was successful and as a result, more resonators were fitted to the trial system toreduce harmonics. In total, 4 resonators were used resulting in an overall reduction of 10dB(A) and the elimination of the tonal component.
For the baler exhaust noise, a partial acoustic enclosure made from sheet metal with aninternal liner of mineral fibre behind perforated metal, was constructed for each exhaust. Theenclosures were designed so that they formed a box over each exhaust, without touchingthem. Open side vents (situated such that they were directed away from residentialdwellings) were included to ensure that exhaust air flow was not restricted.
F3.6 Overall Improvement Achieved
On completion of the installation of the Helmholtz resonators, a follow-up noise survey wasundertaken to determine the reduction in noise at the affected residential property. Thesurvey showed that overall site noise had been reduced by 2 dB LAeq at the boundary of theresidential properties, and the 160 Hertz tone eliminated.
Noise from the baler exhausts was reduced to a level where it was no longer audible at thefarmhouse boundary.
F3.7 Outcome of Noise Control Measures
To date there have been no adverse operational side effects with either the Helmholtzresonators or the enclosures around the baler exhausts.
In this case there were a number of benefits associated with the use of Helmholtz resonators.The costs for standard silencers or ANC systems were at least 5 times that required for theinstallation of the resonators. The costs associated with the original proposals for ANC were

R&D TECHNICAL REPORT P4-079/TR/1 80
in excess of £5,000 for each installation with an expected reduction in tonal noise of 6 dB atthe relevant frequencies. Total installation costs for the Helmholtz resonators, includingresearch and fabrication were less than £1,000.
The tonal reduction resulting from the use of each resonator, measured in-duct, wasapproximately 16 dB at 160 Hertz, reducing overall duct noise levels by 3 dB(A). This isapproximately 7.5 times more cost effective than ANC for the same tonal reduction.
The performance of Helmholtz resonators is also considered to be more reliable than ANC, asneither computer software, nor moving parts are used in resonators. The ANC system relieson a series of in-duct microphones measuring noise before and after the control system andusing the data gained to adjust the output of a series of loudspeakers in the duct.Consequently there are a number of components which can potentially be subject to damage.
In past applications using ANC, component failure has resulted in the system becomingunserviceable. Helmholtz resonators do not suffer any similar mechanical failures and onceadjusted to give optimum noise reduction, remain stable. Tuneable resonators manufacturedto a standard configuration can be fitted to the materials handling systems in a number ofplaces, progressively reducing tonal noise. Although no calculations have been carried out todetermine the total noise reduction possible, it is estimated that an overall reduction in fanexhaust noise of 10 dB(A) is achievable.
The simplicity of the Helmholtz resonator system means that less energy and fewer resourcesare used in their manufacture than for either standard silencers or ANC systems. The overallenvironmental impact of producing the resonators was therefore substantiality less thanwould have been the case with any other system.
In addition, the use of a standard attenuator would have resulted in the expenditure of extraenergy to maintain efficient air flow. No loss of airflow occurred using the resonators.Although not impeding airflow, the ANC system would have required a continuous energysource to run the monitoring system and to power the loudspeakers.
However, considerable research was required initially to determine the optimum dimensionsfor the resonators. Virtual modelling, which took several man-hours to complete, was carriedout using state of the art computer technology, although a similar amount of time would havebeen required to perfect the ANC system for configuration to this specific application. Themanufacture and supply of conventional splitters or absorptive silencers would have reduceddevelopment costs as these items are readily available 'off the shelf' or are produced tostandard designs.

R&D TECHNICAL REPORT P4-079/TR/1 81
F4 MINERAL FIBRE MANUFACTURING PLANT REDUCES LOWFREQUENCY AIRBORNE NOISE BY EQUIPMENTMODIFICATION
F.4.1 Background
In 1995 a factory which produces mineral fibre received complaints from a local resident,regarding low frequency night time noise. Investigations revealed that very low frequencynoise, below the level which can normally be heard by human beings, was detectable insidethe complainant’s house. The noise was traced to two vibrating screens, which had recentlybeen installed at the factory (illustrated in Figure F4.1).
Following the complaint and on the basis of a background noise survey, the Local Authoritydetermined that a statutory noise nuisance existed. Simple modifications to the equipmentreduced the low frequency noise to a more acceptable level.
Figure F4.1 Nor thern Boundary of the Site Adjacent to the Residential Area
F4.2 Descr iption of the Site
The site covers an area of approximately 20 acres and is situated in an urban area on thecoast. To the north and east, are established residential developments, with the closestdwellings situated within approximately 100 metres of the site boundary (illustrated in FigureF4.2). The factory produces fibreglass insulation materials, using a continuous process, andcomprises a number of large buildings which are inter-linked in the centre of the site with aperimeter road for service vehicles and HGVs.
Several sources of noise were audible at the site boundary, including noise from variousprocess fans, pumps, and a low-frequency rumble from the filter plant. Noise also arisesfrom lorry traffic servicing the plant.
Buildings and embankments located near to the site serve to screen many residentialdwellings from plant noise. Although this type of screening can help to reduce highfrequency noise, it is less effective at screening lower frequencies. Due to its long

R&D TECHNICAL REPORT P4-079/TR/1 82
wavelength characteristics, low frequency noise travels further and penetrates buildingstructures more readily than noise of a higher frequency.
Figure F4.2 Site Plan Showing Residential Area to the Nor th West
F4.3 Assessment of the Noise Impact at Receptors
A noise survey was conducted to determine the level of the low frequency noise outside thenearest residential dwelling from which complaints had been made. Noise from the screenswas not audible during the survey, but could be detected by the measuring instruments, at avery low frequency, which was identifiable in the linear and 1/3 octave band levels, asdetailed in Table F4.1 below.
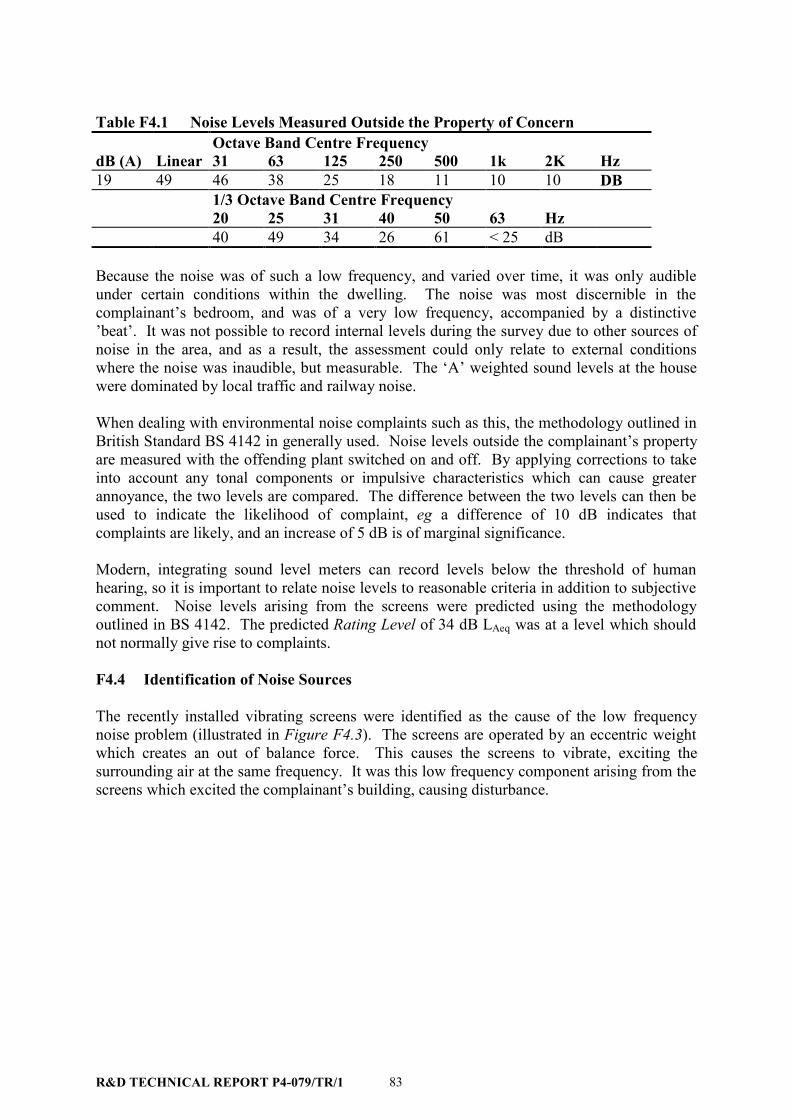
R&D TECHNICAL REPORT P4-079/TR/1 83
Table F4.1 Noise Levels Measured Outside the Proper ty of ConcernOctave Band Centre Frequency
dB (A) Linear 31 63 125 250 500 1k 2K Hz19 49 46 38 25 18 11 10 10 DB
1/3 Octave Band Centre Frequency20 25 31 40 50 63 Hz40 49 34 26 61 < 25 dB
Because the noise was of such a low frequency, and varied over time, it was only audibleunder certain conditions within the dwelling. The noise was most discernible in thecomplainant’s bedroom, and was of a very low frequency, accompanied by a distinctive’beat’. It was not possible to record internal levels during the survey due to other sources ofnoise in the area, and as a result, the assessment could only relate to external conditionswhere the noise was inaudible, but measurable. The ‘A’ weighted sound levels at the housewere dominated by local traffic and railway noise.
When dealing with environmental noise complaints such as this, the methodology outlined inBritish Standard BS 4142 in generally used. Noise levels outside the complainant’s propertyare measured with the offending plant switched on and off. By applying corrections to takeinto account any tonal components or impulsive characteristics which can cause greaterannoyance, the two levels are compared. The difference between the two levels can then beused to indicate the likelihood of complaint, eg a difference of 10 dB indicates thatcomplaints are likely, and an increase of 5 dB is of marginal significance.
Modern, integrating sound level meters can record levels below the threshold of humanhearing, so it is important to relate noise levels to reasonable criteria in addition to subjectivecomment. Noise levels arising from the screens were predicted using the methodologyoutlined in BS 4142. The predicted Rating Level of 34 dB LAeq was at a level which shouldnot normally give rise to complaints.
F4.4 Identification of Noise Sources
The recently installed vibrating screens were identified as the cause of the low frequencynoise problem (illustrated in Figure F4.3). The screens are operated by an eccentric weightwhich creates an out of balance force. This causes the screens to vibrate, exciting thesurrounding air at the same frequency. It was this low frequency component arising from thescreens which excited the complainant’s building, causing disturbance.
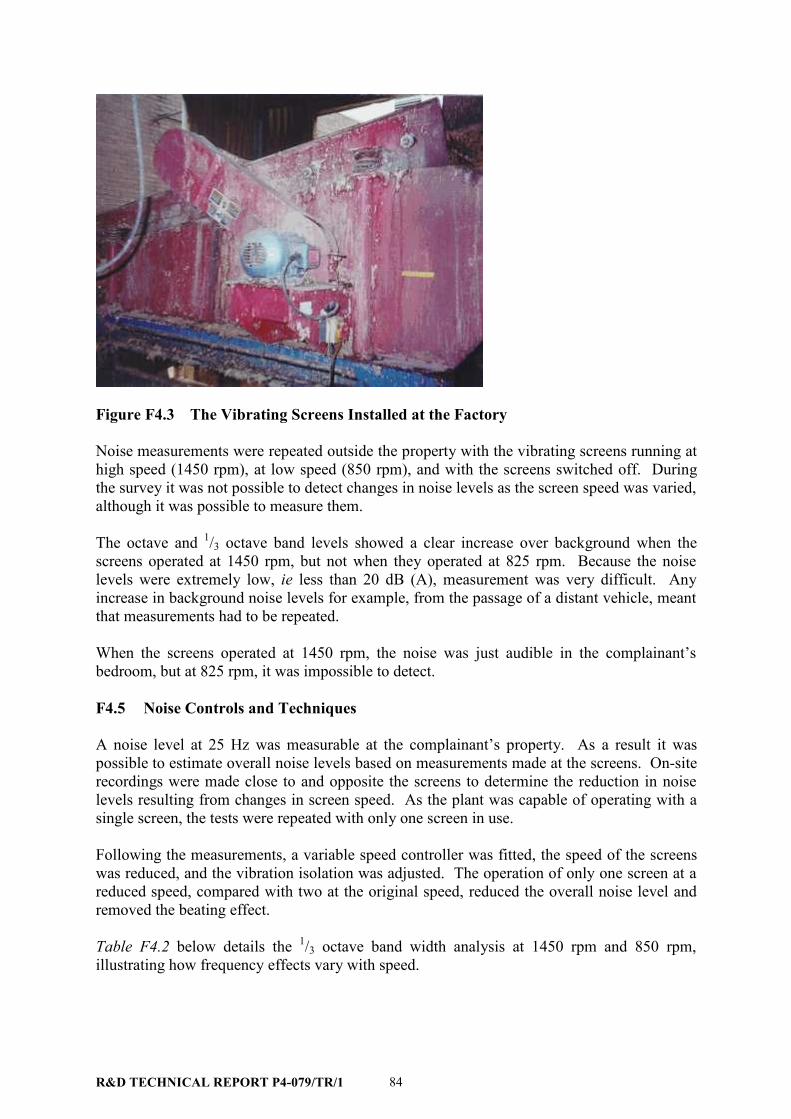
R&D TECHNICAL REPORT P4-079/TR/1 84
Figure F4.3 The Vibrating Screens Installed at the Factory
Noise measurements were repeated outside the property with the vibrating screens running athigh speed (1450 rpm), at low speed (850 rpm), and with the screens switched off. Duringthe survey it was not possible to detect changes in noise levels as the screen speed was varied,although it was possible to measure them.
The octave and 1/3 octave band levels showed a clear increase over background when thescreens operated at 1450 rpm, but not when they operated at 825 rpm. Because the noiselevels were extremely low, ie less than 20 dB (A), measurement was very difficult. Anyincrease in background noise levels for example, from the passage of a distant vehicle, meantthat measurements had to be repeated.
When the screens operated at 1450 rpm, the noise was just audible in the complainant’sbedroom, but at 825 rpm, it was impossible to detect.
F4.5 Noise Controls and Techniques
A noise level at 25 Hz was measurable at the complainant’s property. As a result it waspossible to estimate overall noise levels based on measurements made at the screens. On-siterecordings were made close to and opposite the screens to determine the reduction in noiselevels resulting from changes in screen speed. As the plant was capable of operating with asingle screen, the tests were repeated with only one screen in use.
Following the measurements, a variable speed controller was fitted, the speed of the screenswas reduced, and the vibration isolation was adjusted. The operation of only one screen at areduced speed, compared with two at the original speed, reduced the overall noise level andremoved the beating effect.
Table F4.2 below details the 1/3 octave band width analysis at 1450 rpm and 850 rpm,illustrating how frequency effects vary with speed.
R&D TECHNICAL REPORT P4-079/TR/1 85
Noise levels in the dominant frequency (20 Hz) are reduced by over 10 dB by changing to thethird screen speed. It was considered that the plant could operate with a single screenrunning at a motor speed of 825 rpm.
Table F4.2 Var iation in Noise Emission at Different Operating SpeedsFrequency 20 25 31 40 50 63 Hz1450 rpm/1 screen 82 78 67 75 71 73 dB1000 rpm/1 screen 66 70 66 68 66 70 dB825 rpm/1 screen 59 67 62 65 62 66 dB
F4.6 Overall Improvement Achieved
Noise levels from the modified screen were re-measured on site and within the complainantshouse. When only one screen operated at 825 rpm, the linear noise levels were reduced by 10dB, and the strong tonal component removed, as indicated in Table F4.3. Furthermore, thenoise was no longer audible in the complainant’s bedroom and recorded levels were belowthe threshold of audibility. No further noise control was considered to be necessary.
Table F4.3 Compar ison of Measured Noise Levels in the Bedroom with the Screen atVar ious Speeds
Motor Speed Octave Band Centre Frequency (Hz)rpm dB A Linear 31 63 125 250 500 1k 2k 4k1450 19 49 46 38 25 18 11 10 10 11825 18 37 35 30 24 16 11 10 10 11off 18 40 35 30 24 17 11 10 10 11
1/3 Octave Band Centre Frequency (Hz)20 25 31 40 50 63
1450 40 49 34 26 31 < 25825 35 31 32 33 31 < 25off 35 33 29 29 32 < 25
F4.7 Outcome of Noise Control Measures
Noise levels were reduced to below those measured by the Local Authority at the time of thecomplaints. This was due almost entirely to the reduction in screen speed. As a result, thedisturbance was effectively eliminated at a very low cost. Overall savings on energy requiredto run the single screen at low speed also compensated for the man-hours taken to resolve theproblem.
As the projected life of the screen has increased following the changes, further savings havebeen identified as a result of reduced maintenance time and lower maintenance costs. Totalestimated costs were £1,500 (1999) which includes the fees for acoustic consultancy.

R&D TECHNICAL REPORT P4-079/TR/1 86
F5 COMBINED CO-GENERATION GAS TURBINE (CHP) FORHEAT AND POWER AT A FOOD PRODUCTION PLAN
F5.1 Background
On a major food manufacturing site steam requirements had historically been met by a boilersystem comprising five coal-fired units, and electricity requirements, via a connection to thenational grid. The 60 year old boiler system was subject to air pollution control under Part Iof the Environmental Protection Act 1990 and required retrofitting with flue gas treatment ifit was to continue to operate.
As an alternative the owners proposed to install a cleaner, more energy efficient combinedco-generation gas turbine facility, to provide steam and heat for the site. However, theproposed location of the Combined Heat and Power (CHP) facility adjacent to noise sensitiveresidential dwellings, meant that careful selection and design of noise control equipment wasnecessary to ensure that local planning conditions were met. Enclosure of all plant associatedwith the facility in a single building was proposed to ensure optimum noise reduction.
F5.2 Descr iption of the Site
The 140 acre site operates continuously over 24 hours, and is the largest industrial site in thearea. The location of the proposed CHP installation is approximately 200 metres away fromthe nearest residential properties, (illustrated in Figure F5.1).
Figure F5.1 Plant Layout Plan

R&D TECHNICAL REPORT P4-079/TR/1 87
F5.3 Assessment of Noise Impact at Receivers
Prior to the development of the CHP facility, the Local Authority advised that anenvironmental noise survey should be carried out in surrounding residential areas. Thesurvey identified an existing night-time background noise level of Noise Rating 35, which isroughly equivalent to 40dB(A) at the nearest residential properties.
Noise Rating (NR) curves are often used to assess the acceptability of a noise to ensurepreservation of hearing, speech and communication, and to avoid annoyance. Because noiselimiting criteria based on NR specify noise limits at each octave band between 63 Hz to 8kHz, they can be more onerous than criteria based on BS 4142, where an equivalentcontinuous noise level (dB LAeq) is specified, which is averaged over each octave band.
A background noise level of 40 dB LAeq is typical of night time noise levels in mixedindustrial and residential areas in large conurbations. In this case, the dominant source ofnoise in the area was due to the 24 hour production facility on the site and associated sitetraffic.
The Local Authority also expressed concern over ‘creeping’ background noise levels in thearea. This can occur when noise criteria applied to new development allows backgroundnoise levels to be exceeded by 1 or 2 dB, which although imperceptible, causes noise levelsto rise incrementally over time. Consequently, noise control measures for the proposed CHPplant were required such that noise levels arising from the facility were lower than existingbackground levels, to prevent any increase in ambient noise.
F5.4 Identification of Individual Noise Sources
The proposed CHP facility included two 4.8 MWe Centrax KB7 gas turbines and associatedheat recovery boilers and gas compressors. Ancillary plant included three Wellman Robeygas fired Euronox boilers, a water treatment plant and a stand-by diesel generator to ensure aback-up supply of electricity in the event of a failure.
The following sources of noise from the proposed plant were considered to be significant:
• gas turbine combustion air intakes;• gas turbine exhausts;• breakout from the body of the gas turbines and ducting;• gas compressors cooling air intakes and exhausts;• stand-by diesel generator cooling and combustion air intake;• stand by diesel generator aspiration and cooling air inlets and exhausts;• stand-by diesel generator engine exhaust;• direct breakout from the stand-by diesel generator; and• gas turbine oil cooler fans intakes and exhausts.

R&D TECHNICAL REPORT P4-079/TR/1 88
F5.5 Noise Controls and Techniques
Whilst not wishing to set too onerous noise limits on the design of the new CHP system, sitemanagement were nevertheless keen to ensure that any noise nuisance problems wereavoided.
Achievement of NR 35 at the closest noise sensitive receptor would require noise levels to bereduced to a maximum of 60dB(A) at a distance of 1 metre from the CHP installation. Twopossible noise control options were considered:
• Option 1 - to house each of the turbines in weather proof enclosures with additional noisecontrols for ancillary plant; and
• Option 2 - to house the turbines, associated ductwork and all ancillary plant in a singleacoustically designed building, which would achieve the required reduction in noiselevels.
Costs for Option 1 were estimated at around £40,000 per enclosure with a further £15,000 to£20,000 for secondary noise controls (at 1993 prices).
However, due to the complexity and number of noise sources arising from the facility and thetechnical problems associated with the treatment of each source individually, Option 2 wasconsidered to be more cost effective. This would involve housing the complete turbine/boilerinstallation in a single building and providing attenuators for supply air intakes and exhausts,(illustrated in Figure F5.2).
As result, noise emissions from the proposed facility would be limited to the followingsources:
• gas turbine air intakes;• gas turbine exhausts;• oil cooler air intake;• diesel generator air intake;• gas compressor air intake and exhaust;• building ventilation intake and exhaust;• breakout from the building structure; and• noise emission from the combined exhaust stack.

R&D TECHNICAL REPORT P4-079/TR/1 89
Figure F5.2 Turbine and Boiler Installation
F5.6 Gas Turbine Air Intakes
A sound power level (SWL) of 137 dB was predicted to arise from the gas turbines. Theoctave band frequency spectra arising from the turbines is illustrated below in Table F5.1.
Table F5.1 Gas Turbine Air Intake Sound Power LevelFrequencyHz
31.5 63 125 250 500 1k 2k 4k 8k
SWL dB 113 113 113 116 119 121 127 132 134
The reduction in noise levels, or insertion loss, required by the gas turbine air intakeattenuators (when corrected for distance attenuation and duct losses) to meet theenvironmental noise criteria of NR 35, are specified below in Table F5.2.
Table F5.2 Gas Turbine Air Intake Attenuator Inser tion LossFrequencyHz
31.5 63 125 250 500 1k 2k 4k 8k
SWL dB -7 -15 -28 -50 -50 -50 -50 -50 -48

R&D TECHNICAL REPORT P4-079/TR/1 90
F5.7 Gas Turbine Exhausts
In a CHP system, the gas turbines discharge through two separate exhausts. One passesthrough the heat recovery boilers and the other operates in a by-pass mode when the boilersare off-line. Both exhausts vent through a common stack. Levels of noise arising from theby-pass exhaust were around 20 dB higher than those arising from the gas turbine heatrecovery boiler exhaust. Consequently, primary attenuators were required for the by-passexhausts and secondary silencers for the boiler exhausts in order to reduce turbine exhaustnoise to a level which would meet environmental noise criteria.
Pressure and heat in the exhaust system also required consideration. Losses in the gas turbineheat recovery boilers reduce heat and pressure to levels where standard splitter attenuatorscan be used at the base of the exhaust stack. However, higher pressures and temperaturesoccur in the by-pass duct which prevented the use of standard splitter attenuators. Thisproblem was addressed through the use of specialised stainless steel hot gas attenuators, withpurpose made infills manufactured from basaltic mineral fibre.
F5.8 Oil Cooler Air Intakes
The gas turbines require efficient oil cooling which is provided by supplementary oil coolers.Air flow over the coolers in this installation was maintained by axial flow fans with a SWL of104 dB. Noise arising from the fan intakes were reduced to a level of 60 dB(A) externally at1 metre, using standard splitter attenuators.
F5.9 Stand-by Diesel generator
In order that maximum benefit of the acoustic properties of the turbine building could berealised, the stand-by diesel generator was located in a purpose built enclosure inside theturbine building. The enclosure was constructed from 140 mm dense concrete blocks withacoustic access doors to RW 45 (28). The aspiration air and cooling air intakes and thecooling air exhaust were fitted with standard splitter attenuators to reduce noise emissionsfrom the generator to 65 dB(A) at 1 metre from the relevant louvres. The engine exhaust wasfitted with a conventional absorptive silencer which vented through the main stack.
F5.10 Gas compressors
The gas compressors were housed in a separate blockwork building. Intakes and exhaustswere fitted with standard splitter attenuators.
F5.11 Building Ventilation Intakes and Exhausts
A noise level of 83 dB (A) with a high mid frequency component was predicted to occurinside the gas turbine building. Standard splitter attenuators on supply air and ventilationfans were used to prevent internal noise breakout via the ventilation louvres. As a result,noise levels were reduced to 60 dB(A) externally at 1 metre.
(28) This describes the acoustic performance or weighted sound reduction index of the door as measured under laboratory conditions.

R&D TECHNICAL REPORT P4-079/TR/1 91
F5.12 Breakout from the Building Structure
By combining all major sources of noise within one building, it was possible to controloverall noise levels from the CHP plant using standard building construction methods. Inorder that the environmental noise criteria of NR 35 could be achieved at the nearest noisesensitive receptors (when corrected for distance attenuation, directivity and surfacetransmission area), a noise level of 45 dB(A) was required at the facade of the CHP plantbuilding. This was achieved through the use of 140 mm dense (2,000 kg/m3) blockwork inthe building wall construction.
The sound reduction index (SRI) provided by this type of wall construction is detailed belowin Table F5.3. The SRI or transmission loss of a wall or partition describes its effectivenessas a sound insulator.
Table F5.3 Wall Sound Reduction IndicesFrequencyHz
31.5 63 125 250 500 1k 2k 4k 8k
SRI dB 15 20 27 33 40 50 57 56 59
For the roof, composite metal cladding materials were used comprising:
• 0.7 mm outer steel panel;• 200 mm cavity with 80 mm glassfibre quilt infill at a density of 12 kg/m3; and• 0.7 mm steel inner liner panel.
The SRI provided by this type of roof construction material is detailed below in Table F5.4.
Table F5.4 Roof Sound Reduction IndicesFrequencyHz
31.5 63 125 250 500 1k 2k 4k 8k
SWL dB 7 12 17 25 32 38 41 41 39
F5.13 Noise Emission from the Combined Exhaust Stack
The gas turbine by-pass exhausts, the heat recovery boiler exhausts and the standby dieselgenerator were all designed to vent through a single stack. To reduce regenerated noise in thestack, a limiting gas velocity of 20 metres per second was specified. Calculations based onthe combined noise emission from all flues indicated a noise impact of less than 30 dB(A) at200 metres.
F5.14 Internal Noise Levels
To reduce internal noise levels to below the First Action Level of 85 dB(A) specified underthe Noise at Work Regulations 1989, purpose built acoustic enclosures were provided for theturbine bodies. These were constructed from an inner and outer skin of 3 mm steel with aninfill of 80kg/m3 density mineral wool. High levels of noise breakout from the ductworkbetween the turbines exhausts and the stacks were reduced by lagging the ductwork in anenvelope of mineral wool (128 kg/m3 density) clad with aluminium sheet to a thickness of 0.5mm.

R&D TECHNICAL REPORT P4-079/TR/1 92
F5.15 Overall Improvement Achieved.
Although the CHP plant has not replaced other noise making equipment, the predicted noiseimpact arising from the installation without the benefit of the turbine building, would haveresulted in noise levels of NR60 or approximately 65 dB(A) at the nearest residentialdwellings. This level exceeds environmental noise criteria specified by the Local Authorityby around 25 dB(A).
On commission of the CHP facility, noise surveys at the nearest residential dwellingsdemonstrated that there had been no increase in ambient noise as a result of the plant. Inaddition, noise from the CHP building was not detectable at the noise sensitive locationpreviously identified during the initial noise survey.
F5.16 Outcome of Noise Control Measures
The approximately cost of the noise control measures was £8m at 1993 rates.
Combined Heat and Power involves the simultaneous generation of electricity and useful heatas a single process. By using the heat produced in electricity generation, CHP can operate atefficiency levels of up to 85%, compared to approximately 35% for conventional powerstations. In addition, CHP schemes typically use around one third less fuel thanconventional, separate methods of electricity and steam generation. As a result CHP plantscommissioned in the UK since 1990 have reduced the UK's carbon dioxide emissions by theequivalent of over 1 million tonnes per year.
The CHP facility generates most of the electricity and steam required for the whole site,producing 9.6 MWe of electricity and 22 tonnes of steam per hour.
Costs associated with energy consumption have been reduced by the equivalent energy needsof 5,000 homes.
Back-up power and steam are guaranteed if primary supplies are interrupted or fail. Inaddition, electricity can be exported and/or imported to the national grid via the 11 kvsubstation which is linked to the CHP system.
F6 LANDFILL SITE OPERATIONS EFFECTIVELY CONTROLLEDBY LOW COST BEST PRACTICABLE MEANS
F6.1 Background
The operators of a mineral extraction quarry located in a rural environment, applied to theLocal Planning Authority for permission to import commercial and industrial waste for infilland restoration purposes. During the planning process a number of noise sensitive receptorswere identified at adjacent farms and cottages.
Permission was granted subject to certain environmental controls which included control ofnoise arising from infilling and compacting operations. A noise control and mitigationscheme was required to enable planning conditions to be discharged.

R&D TECHNICAL REPORT P4-079/TR/1 93
An overview of the construction and waste infill operations at the site are illustrated in FigureF6.1 below.
Figure F6.1 Overview of Cell Construction and Waste Infill Operations at the Site
F6.2 Descr iption of Site
The 35 hectare site, formerly used for extraction of sand and gravel lies in an agricultural areaat distance from any large residential development. However, a number of farms andcottages are situated within 300 metres of the site (refer to Figure F6.2 below). As a result,ambient noise levels are low. The only significant noise sources in the area are thoseassociated with agricultural operations, the existing mineral extraction operations, and localtraffic.

R&D TECHNICAL REPORT P4-079/TR/1 94
Figure F6.2 Map of the Site Showing Workings and Nearby Noise Sensitive Receptor s
F6.3 Assessment of Noise Impact at Receivers
To ensure compliance with the planning conditions, an acoustic consultancy company wasapproached and instructed to carry out a noise survey and modelling exercise, and to providerecommendations for noise control and mitigation.
F6.3.1 Noise Survey
In order to establish the potential noise impact at nearby noise sensitive properties, anenvironmental noise survey was conducted to identify existing background noise levels.Noise measurements were taken over a period of 3 days in two areas representative of theclosest dwellings. Daytime background levels of 35 dB LA90 and 39 dB LA90 respectively,were measured.

R&D TECHNICAL REPORT P4-079/TR/1 95
F6.3.2 Prediction of Noise Impact
Potential noise impacts were predicted by modelling the main elements of the landfilloperations, as detailed below:
• lorry movements to and from the site importing waste materials and tipping waste onsite;
• the excavation of clay for cell construction;• cell construction by bulldozers and dumpers;• waste compaction; and• cell capping.
The basis of the prediction method used is described in British Standard (BS) 5228. Thismethod enables an hourly A-weighted Leq (the LAeq, 1 hour) to be calculated for eachoperation or item of plant at varying distances and for varying proportions of the time.
Studies of similar operations and noise data for the types of vehicles to be used on site werealso utilised in the model, including that relating to:
• haul routes;• distances and speeds travelled by on-site vehicles;• the number of hourly tipping operations;• areas of work and progression of that work;• topography of the site and the level of workings;• the duration of each operation;• the type and number of vehicles used on the site; and• noise levels for each type of vehicle, as Sound Power Levels, or Sound Pressure
Levels at a determined distance.
The Planning Authority required that operations should be carried out in accordance withcurrent Minerals Planning Guidance, in particular MPG 1 and MPG 11: which refer to the useof mineral extraction sites for waste disposal, and give advice for the control of noise at suchsites. MPG 11 recommends that noise from site operations should not exceed 55 dB LAeq 1hrat noise sensitive receptors, or where the background noise level is below 45 dB LA90, thatsite noise should not be greater than 10 dB LAeq above the existing background noise level.
Noise limiting criteria of 45 dB LAeq and 49 dB LAeq respectively, were determined basedupon these recommendations and measured background noise levels. Predicted operationalnoise levels of 49 dB LAeq 1 hr and 57 dB LAeq 1 hr at each receptor were also determined,indicating that background noise levels would be exceeded by 4 dB LAeq and 8 dB LAeqrespectively. As a result, significant noise control measures were required. Infill andrestoration operations were expected to continue for around 10 years, so any noise controlschemes needed to be durable and capable of being maintained at low cost.
F6.3.3 Identification of Individual noise sources
A number of noise sources, and in particular those associated with on site vehicle movementswere identified as detailed below in Table F6.1.

R&D TECHNICAL REPORT P4-079/TR/1 96
Table F6.1 Identification of Individual Noise SourcesSite Operation Noise Level at 10 metres dB (A)Road vehicles delivering waste (measured duringdrive-by)
76
Excavator removing clay 77Dump trucks transporting clay and soil 80Bulldozers/dumpers constructing cells 83Levelling and capping 77Compactors traversing waste cells 77Soil screening 70Diesel water extraction pump 70
The most significant noise sources were those associated with the use of bulldozers anddumpers, which would be required to operate throughout much of the day. Cell constructionactivities utilising this type of equipment are illustrated below in Figure F6.3.
Figure F6.3 Cell Construction with Dumper and Bulldozer

R&D TECHNICAL REPORT P4-079/TR/1 97
F6.4 Noise Control and Mitigation
Two methods of noise control were utilised:
• screening through the use earth bunds and natural features; and• operational restrictions.
F6.4.1 Screening
Calculations based on initial modelling indicated that a 5 metre high earth mound or bund,which visually screened the noise sensitive receptors from the site, would reduce noise levelsby around 6 dB(A).
Two bunds were constructed of soil removed from the site for cell construction, one along thesouthern boundary of the site and one along the western boundary (illustrated in Figure F6.4below). During construction, noise levels at the two receptors occasionally reached levels of70 dB(A) for short periods. Noise impacts arising from the construction of bunds in this wayis identified in MPG 11, which also points out the necessity to construct bunds. As a result,an agreement was reached with the Planning Authority regarding the exceedance of noiselimiting criteria, whilst bund construction took place.
Soil screening and grading plant and the diesel powered water extraction pump were locatedas far away from noise sensitive properties as possible, and additional screening providedthrough the construction of soil mounds.
Figure F6.4 Typical Ear th Bund

R&D TECHNICAL REPORT P4-079/TR/1 98
F6.4.2 Operational restr ictions
As far as possible, site traffic was directed away from noise sensitive receptors on mainroads. Vehicles entering the site were directed along specially constructed haul routes whichwere aligned such that they were out of site of noise sensitive receptors. The condition of thehaul routes was maintained to reduce noise arising from body crash of empty trucks leavingthe site.
All earth-moving equipment was required to comply with a maximum sound power emissionof 108 LwA in accordance with BS 6812 / ISO 6395 ‘Airborne noise emitted by earth-movingequipment’. In addition, the following recommendations were made:
• all equipment to be switched off or idled when not operating and engines not revvedunnecessarily; and
• equipment to be maintained in good condition (including silencers) to minimise noiseemission during operation.
F6.4.3 Operating Times
To ensure that disturbance did not occur during unsociable hours ie in the evening and atweekends, landfill operations were limited to between 0730 and 1900 Monday to Friday and0700 to 1300 on Saturday. No working was permitted on Sundays or Bank Holidays. Soilreplacement and capping operations, which take place at elevated levels were restricted tobetween 0800 and 1700 Mondays to Fridays.
F6.4.4 Audible Warning Devices
Further planning conditions related to the use of audible reversing alarms or warning devices,which should not be used except where agreed with the Planning Authority.
F6.4.5 Other Noise Mitigating Measures
In order to minimise the noise impact of the proposed operation as a whole, a number ofadditional, more general measures were identified:
• sub-contractors to use equipment which complies with EC Directive noise emissionlimits;
• equipment to be maintained in good working order;• engines to be switched-off or left in idle when not in use;• access hatches and engine door panels on the plant to be kept closed as far as possible;
and• regular monitoring of noise levels to be carried out.
F6.5 Overall Improvement Achieved
The predicted noise impact at the two reference noise sensitive receptors, after constructionof the earth bunds along the site boundaries, was estimated at 38 dB LAeq 1hr and 48 dB LAeq 1
hr respectively. At the former site, the predicted noise impact was some 7 dB(A) below thenoise limiting criterion, but exceeded existing background noise level by 3 dB.

R&D TECHNICAL REPORT P4-079/TR/1 99
At the second location, the predicted noise impact approached the noise limiting criterion of49 dB LAeq but was still within prescribed limits. Here noise from landfill operations wouldbe apparent but at a level which was considered to be acceptable to local residents. Inaddition, other local sources of background noise would serve to mask site noise at certaintimes of the day.
F6.6 Outcome of Noise Control Measures
The noise controls used at this landfill site were low cost or no cost options. Construction ofbunds using topsoil and overburden enabled the use of material, which would otherwise betransported from the site or dumped elsewhere, for noise screening, thus saving the cost ofacoustic fencing at around £150/linear metre at 1999 prices.
Regular maintenance of haul routes and plant also benefits the efficiency and reliability ofequipment, which may otherwise be subject to costly repairs and overhauls. Switching offengines when not in use can also provide significant fuel savings.
The costs incurred in the noise control scheme included fees for the noise survey and noisemodelling of approximately £1,500, and man hours and fuel costs for bund building.However, the costs of bund construction were equal to those associated with the removal ofthe bund material from the site, which would have been required with or without the noisecontrol operations.
During bund construction noise levels from the site were significantly higher than theexisting background noise levels at noise sensitive receptors. However, in light of thisunavoidable noise impact, the Local Planning Authority allowed noise limiting criteria to beexceeded for a maximum duration of eight weeks for soil/overburden removal and bundconstruction.