space allocation study - tcuf
TRANSCRIPT

Provider No.: A197
UT Austin Space Allocation Study
Enhancing the Core; Maximizing Efficiency
AIA/CES No.: 00000
Michael Carmagnola, UT Austin
Dan Alexander, Jacobs
Date: 09/21/2018 – 1:00PM

Credit(s) earned on completion of this course will be reported to AIA CES for AIA members. Certificates of Completion for both AIA members and non-AIA members are available upon request.
This course is registered with AIA CESfor continuing professional education. As such, it does not include content that may be deemed or construed to be an approval or endorsement by the AIA of any material of construction or any method or manner ofhandling, using, distributing, or dealing in any material or product._______________________________________
Questions related to specific materials, methods, and services will be addressed at the conclusion of this presentation.
With near constant expansion of UT Austin’s academic and research space, one of the University’s most valuable assets is the physical campus. The operations, maintenance, and construction of buildings is expensive, but also critical for the pursuit of excellence.
UT Austin began the Space Allocation Study (SAS) in May 2016 with the goal of determining whether current administrative and library space might be allocated to serve the core academic mission, and in doing so, improve operational efficiency.
Course DescriptionNow on Phase 2 and 3, the SAS has proven fundamental to advancing excellence in education and research by directing repurposing and reinvestment in facilities to create more conducive environments for next-generation learning, as well as enhanced and interdisciplinary research.
Space Standards were also created that are now applied to all new construction and renovation projects. Cost savings was also an aim of the project and the savings of this undertaking are very significant.
The University was assisted by Jacobs and Paulien & Associates.

LearningObjectives
1. Skill of understanding the dynamics of space efficiency.
2. Exposure to space standards and their applicability in the university setting.
3. Cost studies to determine highest and best use.
4. Process for undertaking similar study – what should be included and what should be avoided.
.
At the end of the this course, participants will be able to:

This concludes The American Institute of Architects Continuing Education Systems Course
Please take a moment to complete the evaluation form.
Provider Name/Logo
Theresa Bartos Drewell, AIA806-790-1987

Director UT Austin PMCS
Leads staff of 145
$100M+ design and construction annually
Licensed architect in four states
Graduate of the APPA Institute for Leadership in Educational Facilities, and the APPA Leadership Program

Principal at Jacobs
Manages 20-year UT Austin relationship
Served as Director of Campus Operations for The George Washington University –Mount Vernon College Campus
Licensed architect in three states
SCUP Planning Institute graduate

Comprehensive Space Allocation Initiative
• Return Campus core to academic mission
• Improve student success initiatives
• Improve operational efficiency & performance
• Implement space standards

• Senior leadership support
• Centrally-led communications
• Governance structure

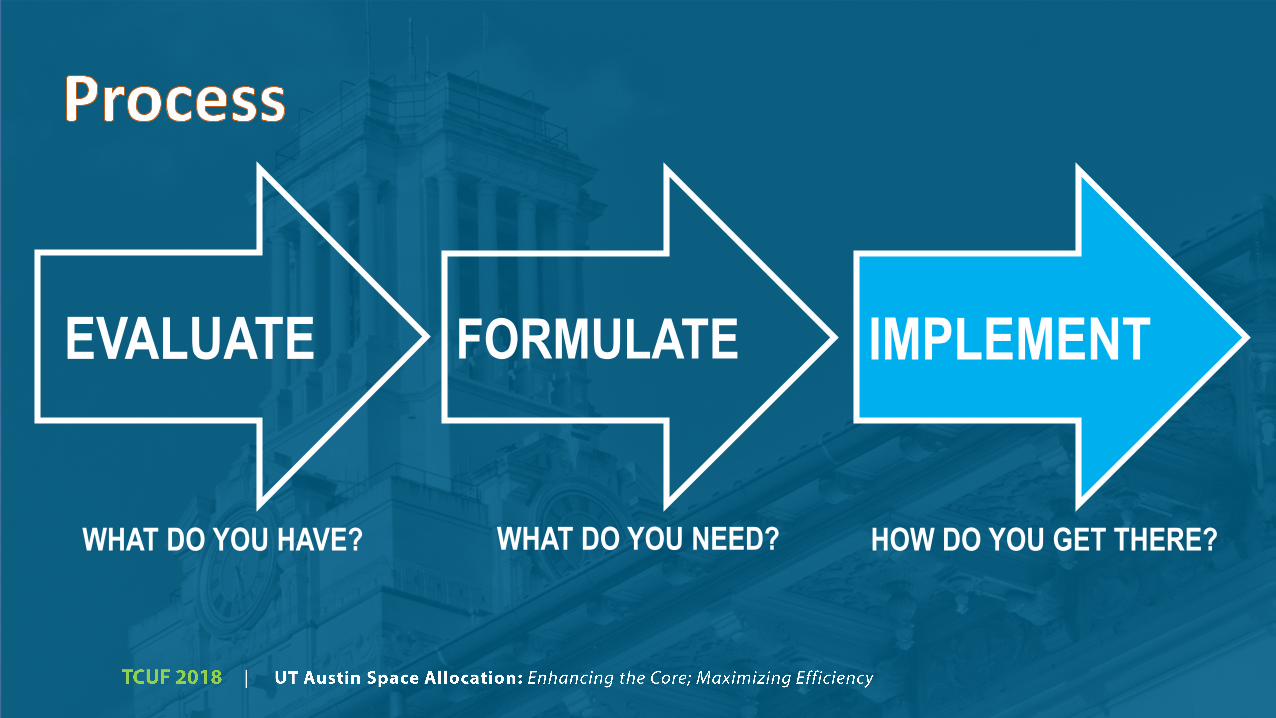
FORMULATEEVALUATE IMPLEMENT
WHAT DO YOU HAVE? WHAT DO YOU NEED? HOW DO YOU GET THERE?

FORMULATEEVALUATE IMPLEMENT
WHAT DO YOU HAVE? WHAT DO YOU NEED? HOW DO YOU GET THERE?

Interview 47 units
Develop space list/program database each unit
Analyze existing space for utilization/efficiency
Identify facility condition issues
Receive owner-provided information

Understanding of each unit’s requirements
Familiarity with targeted space & condition
Schedule alignment with academic calendar
Uncovered risks & challenges

FORMULATE
WHAT DO YOU NEED?
EVALUATE
WHAT DO YOU HAVE?
IMPLEMENT
HOW DO YOU GET THERE?

Space Standards
Location matrix (core, edge or off-campus)
Planning principles (building, department, operation, adjacencies, access)
Test-fits with evaluation matrix
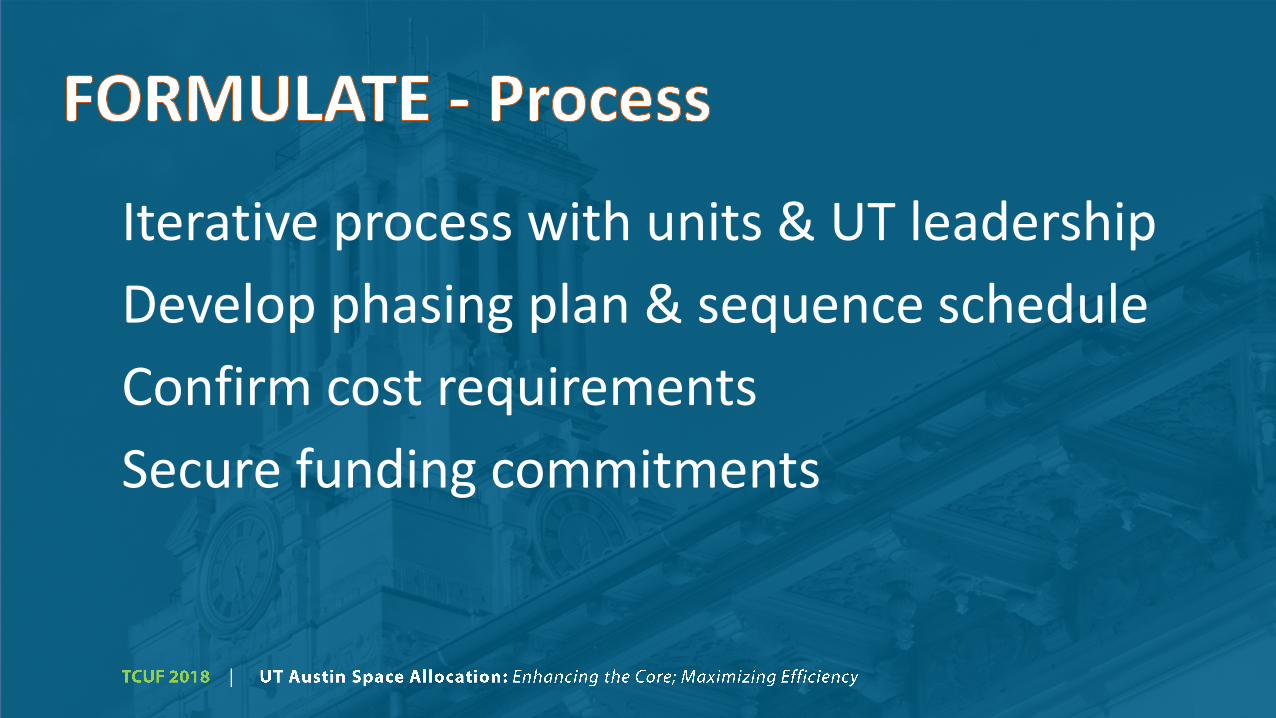
Iterative process with units & UT leadership
Develop phasing plan & sequence schedule
Confirm cost requirements
Secure funding commitments

Highly informed plan framework
Support from units & administration
Confident implementation approach
Risks alleviated or mitigated
Space Standards

Use data from peer institutions
Minimize office types (4 closed + 3 open)
Apply space standard by position
Compared existing 2015 space data with SAS proposed via location and calculated change

Office CirculationOffice Type Core Edge
VP/AVP 200-250 220
Closed + Conference 150-175 160
Closed + Meeting 125-150 140
Closed + Visitor 120-130 120
Open + Visitor 68 65
Open 56 65
Admin 49 48
Student/Workstudy 40 40
Factor Core Edge
Conference + Support .35 .32
Internal Circulation .26 .24

Information Security OfficeVP:
DEAN/AVP:
DIR: Cam Beasley
LOCATION: FAC
1 Security Officer
2 Incident Response Team
3 Tool & Dev Team
4 Risk Management Team Employee 2015 Proposed
FTE 16.00 16.00
Student Workers 0.00 0.00
Group Space Breakdown
Conference & Service 205 742
Internal Circulation ASF 0 400
Office ASF 2,006 1,280
Total ASF 2,211 2,422
ASF/FTE 138 126
Proposed Group Detail Total Office Space in Selected Filters 1,600
Functional
Group Employee Position Office Type FTE
Proposed
Location ASF Total
1 Cam Beasley BSChE, CISSP, CIFI Open + Visitor 1 Core 80 80
2 Kelly Kerby Senior Network Security Analyst Open + Visitor 1 Core 80 80
2 Scott Loder Senior Network Security Analyst Open + Visitor 1 Core 80 80
2 James Liao Senior Network Security Analyst Open + Visitor 1 Core 80 80
2 Jason Ragland Senior Network Security Analyst Open + Visitor 1 Core 80 80
3 Daryl Ashley Senior Network Security Analyst Open + Visitor 1 Core 80 80
3 Jason Phelps Senior Network Security Analyst Open + Visitor 1 Core 80 80
3 Sean Reid Senior Network Security Analyst Open + Visitor 1 Core 80 80
3 Ben Maxfield Network Security Analyst Open + Visitor 1 Core 80 80
4 Charlie Scott Assistant Information Security Officer Open + Visitor 1 Core 80 80
4 John Gordon Senior Network Security Analyst Open + Visitor 1 Core 80 80
4 Justin LeSelva Network Security Analyst Open + Visitor 1 Core 80 80
4 Bryon Hill Network Security Analyst Open + Visitor 1 Core 80 80
4 Lindsay Walker Network Security Analyst Open + Visitor 1 Core 80 80
4 Vacant Network Security Analyst Open + Visitor 1 Core 80 80
4 Vacant Network Security Analyst Open + Visitor 1 Core 80 80
Test Server Room Conference & Service Core 120 120
Additional Storage Space Conference & Service Core 200 200
Total Office Space 1,280
Conference & Support Space 742
Internal Circulation 400
Proposed Total 2,422
Core Total ASF Proposed 2,422
Edge Total ASF Proposed 0
Off Total ASF Proposed 0
Function Group Key
Group Snapshot
2,006
1,280
400
205 742
2 0 1 5 P R O P O SE D
TOTAL ASF
Darrell Bazzell
N/A

Use ASF/GSF, then adjacencies, then count spaces
Create map with vacated space and attributes (student-oriented, near transit, move-in ready)
Group synergistic units or desirability for location
Provide advantages/benefits of each option

FORMULATEEVALUATE IMPLEMENT
WHAT DO YOU HAVE? WHAT DO YOU NEED? HOW DO YOU GET THERE?

Mobilize PM core team – project launch
Organize by unit type
Secure funding/accounting interface
Create implementation schedule

Secure CMR for multiple renovation activities
Engage design team in program approach
Move unit communication from idea to reality
Focus on improving efficiency & operations

Phased implementation strategy
Quality delivery process & product
Maintained mission-focus
Created low-risk delivery profile

4 phases over 5 years
On schedule with projects added over time
47 departments interviewed
350K SF of space analyzed
4.5 months of test-fit/concepts (Option A-G)


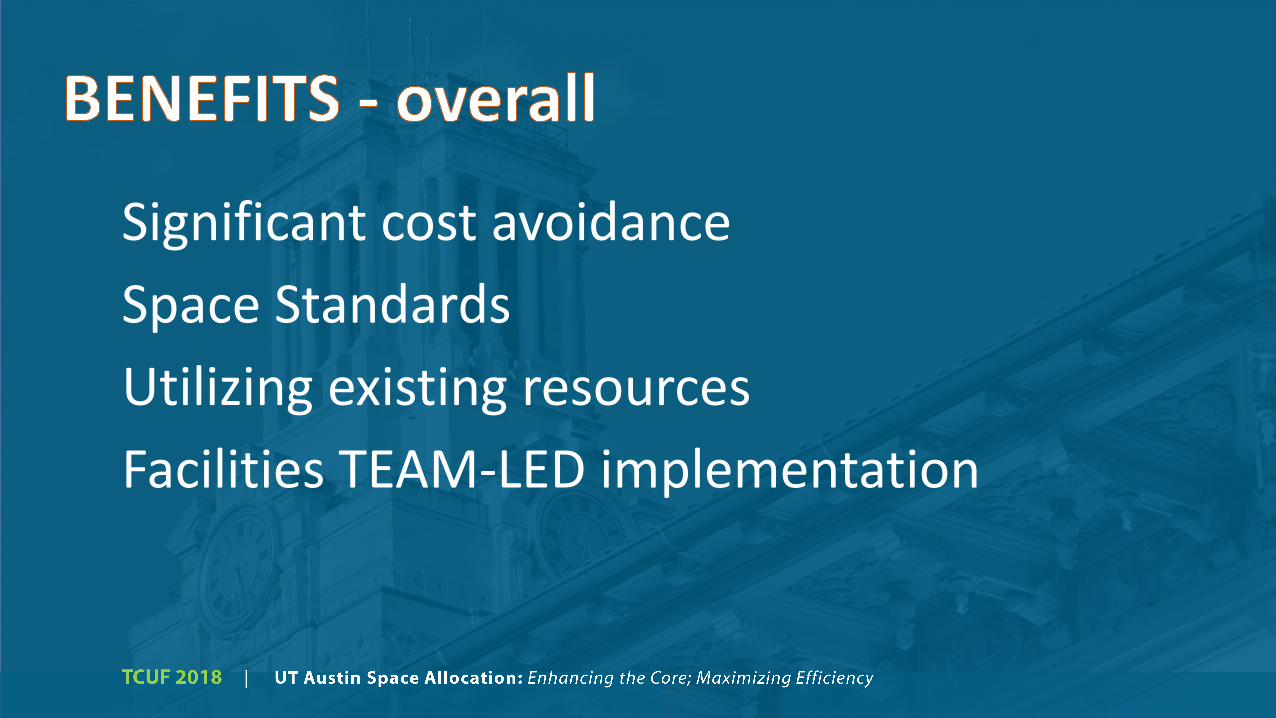
Significant cost avoidance
Space Standards
Utilizing existing resources
Facilities TEAM-LED implementation

Touched over 270K GSF
Spent $18M ($65/SF TPC)
Emptied two buildings
Increased space for ACADEMIC programs

Space released from Core 204,774 ASF
Modify from ASF to GSF 342,000 GSF
Building Cost $575 GSF TPC
Cost to construct released space $197,000,000
Implementation costs ($58,000,000)
UT Austin cost avoidance $139,000,000

What Worked Areas for Improvement
• Facilities-led effort (SME)
• Early communication
• Each unit treated equally
• Units secured equal or better space
• Started with vacant space
• Organizational change duringdesign & construction
• Broader/targeted communication during design & construction
• Pressure exerted from legacy or “connected” programs
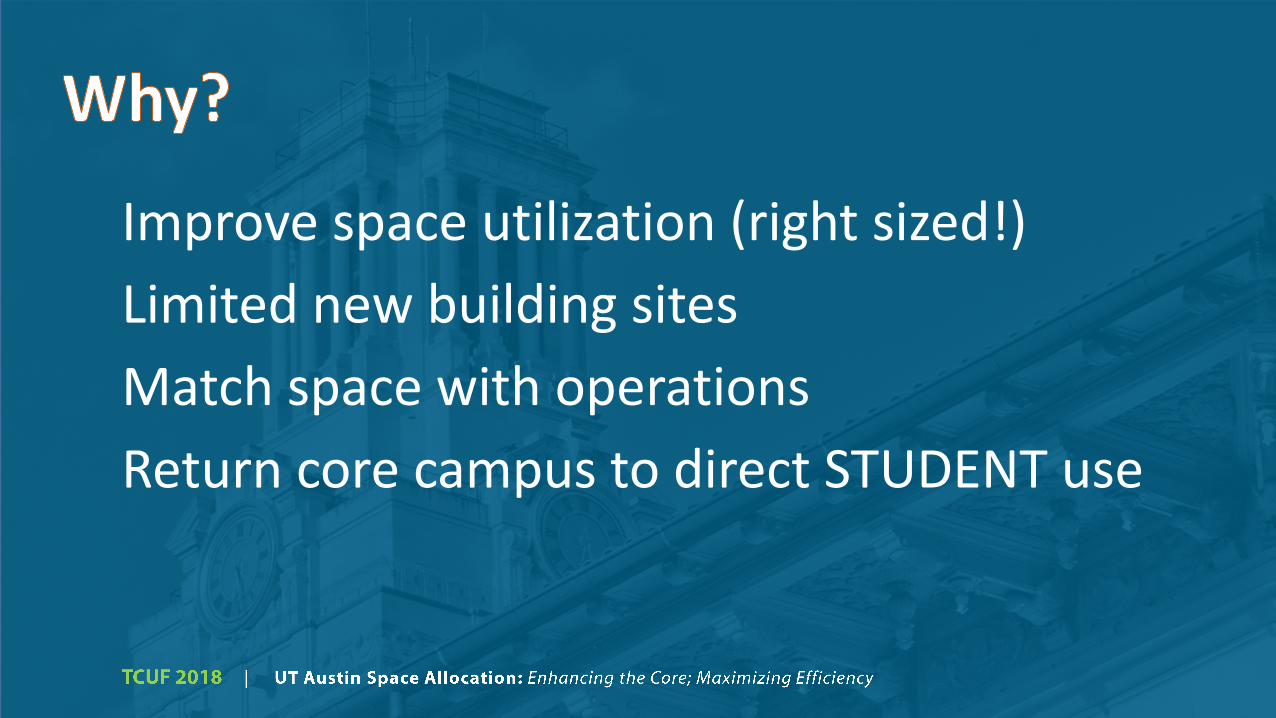
Improve space utilization (right sized!)
Limited new building sites
Match space with operations
Return core campus to direct STUDENT use

Planning/Set up 2016
Phase 1 2017
Complete Phase 2 2018
Planning Phase 3 2019+
“ACADEMIC BACKFILL”
• New Welcome Center
• New Career Center
• New One-Stop Center
• New Entrepreneurship Ctr
• New Home Aerospace
• Building for Social Work


EVALUATEWHAT DO YOU HAVE?
FORMULATEWHAT DO YOU NEED?
IMPLEMENTHOW DO YOU GET THERE?
Communication Plan
Interview/brief unit leadership
Interview 45 units
Plan review and confirmation
Assess existing space (efficiency/utilization, front
facing accessibility and location desirability)
Develop space list
Deliver complete package to units for acceptance
Establish Space Standards
Create program with current and proposed space
Present location changes with evaluation criteria based on
program/function/need
Metric-based decision making (space savings, improved
adjacency or program gain)
Create move sequence schedule and budget
Relocation test-fits for approval
Communication Plan for transparent process
Mobilize core team
Detailed planning with managers
Select design and construction partners
Refine cost estimates
Confirm move schedules with operational realities

LOCATION STANDARDS RENOVATION COST
COREHigher amount of historic, legacy or institutional buildings – more difficult to change or adapt
Most difficult to change or
adapt because of systems
and construction
Highest cost and highest
risk due to age of systems
and construction type
EDGEGreater flexibility with space
standards – but many
buildings not easily
adaptable to change
Some flexibility because
construction type may be
non-institutional construction
Less cost than Core except
building systems and
condition may be equally
challenging or sophisticated
OFFHighest degree of space
standards flexibility and
easiest to implement
(non-institutional)
Easiest to renovate or
change and CM’s may have
higher knowledge base with
Off campus buildings
Higher cost certainty about
off-campus buildings (tend
to be non-institutional)
RISK
CO
MP
LEX
ITY