space based astronomy educator guide pdf - nasa
TRANSCRIPT

National Aeronautics and Space Administration
Educational Product
Educators Grades 5–8
EG-2001-01-122-HQ
Space-Based AstronomyAN EDUCATOR GU IDE WITH ACT IV IT IES FOR SC IENCE , MATHEMAT ICS , AND TECHNOLOGY EDUCAT ION
* Space Based Atronomy.b/w 2/28/01 8:53 AM Page C1

Space-Based Astronomy—An Educator Guide withActivities for Science, Mathematics, and TechnologyEducation is available in electronic format throughNASA Spacelink—one of the Agency’s electronicresources specifically developed for use by the educa-tional community.
The system may be accessed at the following address:http://spacelink.nasa.gov
* Space Based Atronomy.b/w 2/28/01 8:54 AM Page C2

NATIONAL AERONAUTICS AND SPACE ADMINISTRATION | OFFICE OF HUMAN RESOURCES AND EDUCATION | EDUCATION DIVISION | OFFICE OF SPACE SCIENCE
This publication is in the Public Domain and is not protected by copyright. Permission is not required for duplication.
EG-2001-01-122-HQ
Space-Based AstronomyAN EDUCATOR GU IDE WITH ACT IV IT IES FOR SC IENCE , MATHEMAT ICS , AND TECHNOLOGY EDUCAT ION
* Space Based Atronomy.b/w 2/28/01 8:54 AM Page i

ACKNOWLEDGMENTS
Many thanks to the NASA Aerospace Education Services Program, NASA Teaching From SpaceProgram, NASA Educator Resource Center Network, and NASA Office of Space Science for theircontributions to the development of this guide.
Writer:Gregory L. Vogt, Ed.D.Teaching From Space ProgramNASA Johnson Space CenterHouston, TX
National Aeronautics and Space Administrationii
1. EIT 304Å image captures a sweeping prominence—huge clouds of relatively cool dense plasma suspended in the Sun’s hot,
thin corona. At times, they can erupt, escaping the Sun’s atmosphere. Emission in this spectral line shows the upper chro-
mosphere at a temperature of about 60,000 degrees K. Source/Credits: Solar & Heliospheric Observatory (SOHO). SOHO is a
project of international cooperation between ESA and NASA.
2. This mosaic shows some of the highest resolution images obtained by the Solid State Imaging (SSI) system on NASA’s Galileo
spacecraft during its eleventh orbit around Jupiter. The sun illuminates the scene from the left, showing hundreds of ridges
that cut across each other, indicating multiple episodes of ridge formation either by volcanic or tectonic activity within the ice.
The Jet Propulsion Laboratory, Pasadena, CA, manages the mission for NASA’s Office of Space Science, Washington, DC. JPL
is a division of California Institute of Technology.
3. A Minuet of Galaxies: This troupe of four galaxies, known as Hickson Compact Group 87 (HCG 87), is performing an intricate
dance orchestrated by the mutual gravitational forces acting between them. The dance is a slow, graceful minuet, occurring
over a time span of hundreds of millions of years. Image Credit: Hubble Heritage Team (AURA/ STScI/ NASA).
4. Frames from a three dimensional visualization of Jupiter’s equatorial region. These features are holes in the bright, reflective,
equatorial cloud layer where warmer thermal emission from Jupiter’s deep atmosphere can pass through. The circulation pat-
terns observed here along with the composition measurements from the Galileo Probe suggest that dry air may be converg-
ing and sinking over these regions, maintaining their cloud-free appearance. The Jet Propulsion Laboratory, Pasadena, CA,
manages the Galileo mission for NASA’s Office of Space Science, Washington, DC. JPL is an operating division of California
Institute of Technology.
5. This image of the planet Saturn and natural satellites Tethys and Dione was taken on January 29, 1996, by Voyager 1.
6. This striking NASA Hubble Space Telescope picture shows three rings of glowing gas encircling the site of supernova 1987A, a
star which exploded in February 1987. The supernova is 169,000 light years away, and lies in the dwarf galaxy called the Large
Magellanic Cloud, which can be seen from the southern hemisphere. Credit: Dr. Christopher Burrows, ESA/STScI and NASA.
To find out more about these images and projects, please visit http://spacescience.nasa.gov
1. 2. 3. 4. 5. 6.
About the Cover Images
* Space Based Atronomy.b/w 2/28/01 8:54 AM Page ii

Acknowledgments . . . . . . . . . . . . . . . . . . . . . . . . . . . . . . . . . . . . . . . . . . . . . . . . . . . . . . . . . . .ii
Introduction . . . . . . . . . . . . . . . . . . . . . . . . . . . . . . . . . . . . . . . . . . . . . . . . . . . . . . . . . . . . . . .1
How to Use This Guide . . . . . . . . . . . . . . . . . . . . . . . . . . . . . . . . . . . . . . . . . . . . . . . . . . . . . . .3
The Space Age Begins . . . . . . . . . . . . . . . . . . . . . . . . . . . . . . . . . . . . . . . . . . . . . . . . . . . . . . . .5
Astrophysics . . . . . . . . . . . . . . . . . . . . . . . . . . . . . . . . . . . . . . . . . . . . . . . . . . . . . . . . . . . . . . . .7
A Brief History of United States Astronomy Spacecraft and Crewed Space Flights . . . . . . . . . . . . . . . . . . . . . . . . . . . . . . . . . . . .9
Activity UnitsUnit 1: The Atmospheric Filter . . . . . . . . . . . . . . . . . . . . . . . . . . . . . . . . . . . . . . . . . . . . . . .17Unit 2: The Electromagnetic Spectrum . . . . . . . . . . . . . . . . . . . . . . . . . . . . . . . . . . . . . . . . .23Unit 3: Collecting Electromagnetic Radiation . . . . . . . . . . . . . . . . . . . . . . . . . . . . . . . . . . . .53Unit 4: Down to Earth . . . . . . . . . . . . . . . . . . . . . . . . . . . . . . . . . . . . . . . . . . . . . . . . . . . . .71Unit 5: Space-Based Astronomy on the Internet . . . . . . . . . . . . . . . . . . . . . . . . . . . . . . . . . . .91
Glossary . . . . . . . . . . . . . . . . . . . . . . . . . . . . . . . . . . . . . . . . . . . . . . . . . . . . . . . . . . . . . . . . .94
Suggested Reading . . . . . . . . . . . . . . . . . . . . . . . . . . . . . . . . . . . . . . . . . . . . . . . . . . . . . . . . . .97
NASA Educational Resources . . . . . . . . . . . . . . . . . . . . . . . . . . . . . . . . . . . . . . . . . . . . . . . . . .99
Reply Card . . . . . . . . . . . . . . . . . . . . . . . . . . . . . . . . . . . . . . . . . . . . . . . . . . . . . . . . . . . . . .101
Space-Based AstronomyActivity Guide for Science, Mathematics, and Technology Education iii
TABLE OF CONTENTS
* Space Based Atronomy.b/w 2/28/01 8:54 AM Page iii

It would seem that when it comes to observingthe universe, the larger the instrument, the bet-ter. This is true up to a point, but there are lim-its—limits not imposed by technology but bynature itself.
Surrounding Earth is a life-sustaining atmos-phere that stands between our eyes and the radi-ation that falls upon Earth from outer space.This radiation is comprised of a very broad spec-trum of energies and wavelengths. Collectively,they are referred to as the electromagnetic spec-trum. They range from radio and microwaveradiation on the low energy (long wavelength)end through infrared, visible, ultraviolet, and x-rays to gamma rays on the high energy (short
wavelength) end. Gases and other componentsof our atmosphere distort, filter, and block mostof this radiation permitting only a partial pic-ture, primarily visible radiation and some radiowaves, to reach Earth’s surface. Although manythings can be learned about our universe bystudying it from the surface of Earth, the story isincomplete. To view celestial objects over thewhole range of the electromagnetic spectrum, itis essential to climb above the atmosphere intoouter space.
From its earliest days, the National Aeronauticsand Space Administration (NASA) has used theemerging technology of rockets to explore theuniverse. By lofting telescopes and other scientif-
Space-Based AstronomyActivity Guide for Science, Mathematics, and Technology Education 1
INTRODUCTIONIf you go to the country, far from city lights, you can see about 3,000 stars on a clear
night. If your eyes were bigger, you could see many more stars. With a pair of binoc-
ulars, an optical device that effectively enlarges the pupil of your eye by about 30
times, the number of stars you can see increases to the tens of thousands. With a
medium-sized telescope with a light-collecting mirror 30 centimeters in diameter,
you can see hundreds of thousands of stars. With a large observatory telescope,
millions of stars become visible.
* Space Based Atronomy.b/w 2/28/01 8:54 AM Page 1

ic instruments above the veil of Earth’s atmos-phere, NASA has delivered a treasure house ofinformation to astronomers, leading them to
rethink their most fundamental ideas about whatthe universe is, how it came to be, how it func-tions, and what it is likely to become.
National Aeronautics and Space Administration2
* Space Based Atronomy.b/w 2/28/01 8:54 AM Page 2

The guide begins with a survey of astronomy-related spacecraft NASA has sent into outerspace. This is followed by a collection of activitiesorganized into four units: The AtmosphericFilter, The Electromagnetic Spectrum, CollectingElectromagnetic Radiation, and Down to Earth.A curriculum matrix identifies the curriculumareas each activity addresses. Following theactivities is information for obtaining a 35 mmslide set with descriptions showing current
results from NASA spacecraft such as theHubble Space Telescope (HST), ComptonGamma Ray Observatory (CGRO), and theCosmic Background Explorer (COBE). Theguide concludes with a glossary, a reference list,a NASA Resources list, and an evaluation card.Feedback from users of this guide is essential forthe development of future editions and otherclassroom supplementary materials.
Space-Based AstronomyActivity Guide for Science, Mathematics, and Technology Education 3
HOW TO USE THIS GUIDEThis curriculum guide uses hands-on activities to help students and teachers understand
the significance of space-based astronomy—astronomical observations made from
outer space. It is not intended to serve as a curriculum. Instead, teachers should select
activities from this guide that support and extend existing study. The guide contains few
of the traditional activities found in many astronomy guides such as constellation stud-
ies, lunar phases, and planetary orbits. It tells, rather, the story of why it is important to
observe celestial objects from outer space and how to study the entire electromagnetic
spectrum. Teachers are encouraged to adapt these activities for the particular needs of
their students. When selected activities from this guide are used in conjunction with tra-
ditional astronomy curricula, students benefit from a more complete experience.
* Space Based Atronomy.b/w 2/28/01 8:54 AM Page 3

A much larger Sputnik 2 followed, carrying asmall dog as a passenger. Although primarilyinvestigating the response of living things to pro-longed periods of microgravity, Sputnik 2 didsense the presence of a belt of high-energycharged particles trapped by Earth’s magneticfield. Explorer 1, the United States’ first satellite,defined that field further.
The cylindrical, 13.6 kilogram Explorer 1 rodeto space on top of a Juno I rocket on January 31,1958. It was launched by the United States Armyin association with the National Academy ofSciences and the Jet Propulsion Laboratory of
the California Institute of Technology. NASAwas not created formally by an act of Congressuntil the following October.
Explorer 1 carried scientific instrumentsdesigned by Dr. James Van Allen of theUniversity of Iowa. Circling Earth in an orbitranging from 360 to 2,531 kilometers, thesatellite radioed back radiation measurements,revealing a deep zone of radiation surroundingEarth.
Born of the technology of World War II and thetensions of the Cold War, the space age began in
Space-Based AstronomyActivity Guide for Science, Mathematics, and Technology Education 5
THE SPACE AGE BEGINSWithin months of each other, the United States and the Soviet Union launched
their first artificial satellites into orbit around Earth. Both satellites were small and
simple. Sputnik 1, a Soviet spacecraft, was the first to reach orbit. It was a
58-centimeter-diameter aluminum sphere that carried two radio transmitters,
powered by chemical batteries. The satellite reached orbit on October 4, 1957.
Although an extremely primitive satellite by today’s standards, Sputnik 1 never-
theless enabled scientists to learn about Earth’s magnetic field, temperatures in
space, and the limits of Earth’s atmosphere.
* Space Based Atronomy.b/w 2/28/01 8:54 AM Page 5

the peaceful pursuit of scientific discovery. In themore than 35 years that have followed, thou-sands of spacecraft have been launched intoEarth orbit, to the Moon, and to the planets. For
the majority of those spacecraft, the goal hasbeen to learn about Earth, our solar system, andthe universe.
National Aeronautics and Space Administration6
Artist’s concept of Explorer 1 in space
* Space Based Atronomy.b/w 2/28/01 8:54 AM Page 6
Generally, objects beyond our solar system arehandled in the field of astrophysics. Theseinclude stars, the interstellar medium, otherobjects in our Milky Way Galaxy, and galaxiesbeyond our own.
NASA defines astrophysics as the investigationof astronomical bodies by remote sensing fromEarth or its vicinity. Because the targets of theastrophysicist are generally beyond humanreach even with our fastest rockets, astrophysi-cists concentrate solely on what the electro-
magnetic spectrum can tell them about theuniverse. NASA’s astrophysics program hasthree goals: to understand the origin and fateof the universe; to describe the fundamentallaws of physics; and to discover the nature andevolution of galaxies, stars, and the solar sys-tem. The investigations of astrophysicists arecarried out by instruments aboard free-flyingsatellites, sounding rockets that penetrate intospace for brief periods, high-flying aircraft andhigh-altitude balloons, and Space Shuttle mis-sions.
Space-Based AstronomyActivity Guide for Science, Mathematics, and Technology Education 7
ASTROPHYSICSJust a few decades ago, the word astronomy was a general term that described
the science of the planets, moons, Sun and stars, and all other heavenly bodies. In
other words, astronomy meant the study of anything beyond Earth. Although still
an applicable term, modern astronomy, like most other sciences, has been divided
and subdivided into many specialties. Disciplines that study the planets include
planetary geology and planetary atmospheres. The study of the particles and fields
in space is divided into magnetospheric physics, ionospheric physics, and cosmic
and heliospheric physics. The Sun has its own solar physics discipline. The origin
and evolution of the universe is the subject of cosmology.
* Space Based Atronomy.b/w 2/28/01 8:54 AM Page 7

Teams of scientists began their studies in spaceclose to home by exploring the Moon and thesolar system. Encouraged by those successes,they have looked farther out to nearly the begin-ning of the universe.
Observing the heavens from a vantage pointabove Earth is not a new idea. The idea of plac-ing telescopes in orbit came quite early—at leastby 1923 when Hermann Oberth described theidea. Even before his time, there were a fewattempts at space astronomy. In 1874, JulesJanseen launched a balloon from Paris with twoaeronauts aboard to study the effects of theatmosphere on sunlight. Astronomers continueto use balloons from launch sites in theAntarctic; Palestine, Texas; and Alice Springs,
Australia. After launch, scientistschase the balloon in a plane as theballoon follows the prevailing winds,traveling thousands of kilometersbefore sinking back to Earth. A typ-ical balloon launch yields manyhours of astronomical observations.
Rocket research in the second half ofthe 20th century developed the tech-nology for launching satellites.Between 1946 and 1951, the U.S.launched 69 V-2 rockets. The V-2rockets were captured from theGermans after World War II andused for high altitude research.Several of those flights studied ultra-
Space-Based AstronomyActivity Guide for Science, Mathematics, and Technology Education 9
A BRIEF HISTORY OF THE UNITED STATESASTRONOMY SPACECRAFT AND CREWED SPACE FLIGHTSThe early successes of Sputnik and the Explorer series spurred the
United States to develop long-range programs for exploring space. Once
the United States became comfortable with the technical demands of
spacecraft launches, NASA quickly began scientific studies in space
using both crewed and non-crewed spacecraft launches.
U.S. V-2 rocket launch
* Space Based Atronomy.b/w 2/28/01 8:54 AM Page 9

violet and x-ray emissions from the Sun. Today,sounding rockets are used primarily by universi-ties. They are inexpensive and quick, but provideonly a few minutes of observations.
To conduct its current research, NASA uses bigrockets like Atlas, Delta, Titan, and the SpaceShuttle as well as small rockets launched from a B-52 aircraft to lift satellites into orbit. Except for thelargest rockets, which are launched in Florida andCalifornia, rocket research and launches occur atmany places around the United States. NASA alsouses the Kuiper Airborne Observatory (KAO) thatcarries a 0.9-meter telescope inside a C-141 air-craft. It flies above the densest part of the atmos-phere and observes in the far-infrared and submil-limeter wavelengths. KAO flies approximately 80times a year. KAO can reach an altitude of 13,700meters with a normal flight time of 7.5 hours.
In the near future, NASA will begin flying theStratospheric Observatory for Infrared Astronomy(SOFIA). SOFIA is a 747 aircraft modified to
accommodate a 2.5 meter reflecting telescope,which is slightly larger than the Hubble SpaceTelescope (HST) at 2.4 meters. Like KAO,SOFIA will conduct infrared astronomy and fly atan altitude of 13,000 meters for 8 hours.
Over the years, NASA space probes have sentback detailed images of the planets Mercury,Venus, Mars, Jupiter, Saturn, Uranus, andNeptune. Mariner 2 was the first spacecraft toexplore another planet when it flew past Venusin 1962. The missions to the planets have rede-fined the picture of our solar system. Scientistshave an incredible set of data from almost everyplanet in the solar system.
National Aeronautics and Space Administration10
NASA’s Kuiper Airborne Observatory
Black Brandt sounding rocket ready for launch to study
Supernova 1987A
Final inflation of an instrument-carrying helium balloon before
launch from Palestine, TX
* Space Based Atronomy.b/w 2/28/01 8:54 AM Page 10

We learned that Venus is hotter than Mercury.Data from satellites in orbit around Venus havetold us about the atmosphere and terrain of theplanet. By monitoring Venus’ atmosphere, scien-tists can study the effects of a runaway green-house effect. Several Russian spacecraft haveexplored the surface of Venus as well as theMoon and Mars.
Although spacecraft have mapped the surface ofMars, the Mars Viking mission gently deposit-ed two landers on the surface that sent backdata. They still sit on the surface there. The twointerplanetary travelers, Voyager 1 and 2(launched in September and August 1977,respectively) visited Jupiter, Saturn, Uranus,and Neptune and are now leaving the solar sys-tem on their way into interstellar space. Theysent back new data on these gas giant planets.Their discoveries included volcanoes on Io (asatellite of Jupiter), storms on Neptune, andring shepherd satellites around Saturn. The twoVoyager missions represent an incredible suc-cess story. They provided unique glimpses ofthe planets and redefined the history of oursolar system.
Beginning in 1962, NASA launched a series of nine orbiting observatories to observe the Sun.Astrophysicists began to understand the interior
of our nearest star. In the 1970’s, Skylab astro-nauts brought back from orbit a wealth of dataon the Sun, using x-rays to study its activity.
In 1978, one of the most successful astronom-ical satellite missions, the InternationalUltraviolet Explorer (IUE), was launched.This satellite has an ultraviolet telescope thathas been used to study the universe in theultraviolet portion of the electromagneticspectrum. Many scientists continue to useIUE simultaneously with other satellites andEarth telescopes to gather multi-wavelengthdata on astronomical objects.
Other NASA satellites have carried x-raydetectors into space. One of the first (1970)—called Uhuru (Swahili for freedom)—mappedthe entire sky in x-ray wavelengths. Later(1978), the second High Energy AstrophysicsObservatory (HEAO-2), called Einstein,imaged many objects in x-ray light. Today asatellite called ROSAT (a name honoring thephysicist who discovered x-rays, Dr. WilhelmRoentgen) continues the study of individualsources of x-rays in the sky. All of these satel-lites added new objects to the astronomicalzoo and helped scientists understand theprocesses that make x-rays in space. The sheernumber of high-energy objects discovered bythese satellites surprised and excited the scien-tific community.
The Infrared Astronomical Satellite (IRAS)was launched in 1983. It mapped the sky ininfrared wavelengths. IRAS scientists have dis-covered thousands of infrared sources neverseen before. The infrared part of the spectrumtells about molecules in space and gas and dustclouds where new stars are hidden until theyare bright enough to outshine their birthcloud.
The Space Shuttle is used to introduce instru-ments into low Earth orbit. Satellites like theHST orbit about 600 kilometers above Earth’ssurface. This is a low Earth orbit and accessibleto the Shuttle. To put satellites into high Earthorbit, an upper stage must be carried in the
Space-Based AstronomyActivity Guide for Science, Mathematics, and Technology Education 11
Skylab 4 picture of the Sun in ionized helium light
* Space Based Atronomy.b/w 2/28/01 8:54 AM Page 11

Shuttle’s payload bay or the satellite is loftedwith one of several different kinds of non-crewed launch vehicles. For example, theGeostationary Operational EnvironmentalSatellite (GOES) orbits about 40,000 kilome-ters above Earth’s surface. A Delta rocket wasused to put GOES into high orbit. The choiceof altitude—high Earth orbit or low Earthorbit—depends on the data to be measured.
Recent and Multi-Mission Programs
MagellanIn May 1989, the Magellan spacecraft wasreleased from the Space Shuttle and sent on itsway to orbit Venus. The atmosphere of Venus isunfriendly to humans with its thick sulfuric acidclouds, high pressures, and high temperatures.Magellan used radar to penetrate Venus’s denseatmosphere and map the planet’s surface.
GalileoIn October of that same year, another Shuttlemission launched Galileo on its way to visit theplanet Jupiter. On its way out to Jupiter, Galileo(named after Galileo Galilei, an Italian
astronomer of the 17th century) took pictures ofseveral asteroids. The Galileo spacecraft wasdesigned to study Jupiter’s atmosphere, satellites,and surrounding magnetosphere. The spacecraftis currently orbiting Jupiter and performing anextended study of the planet’s moons.
Cosmic Background Explorer (COBE)Just a month later, in November 1989, theCosmic Background Explorer (COBE) waslaunched from a Delta rocket. This satellite sur-veyed the entire sky in microwave wavelengthsand provided the first precise measurement ofvariations in the background radiation of the uni-verse. The distribution of this radiation does notfollow the predictions of the Big Bang Theory.
The Hubble Space Telescope (HST)In April 1990, the crew of the Space ShuttleDiscovery launched the HST. This telescopecombines ultraviolet and optical imaging withspectroscopy to provide high quality data of avariety of astronomical objects. Although theprimary mirror aboard the satellite was later dis-covered to be slightly flawed, astronomers wereable to partially compensate for the slightly out-of-focus images through computer processing. InDecember 1993, the Hubble servicing mission
National Aeronautics and Space Administration12
Top: Thermal background radiation measured by the COBE
spacecraft
Bottom: Image of the Milky Way taken by the COBE spacecraft
The Hubble Space Telescope attached to the Space Shuttle
Endeavour during the 1993 service mission
* Space Based Atronomy.b/w 2/28/01 8:54 AM Page 12

permitted astronauts to add compensatingdevices to the flawed mirror, to readjust its focus,and to replace or repair other instruments andsolar arrays. The servicing mission has led toimages of unprecedented light sensitivity andclarity.
Astro-1 and the Broad-Band X-ray Telescope(BBXRT)In December 1990, the crew of the Space ShuttleColumbia conducted two experiments during itsflight. The Astro-1 instrument platform and theBroad-Band X-ray Telescope (BBXRT) bothstudy the x-ray and ultraviolet emissions ofastronomical objects.
Compton Gamma Ray Observatory (CGRO)A few months later, in April 1991, the ComptonGamma Ray Observatory (CGRO) waslaunched from the Space Shuttle. CGRO is thesecond of NASA’s Great Observatories. Duringits lifetime, CGRO made some of the mostimportant discoveries in the field of gamma-rayastronomy:
• Gamma ray bursts (short-lived, but extreme-ly powerful explosions) are evenly distributedacross the sky, and thus outside the MilkyWay galaxy;
• Gamma ray loud blazars (quasars with particlejets aimed at us) to be a new class of objects;and
• The galactic center glows in antimatter radia-tion.
CGRO was safely and flawlessly de-orbited overthe Pacific Ocean on June 4, 2000.
Extreme Ultraviolet Explorer (EUVE)In May 1992, a Delta rocket boosted theExtreme Ultraviolet Explorer (EUVE) into orbit.This satellite, which concluded its mission inDecember 2000, studied the far ultraviolet partof the spectrum. One unexpected result fromthis mission was the distances at which ultravio-let sources were seen. The scientists expected tosee ultraviolet radiation only from within 50light years of the Sun. EUVE detected extremeultraviolet emissions from distant galaxies in itsfirst year of operation.
Cassini-HuygensLaunched in October 1997, the Cassini-Huygensmission will do a detailed study of Saturn, itsrings, its magnetosphere, its icy satellites, and itsmoon Titan. The Cassini Orbiter’s mission con-sists of delivering the Huygens probe (providedby the European Space Agency) to Titan to studyits clouds, atmosphere, and surface, and thenremaining in orbit around Saturn for detailedstudies of the planet and its rings and satellites.Cassini will arrive at Saturn on July 1, 2004.
Space-Based AstronomyActivity Guide for Science, Mathematics, and Technology Education 13
Deployment of the Compton Gamma Ray Observatory from
the Space Shuttle Atlantis in 1991
Gamma ray bursts detected by the Compton Gamma Ray
Observatory
* Space Based Atronomy.b/w 2/28/01 8:54 AM Page 13

Chandra X-ray ObservatoryLaunched in July of 1999, Chandra is the thirdof NASA’s Great Observatories, after the HSTand CGRO. It is performing an exploration ofthe hot turbulent regions in space and has 8-times greater resolution than previous x-ray tele-scopes enabling it to detect sources more than20-times fainter than previous observations.Chandra’s improved sensitivity will make possi-ble more detailed studies of black holes, super-novas, and dark matter and increase our under-standing of the origin, evolution, and destiny ofthe universe.
The Discovery ProgramDiscovery represents the implementation of“Faster, Better, Cheaper” planetary missions. Thephilosophy of Discovery is to solicit proposalsfor an entire mission, put together by consortiacomprised of industry, small businesses, and uni-versities. The goal is to launch many, smallermissions that do focused science with fast turn-around times and for which the entire missioncost (design, development, launch vehicle,instruments, spacecraft, launch, mission opera-tions, and data analysis) is minimal. Discoverymissions selected to date include:
• Near Earth Asteroid Rendezvous (NEAR) • Mars Pathfinder • Lunar Prospector • Stardust • Genesis • Comet Nucleus Tour (CONTOUR) • ASPERA-3 • Deep Impact • Mercury Surface Space Environment
Geochemistry and Ranging mission (MES-SENGER)
The Explorer ProgramThe Explorer Program began with the launch ofExplorer 1 in 1958, and became a sustained pro-gram beginning in 1961. Over 70 “Explorer”missions have been launched successfully, pio-neering space research on micrometeoroids, theEarth’s magnetosphere, x-ray astrophysics, thecosmic microwave background and many otherfields of space science investigation. In addition,
the Explorer program has a long history of pro-viding scientific instruments as part of othernations’ missions. Current Explorer missionsinclude:• Submillimeter Wave Astronomy Satellite
(SWAS)• Advanced Composition Explorer (ACE)• Transition Region and Coronal Explorer
(TRACE)• Fast Auroral Snapshot Explorer (FAST)• Solar Anomalous and Magnetospheric Particle
Explorer (SAMPEX)• Far Ultraviolet Spectroscopic Explorer (FUSE)• Imager for Magnetopause-to-Aurora Global
Exploration (IMAGE)• High Energy Transient Explorer-2 (HETE-2)• High Energy Solar Spectroscopic Imager
(HESSI)• Microwave Anisotropy Probe (MAP)• Cooperative Astrophysics and Technology
Satellite (CATSAT)• Galaxy Evolution Explorer (GALEX)• Cosmic Hot Interstellar Plasma Spectrometer
(CHIPS)• Inner Magnetosphere Explorer (IMEX)• Two Wide-Angle Imaging Neutral-Atom
Spectrometer (TWINS)• Swift• Full-Sky Astrometric Mapping Explorer
(FAME)• Coupled Ion-Neutral Dynamics Investigations
(CINDI)
The Mars Surveyor ProgramThe Mars Surveyor program reflects a long-termcommitment to the exploration of the RedPlanet. NASA intends to launch one or twospacecraft to Mars whenever Mars’ orbit allows,approximately every 26 months. The first space-craft in this series was the Mars Global Surveyorin 1996. The Mars ‘98 Orbiter and Lander werelaunched in December 1998 and January 1999but were lost during their journey to Mars. The2001 Mars Odyssey orbiter is scheduled to arriveat Mars in late 2001 and is expected to produceexceptional science mapping the mineralogy ofthe Martian surface. Currently under develop-ment are twin scientific exploration rovers sched-uled for launch in 2003. Each of the rovers will
National Aeronautics and Space Administration14
* Space Based Atronomy.b/w 2/28/01 8:54 AM Page 14

be delivered to the surface protected by inflatedairbags similar to the successful Mars Pathfinder.Each rover will be equipped with an integratedsuite of instruments (cameras, spectrometers,microscopes, and abrasion tool) that will allow itto behave as a robotic field geologist. They willhave an exploration range of up to 1 kilometerduring their 90 days of operational life on thesurface of Mars. In 2005, NASA plans to launcha powerful scientific orbiter. This mission, theMars Reconnaissance Orbiter, will focus on ana-lyzing the surface at new spatial scales and innew spectral regions in an effort to follow thepotential evidence of water from the MarsGlobal Surveyor images and to bridge the gapbetween surface observations and measurementsfrom orbit. The next step in the Mars explo-ration program strategy will be to send a long-range, long-duration mobile science laboratoryto Mars (at least by 2009, and as early as 2007).This “smart lander” will be a major leap in sur-face measurements and pave the way for a futuresample return mission.
New Millennium ProgramNASA has an ambitious plan for space explo-ration in the next century. It envisions a scenarioin which spacecraft will have revolutionary newcapabilities compared to those of today.Spacecraft are envisioned as flying in formation,or in fleets, or having artificial intelligence toprovide the kind of capability that can answerthe more detailed level of questions that scien-tists have about the universe. Missions include:
• Deep Space 1 • Deep Space 2• Starlight• Earth Observing 1• Earth Observing 3• Space Technology 5• Space Technology 6
The goal of the New Millennium Program (NMP)is to identify and test advanced technologies thatwill provide spacecraft with the capabilities theyneed in order to achieve NASA’s vision.
Space-Based AstronomyActivity Guide for Science, Mathematics, and Technology Education 15
Year Mission Target 1957 Stratoscope I Sun 1961 Explorer 11 gamma rays 1962 Arobee X-ray sources 1962 Mariner 2 Venus 1963 Mars 1 Mars 1965 Mariner 4 Mars 1967 OSO-3 gamma rays 1968 RAE-1 radio 1968 OAO-2 UV sky 1969 Vela 5A gamma rays 1969 Apollo 11 Moon 1970 SAS-1 X-ray sky 1971 Explorer 43 solar wind/ radio 1971 Mariner 9 Mars 1972 Pioneer 10 deep space 1972 Copernicus UV sky 1973 Pioneer 11 deep space 1973 Skylab Sun 1973 Explorer 49 radio sources 1974 Mariner 10 Mercury 1975 SAS-3 X-ray sources 1975 Viking 1 & 2 Mars 1976 Viking 1 & 2 Mars 1977 Voyager 2 outer planets 1977 Voyager 1 outer planets 1978 IUE UV sky 1978 Pioneer Venus-A radar studies 1978 HEAO-2 X-ray sky
Astronomy Space Missions(partial list)
Year Mission Target
1983 IRAS infrared sky1985 Spacelab-2 infrared sky 1989 Magellan Venus 1989 Galileo Jupiter/asteroids/
Earth/Venus 1989 COBE microwave sky 1990 HST UV sky 1990 ROSAT X-ray sky 1990 Ulysses Sun1990 ASTRO-1 X-ray and UV sky1990 ROSAT X-ray sky1991 Yohko Sun in X-rays1992 Extreme UV Explorer X-ray sky1994 Wind Solar wind1994 Clemintine Moon1995 Infrared Telescope in Space IR sky1995 Infrared Space Observatory IR sky1995 Rossi X-ray Timing Explorer X-ray sky1995 Solar Heliospheric Observatory Sun1995 ASTRO-2 UV sky1996 Mars Global Surveyor Mars1996 Near Earth Asteroid Rendezvous Asteroid1996 Mars Pathfinder Mars1997 Cassini Saturn1998 Lunar Prospector Moon1999 Stardust Comet1999 Mars Climate Orbiter Mars1999 Mars Polar Orbiter Mars1999 Chandra X-ray Observatory X-ray sky
* Space Based Atronomy.b/w 2/28/01 8:54 AM Page 15

National Aeronautics and Space Administration16
Technologies such as solar electric propulsion andartificial intelligence promise a great leap forwardin terms of future spacecraft capability, but theyalso present a risk to missions that use them for thefirst time. Through a series of deep space and Earthorbiting flights, NMP will demonstrate thesepromising but risky technologies in space to provethat they work. Once validated, the technologiespose less of a risk to missions that would like to usethem to achieve their scientific objectives.
International Solar Terrestrial Physics (ISTP)ProgramCollaborative efforts by NASA, the EuropeanSpace Agency (ESA), and the Institute of Spaceand Astronautical Science (ISAS) of Japan led tothe International Solar-Terrestrial Physics pro-gram, consisting of a set of missions being carriedout during the 1990’s and into the next century.This program combines resources and scientificcommunities on an international scale using acomplement of several missions, along with com-plementary ground facilities and theoreticalefforts, to obtain coordinated, simultaneous inves-tigations of the Sun-Earth space environment overan extended period of time. Missions include:
• Wind• Polar• Geotail• The Solar and Heliospheric Observatory
(SOHO)• Ulysses• Advanced Composition Explorer (ACE)• IMP-8• EQUATOR-8
Living With A Star (LWS)Living With A Star (LWS) is a NASA initiativethat will develop the scientific understandingnecessary to effectively address those aspects of
the coupled Sun-Earth system that directly affectlife and society on Earth. LWS missions include:
• Solar Dynamics Observatory (SDO)• Sentinels• Radiation Belt Mappers (RBM)• Ionospheric Mappers (IM)
Scientific Balloon ProgramBalloons offer a low-cost, quick response methodfor doing scientific investigations. Balloons aremobile, meaning they can be launched where thescientist needs to conduct the experiment, and canbe readied for flight in as little as six months.Balloon payloads provide us with information onthe atmosphere, the universe, the Sun, and thenear-Earth and space environment. NASA launch-es about 30 scientific balloons each year.
Sounding Rocket ProgramExperiments launched on sounding rockets pro-vide a variety of information, including chemicalmakeup and physical processes taking place in theatmosphere; the natural radiation surrounding theEarth; and data on the Sun, stars, and galaxies.Sounding rockets provide the only means of mak-ing in-situ measurements at altitudes between themaximum altitudes for balloons (about 30 milesor 48 kilometers) and the minimum altitude forsatellites (100 miles or 161 kilometers).
Using space-borne instruments, scientists nowmap the universe in many wavelengths.Satellites and telescopes provide data in radio,microwave, infrared, visible, ultraviolet, x-ray,and gamma ray. By comparing data from anobject in the sky, in all wavelengths,astronomers are learning more about the historyof our universe. Visit http://spacescience.nasa.gov,for more information about NASA SpaceScience missions and programs.
* Space Based Atronomy.b/w 2/28/01 8:54 AM Page 16

Yet the same atmosphere that makes life possiblehinders our understanding of Earth’s place in theuniverse. Our only means for investigating dis-tant stars, nebulae, and galaxies is to collect andanalyze the electromagnetic radiation theseobjects emit into space. However, most of thisradiation is absorbed or distorted by the atmos-phere before it can reach a ground-based tele-scope. Only visible light and some radio waves,infrared, and ultraviolet light survive the passage
from space to the ground. That limited amountof radiation has provided astronomers enoughinformation to estimate the general shape andsize of the universe and categorize its basic com-ponents, but there is much left to learn. It isessential to study the entire spectrum rather thanjust limited regions of it. Relying only on theradiation that reaches Earth’s surface is like lis-tening to a piano recital on a piano that has justa few of its keys working.
Space-Based AstronomyActivity Guide for Science, Mathematics, and Technology Education 17
UNIT 1THE ATMOSPHERIC FILTERIntroduction
Earth’s atmosphere is essential to life. This ocean of fluids and suspended particles
surrounds Earth and protects it from the hazards of outer space. It insulates the
inhabitants of Earth from the extreme temperatures of space and stops all but the
larger meteoroids from reaching the surface. Furthermore, it filters out most radia-
tion dangerous to life. Without the atmosphere, life would not be possible on Earth.
The atmosphere contains the oxygen we breathe. It also has enough pressure so
that water remains liquid at moderate temperatures.
* Space Based Atronomy.b/w 2/28/01 8:54 AM Page 17

Unit Goal• To demonstrate how the components of
Earth’s atmosphere absorb or distort incom-ing electromagnetic radiation.
Teaching StrategyThe following demonstrations are designed toshow how components of Earth’s atmosphere filteror distort electromagnetic radiation. Since we can-not produce all of the different wavelengths of elec-tromagnetic radiation in a classroom, the light froma slide or overhead projector in a darkened roomwill represent the complete electromagnetic spec-trum. A projection screen will represent Earth’s sur-face and objects placed between the projector andthe screen will represent various components ofEarth’s atmosphere. All of the demonstrations canbe conducted in a single class period. Place the pro-jector in the back of the classroom and aim ittowards the screen at the front. Try to get the roomas dark as possible before doing the demonstrations.
ACTIVITY: Clear AirDescription:Students observe some of the problems inherentin using astronomical telescopes on Earth’s sur-face through a series of brief demonstrationsgiven by the teacher.
Objectives:To demonstrate how Earth’s atmosphere interfereswith the passage of electromagnetic radiation.
National Education Standards:Science
Evidence, models, & explanationTransfer of energy
TechnologyUnderstand troubleshooting, R & D,invention, innovation, & experimentation
Materials and Tools:For all demonstrations
Darkened roomOverhead or slide projectorWorksheet for each student
• Demonstration 1Small sheet of clear glass or Plexiglass™Emery paper (fine) to smooth sharp edgesof glass or plastic
• Demonstration 2Shallow dish or pie tinEmpty coffee canIceSpray bottle and waterCloud cutout (cardboard or other material)
• Demonstration 3Stick matchesEye protection
• Demonstration 4Food warmer fuel (e.g. Sterno™) or elec-tric hotplateMatches if using fuelEye protection if using fuelAluminum foilSewing pin
• Demonstration 5150 to 200 watt light bulbUncovered light fixtureStar slide (see demonstration 4)
Background: Earth’s atmosphere appears to be clear to the nakedeye. On a dark, cloud-free night far from city lights,thousands of stars are visible. It is hard to imagine abetter view of the sky when the wisps of the MilkyWay Galaxy are visible stretching from the north-ern to the southern sky. In spite of the apparentclarity, the view is flawed. Many wavelengths areblocked by the atmosphere and visible light is fil-tered and distorted.
The demonstrations that follow are designed toshow how Earth’s atmosphere interferes with thepassage of electromagnetic radiation. Visible lightis used as an example of all wavelengths since mostother wavelengths of electromagnetic radiation aredifficult and even dangerous to produce in theclassroom. Make sure students understand thatthe demonstrations are examples of what happensacross the entire electromagnetic spectrum.
National Aeronautics and Space Administration18
* Space Based Atronomy.b/w 2/28/01 8:54 AM Page 18
Management and Tips:To make effective use of the demonstrations, itis necessary to have a room that can be dark-ened. A projection screen will represent Earth’ssurface and the light cast by an overhead orslide projector will represent all the wavelengthsof electromagnetic radiation coming to Earthfrom space. The demonstrations are things thatyou do between the screen and the projector torepresent phenomena occurring in Earth’satmosphere.
The actual demonstrations will take approxi-mately 15 minutes to complete. Allow time todiscuss the significance of each demonstrationwith your students. The most important thing toknow is that Earth’s atmosphere only allows asmall portion of the electromagnetic spectrum toreach Earth’s surface and astronomers’ telescopes.The information astronomers can collect isincomplete and thus the story of the universethey are able to construct from this informationis also incomplete. Conclude the discussion withthe question “What can astronomers do aboutit?” The answer is to move observatories off thesurface of Earth into outer space.
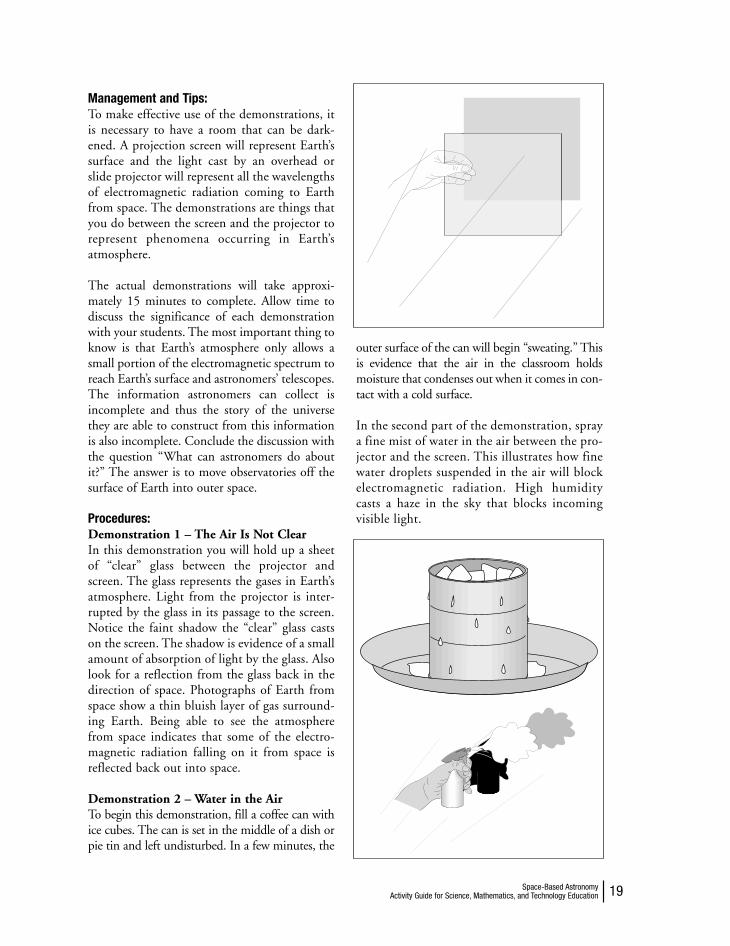
Procedures:Demonstration 1 – The Air Is Not ClearIn this demonstration you will hold up a sheetof “clear” glass between the projector andscreen. The glass represents the gases in Earth’satmosphere. Light from the projector is inter-rupted by the glass in its passage to the screen.Notice the faint shadow the “clear” glass castson the screen. The shadow is evidence of a smallamount of absorption of light by the glass. Alsolook for a reflection from the glass back in thedirection of space. Photographs of Earth fromspace show a thin bluish layer of gas surround-ing Earth. Being able to see the atmospherefrom space indicates that some of the electro-magnetic radiation falling on it from space isreflected back out into space.
Demonstration 2 – Water in the AirTo begin this demonstration, fill a coffee can withice cubes. The can is set in the middle of a dish orpie tin and left undisturbed. In a few minutes, the
outer surface of the can will begin “sweating.” Thisis evidence that the air in the classroom holdsmoisture that condenses out when it comes in con-tact with a cold surface.
In the second part of the demonstration, spraya fine mist of water in the air between the pro-jector and the screen. This illustrates how finewater droplets suspended in the air will blockelectromagnetic radiation. High humiditycasts a haze in the sky that blocks incomingvisible light.
Space-Based AstronomyActivity Guide for Science, Mathematics, and Technology Education 19
* Space Based Atronomy.b/w 2/28/01 8:54 AM Page 19

Finally, hold up the cloud cutout. The cloud showswhat happens when moisture condenses in the airaround small dust particles. The shadow cast bythe cloud shows how clouds can substantiallyblock visible light coming to Earth from space.
Demonstration 3 – PollutionWhile wearing eye protection, strike a match andthen blow it out right away. The smoke particlesreleased from the match head will produce anoticeable shadow on the screen. Pollution froma variety of sources (human-made and natural)block some of the incoming visible light.
Demonstration 4 – Heat CurrentsPrior to the demonstration, create a star slide. Ifyou are using a slide projector, obtain a plasticslide mount in which the film can be removed.Slip a small square of aluminum foil into the
slide frame and use a pin to randomly prickabout 30 holes into the foil. If you are using anoverhead projector, prepare a star slide from alarge square of aluminum foil. The square shouldcover the entire stage of the projector. Pokeabout 100 holes through the foil.
Project light through the slide you prepared. Asmall star field will be displayed on the screen.While wearing eye protection (not necessary ifusing an electric hot plate), place the warmervery near and just below the beam of the projec-tor. Stars will show a twinkling effect on thescreen. This demonstration shows how heat cur-rents in Earth’s atmosphere can distort theimages of astronomical objects.
Demonstration 5 – Day/NightUse the star slide you prepared in the previousactivity. Hold up the lamp with the light bulb
National Aeronautics and Space Administration20
Food warmer fuelor electric hotplate
* Space Based Atronomy.b/w 2/28/01 8:54 AM Page 20

near the screen. Turn on the bulb. Many of thestars on the screen near the bulb will disappear.This demonstration shows how the Sun’s lightoverpowers the fainter stars. Sunlight brightensthe gases, water, and particles in Earth’s atmos-phere so that the distant stars are not visible. Ifthe Sun’s light could be dimmed, other starswould be visible at the same time.
Assessment:Collect student sheets. Compare the answers thestudents have given but focus on the last ques-tion in which students must propose solutions tothe atmospheric problems associated with Earth-
based observatories. Students may be aware ofnew strategies for improving the observations ofEarth-based telescopes such as adaptive mirrorsthat change their shape slightly many times eachsecond to compensate for air currents. However,no advanced telescope design technique willmake up for electromagnetic radiation that doesnot reach Earth’s surface.
Extensions:• Have students research new Earth-based tel-
escope designs on the Internet. Use searchterms such as observatory, telescopes, andastronomy.
Space-Based AstronomyActivity Guide for Science, Mathematics, and Technology Education 21
* Space Based Atronomy.b/w 2/28/01 8:54 AM Page 21

Name:
1. Earth’s atmosphere creates problems for astronomers. Identify and explain 3ways Earth’s atmosphere interferes with astronomical observations.
A.
B.
C.
2. How might these problems affect the discoveries and conclusions astronomersreach through their observations?
3. Why are most astronomical observatories built on remote mountains?
4. What can astronomers do to capture the missing electromagnetic radiation forstudy?
Clear AirStudent Work Sheet
* Space Based Atronomy.b/w 2/28/01 8:54 AM Page 22

Like expanding ripples in a pond after a pebblehas been tossed in, electromagnetic radiationtravels across space in the form of waves. Thesewaves travel at the speed of light—300,000 kilo-meters per second. Their wavelengths, the dis-tance from wave crest to wave crest, vary fromthousands of kilometers across (in the case ofthe longest radio waves) to fractions of ananometer, in the cases of the smallest x-raysand gamma rays.
Electromagnetic radiation has properties of bothwaves and particles. What we detect depends on themethod we use to study it. The beautiful colors thatappear in a soap film or in the dispersion of lightfrom a diamond are best described as waves. Thelight that strikes a solar cell to produce an electriccurrent is best described as a particle. Whendescribed as particles, individual packets of electro-magnetic energy are called photons. The amount ofenergy a photon of light contains depends upon itswavelength. Electromagnetic radiation with long
Space-Based AstronomyActivity Guide for Science, Mathematics, and Technology Education 23
Introduction
Contrary to popular belief, outer space is not empty space. It is filled with electro-
magnetic radiation that crisscrosses the universe. This radiation comprises the
spectrum of energy ranging from radio waves on one end to gamma rays on the
other. It is called the electromagnetic spectrum because this radiation is associat-
ed with electric and magnetic fields that transfer energy as they travel through
space. Because humans can see it, the most familiar part of the electromagnetic
spectrum is visible light—red, orange, yellow, green, blue, and violet.
UNIT 2THE ELECTROMAGNETIC SPECTRUM
* Space Based Atronomy.b/w 2/28/01 8:54 AM Page 23
wavelengths contains little energy. Electro-magnet-ic radiation with short wavelengths contains a greatamount of energy.
Scientists name the different regions of the elec-tromagnetic spectrum according to their wave-lengths. (See figure 1.) Radio waves have thelongest wavelengths, ranging from a few centime-ters from crest to crest to thousands of kilometers.Micro-waves range from a few centimeters toabout 0.1 cm. Infrared radiation falls between700 nanometers and 0.1 cm. (Nano means one
billionth. Thus 700 nanometers is a distanceequal to 700 billionths or 7 x 10⁻⁷ meter.) Visiblelight is a very narrow band of radiation rangingfrom 400 to 700 nanometers. For comparison, itwould take 50 visible light waves arranged end toend to span the thickness of a sheet of householdplastic wrap. Below visible light is the slightlybroader band of ultraviolet light that lies between10 and 300 nanometers. X-rays follow ultravioletlight and diminish into the hundred-billionth ofa meter range. Gamma rays fall in the trillionth ofa meter range.
The wavelengths of x-rays and gamma rays are sotiny that scientists use another unit, the electronvolt, to describe them. This is the energy that anelectron gains when it falls through a potentialdifference, or voltage, of one volt. It works outthat one electron volt has a wavelength of about0.0001 centimeters. X-rays range from 100 elec-tron volts (100 eV) to thousands of electronvolts. Gamma rays range from thousands of elec-tron volts to billions of electron volts.
Using the Electromagnetic Spectrum
All objects in space are very distant and difficultfor humans to visit. Only the Moon has been vis-ited so far. Instead of visiting stars and planets,astronomers collect electromagnetic radiationfrom them using a variety of tools. Radio dishescapture radio signals from space. Big telescopeson Earth gather visible and infrared light.Interplanetary spacecraft have traveled to all theplanets in our solar system except Pluto and havelanded on two. No spacecraft has ever broughtback planetary material for study. They sendback all their information by radio waves.
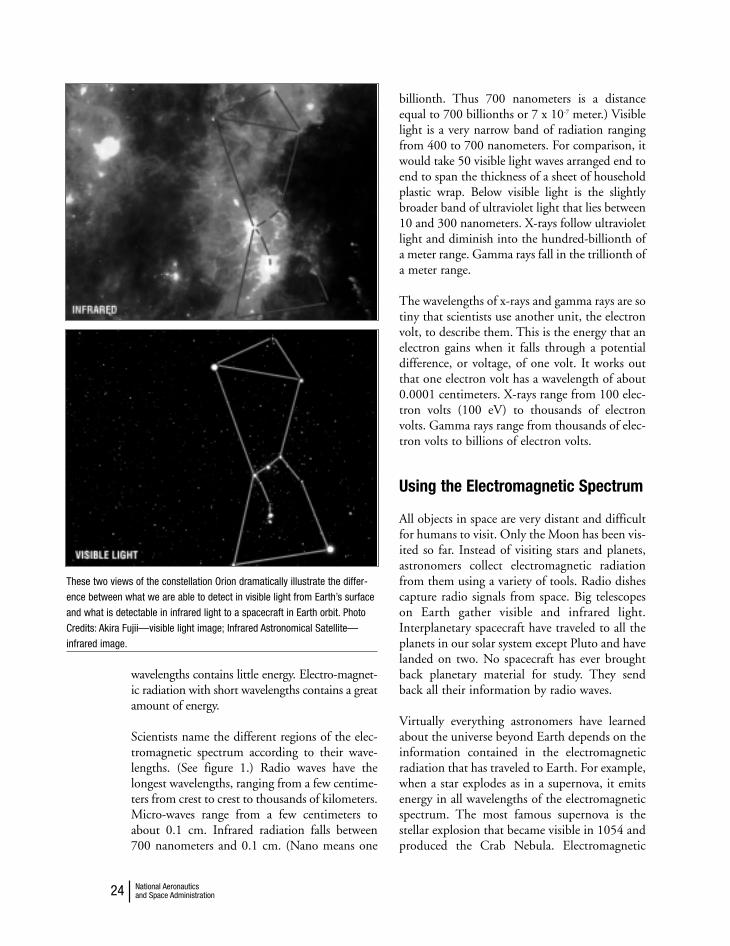
Virtually everything astronomers have learnedabout the universe beyond Earth depends on theinformation contained in the electromagneticradiation that has traveled to Earth. For example,when a star explodes as in a supernova, it emitsenergy in all wavelengths of the electromagneticspectrum. The most famous supernova is thestellar explosion that became visible in 1054 andproduced the Crab Nebula. Electromagnetic
National Aeronautics and Space Administration24
These two views of the constellation Orion dramatically illustrate the differ-
ence between what we are able to detect in visible light from Earth’s surface
and what is detectable in infrared light to a spacecraft in Earth orbit. Photo
Credits: Akira Fujii—visible light image; Infrared Astronomical Satellite—
infrared image.
* Space Based Atronomy.b/w 2/28/01 8:54 AM Page 24

radiation from radio to gamma rays has beendetected from this object, and each section of thespectrum tells a different piece of the story.
For most of history, humans used only visiblelight to explore the skies. With basic tools andthe human eye, we developed sophisticatedmethods of time keeping and calendars.Telescopes were invented in the 17th century.Astronomers then mapped the sky in greaterdetail––still with visible light. They learnedabout the temperature, constituents, distribu-tion, and the motions of stars.
In the 20th century, scientists began to explore theother regions of the spectrum. Each region provid-ed new evidence about the universe. Radio wavestell scientists about many things: the distribution ofgases in our Milky Way Galaxy, the power in thegreat jets of material spewing from the centers ofsome other galaxies, and details about magneticfields in space. The first radio astronomers unex-pectedly found cool hydrogen gas distributedthroughout the Milky Way. Hydrogen atoms arethe building blocks for all matter. The remnantradiation from the Big Bang, the beginning of theuniverse, shows up in the microwave spectrum.
Infrared studies (also radio studies) tell us aboutmolecules in space. For example, an infraredsearch reveals huge clouds of formaldehyde inspace, each more than a million times more mas-sive than the Sun. Some ultraviolet light comesfrom powerful galaxies very far away. Astronomers
have yet to understand the highly energeticengines in the centers of these strange objects.
Ultraviolet light studies have mapped the hot gasnear our Sun (within about 50 light years). Thehigh energy end of the spectrum—x-rays andgamma rays—provide scientists with informationabout processes they cannot reproduce here onEarth because they lack the required power.Nuclear physicists use strange stars and galaxies as alaboratory. These objects are pulsars, neutron stars,black holes, and active galaxies. Their study helpsscientists better understand the behavior of matterat extremely high densities and temperatures in thepresence of intense electric and magnetic fields.
Each region of the electromagnetic spectrum pro-vides a piece of the puzzle. Using more than oneregion of the electromagnetic spectrum at a timegives scientists a more complete picture. Forexample, relatively cool objects, such as star-form-ing clouds of gas and dust, show up best in theradio and infrared spectral region. Hotter objects,such as stars, emit most of their energy at visibleand ultraviolet wavelengths. The most energeticobjects, such as supernova explosions, radiateintensely in the x-ray and gamma ray regions.
There are two main techniques for analyzingstarlight. One is called spectroscopy and theother photometry. Spectroscopy spreads out thedifferent wavelengths of light into a spectrum forstudy. Photometry measures the quantity of lightin specific wavelengths or by combining all
Space-Based AstronomyActivity Guide for Science, Mathematics, and Technology Education 25
Figure 1: Electromagnetic Spectrum
* Space Based Atronomy.b/w 2/28/01 8:54 AM Page 25
wavelengths. Astronomers use many filters intheir work. Filters help astronomers analyze par-ticular components of the spectrum. For exam-ple, a red filter blocks out all visible light wave-lengths except those that fall around 600nanometers (it lets through red light).
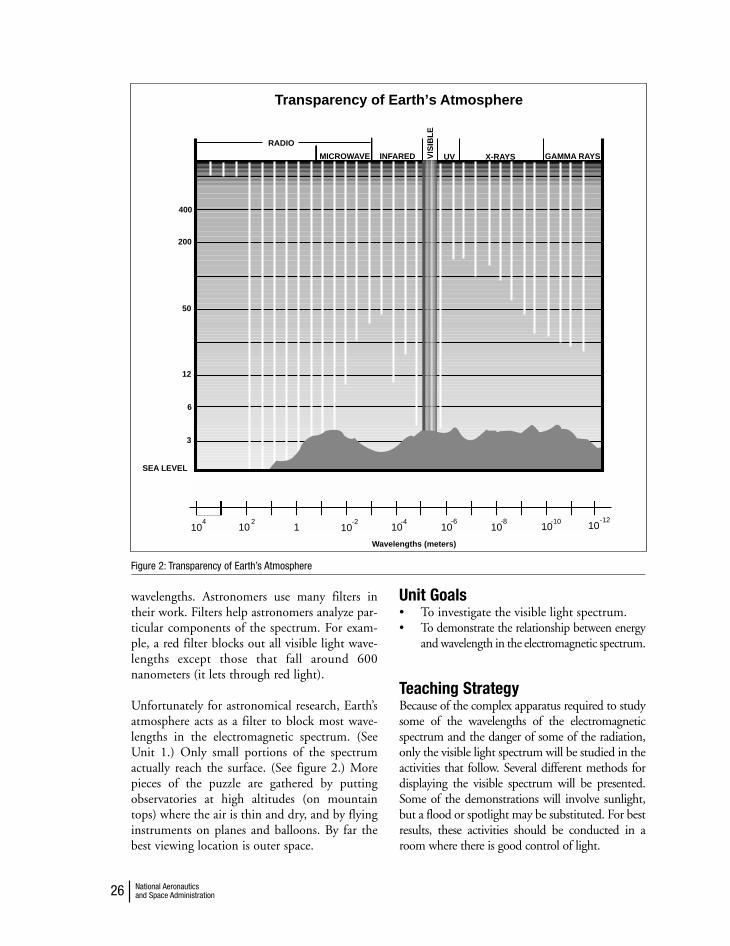
Unfortunately for astronomical research, Earth’satmosphere acts as a filter to block most wave-lengths in the electromagnetic spectrum. (SeeUnit 1.) Only small portions of the spectrumactually reach the surface. (See figure 2.) Morepieces of the puzzle are gathered by puttingobservatories at high altitudes (on mountaintops) where the air is thin and dry, and by flyinginstruments on planes and balloons. By far thebest viewing location is outer space.
Unit Goals• To investigate the visible light spectrum.• To demonstrate the relationship between energy
and wavelength in the electromagnetic spectrum.
Teaching StrategyBecause of the complex apparatus required to studysome of the wavelengths of the electromagneticspectrum and the danger of some of the radiation,only the visible light spectrum will be studied in theactivities that follow. Several different methods fordisplaying the visible spectrum will be presented.Some of the demonstrations will involve sunlight,but a flood or spotlight may be substituted. For bestresults, these activities should be conducted in aroom where there is good control of light.
National Aeronautics and Space Administration26
Figure 2: Transparency of Earth’s Atmosphere
MICROWAVE INFARED VIS
IBL
E
UV X-RAYS GAMMA RAYS
RADIO
400
200
50
12
6
3
SEA LEVEL
104 2 -2 -4 -6 -8 -10 -12
1 10 101010 10 10 10
Wavelengths (meters)
Transparency of Earth’s Atmosphere
* Space Based Atronomy.b/w 2/28/01 8:54 AM Page 26

ACTIVITY: Simple SpectroscopeDescription: A basic hand-held spectroscope is made from adiffraction grating and a paper tube.
Objective:To construct a simple spectroscope with a dif-
fraction grating and use it to analyze the colorsemitted by various light sources.
National Education Standards:Mathematics
MeasurementConnections
ScienceSystems, order, & organizationChange, constancy, & measurementAbilities necessary to do scientific inquiryAbilities of technological design
TechnologyUnderstand engineering design
Materials:Diffraction grating, 2-cm square (See man-agement and tips section.)Paper tube (tube from toilet paper roll)Poster board square (5 by 10-cm)Masking tapeScissorsRazor blade knife2 single-edge razor bladesSpectrum tubes and power supply (Seemanagement and tips section.)Pencil
Procedure:1. Using the pencil, trace around the end of the
paper tube on the poster board. Make twocircles and cut them out. The circles shouldbe just larger than the tube’s opening.
2. Cut a 2-centimeter square hole in the center ofone circle. Tape the diffraction grating squareover the hole. If students are making their ownspectroscopes, it may be better if an adult cutsthe squares and the slot in step 4 below.
3. Tape the circle with the grating inward toone end of the tube.
4. Make a slot cutter tool by taping two sin-gle-edge razor blades together with a piece
of poster board between. Use the tool tomake parallel cuts about 2 centimeterslong across the middle of the second circle.Use the razor blade knife to cut across theends of the cuts to form a narrow slotacross the middle of the circle.
5. Place the circle with the slot against the otherend of the tube. While holding it in place,observe a light source such as a fluorescenttube. Be sure to look through the grating endof the spectroscope. The spectrum will appearoff to the side from the slot. Rotate the circlewith the slot until the spectrum is as wide aspossible. Tape the circle to the end of the tubein this position. The spectroscope is complete.
Space-Based AstronomyActivity Guide for Science, Mathematics, and Technology Education 27
violet red
Look throughdiffractiongrating
red violet
Visible Spectrumappears to rightand left ofcenter line
Lightentersslot
Light source(not the Sun!)
* Space Based Atronomy.b/w 2/28/01 8:54 AM Page 27

6. Examine various light sources with the spec-troscope. If possible, examine nighttime streetlighting. Use particular caution when examin-ing sunlight. Do not look directly into the Sun.
Background:Simple spectroscopes, like the one described here,are easy to make and offer users a quick look atthe color components of visible light. Differentlight sources (incandescent, fluorescent, etc.) maylook the same to the naked eye but will appeardifferently in the spectroscope. The colors arearranged in the same order but some may bemissing and their intensity will vary. The appear-ance of the spectrum displayed is distinctive andcan tell the observer what the light source is.
Management and Tips:The analytical spectroscope activity that followsadds a measurement scale to the spectroscopedesign. The scale enables the user to actuallymeasure the colors displayed. As will bedescribed in greater detail in that activity, thespecific location of the colors are like fingerprintswhen it comes to identifying the composition ofthe light source. Refer to the background andmanagement tips section for the AnalyticalSpectroscope activity for information on howdiffraction gratings produce spectra.
Spectroscopes can be made with glass prisms butprisms are heavy. Diffraction grating spectro-scopes can do the same job but are much lighter.A diffraction grating can spread out the spec-trum more than a prism can. This ability is calleddispersion. Because gratings are smaller andlighter, they are well suited for spacecraft wheresize and weight are important considerations.Most research telescopes have some kind of grat-ing spectrograph attached. Spectrographs arespectroscopes that provide a record, photograph-ic or digital, of the spectrum observed.
Many school science supply houses sell dif-fraction grating material in sheets or rolls.One sheet is usually enough for every studentin a class to have a piece of grating to build hisor her own spectroscope. Holographic diffrac-tion gratings work best for this activity. Referto the note on the source for holographic grat-ing in the next activity. A variety of lightsources can be used for this activity, includingfluorescent and incandescent lights and spec-tra tubes with power supplies. Spectra tubesand the power supplies are available fromschool science supply catalogs. It may be pos-sible to borrow tubes and supplies from anoth-er school if your school does not have them.The advantage of spectrum tubes is that they
National Aeronautics and Space Administration28
* Space Based Atronomy.b/w 2/28/01 8:54 AM Page 28

provide spectra from different gases such ashydrogen and helium. When using the spec-troscope to observe sunlight, students shouldlook at reflected sunlight such as light bounc-ing off clouds or light colored concrete. Otherlight sources include streetlights (mercury,low-pressure sodium, and high-pressure sodi-um), neon signs, and candle flames.
Assessment:Compare student drawn spectra from differentlight sources.
Extensions:• How do astronomers measure the spectra of
objects in space? What do those spectra tellus about these objects?
• Investigate other applications for the electro-magnetic spectrum.
Space-Based AstronomyActivity Guide for Science, Mathematics, and Technology Education 29
* Space Based Atronomy.b/w 2/28/01 8:54 AM Page 29

Use your spectroscope to analyze the colors of light given off by diferentsources. Reproduce the spectra you observe with crayons or colored markersin the spaces below. Identify the light sources. (When using the Sun as alight source, do not look at it directly with your spectroscope. You canharm your eye. Instead, look at sunlight reflected from a white cloud or asheet of white paper.)
Light Source: ______________________
Light Source: ______________________
Light Source _______________________
1. Describe how the spectra of the three light sources you studied differed from each other. How were they similiar?
2. Would you be able to identify the light sources if you only saw their visible spectra?
Student Sheet - Simple Spectroscope
Name:
* Space Based Atronomy.b/w 2/28/01 8:54 AM Page 30

ACTIVITY: Projecting Visible SpectraDescription: Two methods for projecting the visible spectrumare explained.
Objective: To study the range of colors in the visible spec-trum.
National Education Standards:Mathematics
MeasurementConnections
ScienceChange, constancy, & measurementAbilities necessary to do scientific inquiry
Materials:Method 1
Flashlight (focusing kind)Stiff poster board2 single-edge razor bladestapeGlass prismProjection screen
Method 2Overhead projectorHolographic diffraction grating (See nextpage for sources.)2 sheets of opaque paperTapeProjection screen
Procedure: Method 11. Make a partition with a narrow slot in its
center to block all but a narrow beam fromthe flashlight. Cut out a 4 by 1-centimetervertical rectangle out from a 10 by 10-cen-timeter piece of poster board. Tape the twosingle-edge razor blades to the poster boardso that their edges face each other and thereis a 1- to 2-millimeter gap between them.
2. Darken the classroom (the darker the bet-ter).
3. Brace the partition so that it stands uprightwith the gap in the vertical direction.
4. Aim the flashlight beam at the screen andfocus it into a tight beam. Direct the beamof the flashlight directly through the gap in
the partition so that a narrow vertical slot oflight falls on the screen.
5. Stand the glass prism upright and place it inthe narrow beam of light on the oppositeside of the partition.
6. Slowly rotate the prism until the narrow slotof light disperses the visible spectrum.Depending upon the exact alignment, thespectrum may fall on a wall rather than onthe screen. Adjust the setup so that the spec-trum is displayed on the projection screen.
Procedure: Method 21. For this method, you must obtain a piece of
holographic diffraction grating—a gratingproduced by accurate holographic tech-niques. See page 33 for the source of thegrating. Note: Method 2 will not work wellwith a standard transmission grating.
2. Place two pieces of opaque paper on thestage of an overhead projector so that theyare almost touching. There should be anarrow gap between them that lets lightthrough. Aim the projector so that a nar-row vertical beam of light falls on the pro-jection screen.
3. Hang a square of holographic grating overthe projector lens with tape.
4. Darken the classroom (the darker the better).5. Look for the color produced by the grat-
ing. It will fall on the screen or the wall onboth sides of the center line of the projec-tor. You may have to adjust the aiming of
Space-Based AstronomyActivity Guide for Science, Mathematics, and Technology Education 31
Prism
Partition
Narrow gap
* Space Based Atronomy.b/w 2/28/01 8:54 AM Page 31

the projector to have one of the two spec-tra produced fall on the screen.
6. If the spectra produced is a narrow line ofcolor, rotate the holographic film 90 degreesand remount it to the projector lens so thata broad band of color is projected.
Background:Visible light, passing through a prism at a suit-able angle, is dispersed into its component col-ors. This happens because of refraction. Whenvisible light waves cross an interface betweentwo media of different densities (such as fromair into glass) at an angle other than 90degrees, the light waves are bent (refracted).Different wavelengths of visible light are bentdifferent amounts and this causes them to bedispersed into a continuum of colors. (See dia-gram.)
Diffraction gratings also disperse light. Thereare two main kinds of gratings. One transmitslight directly. The other is a mirror-like reflec-tion grating. In either case, diffraction gratingshave thousands of tiny lines cut into their sur-faces. In both kinds of gratings, the visible col-ors are created by constructive and destructiveinterference. Additional information on howdiffraction gratings work is found in theAnalytical Spectroscope activity and in manyphysics and physical science textbooks.
Management and Tips:When projecting spectra, be sure to darken theroom as much as possible. If it is not possible todarken the room, a large cardboard box can beused as a light shield for method 1. Cut a smallpeep-hole to examine the spectra. Method 2produces a much larger spectra than method 1.In both cases, the size of the spectral display canbe enlarged by increasing the distance from theprism or diffraction grating to the screen. Thedisadvantage of enlarging the display is thatonly so much light is available from the lightsource and increasing its dispersion diminishesit intensity. A better light source for method 1is the Sun. If you have a window with directsunlight, you can block most of the light exceptfor a narrow beam that you direct through thegap in the partition. You will probably have toplace the partition with the slot on its side todisplay a visible spectra. A slide projector canalso be used as a light source for method 1.Refer to the Analytical Spectroscope activity formore information on how the diffraction grat-ing works.
National Aeronautics and Space Administration32
Off On
HolographicDiffraction Grating
RedOrangeYellowGreenBlueIndigoViolet
White Light
* Space Based Atronomy.b/w 2/28/01 8:54 AM Page 32

Assessment:Have students use crayons or marker pens to sketchthe visible spectrum produced. Ask students toidentify each color present and to measure thewidths of each color band. Have them determinewhich colors bend more and which bend less asthey come through the prism or diffraction grating.
Extensions:• Who discovered the visible spectrum? How
many colors did the scientist see?• A compact disk acts like a reflection diffrac-
tion grating. Darken the room and shine astrong beam of white light from a flashlighton the disk. The beam will be dispersed bythe grating and be visible on a wall.
• Construct a water prism out of four sheets ofglass. Glue the sheets together as shown in theillustration with clear silicone aquariumcement. When the cement is dry, fill the V-shaped trough with water and check for leaks.Set the finished water prism in a window withdirect sunlight. A visible spectrum will appear
somewhere in the classroom. You can reposi-tion the visible spectrum by bouncing thesunlight off a mirror before it enters the prismin order to change the sunlight angle.
• A pocket mirror placed in a shallow pan ofwater can also project a spectrum. Set up themirror and pan as shown in the illustration.
Sources: Diffraction gratings are available from mostschool science catalogs. Holographic diffractiongrating are available from:
Learning Technologies, Inc.40 Cameron AvenueSomerville, MA 02144 Phone: 1-800-537-8703
Reference: Sadler, P. “Projecting Spectra for ClassroomInvestigations,” The Physics Teacher, October1991, 29(7), pp423–427.
Space-Based AstronomyActivity Guide for Science, Mathematics, and Technology Education 33
Sunlight
Water Prism
Sunlight
Water
* Space Based Atronomy.b/w 2/28/01 8:54 AM Page 33

Projecting Spectra
Name
Using colored markers or crayons and the chart below, reproduce theelectromagnetic spectrum as you see it. Be sure to maintain theproportions of the color widths. Write the names of the colors beneath thechart.
Which color bent the most after passing through the prism or diffraction grating?Why?
Which color bent the least? Why?
Student Work Sheet
* Space Based Atronomy.b/w 2/28/01 8:54 AM Page 34

ACTIVITY: Cereal Box
Analytical SpectroscopeDescription: A spectroscope is constructed (from a cereal boxand diffraction grating) that permits the analysisof visible light.
Objective: To construct an analytical spectroscope and ana-lyze the spectrum produced when various sub-stances are heated or excited with electricity.
National Education Standards:Mathematics
MeasurementData analysis, statistics, & probability
ScienceChange, constancy, & measurementAbilities necessary to do scientific inquiryAbilities of technological designUnderstandings about science & technology
TechnologyUnderstand relationships & connectionsamong technologies & other fieldsUnderstand engineering design
Materials: Cereal box (13-15 ounce size)Holographic diffraction grating (See theProjecting Spectra activity for the source.)Aluminum foilMeasurement scaleMarker penRulerMasking tapeScissorsRazor blade knifeCutting surfaceSpectrum tubes and power supply (See the back-ground and management tips section for infor-mation on sources.)
Procedure:1. Cut a 2 by 2-centimeter window from the
bottom lid of the cereal box. The windowshould be near one side.
2. Cut a second window from the upper boxlid directly above the lower window.
3. Cut a third window in the upper lid. Thiswindow should be 1.5 by 10-centimeters insize. Refer to the cutting diagram for place-ment information of the window.
4. Cut a piece of diffraction grating largeenough to cover the window in the box bot-tom. Handle the grating by the edges if pos-sible; skin oils will damage it. Look at a flu-orescent light through the grating. Turn thegrating so that the rainbow colors you seeappear in fat vertical bars to the right andleft of the light. Tape the grating in place.
Space-Based AstronomyActivity Guide for Science, Mathematics, and Technology Education 35
Frosted
Falling Stars
Breakfast of Astro
nomers
1.5 by 10-cm window
2 by 2-cm window
2 by 2-cm window
* Space Based Atronomy.b/w 2/28/01 8:54 AM Page 35

5. Place a 4 by 4-centimeter square of alu-minum foil on a cutting surface. Cut a nar-row slot into the foil with the razor bladeknife. If you made the slot-cutting tool forthe simple spectroscope activity, use it herefor cutting slots as well.
6. Tape the foil over the upper 2 by 2-centime-ter hole in the box lid. The slot should bepositioned directly over the hole and alignedperpendicular to the cereal box front.
7. Copy the black measurement ruler on anoverhead projector transparency. Severalrulers are reproduced in the guide to reducethe number of transparencies needed.
8. Lightly tape the measurement ruler over therectangular window in the box lid. Whenyou look through the diffraction grating into
the box, you should be able to read the num-bers on the ruler with 400 on the right and700 on the left.
Adjusting and Calibrating the Spectroscope:1. Aim the slot end of the spectroscope towards
a fluorescent light. Look through the diffrac-tion grating. A continuous spectrum will beseen off to the side of the spectroscopefalling under or partially on top of the meas-urement ruler. If the spectrum appears as anarrow rainbow-colored line, remove thediffraction grating from the window androtate it 90 degrees. Tape it back in place.
2. While looking at the fluorescent light, checkthe position of the measurement ruler. Therewill be a bright green line in the green portion
National Aeronautics and Space Administration36
700 500600 400
700 500600 400
700 500600 400
700 500600 400
700 500600 400
* Space Based Atronomy.b/w 2/28/01 8:54 AM Page 36

of the spectrum. Adjust the position of theruler so that the line falls between 540 and550 on the ruler. Tape the ruler permanentlyin place. The spectroscope is calibrated.
Background:Unlike a prism, which disperses white light intothe rainbow colors through refraction, the diffrac-tion grating used in this spectroscope disperseswhite light through a process called interference.The grating used in this activity consists of a trans-parent piece of plastic with many thousands ofmicroscopic parallel grooves. Light passing
between these grooves is dispersed into its compo-nent wavelengths and appears as parallel bands ofcolor on the retina of the eye of the observer.
Spectroscopes are important tools for astronomy.They enable astronomers to analyze starlight byproviding a measure of the relative amounts ofred and blue light a star gives out. Knowing this,astronomers can determine the star’s tempera-ture. They also can deduce its chemical compo-sition, estimate its size, and even measure itsmotion away from or toward Earth (See theactivity Red Shift, Blue Shift.)
Space-Based AstronomyActivity Guide for Science, Mathematics, and Technology Education 37
Continuous spectrum
Bright-line spectrum
Absorption-line spectrum
Hot opaquesource
Hot transparentgas cloud
Hot opaquesource
Cooler transparentgas cloud
Basic Spectral Types
* Space Based Atronomy.b/w 2/28/01 8:54 AM Page 37

Starlight (photons) originates from the interiorof a star. There, pressures are enormous andnuclear fusion is triggered. Intense radiation isproduced as atoms, consisting of a surroundednucleus, collide with each other millions of timeseach second. The number of collisions dependsupon the temperature of the gas. The higher thetemperature, the greater the rate of collision.
Because of these collisions, many electrons areboosted to higher energy levels. This process iscalled excitation. The electrons spontaneouslydrop back to their original energy level. In doingso, they release energy as photons. This is whathappens to the filament of an electric light bulbor to an iron bar when it is heated in a furnace.As the temperature of the filament rises, it beginsto radiate reddish light. When the filamentbecomes much hotter, it radiates bluish light.Thus, the color it radiates is an indicator of thefilament’s temperature. Stars that radiate a greatamount of red light are much cooler than starsthat radiate a great amount of blue light. Stellarspectra therefore serve as star thermometers.
Excitation of electrons can also occur if theyabsorb a photon of the right wavelength. This iswhat happens when certain materials are exposedto ultraviolet light. These materials then releasenew photons at different wavelengths. This iscalled fluorescence.
One of the important applications of spectro-scopes is their use for identifying chemical ele-ments. Each element radiates light in specificwavelength combinations that are as distinctiveas fingerprints. Knowing the “spectral signa-tures” of each element enables astronomers toidentify the elements present in distant stars byanalyzing their spectra.
There are three kinds of spectra: continuous,absorption, and emission. The continuous spec-trum appears as a continuous band of color rang-ing from red to violet when observed through aspectroscope. An absorption spectrum occurswhen the light from a star passes through a cloudof gas, hydrogen for example, before reaching thespectroscope. As a result, the hydrogen atoms
absorb some wavelengths of light. This selectiveabsorption produces a spectrum that is a broadband of color interrupted by dark lines repre-senting certain wavelengths of light that wereabsorbed by the hydrogen cloud. Such a situa-tion occurs when a star is located inside orbehind a gas cloud or nebula. An emission spec-trum is observed when energy is absorbed by thegas atoms in a nebula and is re-radiated by thoseatoms at specific wavelengths. This spectrumconsists of bright lines against a black back-ground. The light from fluorescent tubes andneon lights produce emission spectra.
Stellar spectra allow astronomers to determinestar temperature, chemical composition, andmotion along the line of sight. This enablesastronomers to classify stars into spectral cate-gories and estimate their age, reconstruct theirhistories, and postulate their future evolution.When available, astronomers prefer stellar spec-tra collected by orbiting spacecraft over spectracollected by Earth-based telescopes since they arenot affected by atmospheric filtering and aretherefore more accurate. Included in the spectracollected by spacecraft are infrared, ultraviolet, x-ray, and gamma ray bands that simply do notreach ground-based spectroscopes.
Management and Tips:This spectroscope works better with a holo-graphic diffraction grating than with standarddiffraction gratings. Refer to the source forholographic gratings listed in the ProjectingSpectrums activity. The spectroscope can beused to analyze the wavelengths of light frommany light sources. Compare incandescentlight, fluorescent light, and sunlight. If you havespectrum tubes and a power supply (availablefrom science supply houses), examine the wave-lengths of light produced by the different gasesin the tubes. Many high school physics depart-ments have this equipment and it may be possi-ble to borrow it if your school does not. Use thespectroscope to examine neon signs and street-lights. Science supply houses sell spectrum flamekits consisting of various salts that are heated inthe flame of a Bunsen burner. These kits aremuch less expensive than spectrum tubes but are
National Aeronautics and Space Administration38
* Space Based Atronomy.b/w 2/28/01 8:54 AM Page 38
more difficult to work with because the flamesdo not last very long.
This spectroscope can also be used to study thespectrum of the Sun. Do not look directly at theSun with the spectroscope as this could damageyour eye. Instead, look at reflected sunlight suchas a white cloud or piece of white paper in sun-light (but not in a mirror!). When using thespectroscope in a very dark environment withspectrum tubes, it may be difficult to read themeasurement scale. A small flashlight aimed at awhite wall behind the spectrum power supplywill provide just enough light to read the ruler.
The first student page requires the use of spec-trum tubes and a power supply. Have studentsmake spectrographs of five different spectrumtubes. Randomly select one of the five tubes andask students to make a spectrograph of it. Tell thestudents to identify this unknown element fromtheir previous spectrographs. The second studentpage shows several typical bright line spectra fromspectrum tubes. This worksheet can be done with-out the tubes. It is important that students identi-fy more than one line from each element shown inthe spectrograph. Some elements have severallines in common. It is the entire combination oflines that makes the identification possible.
Work Sheet 2 answers:Spectrograph A: Hydrogen, HeliumSpectrograph B: Sodium, Barium, LithiumSpectrograph C: Calcium, Helium, Hydrogen,Oxygen, Krypton
Assessment:Examine student spectroscopes to see if the grat-ings are properly aligned and the measurementruler is calibrated. Collect the student sheets andcompare student answers.
Extensions:• Compare the solar spectrum at midday and
at sunset. Are there any differences? Caution:Be careful not to look directly at the Sun.
• What do spectra tell us about the nature ofstars and other objects in space?
• Show how temperature and radiation arerelated by connecting a clear light bulb to adimmer switch. Gradually increase the cur-rent passing through the filament by turn-ing up the dimmer. Observe the color andbrightness of the filament as the tempera-ture of the filament climbs with increasingcurrent.
Space-Based AstronomyActivity Guide for Science, Mathematics, and Technology Education 39
* Space Based Atronomy.b/w 2/28/01 8:54 AM Page 39

Student Work Sheet 2
Mystery SpectraName:______________
Use your spectroscope to examine the five elements displayed to you by yourteacher. Make sketches of the bright lines visible in the spaces below.
400500600700
Element Name:______________
400500600700
Element Name:______________
400500600700
Element Name:______________
400500600700
Element Name:______________
400500600700
Element Name:______________
400500600700
Element Name:______________
Use your spectroscope to examine the unknown element displayed to you byyour teacher. Make a sketch of the bright lines visible in the space below. Compare your unknown element to the spectra above. Identify the element.
* Space Based Atronomy.b/w 2/28/01 8:54 AM Page 40

400500600700
Calcium
Helium
Hydrogen
Lithium
Sodium
Krypton
Argon
Oxygen
Nitrogen
Barium
Spectra A Elements:____________________________________________
Spectra C Elements:____________________________________________
Spectra B Elements:____________________________________________
Student Work Sheet 2
Mystery SpectraName:______________
Identify the elements in spectra A, B, and C by comparing the bright lines presentwith the bright lines in the spectra for know elements.
* Space Based Atronomy.b/w 2/28/01 8:54 AM Page 41
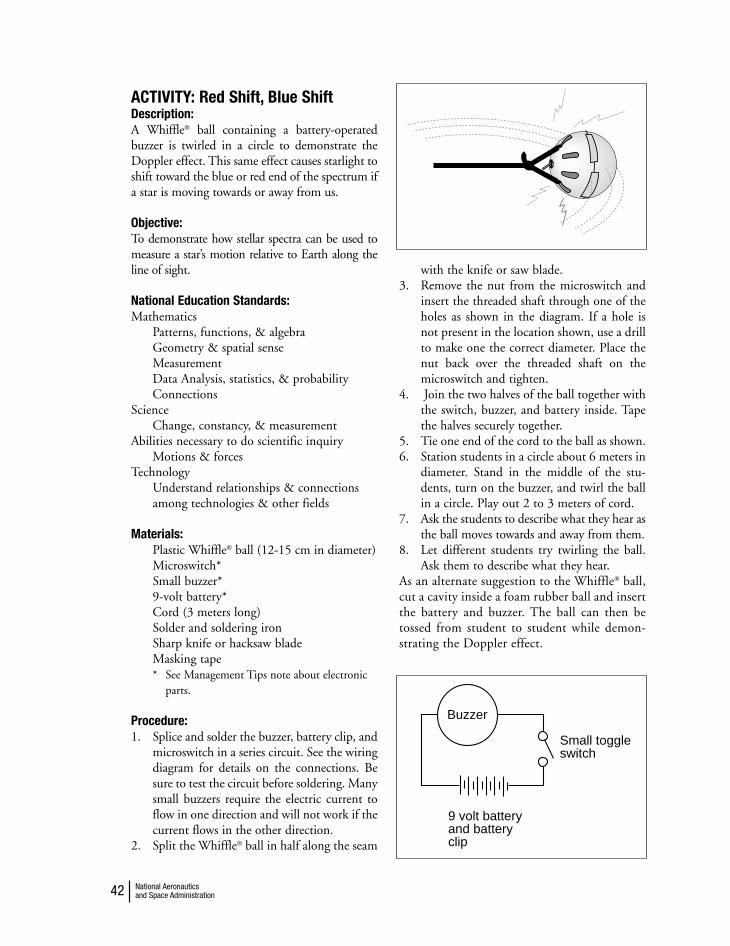
ACTIVITY: Red Shift, Blue ShiftDescription: A Whiffle® ball containing a battery-operatedbuzzer is twirled in a circle to demonstrate theDoppler effect. This same effect causes starlight toshift toward the blue or red end of the spectrum ifa star is moving towards or away from us.
Objective: To demonstrate how stellar spectra can be used tomeasure a star’s motion relative to Earth along theline of sight.
National Education Standards:Mathematics
Patterns, functions, & algebraGeometry & spatial senseMeasurementData Analysis, statistics, & probabilityConnections
ScienceChange, constancy, & measurement
Abilities necessary to do scientific inquiryMotions & forces
TechnologyUnderstand relationships & connectionsamong technologies & other fields
Materials: Plastic Whiffle® ball (12-15 cm in diameter) Microswitch*Small buzzer*9-volt battery*Cord (3 meters long)Solder and soldering ironSharp knife or hacksaw bladeMasking tape* See Management Tips note about electronic
parts.
Procedure:1. Splice and solder the buzzer, battery clip, and
microswitch in a series circuit. See the wiringdiagram for details on the connections. Besure to test the circuit before soldering. Manysmall buzzers require the electric current toflow in one direction and will not work if thecurrent flows in the other direction.
2. Split the Whiffle® ball in half along the seam
with the knife or saw blade.3. Remove the nut from the microswitch and
insert the threaded shaft through one of theholes as shown in the diagram. If a hole isnot present in the location shown, use a drillto make one the correct diameter. Place thenut back over the threaded shaft on themicroswitch and tighten.
4. Join the two halves of the ball together withthe switch, buzzer, and battery inside. Tapethe halves securely together.
5. Tie one end of the cord to the ball as shown. 6. Station students in a circle about 6 meters in
diameter. Stand in the middle of the stu-dents, turn on the buzzer, and twirl the ballin a circle. Play out 2 to 3 meters of cord.
7. Ask the students to describe what they hear asthe ball moves towards and away from them.
8. Let different students try twirling the ball.Ask them to describe what they hear.
As an alternate suggestion to the Whiffle® ball,cut a cavity inside a foam rubber ball and insertthe battery and buzzer. The ball can then betossed from student to student while demon-strating the Doppler effect.
National Aeronautics and Space Administration42
Buzzer
Small toggleswitch
9 volt batteryand batteryclip
* Space Based Atronomy.b/w 2/28/01 8:54 AM Page 42

Background:This is a demonstration of the phenomenon calledthe Doppler effect. It results from the motion of asource (star) relative to the observer and causes itsspectra to be shifted toward the red (going away) ortoward the blue (coming towards) end of the spectra.
Like light, sound travels in waves and thereforeprovides an excellent model of the wave behavior oflight. The number of waves reaching an observer inone second is called the frequency. For a givenspeed, frequency depends upon the length of thewave. Long waves have a lower frequency thanshort waves. As long as the distance between thesource of the waves and the observer remains con-stant, the frequency remains constant. However, ifthe distance between the observer and the source isincreasing, the frequency will decrease. If the dis-tance is decreasing, the frequency will increase.
Imagine that you are at a railroad crossing and atrain is approaching. The train is ringing a bell. Thesound waves coming from the bell are squeezed clos-er together than they would be if the train were still,because of the train’s movement in your direction.This squeezing of the waves increases the number ofwaves (increases the frequency) that reach your earevery second. But after the train’s engine passes thecrossing, the frequency diminishes and the pitchlowers. In effect, the sound waves are stretched apart
by the train’s movement in the opposite direction.As the observer, you perceive these frequencychanges as changes in the pitch of the sound. Thesound’s pitch is higher as the train approaches andlower as it travels away. The illustration below pro-vides a graphical representation of what happens.
Vr - radial velocity of the source with respect tothe observer.c - speed of light (3 x 10⁵ km/sec)∆λ the amount of the shift in nanometersλ0- unshifted wavelength in nanometers
For example, if a line in a spectrum should fall at600.0 nanometers but instead lies at 600.1, whatwould the radial velocity be?
The solution to this equation only tells us the veloc-ity of the source relative to the spectroscope.Whether the distance is increasing or decreasing isrevealed by the direction of the shift to the red orblue end of the visible spectrum. It does not tell,however, if one or both objects are moving relativeto some external reference point.
Space-Based AstronomyActivity Guide for Science, Mathematics, and Technology Education 43
∆λvc = λ
r
0
Higher Frequency(Blue Shift)
Lower Frequency(Red Shift)
=vr
0.1 nm x 3x10 km /sec5
600 nm= 50 km/sec
* Space Based Atronomy.b/w 2/28/01 8:54 AM Page 43

Management and Tips:The amount of pitch change as the buzzer twirls isdirectly related to how fast you twirl the buzzer.Twirling the buzzer faster means that the buzzerapproaches and travels away from the observerfaster. The person twirling the buzzer does not hearthe pitch change no matter how fast the buzzer istwirled; it remains the same distance from thetwirler. The observers standing away from thetwirler will hear the pitch change as the buzzer goestoward and away from the observer’s ear.
Note About Electronic Parts:The electronic parts for this device are not spec-ified exactly since there are many combinationsthat will work. Go to an electronic parts storeand select a buzzer, battery holder, battery, andswitch from what is available. Remember to pur-chase parts that will fit in a Whiffle® ball. Thestore clerk should be able to help you make aworkable selection if you need assistance. If pos-sible, test the buzzer before purchasing it todetermine if it is loud enough. Test the buzzerand battery before soldering connections. Thebuzzer may be polarized. Reverse the connec-tions if you do not hear a sound the first time.
Answers to Work Sheets:Sheet 11. The greater the difference in the pitch above
or below the normal pitch, the faster thevehicle is moving.
2. A – lower, B – higher, C – the same3. Stars moving toward us become slightly bluer.
Stars moving away become slightly redder.
4. Astronomers look at the spectrograph of astar and compare the position of bright linesin the spectrograph with where the linesshould be if the star were not moving at all.A shift to the red end of the spectrum indi-cates a star is moving away and a shifttoward the blue end indicates the star ismoving towards us. The amount of the shiftindicates relative velocity. The greater theshift, the greater the velocity.
5. No. The movement can be determined if thedistance to the star is known. How fast the starmoves against the background of more distantstars can be measured and the speed of the starcalculated.
Sheet 2Star 1 – 100 km/sec awayStar 2 – 260.7 km/sec toward Star 3 – 418.6 km/sec away
Assessment:Collect student worksheets and compare theanswers.
Extensions:• Can the red/blue shift technique be used for
objects other than stars? Can you tell whichway an emergency vehicle is traveling by thepitch of its siren?
• Transverse velocity is a motion that is per-pendicular to radial velocity. Can thismotion be detected by the Doppler effect?
• What has the Doppler effect toldastronomers about the size of the universe?
National Aeronautics and Space Administration44
400 500 600 700450 550 650 750
Same star Red Shifted (moving away from us)
Simplified Star Spectrum
Same star Blue Shifted (moving toward us)
* Space Based Atronomy.b/w 2/28/01 8:54 AM Page 44

1. How can you estimate the speed of a car that has passed you just by listening to the pitch of its whine?
2. Label the diagram below and tell if the observer perceives a pitch that is higher, lower, or just the same as the pitch heard by the driver.
3. How does the doppler shift affect the color of a star?
4. Describe how astronomers can use the doppler shift to determine if a star is moving toward us or away and how fast?
5. If a star is moving perpendicular to our line of sight, can you use the doppler shift to determine its speed? If not, how might you determine its speed?
Red Shift, Blue Shift
Name: ________________
A: _________
B: _________
C: _________
Student Work Sheet 1
* Space Based Atronomy.b/w 2/28/01 8:54 AM Page 45

vr = radial velocity
c = speed of light (3x10 km/sec or 300,000 km/sec)5
= radial velocity
∆λ = amount of shift in nanometers
λ0 = unshifted wavelength in nanometers
Name: ________________Use the equation below to determine the velocity of several starswhose spectra have shifted. Are the stars moving towardor away from us? Show your work on the back side of this page.
Star 1: The spectrum has shifted from 600.0 to 600.2 nm
Velocity = ________ km/sec
Moving toward or away from us? ____________
Star 2: The spectrum has shifted from 575.3 to 574.8 nm
Velocity = ________ km/sec
Moving toward or away from us? ____________
Star 3: The spectrum has shifted from 501.6 to 502.3 nm
Velocity = ________ km/sec
Moving toward or away from us? ____________
vr =λ0
c∆λ x
Student Work Sheet 2
Red Shift, Blue Shift
* Space Based Atronomy.b/w 2/28/01 8:54 AM Page 46

ACTIVITY: Wavelength and EnergyDescription: Shaking a rope permits students to feel the rela-tionship between wavelength, frequency, andenergy.
Objective: To demonstrate the relationship between wavefrequency and energy in the electromagneticspectrum.
National Education Standards:Mathematics
MeasurementData analysis, statistics, & probability
ScienceEvidence, models, & explanationChange, constancy, & measurementAbilities necessary to do scientific inquiryMotions & forcesTransfer of energy
TechnologyUnderstand relationships & connectionsamong technologies & other fields
Materials:Rope – 50-ft. length of cotton clotheslineTape measureStopwatch or clock with second hand
Procedure:1. Select two students to hold the rope. Have
each student stand in an aisle or in oppositecorners of the classroom so that the rope istaut between them.
2. While one end of the rope is held still, havethe other student shake the opposite end upand down at a moderate but steady rate.
3. Ask other students to observe the wave pat-terns created in the rope. Point out wave crestsand troughs. Ask your students to measure thewavelength and frequency of waves reaching theother student. The wavelength is the distancefrom wave crest to wave crest (or wave troughto wave trough). The wavelength can be meas-ured by having one student stand next to therope where a wave crest is repeatedly formedand having a second student stand where thenext crest is formed. Measure the distancebetween the students. Frequency is the num-ber of waves reaching the far end of the ropeeach second. Frequency can be estimated bycounting the number of times the studentshakes the rope each second.
4. Tell the student shaking the rope to shake itfaster. Again estimate the wavelength andfrequency.
5. Tell the student shaking the rope to shakethe rope as fast as he or she can. Again, esti-mate the wavelength and frequency.
6. Stop the demonstration and ask the studentshaking the rope if it is easier to produce lowfrequency (long wavelength) or high fre-quency (short wavelength) waves.
Background: This activity provides a graphic demonstrationof the relationship between energy and wave-length. The student shaking the rope will findthat creating many waves each second takesmuch more energy than producing only a fewwaves per second. High-frequency waves (shortwavelength) represent more energy than low-fre-quency (long wavelength) waves. Astronomersfind the relationship between wavelengths, fre-quency, and energy very useful. Radio waves
Space-Based AstronomyActivity Guide for Science, Mathematics, and Technology Education 47
* Space Based Atronomy.b/w 2/28/01 8:54 AM Page 47

from astronomical objects have very long wave-lengths and low frequencies. The waves are gen-erated by relatively quiet processes. Gamma rays,on the other end of the electromagnetic spec-trum, have very short wavelengths and high fre-quencies and represent the most violent process-es in space. The frequency of electromagneticenergy coming from an object tells astronomersmuch about how that object was created andwhat was happening at the time the energy wasemitted into space.
Management and Tips:The quality of the demonstrations can be great-ly enhanced by using a wave demonstrationspring. These springs are available from schoolscience supply catalogs for a few dollars. Thesprings are long coils and when stretched and
agitated, produce excellent waves. The increasedmass of the spring over the cotton clotheslineenhances the wave motions. If a strobe light isavailable, the appearance of the wave motionscan be enhanced by playing the light on themoving rope or spring and adjusting the strobefrequency. A Slinky® can also be used to demon-strate wave motion but it will work best if theSlinky® is placed on a long table and the springis shaken from side to side.
Permit other students to shake the rope so theycan feel, as well as see, the relationship betweenfrequency, wavelength, and energy.
Assessment:Make sure students understand the relationshipbetween frequency and wavelength and theamount of energy required to produce the waves.Collect and compare the student sheets.
Extensions:• Invite a hospital medical imaging specialist
to talk to the class about the use of high-fre-quency electromagnetic waves in medicaldiagnosis.
• Make an overhead projector transparency ofthe spectrum chart on page 00. Ask the stu-dents to relate energy to the electromagneticwavelengths depicted.
National Aeronautics and Space Administration48
E = hf
λ
λ is the wavelength in meters
E = hc
f is the frequency in hertz
Planck’s Constant = 6.63 x 10 J s.--34
* Space Based Atronomy.b/w 2/28/01 8:54 AM Page 48

ACTIVITY: Resonating AtmosphereDescription: Students construct a paper and tape device thatdemonstrates the property of resonance.
Objective: To show how atoms and molecules of gas inEarth’s atmosphere absorb electromagnetic ener-gy through resonance.
National Education Standards:Mathematics
MeasurementScience
Evidence, models, & explanationChange, constancy, & measurementMotion & forcesTransfer of energyStructure of the Earth system
Materials:Used lightweight file folderCardboard sheet about 20 by 30 cmMasking tapeScissors
Procedure:1. Cut two strips of paper from the file folder.
Each strip should be 3 cm wide. Make onestrip approximately 30 cm and the other 35 cm long.
2. Curl each strip into a cylinder and tape theends together.
3. Tape the cylinders to the cardboard as shownin the diagram.
4. Holding the cardboard along one of itsedges, slowly shake the rings back and forth.Observe the movements of the rings as yougradually increase the frequency (rate) of theshaking.
Background:All objects and materials have a natural frequen-cy at which they vibrate. With some materials,the vibration is easily observed. Many studentshave discovered that a plastic ruler extended overthe edge of a desk will vibrate when it is deflect-ed and released. If the extension of the ruler overthe desk edge is reduced, the frequency of the
vibration is increased. When students shake thecardboard and paper rings, the number of timesit moves back and forth in a second is the fre-quency. At first, the movement of the rings willbe erratic. However, by increasing or decreasingthe frequency of the shaking, the students willeventually match the natural frequency of one ofthe rings. That ring will begin bouncing back andforth in time with the shaking. The movement ofthe other ring will continue to be erratic until itsfrequency is matched. When that happens, thefirst ring’s movement will become erratic again.As the frequency of one of the rings is matched,it absorbs some of the energy the student isadding into the system through shaking. Theabsorption only occurs when the correct frequen-cy is reached. This effect is called resonance.Resonance takes place when energy of the rightfrequency (or multiples of the right frequency) isadded to an object causing it to vibrate.
When electromagnetic radiation enters Earth’satmosphere, certain wavelengths match the nat-ural frequencies of atoms and molecules of vari-ous atmospheric gases such as nitrogen andozone. When this happens, the energy in thosewavelengths is absorbed by those atoms or mole-cules, intercepting this energy before it reachesEarth’s surface. Wavelengths that do not matchthe natural frequencies of these atmospheric con-stituents pass through.
Resonance is important to astronomy for anoth-er reason. All starlight begins in the center of thestar as a product of nuclear fusion. As the radia-tion emerges from the photosphere or surface ofthe star, some wavelengths of radiation may bemissing. The missing components produce dark
Space-Based AstronomyActivity Guide for Science, Mathematics, and Technology Education 49
* Space Based Atronomy.b/w 2/28/01 8:54 AM Page 49
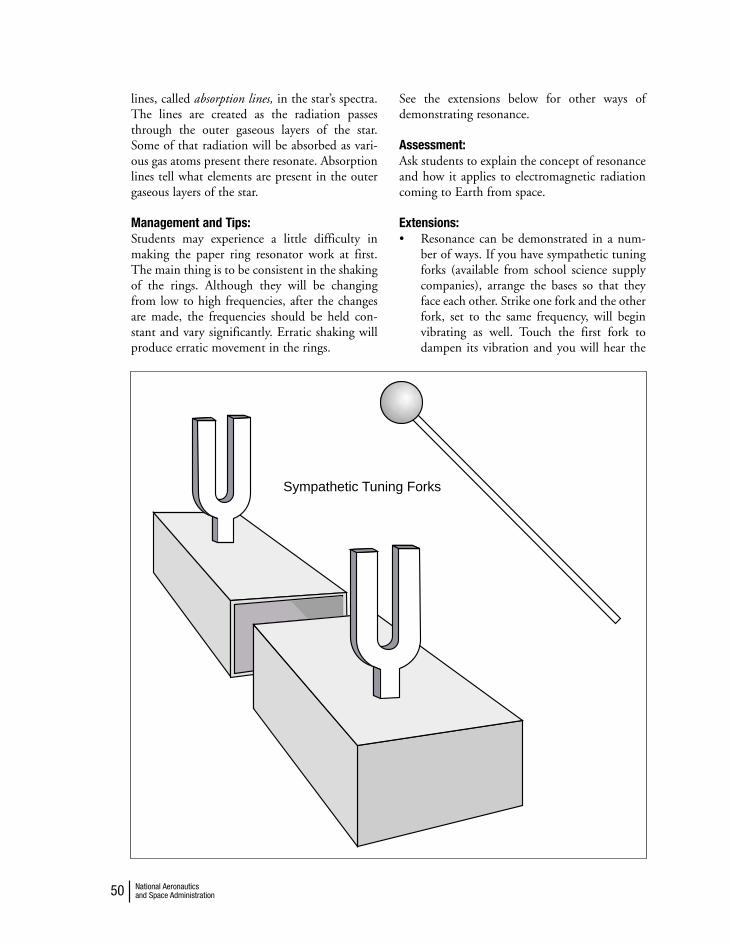
lines, called absorption lines, in the star’s spectra.The lines are created as the radiation passesthrough the outer gaseous layers of the star.Some of that radiation will be absorbed as vari-ous gas atoms present there resonate. Absorptionlines tell what elements are present in the outergaseous layers of the star.
Management and Tips:Students may experience a little difficulty inmaking the paper ring resonator work at first.The main thing is to be consistent in the shakingof the rings. Although they will be changingfrom low to high frequencies, after the changesare made, the frequencies should be held con-stant and vary significantly. Erratic shaking willproduce erratic movement in the rings.
See the extensions below for other ways ofdemonstrating resonance.
Assessment:Ask students to explain the concept of resonanceand how it applies to electromagnetic radiationcoming to Earth from space.
Extensions:• Resonance can be demonstrated in a num-
ber of ways. If you have sympathetic tuningforks (available from school science supplycompanies), arrange the bases so that theyface each other. Strike one fork and the otherfork, set to the same frequency, will beginvibrating as well. Touch the first fork todampen its vibration and you will hear the
National Aeronautics and Space Administration50
Sympathetic Tuning Forks
* Space Based Atronomy.b/w 2/28/01 8:54 AM Page 50

sound produced by the second fork eventhough you did not strike. The second forkwill absorb energy from the first fork andbegin vibrating as well.
• Construct a hacksaw blade resonator. Makea small handle of 1/4-inch plywood or 1/8-inch masonite. Tape two hacksaw blades tothe handle as shown. Use a 10-inch and a12-inch hacksaw blade. Add colored tape orpaint the ends of the blades to make themmore visible. Shake the handle from side toside. The handle should be held vertically sothat the flat side of the blades is perpendicu-lar to the movement. Like the paper ringdevice, the blades will begin moving whentheir natural frequencies are matched.
• Investigate the natural frequencies of variousobjects such as bells, wine goblets, and tun-ing forks.
• Why has the playing of the song “Louie,Louie” been banned at several college foot-ball stadiums? Why do marching soldierscrossing a bridge “break cadence?”
• What gas in Earth’s upper atmosphereblocks ultraviolet radiation? Why is thatimportant?
Space-Based AstronomyActivity Guide for Science, Mathematics, and Technology Education 51
Hacksaw BladeResonator
* Space Based Atronomy.b/w 2/28/01 8:54 AM Page 51
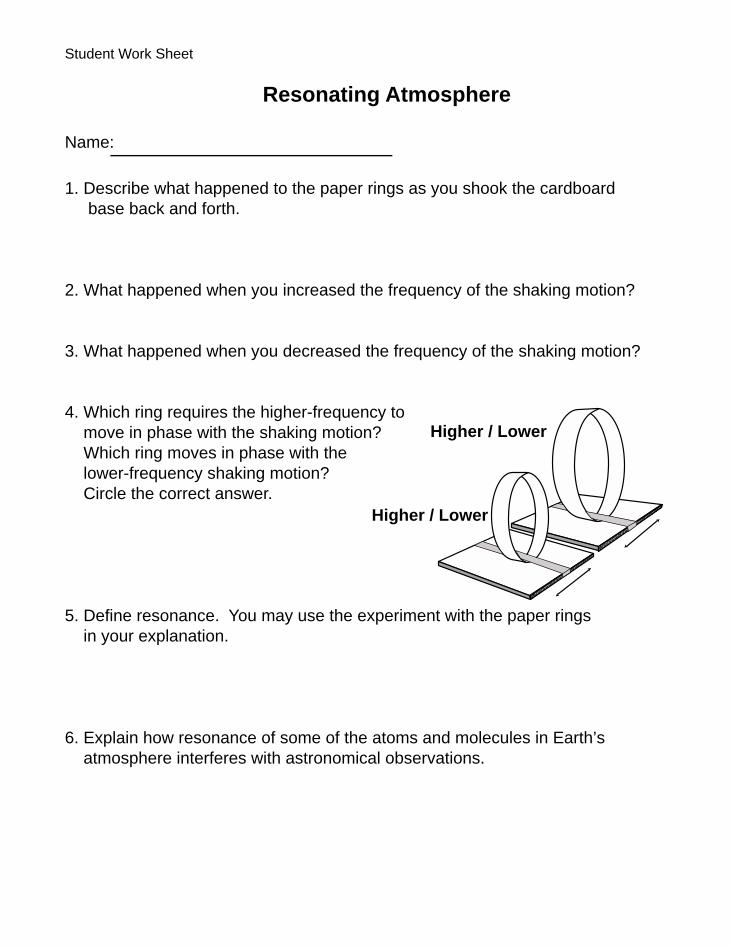
Student Work Sheet
Resonating Atmosphere
Name:
1. Describe what happened to the paper rings as you shook the cardboard base back and forth.
2. What happened when you increased the frequency of the shaking motion?
3. What happened when you decreased the frequency of the shaking motion?
4. Which ring requires the higher-frequency to move in phase with the shaking motion? Which ring moves in phase with the lower-frequency shaking motion? Circle the correct answer.
5. Define resonance. You may use the experiment with the paper rings in your explanation.
6. Explain how resonance of some of the atoms and molecules in Earth’s atmosphere interferes with astronomical observations.
Higher / Lower
Higher / Lower
* Space Based Atronomy.b/w 2/28/01 8:54 AM Page 52

Until the early 1600s, astronomers had onlytheir eyes and a collection of geometric devicesto observe the universe and measure locationsof stellar objects. They concentrated on themovements of planets and transient objectssuch as comets and meteors. However, whenGalileo Galilei used the newly invented tele-
scope to study the Moon, planets, and the Sun,our knowledge of the universe changed dramat-ically. He was able to observe moons circlingJupiter, craters on the Moon, phases of Venus,and spots on the Sun. Note: Galileo did hissolar observations by projecting light throughhis telescope on to a white surface—a technique
Space-Based AstronomyActivity Guide for Science, Mathematics, and Technology Education 53
UNIT 3 COLLECTING ELECTROMAGNETIC RADIATIONIntroduction
Except for rock samples brought back from the Moon by Apollo astronauts, cosmic ray
particles that reach the atmosphere, and meteorites and comet dust that fall to Earth, the
only information about objects in space comes to Earth in the form of electromagnetic
radiation. How astronomers collect this radiation determines what they learn from it. The
most basic collector is the human eye. The retina at the back of the eye is covered with
tiny antennae—called rods and cones—that resonate with incoming light. Resonance
with visible electromagnetic radiation stimulates nerve endings, which send messages
to the brain that are interpreted as visual images. Cones in the retina are sensitive to the
colors of the visible spectrum, while the rods are most sensitive to black and white.
* Space Based Atronomy.b/w 2/28/01 8:54 AM Page 53

that is very effective even today. Never lookdirectly at the Sun!
Galileo’s telescope and all optical telescopes thathave been constructed since are collectors ofelectromagnetic radiation. The objective or frontlens of Galileo’s telescope was only a few cen-timeters in diameter. Light rays falling on thatlens were bent and concentrated into a narrowbeam that emerged through a second lens,entered his eye, and landed on his retina. Thelens diameter was much larger than the diameterof the pupil of Galileo’s eye, so it collected muchmore light than Galileo’s unaided eye could gath-er. The telescope’s lenses magnified the images ofdistant objects three times.
Since Galileo’s time, many huge telescopes havebeen constructed. Most have employed big mir-rors as the light collector. The bigger the mirroror lens, the more light could be gathered and thefainter the source that the astronomer can detect.The famous 5-meter-diameter Hale Telescope onMt. Palomar is able to gather 640,000 times theamount of light a typical eye could receive. Theamount of light one telescope receives comparedto the human eye is its light gathering power(LGP). Much larger even than the HaleTelescope is the Keck Telescope that has an effec-tive diameter of 10 meters. Its light gatheringpower is two and a half million times that of thetypical eye. Although NASA’s Hubble SpaceTelescope, in orbit above Earth’s atmosphere, hasonly a LGP of 144,000, it has the advantage ofan unfiltered view of the universe. Furthermore,its sensitivity extends into infrared and ultravio-let wavelengths.
Once a telescope collects photons, the detectionmethod becomes important. Telescopes are col-lectors, not detectors. Like all other telescopes,the mirror of the Hubble Space Telescope is aphoton collector that gathers the photons to afocus so a detector can pick them up. It has sev-eral filters that move in front of the detector soimages can be made at specific wavelengths.
In the early days, astronomers recorded whatthey saw through telescopes by drawing pictures
and taking notes. When photography wasinvented, astronomers replaced their eyes withphotographic plates. A photographic plate issimilar to the film used in a modern cameraexcept that the emulsion was supported on glassplates instead of plastic. The emulsion collectedphotons to build images and spectra.Astronomers also employed the photo-multipliertube, an electronic device for counting photons.
The second half of this century saw the develop-ment of the Charge Coupled Device (CCD), acomputer-run system that collects photons on asmall computer chip. CCDs have now replacedthe photographic plate for most astronomicalobservations. If astronomers require spectra, theyinsert a spectrograph between the telescope andthe CCD. This arrangement provides digitalspectral data.
Driving each of these advances was the need forgreater sensitivity and accuracy of the data.Photographic plates, still used for wide-fieldstudies, collect up to about five percent of thephotons that fall on them. A CCD collects 85 to95 percent of the photons. Because CCDs aresmall and can only observe a small part of the skyat a time, they are especially suited for deep spaceobservations.
Because the entire electromagnetic spectrum rep-resents a broad range of wavelengths and ener-gies (see illustration on page 55), no one detec-tor can record all types of radiation. Antennas areused to collect radio and microwave energies. Tocollect very faint signals, astronomers use largeparabolic radio antennas that reflect incomingradiation to a focus much in the same way reflec-tor telescopes collect and concentrate light.Radio receivers at the focus convert the radiationinto electric currents that can be studied.
Sensitive solid state heat detectors measureinfrared radiation, higher in energy and shorterin wavelength than radio and microwave radia-tion. Mirrors in aircraft, balloons, and orbitingspacecraft can concentrate infrared radiationonto the detectors that work like CCDs in theinfrared range. Because infrared radiation is
National Aeronautics and Space Administration54
* Space Based Atronomy.b/w 2/28/01 8:54 AM Page 54

associated with heat, infrared detectors mustbe kept at very low temperatures lest the tele-scope’s own stored heat energy interferes withthe radiation coming from distant objects.
A grazing-incidence instrument consists of amirrored cone that directs high-energy radiationto detectors placed at the mirror’s apex. Differentmirror coatings are used to enhance the reflectiv-ity of the mirrors to specific wavelengths.
X-ray spacecraft, such as the Chandra X-rayObservatory, also use grazing-incidence mirrorsand solid state detectors while gamma ray space-craft use a detector of an entirely different kind.
The Compton Gamma-Ray Observatory haseight 1-meter-sized crystals of sodium iodidethat detect incoming gamma rays as the observa-tory orbits Earth. Sodium iodide is sensitive togamma rays but not to optical and radio wave-lengths. The big crystal is simply a detector ofphotons—it does not focus them.
Today, astronomers can choose to collect andcount photons, focus the photons to build up animage, or disperse the photons into their variouswavelengths. High-energy photons are usuallydetected with counting techniques. The otherwavelengths are detected with counting (pho-tometry), focusing methods (imaging), or dis-
Space-Based AstronomyActivity Guide for Science, Mathematics, and Technology Education 55
MICROWAVE INFARED VIS
IBL
E
UV X-RAYS GAMMA RAYS
RADIO
400
200
50
12
6
3
SEA LEVEL
104 2 -2 -4 -6 -8 -10 -12
1 10 101010 10 10 10
Wavelengths (meters)
Transparency of Earth’s Atmosphere
* Space Based Atronomy.b/w 2/28/01 8:54 AM Page 55

persion methods (spectroscopy). The particularinstrument or combination of instrumentsastronomers choose depends not only on thespectral region to be observed, but also on theobject under observation. Stars are point sourcesin the sky. Galaxies are not. So the astronomermust select a combination that provides goodstellar images or good galaxy images.
Another important property of astronomicalinstruments is resolution. This is the ability toseparate two closely-spaced objects from eachother. For example, a pair of automobile head-lights appears to be one bright light when seenin the distance along a straight highway. Closeup, the headlights resolve into two. Since tele-scopes, for example, have the effect of increas-ing the power of our vision, they improve ourresolution of distant objects as well. The designand diameter of astronomical instrumentsdetermines whether the resolution is high orlow. For stellar work, high resolution is impor-tant so the astronomer can study one star at a
time. For galaxy work, the individual stars in agalaxy may often not be as important as thewhole ensemble of stars.
Unit Goals• To demonstrate how electromagnetic radia-
tion can be collected and detected throughthe use of mirrors, lenses, and infrareddetectors.
• To illustrate how the use of large instru-ments for collecting electromagnetic radia-tion increases the quantity and quality ofdata collected.
Teaching StrategyBecause many of the wavelengths in the electro-magnetic spectrum are difficult or dangerous towork with, activities in this section concentrateon the visible spectrum, the near infrared, andradio wavelengths. Several of the activities involvelenses and mirrors. The Visible Light Collectoractivity provides many tips for obtaining a varietyof lenses and mirrors at little or no cost.
National Aeronautics and Space Administration56
* Space Based Atronomy.b/w 2/28/01 8:54 AM Page 56

ACTIVITY: Visible Light Collectors
(Telescopes)
Description: A simple refractor telescope is made from a mail-ing tube, Styrofoam tray, rubber cement, andsome lenses and the principle behind a reflectortelescope is demonstrated.
Objectives: To build a simple astronomical telescope from
two lenses and some tubes.To use a concave mirror to focus an image.
National Education Standards:Mathematics
MeasurementConnections
ScienceChange, constancy, & measurementAbilities of technological designUnderstanding about science & technologyHistory of science
TechnologyUnderstand relationships & connections
among technologies & other fieldsUnderstand cultural, social, economic, &
political effects of technologyUnderstand the influence of technology on
historyUnderstand, select, & use information &
communication technologies
Materials:Paper mailing tube (telescoping—1 insidetube and 1 outside tube)Styrofoam trays (1 thick and 1 thin)Lenses (1 large and 1 small. See note aboutlenses.)Metric rulerRazor blade knifeCutting surfaceMarker penRubber cementFine grade sandpaperConcave makeup mirrorElectric holiday candle or other small lightsource
Dark roomSheet of white paperAssorted convex lenses (See section onObtaining and Making Lenses andMirrors.)
Part 1 - Procedure for Making a RefractorTelescope:1. Cut a short segment from the end of the out-
side mailing tube. This circle will be used fortracing only. Place the circle from the largertube on the thick tray. Using a marker pen,trace the inside of the circle on to the bottomof the tray three times.
2. Lay the large (objective) lens in the center ofone of the three large circles. Trace the lens’outline on the circle.
3. Cut the circle with the lens tracing from thetray using the razor blade knife. Be sure toplace the Styrofoam on a safe cutting surface.Cut out the lens tracing, but when doing so,cut inside the line so that the hole is slightlysmaller than the diameter of the lens.
4. Before cutting out the other two large cir-cles, draw smaller circles inside themapproximately equal to 7/8ths of the diame-ter of the large lens. Cut out both circlesinside and out.
5. Coat both sides of the inner circle (the onethat holds the lens) with rubber cement andlet dry. Coat just one side each of the othertwo circles with cement and let dry. For abetter bond, coat again with glue and let dry.
6. Insert the lens into the inner circle. It will besnug. Press the other circles to either side. Be
Space-Based AstronomyActivity Guide for Science, Mathematics, and Technology Education 57
* Space Based Atronomy.b/w 2/28/01 8:54 AM Page 57

careful to align the circles properly. Becausethe outside circles have smaller diametersthan the lens, the lens is firmly held in place.You have completed the objective lensmounting assembly.
7. Repeat steps 1- 6 for the inside tube and usethe smaller lens for tracing. However,because the eyepiece lens is thinner than theobjective lens, cut the inner circle from thethin tray.
8. After both lens mounting assemblies arecomplete, lay the fine sandpaper on a flat sur-face and gradually sand the edges of eachcompleted lens mounting assembly to makethem smooth. Stop sanding when the assem-blies are just larger than the inside diameterof the corresponding tube. With a smallamount of effort, the assembly will compressslightly and slip inside the tube. (Do notinsert them yet.) Friction will hold them inplace. If the lens assemblies get too loose,they can be held firmly with glue or tape.
9. Hold the two lens assemblies up and lookthrough the lenses. Adjust their distancesapart and the distance to your eye until animage comes into focus. Look at how far thetwo lenses are from each other. Cut a seg-ment from the outside and the inside tubethat together equal two times the distanceyou just determined when holding up thelenses. Use the sandpaper to smooth anyrough edges on the tubes after cutting.
10. Carefully, so as not to smudge the lenses,insert the large lens assembly into one endof the outside tube and the eyepiece lensassembly into the end of the inside tube.Slip the inside tube into the outside tubeso that the lenses are at opposite ends.Look through the eyepiece towards somedistant object and slide the small tube inand out of the large tube until the imagecomes into focus.
11. (Optional) Decorate the outside tube withmarker pens or glue a picture to it.
National Aeronautics and Space Administration58
Diverging Lens
Diverging Mirror
Lenses and Mirrors
Double Convex Lens
Double Concave Lens
Plano Convex Lens
Concave Mirror
Convex Mirror
Converging Mirror
Converging Lens
Converging MirrorConverging Lens
* Space Based Atronomy.b/w 2/28/01 8:54 AM Page 58

Background:The completed telescope is known as a refractor.Refractor means that light passing through theobjective lens is bent (refracted) before reachingthe eyepiece. Passing through the eyepiece, thelight is refracted again.
This refraction inverts the image. To have anupright image, an additional correcting lens orprism is placed in the optical path. Astronomersrarely care if images are right-side-up or up-side-down. A star looks the same regardless of orien-tation. However, correcting images requires theuse of extra optics that diminish the amount oflight collected. Astronomers would rather havebright, clear images than right-side-up images.Furthermore, images can be corrected by invert-ing and reversing photographic negatives or cor-recting the image in a computer.
Management and Tips: Refer to the end of this activity for ideas on howto obtain suitable lenses. PVC plumbing pipescan be used for the telescoping tubes. Purchasetube cutoffs of different diameters at a hardwarestore. Make sure the cutting of the outside circlesin the Styrofoam is precise. A circle cut too smallwill fall through the tube. If students do cut cir-cles too small, the diameter of the circles can beincreased by adding one or more layers of mask-ing tape.
Part 2 - Procedure for Demonstrating theReflector Telescope Principle:1. Light the electric candle in a darkened room.2. Bring the concave makeup mirror near the
candle flame and tilt and turn it so thatreflected light from the lamp focuses on asheet of white paper.
3. Experiment with different lenses to find onesuitable for turning the makeup mirror intoa simple reflector telescope. Hold the lensnear your eye and move it until the reflectedlight from the mirror comes into focus.
Background:Many reflecting telescopes gather light from dis-tant objects with a large concave mirror thatdirects the light toward a secondary mirror which
then focuses the light onto a detector. The con-cave mirror used in this demonstration shows howa concave mirror can concentrate light to form arecognizable image. The image produced with amakeup mirror will not be well focused becausesuch mirrors are inexpensively produced frommolded glass rather than from carefully shapedand polished glass. Furthermore, proper focusingrequires that the mirror be precisely shaped in aparabolic curve.
Reflecting telescope mirrors can be made verylarge and this increases the amount of light theycan capture. Refer to the telescope performanceactivity that follows for information on lightgathering power. Small telescopes can only detectbright or nearby stars. Large telescopes (over 4meters in diameter) can detect objects several bil-lion times fainter than the brightest stars visibleto our naked eyes.
Large astronomical telescopes do not employeyepieces. Rather, light falls on photographicfilm, photometers, or charged coupled devices(CCDs). This demonstration shows how animage forms on a flat surface. Covering the
Space-Based AstronomyActivity Guide for Science, Mathematics, and Technology Education 59
Primary MirrorSecondary Mirror
Light Baffles
Focal Plane
Hubble Space Telescope Optics
* Space Based Atronomy.b/w 2/28/01 8:54 AM Page 59

National Aeronautics and Space Administration60
* Space Based Atronomy.b/w 2/28/01 8:54 AM Page 60

surface with photographic film will produce acrude picture. Although astronomers have con-verted to CCDs for most observations, pho-tography is still employed for some applica-tions. Rather than film, astronomers usuallyprefer photographic emulsions on sheets ofglass, which are more stable over time.
Assessment:Examine the telescope for construction tech-nique. Are the lenses parallel or canted to eachother? Can the telescope focus on an image? Usethe telescopes made here as samples for the tele-scope performance activities that follow.
Extensions:• Bring commercially-made telescopes, spy-
glasses, and binoculars into the classroom.Compare magnification, resolution, andlight gathering power to that of the telescopemade here. Learn how these optical instru-ments function.
• Invite local amateur astronomy clubs to host“star parties” for your students.
• Why are the largest astronomical telescopesmade with big objective mirrors rather thanbig objective lenses?
• Find out how different kinds of reflecting tel-escopes such as the Newtonian, Cassegrain,and Coude work.
Obtaining and Making Lenses and Mirrors:An amazing collection of lenses and mirrors canbe obtained at little or no cost through creativescrounging. Ask an optometrist or eyewear storeif they will save damaged eyeglass lenses for you.Although not of a quality useful for eyewear,these lenses are very suitable for classroom exper-imentation. Bifocals and trifocals make fascinat-ing magnifying lenses. Fill a spherical glass flaskwith water to make a lens. Water-filled cylindri-cal glass or plastic bottles make magnifiers thatmagnify in one direction only. Aluminized mylarplastic stretched across a wooden frame makes agood front surface plane mirror. A Plexiglas mir-ror can be bent to make a “funhouse” mirror.Low-reflectivity plane mirrors can be made froma sheet glass backed with black paper. Ask theperson in charge of audiovisual equipment at theschool to save the lenses from any broken or oldprojectors that are being discarded. Projector andcamera lenses are actually made up of many lens-es sandwiched together. Dismantle the lensmounts to obtain several usable lenses. Checkrummage sales and flea markets for binocularsand old camera lenses. A wide assortment oflenses and mirrors are also available for sale fromschool science supply catalogs and from the fol-lowing organization:
Optical Society of America2010 Massachusetts Avenue, NWWashington, D.C. 20036(202) 223-8130
Space-Based AstronomyActivity Guide for Science, Mathematics, and Technology Education 61
* Space Based Atronomy.b/w 2/28/01 8:54 AM Page 61

ACTIVITY: Telescope PerformanceDescription:Students compare and calculate the light gather-ing power of lenses.
Objective: To determine the ability of various lenses andmirrors to gather light.
National Education Standards:Mathematics
Patterns, functions, & algebraGeometry & spatial senseMeasurementProblem solvingConnections
ScienceChange, constancy, & measurementAbilities necessary to do scientific inquiryUnderstandings about science & technology
TechnologyUnderstand characteristics & scope of tech-
nologyUnderstand, select, & use information &
communication technologies
Materials:Gray circles on page 00White paper punchouts from a three-hole
paper punchWhite paperDouble convex lenses of different diametersMetric rulerSmall telescope from previous activityBinoculars (optional)Overhead projectorTransparency copy of master on page 00Resolving Power chart on page 00Astronomical telescope (optional)
Procedure – Light Gathering Power:1. Have students examine several different
double convex lenses. 2. Compare the ability of each lens to gather
light by focusing the light from overhead fix-tures onto a piece of white paper. Which lensproduces a brighter image? Be sure to holdthe lenses parallel to the paper.
3. Compare the light gathering power of five
imaginary lenses (gray circles) by placingsmall white paper circles (punchouts) oneach. The number of punchouts representsthe number of photons collected at amoment of time. Students may draw theirown circles with compasses for this step.
4. What is the mathematical relationshipbetween the number of punchouts that a cir-cle can hold and the circle’s diameter? Howdid you arrive at this conclusion?
Procedure – Magnification:1. Make an overhead transparency of the grid on
page 68. Project the transparency on a screenso that it is as large as possible and positionthe projector to reduce the “keystone” effect.
2. Roll a paper tube the same diameter as thefront end of the telescope or binocular lensyou are using. The length of the tube shouldbe the same length as the telescope or binoc-ular. Because binoculars use prisms to reducetheir size (see illustration), make the tube twotimes longer than the distance between thefront and rear lenses of the binoculars.
3. Have students stand in the middle or rear ofthe room. They should stand at a distancethat will permit the telescope or binoculars tofocus on the screen. Many optical instru-ments have minimum focal distances.
4. Looking first through the tube, have studentscount the number of squares they can see at atime from one side of the tube to the other.
5. Using the binoculars (one eye only) or the tel-escope, have students repeat the counting ofsquares.
6. The ratio of the number of squares seen in thetube versus the number seen in the binocularsis a rough approximation of the magnificationpower of the instrument. For example, if thestudent can see three squares with the tubeand only one with the telescope, the magnifi-cation power of the telescope is approximately3 because a single square spanned the tele-scope instead of three squares with a tube of asimilar diameter and length.
Procedure – Resolving Power:1. Tape page 63 to the front board.2. Have students stand near the rear of the room
National Aeronautics and Space Administration62
* Space Based Atronomy.b/w 2/28/01 8:54 AM Page 62

Space-Based AstronomyActivity Guide for Science, Mathematics, and Technology Education 63
1
2
48
16
* Space Based Atronomy.b/w 2/28/01 8:54 AM Page 63

National Aeronautics and Space Administration64
Magnification Grid
* Space Based Atronomy.b/w 2/28/01 8:54 AM Page 64

and look at the dots. Ask them to look at thesquares and state how many dots they see.
3. Have students repeat the observation withthe aid of a telescope or binoculars.
Background:Light Gathering Power – In a dark room, thepupil of the eye gets bigger to collect more of thedim light. In bright sunlight, the pupil getssmaller so that too much light is not let into theeye. A telescope is a device that effectively makesthe pupil as large as the objective lens or mirror.
A telescope with a larger objective lens (frontlens) or objective mirror collects and concen-trates more light than a telescope with a smallerlens or mirror. Therefore, the larger telescope hasa greater light gathering power than the smallerone. The mathematical relationship that express-es light gathering power (LGP) follows:
In this equation, A represents the larger telescopeand B the smaller telescope or human eye. Thediameter of the objective lens or mirror for each tel-escope is represented by D. Solving this equationyields how much greater the light gathering power(LGP) of the bigger telescope is over the smallerone. For example, if the diameter of the large tele-scope is 100 cm and the smaller telescope is 10 cm,the light gathering power of the larger telescope willbe 100 times greater than that of the smaller scope.
Light gathering power is an important measure ofthe potential performance of a telescope. If anastronomer is studying faint objects, the telescope
used must have sufficient light gathering powerto collect enough light to make those objects vis-ible. Even with the very largest telescopes, somedistant space objects appear so faint that the onlyway they become visible is through long-exposurephotography or by using CCDs. A photographicplate at the focus of a telescope may require sev-eral hours of exposure before enough light col-lects to form an image for an astronomer tostudy. Unfortunately, very large ground-based tel-escopes also detect extremely faint atmosphericglow, which interferes with the image. Not hav-ing to look through the atmosphere to see faintobjects is one of the advantages space-based tele-scopes have over ground-based instruments.
Magnification – Magnification is often misunder-stood as a measure of a telescope’s performance. Onewould think that a telescope with a higher magnifi-cation power would perform better than a telescopewith a lower power. This is not necessarily so. A tel-escope with a high magnification power but a lowlight gathering power will produce highly magnifiedimages that are too faint to see. A rule of thumb inobtaining a telescope is that the magnification of thetelescope should be no greater than 25 times thediameter of the large (front) lens in centimeters. Forexample, a telescope with a front lens with a diame-ter of 5 centimeters should have a maximum mag-nification of no more than 125. Anything beyondthat will produce a very poor view.
The magnification of a telescope is calculated bydividing the focal length of the front lens by thefocal length of the eyepiece. The focal length isthe distance from the center of the lens to thefocal point. With astronomical telescopes, thefocal lengths of the various lenses are marked onthe housing.
Space-Based AstronomyActivity Guide for Science, Mathematics, and Technology Education 65
=D
DA
B
2
LGPA
LGPB
=100 cm
10 cmA
B
2
=10,000
100= 100
LGPA
LGPB
=100 cm
10 cmA
B
2
=10,000
100= 100
LGPA
LGPB
M =F0
Fe
α =11.6
D
* Space Based Atronomy.b/w 2/28/01 8:54 AM Page 65

Resolving Power – With telescopes as powerfulas the Hubble Space Telescope, resolving powerbecomes important. Resolving power is theability of a telescope to separate two closelyspaced objects. For example, a bright star to thenaked eye might actually be two closely-spacedstars in a telescope. Resolving power is meas-ured in arc seconds. An arc second is 1:3,600thof a degree.
Management and Tips:In this light gathering power activity, youngerstudents can use larger objects such as pennies,washers, or poker chips in place of the paperpunchouts. Discs can be eliminated entirely bydrawing the circles directly on graph paper andcounting the squares to estimate light gatheringpower of different sized lenses and mirrors.When students notice that the punchouts do notentirely cover the circles, ask them what theyshould do to compensate for the leftover space.
For the activity on magnification and resolvingpower, use the small telescope constructed in theprevious activity. Because of their minimum focaldistance, astronomical telescopes will not workfor this activity. A toy spyglass and spotter scopesshould work.
Assessment:Collect student sheets and compare answers.
Student Work Sheet Answers:1A. The ratio of the amount of light a telescope
can gather compared to the human eye.
1B. The ability of a telescope to make distantobjects appear larger.
1C. The ability of a tele-scope to distinguishbetween two closelyspaced objects.
2. 100
3. 100
4. 0.058 arc seconds
Extensions:• Compare the light gathering power of the
various lenses you collected with the humaneye. Have students measure the diameters, incentimeters, of each lens. Hold a small plas-tic ruler in front of each student’s eye in theclass and derive an average pupil diameterfor all students. Be careful not to touch eyeswith the ruler. If you have an astronomicaltelescope, determine its light gatheringpower over the unaided human eye.
• If an astronomical telescope is available,have students calculate the actual magnifi-cation power of the telescope with its vari-ous lenses.
• Have students calculate the focal length of thelenses used in the light gathering power por-tion of this activity. The students should focuslight from overhead fixtures on the desk topand measure how far above the desk the lensis. This is the focal length.
National Aeronautics and Space Administration66
objective Lens eyepiece
focal length focal length
focal point
Optical Path for Binoculars
objective
eyepieceprisms
* Space Based Atronomy.b/w 2/28/01 8:54 AM Page 66

Space-Based AstronomyActivity Guide for Science, Mathematics, and Technology Education 67
1
2
3
4
5
6
7
8
9
10
Resolution Chart
* Space Based Atronomy.b/w 2/28/01 8:54 AM Page 67

Telescope Performance
Name: _________________________
1. What do each of these terms mean?
A. Light gathering power
B. Magnification
C. Resolving power
2. A telescope has a diameter of 10 centimeters. The iris of your eye has a diameter 1 centimeter. What is the light gathering power of the telescope compared to your eye. Show your work below.
3. Explain how to measure the focal length of a lens.
4. A telescope has an objective (front) lens with a focal length of 1,000 mm and an eyepiece with a focal length of 10 mm. What is the magnification power of the telescope? Show your work below.
5. A telescope has an objective lens with a diameter of 200 centimeters. What is the telescope’s resolving power? Show your work below.
Student Work Sheet
* Space Based Atronomy.b/w 2/28/01 8:54 AM Page 68

ACTIVITY: Liquid Crystal IR DetectorDescription: Students simulate the detection of infrared radi-ation using a liquid crystal sheet.
Objective: To experiment with one method of detectinginfrared radiation.
National Education Standards:Science
Evidence, models, & explanationProperties & changes of properties in matterTransfer of energyUnderstandings about science & technology
TechnologyUnderstand relationships & connections
among technologies & other fieldsUnderstand, select, & use information &
communication technologies
Materials:Liquid crystal sheet (available at museums,
nature stores, and science supply catalogs)Table top
Procedure:1. Have a student touch his or her fingertips on
a tabletop for 30 seconds. Make sure the stu-dent has warm hands.
2. While handling the liquid crystal sheet onlyby its edges, place it where the fingertipstouched the table. Observe what happensover the next several seconds.
Background:Infrared telescopes have a detector sensitive toinfrared light. The telescope is placed as highup in the atmosphere as possible on a moun-taintop, in an aircraft or balloon, or flown inspace because water vapor in the atmosphereabsorbs some of the infrared radiation fromspace. The human eye is not sensitive toinfrared light, but our bodies are. We senseinfrared radiation as heat. Because of this asso-ciation with heat, telescopes and infrareddetectors must be kept as cool as possible. Anyheat from the surroundings will create lots ofextra infrared signals that interfere with the
real signal from space. Astronomers use cryo-gens such as liquid nitrogen, liquid helium, ordry ice to cool infrared instruments.
This activity uses a liquid crystal detector thatsenses heat. Also known as cholesteric liquidcrystals, the liquid inside the sheet exhibitsdramatic changes in colors when exposed toslight differences in temperature within therange of 25 to 32 degrees Celsius. The sheetdetects the heat associated with infrared rays.
In the case of an infrared telescope in space, theenergy is detected directly by instruments sensi-tive to infrared radiation. Usually, the data isrecorded on computers and transmitted to Earthas a radio signal. Ground-based computersreassemble the image of the objects that createdthe radiation.
Management and Tips:Liquid crystal sheets come in many forms. Thebest sheets for this activity are large enough tofit an entire hand. These sheets also come aspostcards and as thermometers. You may beable to find a forehead thermometer made of astrip of liquid crystals.
Do not allow the sheet to come into direct con-tact with very hot materials as they may damagethe sheet. It is important that the student hashands warm enough to leave a heat signature onthe tabletop. Also, it is important that the table-top be relatively cool to start with. If the table isalready warm, the image of the fingertips will bemasked by the tabletop’s heat. This is similar tothe situation that would occur inside a spacecraftthat is not cooled. Stray infrared signals from the
Space-Based AstronomyActivity Guide for Science, Mathematics, and Technology Education 69
* Space Based Atronomy.b/w 2/28/01 8:54 AM Page 69

spacecraft would cloud the infrared image fromdistance objects.
Assessment: Ask your students why it is important to keepinfrared telescopes very cool for accurate obser-vations.
Extensions:• How was infrared radiation discovered?• Why do infrared detectors have to be kept
cold?• Learn about cholesteric liquid crystals. An
Austrian botanist Freidrich Reinitfer discov-ered them in 1888.
• Obtain an infrared thermometer for measur-ing temperatures from a distance. Such ther-mometers are available from science supplycompanies. Use the thermometer to measurethe temperature of various objects such as acandle flame, beaker of warm water, orground surfaces in and out of the sunlight.
• Invite a thermal scanning company todemonstrate their equipment to your stu-dents. These companies use infrared scan-ners to form infrared images of homes to iso-late areas of heat loss.
National Aeronautics and Space Administration70
* Space Based Atronomy.b/w 2/28/01 8:54 AM Page 70

Data collection, transmission, and analysis are ofprimary importance to astronomers. The develop-ment of photomultiplier tubes and charged cou-pled devices (CCDs) provides astronomers with anefficient means of collecting data in a digital form,
transmitting it via radio, and analyzing it by com-puter processing. CCDs, for example, convert pho-tons falling on their light sensitive elements intoelectric signals that are assigned numeric values rep-resenting their strength. Spacecraft subsystems con-
Space-Based AstronomyActivity Guide for Science, Mathematics, and Technology Education 71
UNIT 4 DOWN TO EARTH
Introduction
Although astronomers who work with ground-based telescopes have to deal with bad
weather and atmospheric filtering, they do have one advantage over astronomers work-
ing with instruments in space. The ground-based astronomers can work directly with
their instruments.That means that they can constantly check and adjust their instruments
first-hand. Astronomers working with satellite-based instruments must do everything
remotely. With the exception of telescopes mounted in the Space Shuttle’s payload bay,
astronomers can only interact with their instruments via radio transmissions.That means
that the instruments have to be mounted on a satellite that provides radio receivers and
transmitters, electric power, pointing control, data storage, and a variety of computer-run
subsystems.
* Space Based Atronomy.b/w 2/28/01 8:54 AM Page 71

vert numeric values into a data stream of binarynumbers that are transmitted to Earth. Oncereceived, computers reconvert the data stream tothe original numbers that can be processed intoimages or spectra.
If the satellite is geostationary, these data may betransmitted continuously to ground receiving sta-tions consisting of one or more radio antennasand support equipment. Geostationary satellitesorbit in an easterly direction over Earth’s equatorat an elevation of approximately 40,000 kilome-ters. They orbit Earth in one day, the same time ittakes Earth to rotate, so the satellite remains overthe same location on Earth at all times.
Satellites at other altitudes and orbital paths donot stay above one point on Earth. As a result,they remain visible to a particular ground stationfor a short time and then move out of range. Thisrequires many widely spaced ground stations tocollect the satellite’s data. In spite of this, thesatellite still spends much of its time over parts ofEarth where no stations exist (oceans, polarregions, etc.). For this reason, one of the subsys-tems on astronomical satellites are tape recordersthat store data until they can transmit it toground stations.
In the mid-1980’s, NASA began deploying theTracking and Data Relay Satellite System(TDRSS) into geostationary orbit. The purposeof this system is to relay data to ground stations.Because of their high orbits and their widely
spaced station points over Earth’s equator, theTDRSS satellites serve as relay points for lowersatellites and the Space Shuttle. The system pro-vides nearly continuous contact with spacecraftas they orbit Earth. TDRSS satellites relay datato a receiver at White Sands, New Mexico. Fromthere, the data travel via telephone lines, fiberoptic cable, or commercial communicationssatellites to its destination. Most astrophysicsdata travels from White Sands to the NASAGoddard Space Flight Center in Maryland fordistribution to scientists.
Unit Goal• To demonstrate how astronomical satellites
use technology to collect optical data, trans-mit that data to Earth, and reassemble it intoimages.
ApproachThe activities in this unit demonstrate the imag-ing process of astronomical satellites such as theHubble Space Telescope. Use the Magic Wandand Persistence of Vision activities together or asalternates. The Magic Wand activity shows howimages can be divided and reassembled. TheColor activity shows how astronomy satellitescollect color data and how that data can bereassembled on the ground. The Binary Numberand Paint by the Numbers activities familiarizestudents with the process of data transmission toEarth and its re-assembly into images.
National Aeronautics and Space Administration72
* Space Based Atronomy.b/w 2/28/01 8:54 AM Page 72

ACTIVITY: Magic WandDescription: A recognizable image from a slide projectorappears while a white rod moves rapidly acrossthe projector’s beam.
Objective: To demonstrate how an image falling on a CCDarray is divided into individual pieces.
National Education Standards:Science
Evidence, models, & explanationMotions & forcesUnderstandings about science & technology
TechnologyUnderstand relationships & connections
among technologies & other fieldsUnderstand, select, & use information &
communication technologies
Materials:Slide projectorColor slide of clearly defined object such as
Saturn, a building, etc.1/2-inch dowel, 3 feet long Sheet of white paperWhite paint (flat finish)Dark room
Procedure:1. Paint the dowel white and permit it to dry.
(A piece of 3/4-inch PVC water pipe from ahardware store can substitute for the doweland white paint, and so can a painted meterstick.)
2. Set up the slide projector in the back ofthe classroom and focus the image of theslide at a distance of about 4 meters awayfrom the projector. Hold the sheet ofpaper in the beam at the proper distancefor easy focusing. Be sure the focus pointyou select is in the middle of the room andnot near a wall.
3. Arrange the students between the focuspoint and the projector. Darken the room.Hold the dowel in one hand and slowlymove it up and down through the projectorbeam at the focal point. Ask the students to
try to identify the image that appears on thedowel.
4. Gradually, increase the speed of the dowel’smovement.
5. When the dowel moves very fast, the imagebecomes clear.
Background:Because astronomy spacecraft operate in spacefor many years, the data they collect cannot berecorded on camera film. There is simply noeasy way to deliver the film to Earth for pro-cessing and to resupply the spacecraft with freshfilm. Rather, the satellite instruments collectlight from objects and divide it into discrete bitsof information and radio them to Earth as aseries of binary numbers. This activity demon-strates how images can be divided into manyparts and then reassembled into a recognizablepicture. By slowly moving the dowel across theslide projector’s beam, small fragments of theimage are captured and reflected (“radioed”)towards the students. Because more and morefragments are sent as the dowel is moved, theimage quickly becomes confused in the student’sminds. However, as the rod is moved more rap-
Space-Based AstronomyActivity Guide for Science, Mathematics, and Technology Education 73
Look through this end
* Space Based Atronomy.b/w 2/28/01 8:54 AM Page 73

idly, an important property of the eye and brainconnection comes into play; light images aremomentarily retained. This property is calledpersistence of vision. As the dowel’s movementincreases, single lines of the image remain justlong enough to combine with the others to forma recognizable image. In this manner, the rapid-ly moving rod simulates the CCD and theeye/brain interaction simulates the final imagingcomputer that receives the radioed data andreassembles it for use.
Management and Tips:By setting up the projector so that its projectedimage is focused in the middle of the room, thelight from the image that falls on the far wall willbe out of focus. This will make it more difficultfor students to recognize the image until thedowel is passed through the light beam. Be sureto point out that the rod sends (“radios”) a frag-ment of the entire image. When the rod ismoved, another image fragment is received.Challenge your students to memorize each frag-ment as they receive it. The fragments will bequickly forgotten as new fragments are added. Itis only when the rod is moved very fast that theywill be able to recognize the image. However, ifthe fragments were received by a computer in adigital form, each fragment would be recordedand an image would be built up at any speed.Relate this activity to the Paint by the Numbersactivity on pages 00-00.
Assessment: Ask students to explain the imaging process as itis demonstrated here and use examples of imagesin other applications where the images consist ofsmall parts that combine to make a whole.
Extensions:• How do television studios create and trans-
mit pictures to home receivers?• How does a CCD work?• Project some slides. Magnify them as much as
possible on a projection screen to see how thecomplete image consists of many discrete parts.
• Construct a persistence of vision tube.Close off the end of a cardboard tubeexcept for a narrow slit. While lookingthrough the open end of the tube, wave thetube back and forth. A recognizable imagewill form at the other end of the tube. Usethe tube to examine fluorescent lights.Why do slightly darker bands appearacross the lights? Hint: Fluorescent lightsdo not remain on continuously. The lightturns on and off with the cycling of ACcurrent. Will using the tube to view anincandescent light have the same effect?Use the tube to examine the picture on atelevision screen. Why is the TV picturereduced to lines? Hint: Television picturesconsist of scan lines.
• A simpler version of the persistence of visiontube can be made with a 10 by 10-centime-ter square of black construction paper. Foldthe paper in half. Using scissors, cut a nar-row slit from the middle of the fold. Openthe square up and quickly pass the slit acrossone eye while looking at some distantobjects.
National Aeronautics and Space Administration74
Cut
out
slo
t
* Space Based Atronomy.b/w 2/28/01 8:54 AM Page 74

ACTIVITY: ColorsDescription: Students identify the actual colors of objectsbathed in monochromatic light and learn howthree colors of light can be combined to producecolors ranging from black to white.
Objectives: • To identify the actual colors of objects
bathed in monochromatic light. • To demonstrate how three colored lights can
be combined to produce a wide range ofsecondary colors.
• To show how space observatories make useof monochromatic filters to collect data onthe color of objects in space.
National Education Standards:Science
Evidence, models, & explanationChange, constancy, & measurement
Abilities necessary to do scientific inquiryProperties & changes of properties in matterTransfer of energyUnderstandings about science & technology
TechnologyUnderstand relationships & connections
among technologies & other fieldsUnderstand troubleshooting, R & D, inven-
tion, innovation, & experimentationUnderstand, select, & use information &
communication technologies
Materials:Indoor/outdoor floodlights (red, green, and
blue)Adjustable fixtures to hold the lightsProjection screenVarious colored objects (apple, banana,
grapes, print fabrics, etc.)Dark room
Procedure Part 1 - Color Recognition:1. Prior to class, set up the three floodlights in a
row at a distance of about 4 meters from theprojection screen so that they each point to thecenter of the screen. The lights should bespaced about 1 meter apart. When properlyaimed, the three lights should blend to produce
a nearly white light falling on the screen. Moveone or more lights closer to or farther awayfrom the screen to achieve a proper balance.
2. Darken the classroom and turn on the redlamp.
3. Hold up the colored objects one at a time. Askstudents to make notes on the Color Table asto how bright or dark the objects appear in thered light.
4. Turn off the red light and turn on the greenlight and repeat with the same objects.Repeat again, but this time use the blue light.
5. Turn on the room lights and show the stu-dents the actual colors of the objects.
6. Challenge the students to identify the colors ofnew objects. Show them the unknown objectsin the red, green, and then blue lights. By usingtheir notes, the students should be able todetermine the actual colors of the objects.
7. Hold up a Granny Smith or Golden Deliciousapple to see if the students can correctly judgeits actual color or will instead jump to an erro-neous conclusion based on shape.
Procedure Part 2 - Color Shadows:
1. Using the same light and screen setup, darkenthe room and turn all the floodlights on, holdup your hand between the lights and thescreen. Three colored shadows appear––yellow,cyan, and magenta.
3. Move your hand closer to the screen. Theshadows will overlap and produce additionalcolors––red, blue, and green. When all the
Space-Based AstronomyActivity Guide for Science, Mathematics, and Technology Education 75
* Space Based Atronomy.b/w 2/28/01 8:54 AM Page 75

shadows overlap, there is no color (light) leftand the shadow on the screen becomes black.
4. Invite your students to try their “hand” atmaking shadows.
Background:Astronomical spacecraft, working in the visibleregion of the electromagnetic spectrum, collectimages of stars and galaxies in various colors.Color filters rotate into the light path so that thedetector sees one color at a time. The image ineach of these colors is transmitted to Earth as aseries of binary numbers. Image processing com-puters on Earth take each of the images, colorthem, and combine all the images to reconstructa multi-colored image representing the true col-ors of the object. To enhance details in theimages, astronomers will use artificial colors orboost the color in one or more wavelengths.
Part 1 of this activity demonstrates the data col-lection part of the color imaging process. Byexamining various objects in red, green, and thenblue light, the students note that the brightnessvaries with the illuminating. Using colored lightsis equivalent to observing the objects throughcolored filters. The way each object appearsrelates to its “real” colors as seen in normal light.By noting subtle differences in brightness in eachof the three colored lights, the actual colors ofthe objects can be identified.
Part 2 of this activity demonstrates how a few basiccolors can produce a wide range of colors and hues.When the three lamps are set up properly, thescreen appears whitish. When all shadows overlap,they become black; black is the absence of light. Inbetween white and black are red, green, blue, cyan,yellow, and magenta. By moving the floodlightsforward and back, a wide range of hues appears.
Management and Tips:It is difficult to get a pure white screen withindoor/outdoor floodlights. The colors producedby them are not entirely monochromatic. Usingmuch more expensive lamps produces a betterwhite but the whiteness is not significantlyenhanced. An alternative to the colored lamps is toobtain red, green, and blue theatrical gels (filters)and place them (one each) on the stage of threeoverhead projectors. Aiming each of the three pro-jectors to the same place on the screen produces thesame effect as the lamps, but the colors are moreuniform across the screen and the white is purer.
Assessment:Collect the color tables of the students. Hold upcolored objects in different monochromaticlights and have the students try to identify theirwhite light colors.
Extensions:• Look at color magazine pictures. How many
colors do you see? Examine the pictures witha magnifying glass. How many colors do yousee? Also examine the picture on a color tel-evision screen.
• What common devices use red, green, andblue to produce colored pictures?
National Aeronautics and Space Administration76
RED
GREEN BLUE
WHITE
CYAN
MAGENTAYELLOW
ADDITIVE COLORS
* Space Based Atronomy.b/w 2/28/01 8:54 AM Page 76

Space-Based AstronomyActivity Guide for Science, Mathematics, and Technology Education 77
CutOut
Front Plate
CutOut
CutOut
CutOut
Back Plate
CutOut
Back Plate
Front Plate
1
3
2
Color Filter Wheel
* Space Based Atronomy.b/w 2/28/01 8:54 AM Page 77

• Is there any difference in the results of mix-ing colored lights and colored paints?
• Punch a 2-centimeter hole in an opaquepiece of paper. Adjusting the distance of thepaper to the screen may help students inves-tigate the color additive process.
• This activity also works using colored acetatefilters taped over small windows cut into filecards. Sheets of red, green, and blue acetatecan be purchased at art supply stores.Students can make their own filter cards andtake them home to look through the win-dows at a variety of objects. Better qualityfilters, that transmit “purer” colors, can be
obtained from theatrical supply stores at acost comparable to acetate filters. If yourschool has a theater department, you may beable to obtain filters (gels) from them.
• The following reference describes furtheractivities with the filters:
Sneider, C., Gould, A., & Hawthorne, C.,“Color Analyzers Teacher’s Guide,” GreatExplorations in Math and Science (GEMS),Lawrence Hall of Science, University ofCalifornia at Berkeley, 1991. (Available fromthe museum or the National ScienceTeacher’s Association.)
National Aeronautics and Space Administration78
Red Green Blue
Composite Image
Color Image Process
StSci-PR99-02Ring Nebula(M57)
This simulation of the imaging process of the Hubble Space Telescoperequired three separate images, each taken through a different filter. The M57 Ring Nebula looks very different in each of the exposures.To create the color composite image, each image is colored in red, green, or blue and combined.
* Space Based Atronomy.b/w 2/28/01 8:54 AM Page 78

Object Red BlueGreen TrueColor
Object Red BlueGreen TrueColor
1
2
3
4
5
Color Table
Name
Unknown Colors
Known Colors
?
Student Work Sheet
* Space Based Atronomy.b/w 2/28/01 8:54 AM Page 79

ACTIVITY: Binary NumbersDescription: Two flashlights are used to demonstrate howastronomy spacecraft transmit images and otherscientific data to Earth.
Objective: To use the binary number system to transmitmessages.
National Education Standards:Mathematics
Number & operationPatterns, function, & algebraMeasurementData analysis, statistics, & probabilityCommunicationConnectionsRepresentations
ScienceEvidence, models, & explanationChange, constancy, & measurementUnderstandings about science & technology
TechnologyUnderstand relationships & connections
among technologies & other fieldsUnderstand cultural, social, economic, &
political effects of technologyUnderstand, select, & use:
Medical technologiesAgricultural technologies & biotechnologiesEnergy & power technologiesInformation & communication technologiesTransportation technologiesManufacturing technologiesConstruction technologies
Materials:Two flashlights with pushbutton switchesBinary code and data sheets
Procedure:1. Explain how astronomical spacecraft use the
binary system to transmit, via radio waves,images and other scientific data from space-craft to Earth. Refer to the background sec-tion for details on how the system works.
2. Distribute the data sheet and substitutioncode page to every student. Tap out a six
number sequence of the push buttons on thetwo flashlights. Your right hand flashlightwill represent a 1 and your left hand flash-light will represent a 0. As the lights flash,each student should check off the appropri-ate box in the practice column. To makesense later, the students must check off theboxes representing right or left flashes in theexact sequence of the flashing lights. Refer tothe sample on the next page to see how tomake the checks.
3. For the practice columns, total up the num-bers each sequential flash represents. Forexample, if all flashes are with the left flash-light, the value is 0+0+0+0+0+0 = 0. If sixflashes are all with the right flashlight, thevalue of the binary number is 63. The firstright flash represents a 1, the second is 2, thethird is 4, the fourth is 8, the fifth is 16, andthe sixth is 32 (1+2+4+8+16+32=63). Thefollowing sequence of flashes is 37: Right,Left, Right, Left, Left, Right. After the boxesare filled in, the students total the numbersin the two columns. The answer will givestudents the total value of the number thatwas transmitted. (In this activity, the num-ber will represent a letter in a message. Withthe Hubble Space Telescope, the numberwill represent the brightness of a particularpoint on an image.)
4. After the students become familiar with themethod, transmit a message to the them.Create the message by referring to the substi-tution code in the following pages. Replaceeach word in your message with the corre-sponding code number. For example,“Hello!” would convert to 7, 4, 11, 11, 24,38. Next, convert each code number into abinary number. Seven, for example, becomesRight, Right, Right, Left, Left, Left and 24becomes Left, Left, Left, Right, Right, Left.As you will note in the substitution code, onlythe first 40 of the 64 possible numbers areused. The remaining numbers can be assignedto common words of your choosing such as“the” and “but,” and to short sentences suchas “How are you?” Transmit the message byflashing the lights in the proper sequence.Every six flashes represents a binary number
National Aeronautics and Space Administration80
* Space Based Atronomy.b/w 2/28/01 8:54 AM Page 80

that can be converted into a letter or wordthrough the code. Students receive the mes-sage by checking the flashes on the data sheet,determining the binary numbers they repre-sent, and then changing the numbers into let-ters or words.
5. Discuss how a picture could be translatedthrough binary code. (Refer to the activityPaint by the Numbers.)
Background:Because astronomical spacecraft operate in orbitaround Earth, the images they collect of objects inspace have to be transmitted to the ground byradio signals. To make this possible, the light fromthese objects is concentrated on a light sensitivecharged coupled device (CCD). The HubbleSpace Telescope uses four CCDs arranged in asquare. The surface of each CCD is a grid consist-ing of 800 vertical and 800 horizontal lines thatcreate a total of 640,000 light sensitive squarescalled pixels for picture elements. With fourCCDs, the total number of pixels in the HubbleSpace Telescope CCD array is 2,560,000.
Photons of light fall on the CCD array and areconverted into digital computer data. A numeri-cal value is assigned to the number of photonsreceived on each of the more than two millionpixels. This number represents the brightness ofthe light falling on each pixel. The numbers rangefrom 0 to 255. This range yields 256 shades ofgray ranging from black (0) to white (255).
These numbers are translated into a binary com-puter code on board the spacecraft. A binarynumber is a simple numeric code consisting of aspecific sequence of on and off radio signals.They are the same codes that are used in com-puters. A binary number radio transmission canbe compared to a flashing light. When the lightis on, the value of the signal is a specific number.When the light is off, the value is 0. (In thisactivity the right flashlight is the 1 and the leftflashlight is the 0. Although the activity could bedone with 1 flashlight, it would be difficult forstudents to determine how may 0’s are beingtransmitted when the light is off. Computersprecisely time the interval to determine how
many 0’s are in the sequence. Using a secondflashlight for 0’s makes it easy for students todetermine the number of 0’s.)
A binary number usually consists of 8 bits (1byte). The first bit in the sequence represents a 1.The second bit represents a 2. The remaining 6bits represent 4, 8, 16, 32, 64, and 128 respec-tively. If all bits are “on” the value of the binarynumber is the sum of each bit value—255. If allbits are “off,” the value is 0. A sequence of on, off,on, on, off, off, on, and off represents the numbers1+0+4+8+0+64+0, or 77. To save classroom time,the binary system has been simplified in this activ-ity by using a 6-bit binary code. The total value ofa 6-bit code is 64, or 1+2+4+8+16+32.
After the image of the space object is encoded, thebinary bits are transmitted by radio waves to areceiving station on the ground. The photons oflight that fall on each of the 2,560,000 pixels arenow represented by a data set consisting of20,480,000 binary bits. The computer will convertthem to a black and white image of the spaceobject. If a colored image is desired, at least twomore images are collected, each one taken througha different colored filter. The data from the threeimages are combined by a computer into a com-posite image that shows the actual colors of theobject being observed.
Because images collected by the HST and otherastronomy spacecraft are digital, astronomers canuse computers to manipulate images. Thismanipulation is roughly analogous to the manip-ulation of color, brightness, and contrast controlson a television set. The manipulation process iscalled enhancement and it provides astronomerswith a powerful tool for analyzing the light fromspace objects.
To learn more about the imaging process, refer tothe following activities in this guide: Paint by theNumbers and Colors.
Management and Tips:Students may be confused by right and left flash-lights when you face them. The right (1) and left(0) flashlights refer to the student’s right and left.
Space-Based AstronomyActivity Guide for Science, Mathematics, and Technology Education 81
* Space Based Atronomy.b/w 2/28/01 8:54 AM Page 81

Look at the columns of marks for each letter youtransmit. If the mark is in the right-hand boxand represents an on (1) signal, flash the rightflashlight. Students will read this as a 0. If themark is in the left-hand box and represents an off(0) signal, flash your left flashlight. Students willread this as a 1.
Students will sometimes lose track of the lightsequence by concentrating on their paper. If youcan dim the room lights a bit, which flashlightbeam is turned on is easier to see out of the cornerof the eye. Also, you can use the light fixtures usedin the color activity for the code. Use the greenlamp on for a 1 and the red lamp on for a 0.
Students may also become confused by using onenumber to represent another number. Make surethey understand the sequence of 1’s and 0’s is thecode. The on-off (1-0) code is what is used in theprocess. However, other things could be used forthe 1-0 such as the words “on-off ” or even wordslike “pickle-pineapple.” It is the sequence of thewords or numbers used that is important.If you have visually impaired students, you cansubstitute tapping two different surfaces to maketwo different sounds for them to listen to andinterpret as 1’s or 0’s.
If you wish to use materials other than flashlightsfor transmitting data, you can make two cardswith a large 1 on one card and a 0 on the other.Raise and lower the cards in sequence to repre-sent a binary number.
Assessment:Check the student sheets to see if they have cor-rectly received the message.
Extensions:• Have students code binary numbers with a
binary coder consisting of several paperdesert plates or shallow cups and markers
such as jelly beans or breakfast cereal pieces.Arrange the plates in a row and number thefirst one “1”. Mark the plate to the left “2”and the plate to the left of that one “4”, etc.Place a small group of markers in the 1plate. To code the markers into binarynumbers, follow these rules: If a plate hastwo or more markers, remove two markers.Place one of the markers in a discard pileand place the other one in the plate imme-diately to the left. Continue removingmarkers from the 1 plate until there is only1 or 0 left. If plate 2 has 2 or more markers,remove two. Discard one and place theother one in the plate to the left. Continueuntil all plates have only 1 or 0 markers inthem. Starting on the left, write the binarynumber. Put down a 0 for a plate with nomarkers in it and a 1 for a plate with amarker in it. To check your work, add upthe numbers on all the plates with markers.It should be the same as the number ofmarkers you started with.
• Transmit binary numbers by having fourstudents stand in a row in front of the class.Give each student a card with a 1 on oneside and a 0 on the other. Quietly tell thestudents to transmit the number 7 to theirclassmates. The four students will have todetermine between them who holds up a 0and who holds up a 1. The binary sequencefor 7 is 0111. The remainder of the studentsshould try to decode the binary number.With more students in the row, higher num-bers can be transmitted.
• Have students transmit other scientific datawith binary numbers. For example, studentscan measure the temperature of a liquid orthe mass of an object and transmit theresults to another student.
• How are binary numbers used in computers?• How high can you count with a binary
number consisting of 10 bits? 12?
National Aeronautics and Space Administration82
* Space Based Atronomy.b/w 2/28/01 8:54 AM Page 82

32 16 8 4 2 1
Total
=
32 16 8 4 2 1
Total
=
32 16 8 4 2 1
Total
=
32 16 8 4 2 1
Total
=
32 16 8 4 2 1
Total
=
32 16 8 4 2 1
Total
=
32 16 8 4 2 1
Total
=
32 16 8 4 2 1
Total
=
32 16 8 4 2 1
Total
=
32 16 8 4 2 1
Total
=
32 16 8 4 2 1
Total
=
32 16 8 4 2 1
Total
=
32 16 8 4 2 1
Total
=
32 16 8 4 2 1
Total
=
32 16 8 4 2 1
Total
=
32 16 8 4 2 1
Total
=
32 16 8 4 2 1
Total
=
32 16 8 4 2 1
Total
=
32 16 8 4 2 1
Total
=
32 16 8 4 2 1
Total
=
32 16 8 4 2 1
Total
=
32 16 8 4 2 1
Total
=
32 16 8 4 2 1
Total
=
32 16 8 4 2 1
Total
=
32 16 8 4 2 1
Total
=
32 16 8 4 2 1
Total
=
32 16 8 4 2 1
Total
=
32 16 8 4 2 1
Total
=
32 16 8 4 2 1
Total
=
32 16 8 4 2 1
Total
=
32 16 8 4 2 1
Total
=
32 16 8 4 2 1
Total
=
22
(16 + 4 + 2 = 22)
Sample Practice
32 16 8 4 2 1
Total
=
Practice
(Practice answers at bottom of page)
Practice Answers: 13 and 54Student Work Sheet - 1 Data Sheet
Name:
Wor
k do
wn
Go
to to
p
Go
to to
p
Start
Finish
1 10 0 01 1 10 1 1 10 010 0 1
* Space Based Atronomy.b/w 2/28/01 8:54 AM Page 83

ACTIVITY: Paint by the NumbersDescription: A pencil and paper activity demonstrates howastronomical spacecraft and computers createimages of objects in space.
Objective: To simulate how light collected from a spaceobject converts into binary data and reconvertsinto an image of the object.
National Education Standards:Mathematics
Number & operationPatterns, function, & algebraMeasurementData analysis, statistics, & probabilityCommunicationConnectionsRepresentations
ScienceEvidence, models, & explanationChange, constancy, & measurementEarth in the solar systemAbilities of technological design
TechnologyUnderstand cultural, social, economic, &
political effects of technologyAbility to use & maintain technological
products & systemsUnderstand, select, & use:
Medical technologiesAgricultural technologies & biotechnologiesEnergy & power technologiesInformation & communication technologiesTransportation technologiesManufacturing technologiesConstruction technologies
Materials: (per group of two students)Transparent gridPaper gridPicture of housePencil
Procedure:1. Divide students into pairs.2. Give one student (A) in each pair the paper
copy of the blank grid on the next page. Givethe other student (B) in each pair the pictureof the house on the next page. Instruct stu-dent B not to reveal the picture to student A.Also give student B a copy of the transparentgrid. (See notes about making student copiesof the picture and grids on the next page.)
3. Explain that the picture is an object beingobserved at a great distance. It will be scannedby an optical device like those found on someastronomical satellites and an image will becreated on the paper.
4. Have student B place the grid over the picture.Student B should look at the brightness ofeach square defined by the grid lines andassign it a number according to the chartabove the picture. Student B will then call outthe number to student A. If a particular squarecovers an area of the picture that is both lightand dark, student B should estimate its aver-age brightness and assign an intermediatevalue to the square such as a 1 or a 2. Note:The letters and numbers on two sides of thegrid can assist the receiving student in findingthe location of each square to be shaded.
5. After receiving a number from student B, stu-dent A will shade the corresponding squareon the grid. If the number is 0, the squareshould be shaded black. If it is 3, the squareshould be left as it is.
National Aeronautics and Space Administration84
* Space Based Atronomy.b/w 2/28/01 8:54 AM Page 84

6. Compare the original picture with the imagesketched on the paper.
Background:This activity simulates the process by which anastronomy spacecraft such as the Hubble SpaceTelescope collects light from an astronomicalobject and converts the light into a digital formthat can be displayed on Earth as an image of theobject. The student with the transparent grid rep-resents the spacecraft. The picture is the object thespacecraft is trying to collect from. The studentwith the paper grid represents the radio receiver onthe ground and the image-processing computerthat will assemble the image of the object.
The image created with this activity is a cruderepresentation of the original picture. The reasonfor this is that the initial grid contains only 64squares (8 x 8). If there were many more squares,each square would be smaller and the imagewould show finer detail. You may wish to repeatthis activity with a grid consisting of 256 squares(16 x 16). However, increasing the number ofsquares will require more class time. If you wish
to do so, you can select a single student to repre-sent the spacecraft and transmit the data to therest of the class.
With the HST, the grid consists of more than 2.5million pixels and they are shaded in 256 stepsfrom black to white instead of just the 4 shadesused here. Color images of an object are createdby the HST with color filters. The spacecraftobserves the object through a red filter, a blue fil-ter, and then a green one. Each filter creates aseparate image, containing different informa-tion. These images are then colored and com-bined in a process similar to color separationsused for printing colored magazine pictures.
Management and Tips:Students can provide their own pictures for thisactivity. It is important for the pictures to showstrong contrast. The smaller the grid squares, themore detail that will appear in the image.However, simply going from a grid of 10 x 10 toa grid of 20 x 20 will quadruple the length oftime it takes to complete the image. Refer to theColor Recognition and Colored Shadows activi-
Space-Based AstronomyActivity Guide for Science, Mathematics, and Technology Education 85
0 1 2 3
Shading Values
100 Pixel Grid
Sample Picture
1 2 3 4 5 6 7 8 9 1 0ABCDEFGHIJK
* Space Based Atronomy.b/w 2/28/01 8:54 AM Page 85

ties for more details on how color filters workand how to combine colors.
Assessment:Collect the pictures of the house drawn by thestudent receivers. Compare the original drawingwith the student images. Discuss with your stu-dents possible strategies for improving the detailof the images. Extensions:• Transmit and reconstruct the image of
Saturn shown on the next page. This moreadvanced picture uses six shades and smallergrid squares.
• Examine printed copies of drawings madewith a computer art program. Notice howthe pictures are constructed of individualpoints. Also notice how the size of the pointscontributes to the fineness of detail in thepicture.
• Examine pictures drawn on a computer. Usethe magnifying tool to move to the maxi-mum magnification possible. Compare thetwo views.
• Obtain Hubble Space Telescope imagesfrom the Internet sites given in Unit 5.Examine them closely for the pixel structure.Alternately enlarge and reduce the image sizeon your computer screen to see the effect onthe fineness of detail.
National Aeronautics and Space Administration86
100 Pixel Grid Over House
1,600 Pixel Grid
100 Pixel Grid
400 Pixel Grid
* Space Based Atronomy.b/w 2/28/01 8:54 AM Page 86
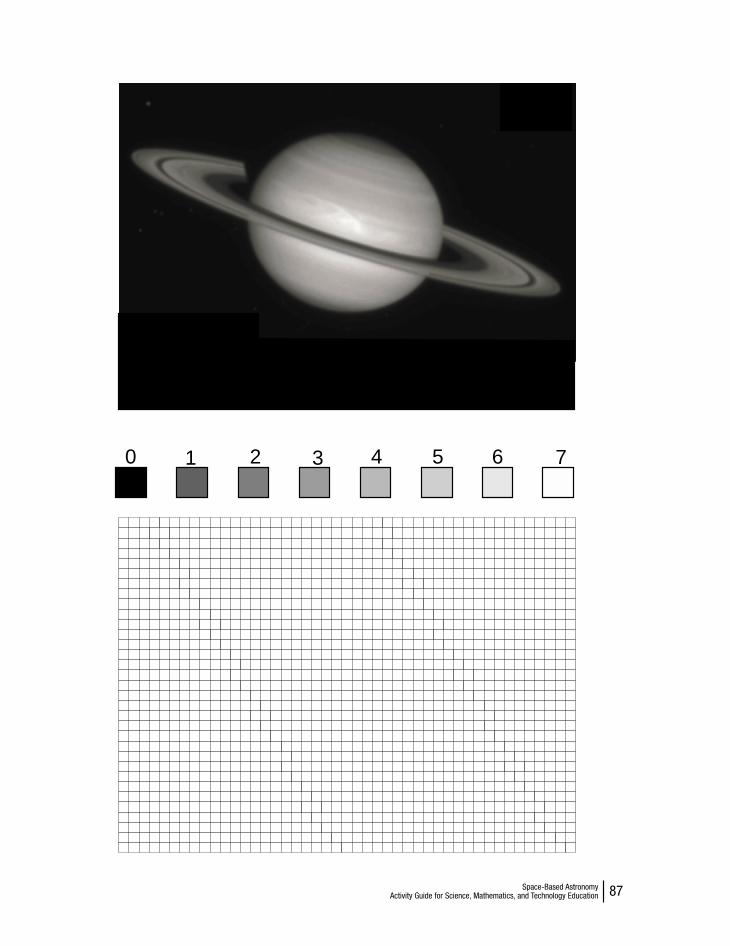
Space-Based AstronomyActivity Guide for Science, Mathematics, and Technology Education 87
0 1 2 3 4 5 6 7
* Space Based Atronomy.b/w 2/28/01 8:54 AM Page 87

Fortunately, obtaining images is very easy to dothrough the many astronomy Web sites availableon the Internet. The list below provides severalexcellent resources. It must be remembered,however that Web site addresses sometimeschange but old addresses will have a forwardingmessage leading the user to the new site.Furthermore, most sites link to other sites andthe actual resources available on-line are muchgreater than shown here.
NASA maintains extensive Web sites related toastronomy. On the Office of Space Science sitethere are links to many astronomy spacecraftWeb sites. Missions that have flown or are cur-rently operating, such as the SOHO, Voyager, orGalileo missions will have many images toretrieve.
Space-Based AstronomyActivity Guide for Science, Mathematics, and Technology Education 89
UNIT 5 SPACE-BASED ASTRONOMY ON THE INTERNETIntroduction
Activities in the previous units centered on the problems caused by Earth’s atmos-
phere, the nature and uses of the electromagnetic spectrum, visible and infrared
radiation collectors, and the imaging process. Once students gain a basic under-
standing of the nature and methods of space-based astronomy, the only thing left
is to do space-based astronomy. This requires obtaining images to study.
* Space Based Atronomy.b/w 2/28/01 8:54 AM Page 89

Unit Goal:Students will use data found on Internet Websites to investigate astronomical objects.
National Education Standards:Mathematics
ConnectionsScience
Evidence, models, & explanationStructure of the Earth systemEarth is the solar system
TechnologyUnderstand relationships & connections
among technologies & other fieldsUnderstand cultural, social, economic, &
political effects of technologyUnderstand, select, & use information &
communication technologies
Teaching Strategy:Using the Internet, students may retrieve HubbleSpace Telescope and Compton Gamma RayObservatory images as well as pictures from manyother satellite observatories. The objects in theimages can be examined by unaided visualinspection and compared to pictures taken of thesame objects by ground-based observatories.However, the advantage of using computers toretrieve the images is that the same computerscan be used to analyze the image with image pro-cessing programs. The images can be opened inpublic domain programs such as NIH Image (for
the Macintosh), Scion Image (for Windows-based computers), and various commercial imagemanipulation programs. These programs permitstudents to change the colors of selected parts ofthe image in order to enhance the contrast andreveal structures that might not be visible to theunaided eye. Measurement tools can be used todetermine the size of objects if the distance tothem is known, measure the relative brightness ofstars, map distributions of objects, and so on.
National Aeronautics and Space Administration90
StSci-PR99-02: Combined Deep View of Infrared and Visible
Light Galaxies
StSci-PR98-39: Planetary Nebula NGC 3132
CGRO-Supernova: Supernova detected by the Compton
Gamma Ray Observatory
* Space Based Atronomy.b/w 2/28/01 8:54 AM Page 90

In addition to the analysis of images, studentsalso have access to telescopes that can be con-trolled remotely. Furthermore, many sites pro-vide background information on a wide rangeof astronomical topics for research reports.Descriptions of proposed new spacecraft arealso available as well as the research questionsastronomers are trying to answer with them.
From the NASA Office of Space Science Website comes the following list of fundamentalquestions they are trying to answer with theirastronomy spacecraft. Some of these questionsmay inspire students into particular lines ofresearch.Fundamental Questions:
1. How did the Universe begin and what is itsultimate fate?
2. How do galaxies, stars, and planetary sys-tems form and evolve?
3. What physical processes take place inextreme environments such as black holes?
4. How and where did life begin?5. How is the evolution of life linked to plane-
tary evolution and to cosmic phenomena? 6. How and why does the Sun vary and how do
the Earth and other planets respond? 7. How might humans inhabit other worlds?
Space-Based AstronomyActivity Guide for Science, Mathematics, and Technology Education 91
STSci-PRC97-33: One of the brightest stars in the Milky Way
Galaxy glows with the radiance of 10 million Suns.
SN 19941: Supernova in galaxy M51 BRB 971214: Hubble Space Telescope view of the site of a
gamma ray burst detected by the Keck 10-meter telescope
* Space Based Atronomy.b/w 2/28/01 8:54 AM Page 91

Deep Space Astronomy Web sitesNASA Resources NASA Office of Space Sciencehttp://spacescience.nasa.govhttp://spacescience.nasa.gov/missions/index.html
Planetary Photojournalhttp://photojournal.jpl.nasa.gov
Images From High-Energy Astrophysics mis-sionshttp://heasarc.gsfc.nasa.gov/Images/pretty_pic-tures.html
Imagine the Universehttp://imagine.gsfc.nasa.gov/docs/homepage.html
StarChild Learning Center for YoungAstronomershttp://starchild.gsfc.nasa.gov/docs/StarChild/StarChild.html
Astronomy & Astrophysics at the National SpaceScience Data Centerhttp://nssdc.gsfc.nasa.gov/astro
Telescopes in Educationhttp://learn.ivv.nasa.gov/products/k12/jpl_tie.html
Compton Gamma Ray Observatoryhttp://cossc.gsfc.nasa.gov/cossc/PR.html
Non-NASA ResourcesAstroWebhttp://www.stsci.edu/astroweb/astronomy.html
Chandra Xray Observatory Centerhttp://xrtpub.harvard.edu
Space Telescope Science Institutehttp://oposite.stsci.edu/pubinfo
Amazing Space Web-Based Activitieshttp://amazing-space.stsci.edu
National Astronomy Education Projectshttp://www.aspsky.org/html/naep/naep.html
Stardatehttp://www.visionx.com/dd/main/star.htm
Hubble Space Telescope Informationhttp://www.ncc.com/misc/hubble_sites.html
SEDS Messier Cataloghttp://www.seds.org/messier
Astronomy Siteshttp://www.inlink.com/~tfc/stars.html
NIH Image and Scion Imagehttp://cipe.com/Software/Soft.html
National Aeronautics and Space Administration92
* Space Based Atronomy.b/w 2/28/01 8:54 AM Page 92

Absorption lines - Dark lines that are producedin a spectrum because intervening atomsabsorbed photons of specific wavelengths.
Angstrom - A unit of wavelength measure equiv-alent to 10-12 meters.
Astronomy - The branch of science focusing oncelestial objects, dealing with their size, location,composition, dynamics, origin, etc.
Astrophysics - Investigation, through remotesensing, of the physical principles of astronomi-cal objects.
Binary numbers - A system of numbers that hastwo as its base and can be used for numerical cod-ing of data.
Black hole - Any object (usually a collapsed star)whose surface gravity is so great that neither mat-ter nor light can escape from it.
Charged coupled device (CCD) - An electronicdevice that consists of a regular array of light sen-sitive elements that emit electrons when exposedto light. CCDs are used as the light-detectingelement in telescopes, television cameras, etc.
Concave lens or mirror - A lens or mirror thatpresents an inward curvature to the objective.Continuous spectrum - A spectrum unbroken byabsorption or emission lines.
Convex lens or mirror - A lens with an outwardcurvature.
Diffraction - The spreading out of light waves asthey pass by the edge of a body or through close-ly spaced parallel scratches in a diffraction grating.
Dispersion - Breaking up of light into its com-ponent colors.
Doppler shift (effect) - Changes in the wave-lengths of sound or light as the distance betweenthe emitter and the receiver changes.
Earth-based telescope - Telescope mounted onthe surface of Earth.
Electromagnetic spectrum - The complete rangeof all wavelengths of electromagnetic radiation.
Enhancement (computer) - Boosting the color orcontrast of a faint image through computer pro-cessing.
Space-Based AstronomyActivity Guide for Science, Mathematics, and Technology Education 93
GLOSSARY
* Space Based Atronomy.b/w 2/28/01 8:54 AM Page 93
Excitation - The state that occurs when electronsare raised by an external input, such as light or anelectronic current, to higher energy levels.
Fluorescence - A spontaneous emission of a pho-ton of light that occurs when an electron dropsdown from a higher energy level (See excitation)to its original level in an atom.
Frequency - The number of waves that pass apoint in one second. Frequency is usuallyexpressed in units of Hertz (waves or cycles persecond).
Gamma rays - Electromagnetic radiation withwavelengths shorter than 10-12 meters.
Geostationary satellite - A satellite placed in anorbit 35,900 kilometers over Earth’s equator thatremains in the same place relative to Earth.
Infrared - Electromagnetic radiation with wave-lengths ranging from approximately 10-4 to 10-6
meters.
Light gathering power (LGP) - The ability of anoptical instrument to collect light.
Long wave UV - Ultraviolet light with wave-lengths (about 10-7 meters) just shorter than theoptical range of the electromagnetic spectrum.
Microwaves - Electromagnetic radiation withwavelengths ranging around 10-3 meters.
Nanometer - One billionth of a meter (10-9 m).
Neutron star - A star, about 10 kilometers indiameter, composed of neutrons.
Objective lens or mirror - The large lens or mir-ror of a telescope. Sometimes referred to as theprimary lens or mirror.
Ozone layer - A region in Earth’s upper atmos-phere (between 15 and 30 kilometers) wheresmall concentrations of ozone absorb ultravioletradiation from the Sun and other celestial bodies.
Persistence of vision - Momentary visual reten-tion of signal in the visual cortex of the brain.
Photometry - Measurement of the intensity oflight.
Photon - A quantum or individual packet ofelectromagnetic energy.
Photosphere - The visible surface of the Sun.
Pixels - The smallest element of a picture.
Planck’s Constant - A universal constant (h) whichgives the ratio of a quantum of radiant energy (E)to the frequency (v) of its source. It is expressed bythe equation E=hv and its approximate numericalvalue is 6.626 x 10⁻³⁴ joule second.
Pulsars - A stellar radio source that emits radiowaves in a pulsating rhythm.
Radio waves - Electromagnetic radiation withwavelengths ranging from approximately 10-4 to10-2 meters.
Refraction - Bending of light rays as they passthrough the interface between two transparentmedia.
Resolution - The degree to which fine details inan image can be seen as separated or resolved.
Resonance - Sympathetic vibration of one bodywhen exposed to vibrations or electromagneticradiation emanating from another.
Scientific Notation - Scientific notation, or pow-ers of 10, which can simplify writing large num-bers. Numbers with positive powers mean thedecimal point moves to the right (e.g., 3 x 106 =3,000,000). A number with a negative powermeans that the decimal moves to the left (e.g., 3x 10-6 = 0.000,006).
Short wave UV - Ultraviolet light with wave-lengths nearest the x-ray range (around 10-8
meters) of the electromagnetic spectrum.
National Aeronautics and Space Administration94
* Space Based Atronomy.b/w 2/28/01 8:54 AM Page 94

Space-Based AstronomyActivity Guide for Science, Mathematics, and Technology Education 95
Space-based astronomy - Astronomical investiga-tions conducted from above Earth’s atmosphere.
Spectrograph - An instrument used for dispers-ing and recording specific wavelengths of theelectromagnetic spectrum.
Spectroscopy - The study of spectra.
Speed of light - The speed at which light trav-els—300,000 kilometers per second.
Supernova - A stellar explosion which increasesthe brightness of a star by a factor of several mil-lion in a matter of days.
Ultraviolet (UV) - Electromagnetic radiationwith wavelengths ranging from approximately10-7 to 10-8 meters.
Visible light - Electromagnetic radiation withwavelengths ranging from approximately 400 to700 nanometers.
Wavelength - The distance between one wavecrest to the next wave crest (or one trough to thenext trough).
White dwarf - A small star that is actively fusinghelium into carbon and oxygen.
X-rays - Electromagnetic radiation with wave-lengths ranging from approximately 10-8 to 10-11
meters.
* Space Based Atronomy.b/w 2/28/01 8:54 AM Page 95

National Aeronautics and Space Administration96
SUGGESTED READINGThese books can be used by students and teachers to learn more about space-based
astronomy.
Bonnet, R. & Keen, G. (1992), Space &Astronomy, 49 Science Fair Projects, TAB Books,Blue Ridge Summit, PA.
Clarke, D. (1998), Shoebox Spectroscopy, TheScience Teacher, v65n7, pp. 28-31.
Moeschl, R. (1989), Exploring the Sky; 100Projects for Beginning Astronomers, ChicagoReview Press, Chicago, IL.
Pethoud, R. (1993), Pi in the Sky: Hands-onMathematical Activities for Teaching Astronomy,Zephyr Press, Tucson, AZ.
Porcellino, M. (1991), Young Astronomer’s Guideto the Night Sky, TAB Books, Blue RidgeSummit, PA.
Schaff, F. (1992), Seeing the Deep Sky; TelescopicAstronomy Projects Beyond the Solar System, JohnWiley & Sons, Inc., New York, NY.
Schaff, F. (1991), Seeing the Solar System; TelescopicProjects, Activities, & Explorations in Astronomy,John Wiley & Sons, Inc., New York, NY.
Schaff, F. (1990), Seeing the Sky; 100 Projects,Activities & Explorations in Astronomy, JohnWiley & Sons, Inc., New York, NY.
Smith, P. (1992), Project Earth Science: Astronomy,National Science Teacher’s Association, Arlington, VA.
Sneider, C., et al. (1989), Color Analyzers,Lawrence Hall of Science, Berkeley, CA.
Sneider, C., Gould, A. (1988), More thanMagnifiers, Lawrence Hall of Science, Berkeley, CA.
Sneider, C. (1988), Earth, Moon, and Stars,Lawrence Hall of Science, Berkeley, CA.
Van Cleave, J. (1991), Astronomy for Every Kid:101 Easy Experiments that Really Work, JohnWiley & Sons, Inc., New York, NY.
Vogt, G. (1992), The Hubble Space Telescope, TheMillbrook Press, Brookfield, CT.
Wood, R. (1991), Science for Kids: 39 EasyAstronomy Experiments, TAB Books, Blue RidgeSummit, PA.
* Space Based Atronomy.b/w 2/28/01 8:54 AM Page 96

• NASA CORELorain County Joint Vocational School15181 State Route 58Oberlin, OH 44074-9799
• Toll Free Ordering Line: 1-866-776-CORE• Toll Free FAX Line: 1-866-775-1401• E-mail: [email protected]• Home Page: http://education.nasa.gov/core
Educator Resource Center Network (ERCN)To make additional information available to theeducation community, NASA has created theNASA Educator Resource Center (ERC) net-work. Educators may preview, copy, or receiveNASA materials at these sites. Phone calls arewelcome if you are unable to visit the ERC thatserves your geographic area. A list of the centersand the regions they serve includes:
AK, HI, ID, MT, NV, OR, UT, WA, WY,Northern CANASA Educator Resource CenterMail Stop 253-2NASA Ames Research CenterMoffett Field, CA 94035-1000Phone: (650) 604-3574
CT, DE, DC, ME, MD, MA, NH, NJ, NY, PA, RI, VTNASA Educator Resource LaboratoryMail Code 130.3NASA Goddard Space Flight CenterGreenbelt, MD 20771-0001Phone: (301) 286-8570
Space-Based AstronomyActivity Guide for Science, Mathematics, and Technology Education 97
NASA RESOURCESFOR EDUCATORSNASA’s Central Operation of Resources for Educators (CORE) was established for the
national and international distribution of NASA-produced educational materials in
audiovisual format. Educators can obtain a catalogue and an order form by one of
the following methods:
* Space Based Atronomy.b/w 2/28/01 8:54 AM Page 97

National Aeronautics and Space Administration98
CO, KS, NE, NM, ND, OK, SD, TXSpace Center HoustonNASA Educator Resource Center forNASA Johnson Space Center1601 NASA Road OneHouston, TX 77058Phone: (281) 244-2129
FL, GA, PR, VINASA Educator Resource CenterMail Code ERCNASA Kennedy Space CenterKennedy Space Center, FL 32899Phone: (321) 867-4090
VA and MD’s Eastern ShoresNASA Educator Resource CenterVisitor Center Building J-17GSFC/Wallops Flight FacilityWallops Island, VA 23337Phone: (757) 824-2298
KY, NC, SC, VA, WVVirginia Air & Space CenterEducator Resource Center forNASA Langley Research Center600 Settlers Landing RoadHampton, VA 23669-4033Phone: (757) 727-0900 x 757
IL, IN, MI, MN, OH, WINASA Educator Resource CenterMail Stop 8-1NASA Glenn Research Center21000 Brookpark RoadCleveland, OH 44135Phone: (216) 433-2017
AL, AR, IA, LA, MO, TNU.S. Space and Rocket CenterNASA Educator Resource Center for NASA Marshall Space Flight CenterOne Tranquility BaseHuntsville, AL 35807Phone: (256) 544-5812
MSNASA Educator Resource CenterBuilding 1200NASA Stennis Space CenterStennis Space Center, MS 39529-6000Phone: (228) 688-3220
AZ and Southern CA NASA Educator Resource Center forNASA Dryden Flight Research Center45108 N. 3rd Street EastLancaster, CA 93535Phone: (661) 948-7347
CANASA JPL Educator Resource CenterVillage at Indian Hill1460 East Holt Avenue, Suite 20NASA Jet Propulsion LaboratoryPomona, CA 91767Phone: (909) 397-4420
* Space Based Atronomy.b/w 2/28/01 8:54 AM Page 98

Regional Educator Resource Centers offermore educators access to NASA educationalmaterials. NASA has formed partnerships withuniversities, museums, and other educationalinstitutions to serve as regional ERCs in manystates. A complete list of regional ERCs is avail-able through CORE, or electronically via NASASpacelink at http://spacelink.nasa.gov/ercn/
NASA’s Education Home Page serves as a cyber-gateway to information regarding educationalprograms and services offered by NASA for theAmerican education community. This high-leveldirectory of information provides specific detailsand points of contact for all of NASA’s education-al efforts, Field Center offices, and points of pres-ence within each state. Visit this resource at thefollowing address: http://education.nasa.gov
NASA Spacelink is one of NASA’s electronicresources specifically developed for the education-al community. Spacelink serves as an electroniclibrary to NASA’s educational and scientificresources, with hundreds of subject areas arrangedin a manner familiar to educators. Using SpacelinkSearch, educators and students can easily findinformation among NASA’s thousands of Internetresources. Special events, missions, and intriguingNASA Web sites are featured in Spacelink’s “HotTopics” and “Cool Picks” areas. Spacelink may beaccessed at: http://spacelink.nasa.gov
NASA Spacelink is the official home to elec-tronic versions of NASA’s Educational Products.A complete listing of NASA’s EducationalProducts can be found at the following address:http://spacelink.nasa.gov/products
NASA Television (NTV) features Space Stationand Shuttle mission coverage, live special events,interactive educational live shows, electronic fieldtrips, aviation and space news, and historicalNASA footage. Programming has a 3-hourblock—Video (News) File, NASA Gallery, andEducation File—beginning at noon Eastern andrepeated five more times throughout the day. Livefeeds preempt regularly scheduled programming.
Check the Internet for program listings at: http://www.nasa.gov/ntv
For more information on NTV, contact:NASA TVNASA HeadquartersCode P-2Washington, DC 20546-0001Phone: (202) 358-3572
How to Access Information on NASA’sEducation Program, Materials, and Services EP-2000-09-345-HQ
This brochure serves as a guide to accessing avariety of NASA materials and services for edu-cators. Copies are available through the ERCnetwork, or electronically via NASA Spacelink.
Space-Based AstronomyActivity Guide for Science, Mathematics, and Technology Education 99
NTV Weekday Programming Schedules (Eastern Times)
Video File NASA Gallery Education File12–1 p.m. 1–2 p.m. 2–3 p.m.3–4 p.m. 4–5 p.m. 5–6 p.m.6–7 p.m. 7–8 p.m. 8–9 p.m.9–10 p.m. 10–11 p.m. 11–12 p.m.12–1 a.m. 1–2 a.m. 2–3 a.m.
* Space Based Atronomy.b/w 2/28/01 8:54 AM Page 99

Sp
ace-Based
Astro
no
my
An
Ed
ucato
r Gu
ide w
ith A
ctivities fo
r Scien
ce,Math
ematics,an
d Tech
no
log
y Ed
ucatio
n
ED
UC
ATO
R R
EP
LY C
AR
DTo achieve A
merica’s goals in E
ducational Excellence, it is N
AS
A’s m
ission todevelop supplem
entary instructional materials and curricula in science, m
ath-em
atics, and technology.NA
SA
seeks to involve the educational comm
unity inthe developm
ent and improvem
ent of these materials.
Your evaluation andsuggestions are vital to continually im
proving NA
SA
educational materials.
Otherw
ise, please return the reply card by mail.T
hank you.
1.W
ith what grades did you use the educator guide?
Num
ber of Teachers/Faculty:
K-4
5-89-12
Com
munity C
ollege
College/U
niversity - U
ndergraduateG
raduate
Num
ber of Students:
K-4
5-89-12
Com
munity C
ollege
College/U
niversity - U
ndergraduateG
raduate
Num
ber of Others:
Adm
inistrators/Staff
Parents
Professional G
roups
General P
ublicC
ivic Groups
Other
2.W
hat is your home 5- or 9-digit zip code? __ __ __ __ __ —
__ __ __ __
3.T
his is a valuable educator guide?
❏S
trongly Agree
❏A
gree❏
Neutral
❏D
isagree❏
Strongly D
isagree
4.I expect to apply w
hat I learned in this educator guide.
❏S
trongly Agree
❏A
gree❏
Neutral
❏D
isagree❏
Strongly D
isagree
5.W
hat kind of recomm
endation would you m
ake to someone w
ho asks about this
educator guide?
❏E
xcellent❏
Good
❏A
verage❏
Poor
❏V
ery Poor
6.H
ow did you use this educator guide?
❏B
ackground Information
❏C
ritical Thinking Tasks
❏D
emonstrate N
AS
A M
aterials❏
Dem
onstration
❏G
roup Discussions
❏H
ands-On A
ctivities
❏Integration Into E
xisting Curricula
❏Interdisciplinary A
ctivity
❏Lecture
❏S
cience and Mathem
atics
❏Team
Activities
Standards Integration
❏O
ther:P
lease specify:
7.W
here did you learn about this educator guide?
❏N
AS
A E
ducator Resource C
enter
❏N
AS
A C
entral Operation of R
esources for Educators (C
OR
E)
❏Institution/S
chool System
❏F
ellow E
ducator
❏W
orkshop/Conference
❏O
ther:P
lease specify:
8.W
hat features of this educator guide did you find particularly helpful?
9.H
ow can w
e make this educator guide m
ore effective for you?
10.Additional com
ments:
Today’s Date:
Please take a m
om
ent to
respo
nd
to th
e statemen
ts and
qu
estion
s belo
w.
You
can su
bm
it you
r respo
nse th
rou
gh
the In
ternet o
r by mail.S
end
you
rrep
ly to th
e follo
win
g In
ternet ad
dress:
http
://ehb
2.gsfc.n
asa.gov/ed
cats/edu
cator_g
uid
e
You
will th
en b
e asked to
enter yo
ur d
ata at the ap
pro
priate p
rom
pt.
EG
-2001-01-122-HQ
Fold along line and tape closed.
* Space Based Atronomy.b/w 2/28/01 8:54 AM Page 101

Please PlaceStamp HerePost Office
Will Not DeliverWithout Proper
Postage
NATIONAL AERONAUTICS AND SPACE ADMINISTRATIONEDUCATION DIVISIONMAIL CODE FEWASHINGTON DC 20546–0001
Fold along line and tape closed.
!2054600012!
* Space Based Atronomy.b/w 2/28/01 8:54 AM Page 102