space systems cost study final report
TRANSCRIPT
• ... . . - -- = Ju =_A =- .. . . .. . . . - -- .=.
UI FILE COPICOPY 80F14
O.4
DTIC
SPACE SYSTEMSCOST STUDY
FINAL REPORT
I ~ISBIU'0O ST~t3lr
PREPARED BY:
MARTIN MARIETTA ASTRONAUTICS
PARAMETRIC ESTIMATING SYSTEMS DEPARTMENT
4"0

SPACE SYSTEMS COST STUDY
FINAL REPORTDT!C
SELECTE
SPONSORED BY:
DEFENSE ADVANCED RESEARCH PROJECTS AGENCY (DOD)
DARPA/STO
SPACE SYSTEM COST STUDY
ARPA ORDER NO: 6255, PCN 71220 ___________________m
ISSUED BY DARPA/CMO Approved for public rel~oeasPtstzibution Uniitd A'
UNDER CONTRACT # MDA972-87-C-0005
PREPARED BY:
MARTIN MARIETTA ASTRONAUTICS
PARAMETRIC ESTIMATING SYSTEMS DEPARTMENT
M.P. D 2800
P. 0. BOX 17 9
DENVER, COLORADO 80 20 1
h
UNCLASSIFI ED
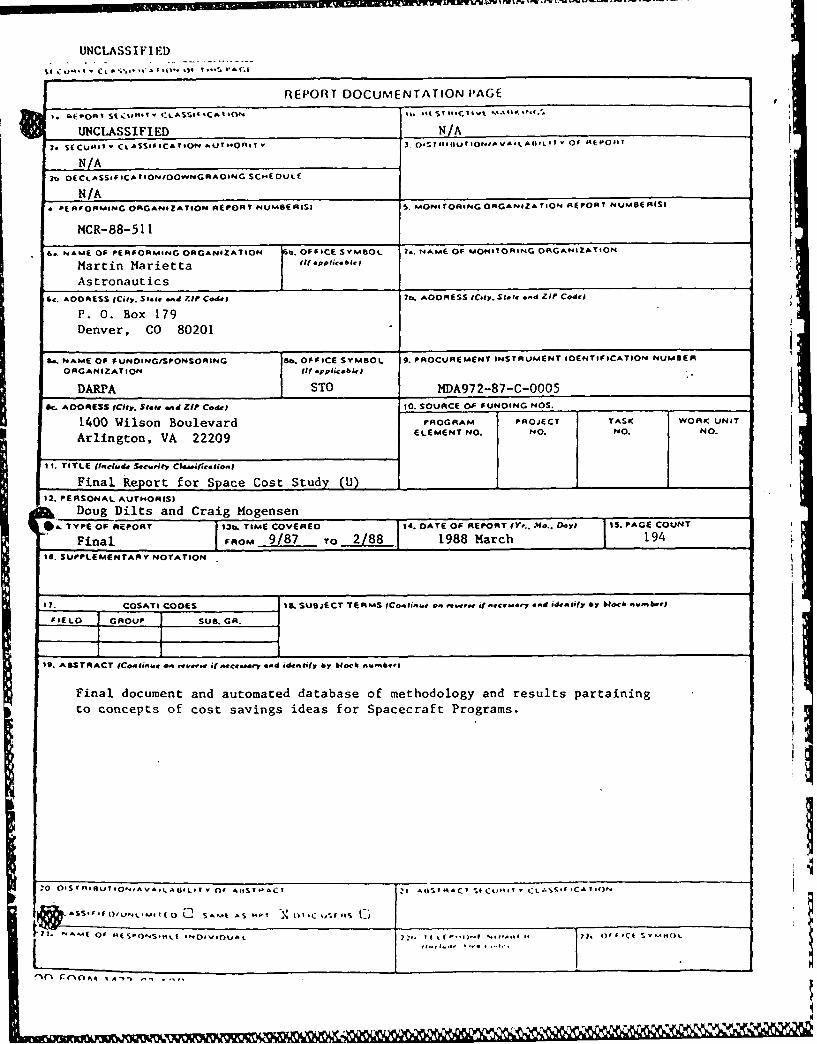
REPORT DOCUMENTATION PAGE
0.064O 1 St .AIJ- I :L A SS6.4c CA% soft 11.*i 1e.?'t *'
UNCLASSIFIED N/A7. St CUO#I. CIL A SI6PICA T ION &UTMOASR 1 3. 0,rTI IIIO IONOAVAIL A (110 1 0' 'EPO'
N/A?b OECi ASSISPICA IONIOWNGRAOING SCHE OULf
N/A__ _ _ _ _ _ _ _ _ _ _ _ _ _ _ _ _ _ _ _ _
A E RFOR&AING ORGANIZATION REPORT NUK40C RISI 5. MONOITORING ORGANI1ZAT7ION REPORT NUMSERIS1
fs. NAME Of: PERFORMINIG ORGANIZATION b. OF 0:ICE SYMBOL ?4. NAME OF MONITORING ORGANIZATION
Martin Marietta 11plcbe
Astronautics6c. AOORESS lCity. Sl.Et and 7.1F Code) 7b. AOORESS 1C.1y. Si.1, .. d ZIP C0410
P. 0. Box 179Denver, CO 80201
S.. NAME OF FUNOINGISPONSOING Wab OFFICE SYMBOL 9. PROCUREMENT INSTRUMENT IOENTIFICATION NUMABER
ORGANIZATION Ill' ."PpicobleI
DARPA STO MDA972-87--C-0005Ike. ADORESS (City. St.## II44 Zip Codep 10. SOURCE Of FUNOING NOS.
1400 Wilson Boulevard PROGRAM PROJECT TASK WORK UNIT
Arlington, VA 22209 ELEMENT NO. NO0. No.No
itI. TI TLE iI.'.u4t sec,4y cI."iic.lion
Final Report for Space Cost Study (U) ______________________
12. PERSONAL AUTHOR(SI
Doug Dilts and Craig MogensenID. TYPE OF REPORT 1 3b. TIME COVEREO 1.OATE OF REPORT IYV.. Mo.. D.yl I5. PA GE COUNT
Final 1ROM 9/87 To 2/88 *j 1988 March 1941C. SUPPLEMENTARY NOTATION
17. COSATI COOES MS SUSjECT TERMS $Cotinu.e on .vw...4fecamoy and identify by block nuber#
FIELO1 GROUP I SUB. GR.
19. ABSTRACT (Co4EM... , ,wmvrM i("ceM.'v, and identifty by block& num..bo's
Final document and automated database of methodology and results partainingto concepts of cost savings ideas for Spacecraft Programs.
o 0 -STI' AUIIONAVA,.oLUII of AIISTP-cI IAJAC &t'
R 'A ( Of *iES-oNS,j. E" It~~tu kf01111 ).0 C -O
INC uwvwrun 0, U
I csio dFo
NTIS CRA&MDTIC TAB 0Unannbounced 0Justification
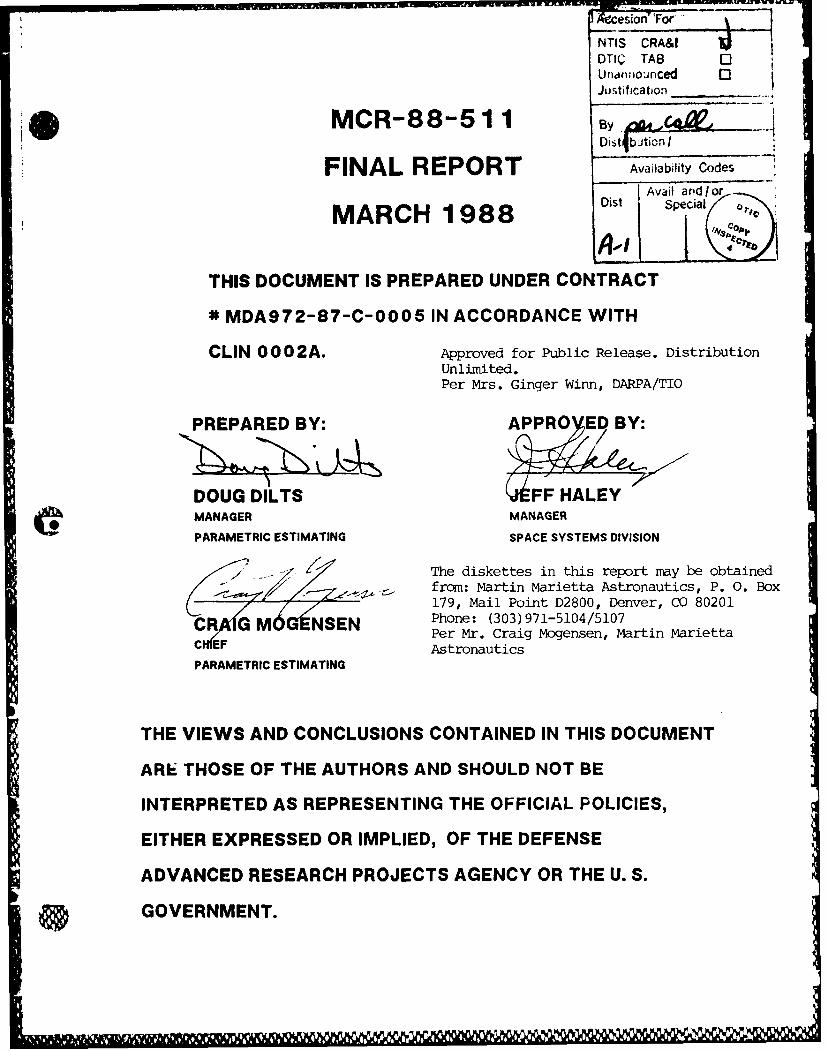
MCR-88-511 ByDistb tion I
FINAL REPORT Availability Codes
Avail and/or -MDist Special
THIS DOCUMENT IS PREPARED UNDER CONTRACT
* MDA972-87-C-0005 IN ACCORDANCE WITH
CLIN 0002A. Approved for Public Release. DistributionUnlimited.
Per Mrs. Ginger Winn, DARPA/TIO
PREPARED BY: APPROXED BY:
DOUG DILTS EFF HALEYMANAGER MANAGER
PARAMETRIC ESTIMATING SPACE SYSTEMS DIVISION
The diskettes in this report may be obtained" Efrom: Martin Marietta Astronautics, P. 0. Box
179, Mail Point D2800, Denver, CO 80201CR G M6 NSEN Phone: (303)971-5104/5107
Per Mr. Craig Mogensen, Martin MariettaC:IEF AstronauticsPARAMETRIC ESTIMATING
THE VIEWS AND CONCLUSIONS CONTAINED IN THIS DOCUMENT
ARE THOSE OF THE AUTHORS AND SHOULD NOT BE
INTERPRETED AS REPRESENTING THE OFFICIAL POLICIES,
EITHER EXPRESSED OR IMPLIED, OF THE DEFENSE
ADVANCED RESEARCH PROJECTS AGENCY OR THE U. S.
SGOVERNMENT.
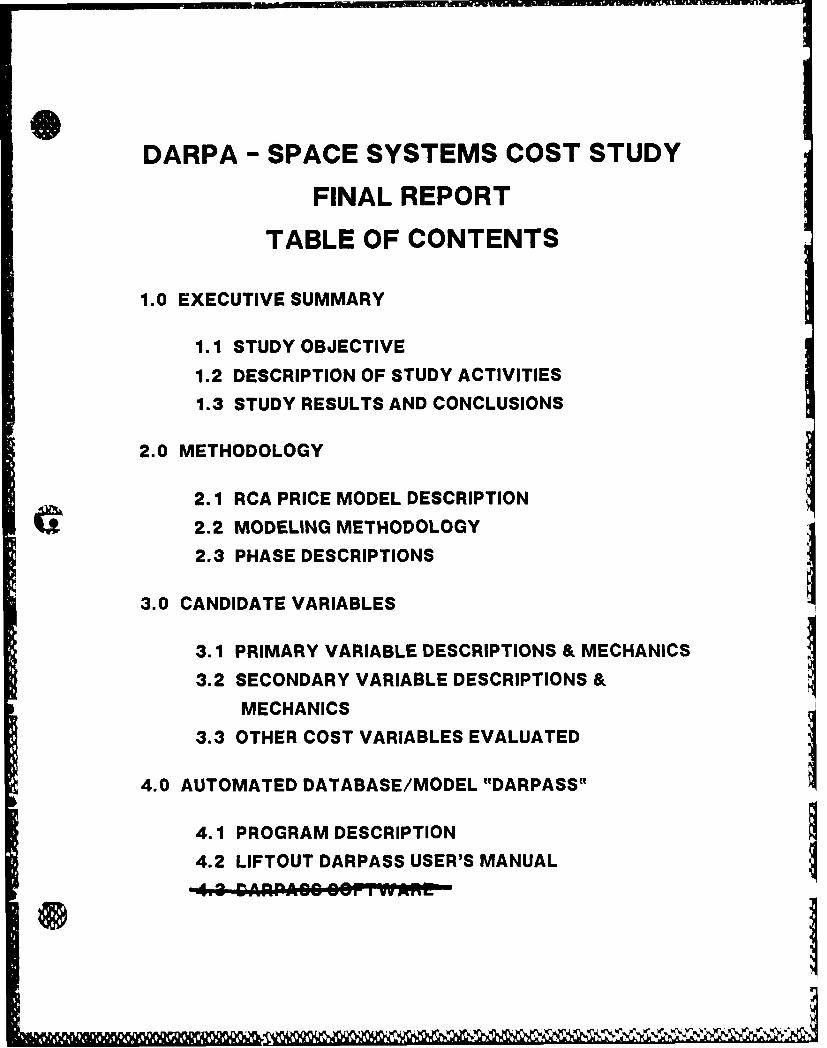
DARPA - SPACE SYSTEMS COST STUDY
FINAL REPORT
TABLE OF CONTENTS
1.0 EXECUTIVE SUMMARY
1.1 STUDY OBJECTIVE
1.2 DESCRIPTION OF STUDY ACTIVITIES
1.3 STUDY RESULTS AND CONCLUSIONS
2.0 METHODOLOGY
2.1 RCA PRICE MODEL DESCRIPTION
2.2 MODELING METHODOLOGY
2.3 PHASE DESCRIPTIONS
3.0 CANDIDATE VARIABLES
3.1 PRIMARY VARIABLE DESCRIPTIONS & MECHANICS3.2 SECONDARY VARIABLE DESCRIPTIONS &MECHANICS
3.3 OTHER COST VARIABLES EVALUATED
4.0 AUTOMATED DATABASE/MODEL "DARPASS t I4.1 PROGRAM DESCRIPTION
4.2 LIFTOUT DARPASS USER'S MANUAL
.. .. ~I, .. .. II v v I IIIl r nr-
1.2 "nroc O~i
1.0 EXECUTIVE SUMMARY
1.1 STUDY OBJECTIVE
-- The objective of the "Space System Cost Study,"contract MDA972-87CUU5, was to develop a methodologyand automated database/model that would enable DARPA toevaluate *low cost satellite" programs and appropriatecost reduction approaches. i
1.2 DESCRIPTION OF STUDY ACTIVITIES
The initial step in this cost study was to derive anestimate for developing and producing a "light"satellite under "business as usual" conditions. Theseconditions include a "start from scratch" philosophyand all the traditional operating procedures anddocumentation associated with building a reliablespacecraft.
The Martin Marietta "Lightsat" early conceptual designwas selected as the baseline from which all tradeswould be performed. The selection of the baselinedesign was an arbitrary decision based on availabledata. The analysis could have been accomplished with
cany contractor's conceptual design.
The significance of the baseline cost modeling effortwas to determine a cost estimate that would representthe current culture of the satellite industry. Thisculture generally follows a "business as usual," "startfrom scratch" development approach. The concept ofsatellite production, especially a low cost version,appears to be a deviation from the current industryculture.
The baseline program emulates a typical Space Division(U. S. Air Force Space Division) Mil-Std 1450B-typespacecraft. The vehicle mission type used for theanalysis is a communications-radio relay spacecraft,selected because one of the early DARPA spacecraftmissions is projected to be of this variety.
The cost estimates and trades to the baseline developedas a result of this study, are applicable to anyspacecraft that contains a similar functional mix ofstructure, payload, and electronics. Larger spacecraftwith a different mix of the aforementioned items maynot experience the same degree of potential costbenefits as the communications-radio relay vehicle.
EXECUTIVE SUMMARY - I
a!
The modeling process included evaluating three distinctphases of hardware and software activities: theDevelopment Phase, the Produceability Engineering Phase(PEP), and the Production Phase. These three phasesare described below.
The first phase was the Development, or Design andDemonstration Phase. The scope of this activityencompassed the modeling of 112 discrete items andtasks. Included were: software, test equipment,tests, analysis, structural items, electroniccomponents, mechanical items, and various managementtasks. The major end products of the Development Phasewere two protoflight communication-radio relayspacecraft, MAGE (Mechanical Assembly GroundEquipment), and EAGE (Electronic Assembly GroundEquipment) required to support the flight unit'sdevelopment and launch integration.
The second phase was the Produceability EngineeringPhase (PEP). PEP was intended to clean up the designand consolidate the changes resulting from theDemonstration Phase. Additional PEP activitiesaccounted for production changes to the hardware,tooling, test requirements, and process specifications,enabling the communications-radio relay satellite to beproduced in quantity. The investment in tools and testequipment required to meet the production rate werealso included in the PEP activity.
The final phase involved the actual production of thelow cost satellite vehicles. Several productionquantities were evaluated: 5, 25, 50, 100, and 150. Aproduction rate of five vehicles per month was achievedfor quantities of 100 and 150 with somewhat lowerproduction rates for lower production quantities. Theproduction effort assumed a "build to print" effortwith moderate levels of change traffic. All build andtest support tools/fixtures were included in the PEPphase, while the production phase addressed only thebuilding, assembling, integrating, and testing of thespacecraft and spacecraft parts.
A detailed description of the scope of effort for eachphase is contained in section 2.3 of this report.
The baseline program included cost values for eachdiscrete item (up to 112) for the three phases ofeffort: Development, PEP, and Production. The 112discrete items modeled and their costs were containedin the automated database/model. Each item that wasaddressed during the Development Phase was carriedthrough the PEP and Production Phases, if appropriate.
IEXECUTIVE SUMMARY - 2
,I

After the baseline program cost values were established(modeled), a list of candidate cost variables wasestablished. These variables represent cost reductionapproaches that address virtually all elementscomprising the total program cost. The list ofcandidate variables was divided into Primary andSecondary Cost Variables.
The Primary Cost Variables were targeted as items thatcould be controlled by the contracting agency. Thiscontrol could be exerted either by specifications orspecial instructions to exclude/include the activityfrom a normal spacecraft development approach.
The Secondary Cost Variables were items that wouldprobably be controlled by the contractor. Thecontracting agency may have an influence on these costvariables, but the ultimate control responsibilityrests with the contractor. Controlling these costelements often becomes a management challenge todiverge from current culture.
All of the investigated candidate variables had apotential for program cost savings. Each had threeoptions or degrees of sensitivity. This implied thatthe activities associated with candidate variablescould be implemented completely or as a subset.
The automated database/model (DARPASS) contains thecost results for each item/task for each candidatevariable (Primary and Secondary) and the three optionsfor each. The total number of results derived as aproduct of this study exceeds 45,000.
1.3 STUDY RESULTS AND CONCLUSIONS
The results of the study have identified severaldiscrete areas of legitimate cost savings. Elevencandidate variables were evaluated in detail; fivePrimary and six Secondary Cost Variables. Eachvariable had its own unique impact on the Development,PEP, and Production Phases.
Some Cost Variables exhibited large cost savings in onephase and may have exhibited a large cost investment inanother phase because to achieve a cost savings, aninvestment in equipment/design or another resource mayhave to be made. Many of the Cost Variables showed acost savings/investment in only one or two of the threephases. Where no cost savings/investments values werepresent, these results indicated that there was no costimpact associated with the variable in those particularphases.
EXECUTIVE SUMMARY - 3
The baseline cost values for the "Light Satellite"conceptual design are displayed in Table 1.3.0. Asstated previously, these values rcrresent the "businessas usual" approach to developing the space hardware.The values for Cost Variables one through 11 aredisplayed in Tables 1.3.1.$ to 1.3.11.$. There arethree unique cost tables for each Cost Variable thatcorrespond to the three options evaluated for eachvariable. Each table contains the data for the threephases: Development, PEP, and Production.
The percent savings/investments by phase are also shownin Tables 1.3.1.% to 1.3.11.%. The savings arerepresented by positive values, while the costinvestments (increases) are displayed as negativevalues. As with cost, there are three unique percenttables for each Cost Variable that correspond to thethree options evaluated for each variable.
The percent values displayed in these tables are thecost savings and investment derived when the CostVariables are applied independently of one another.The savings and investment values change when CostVariables are applied concurrently. Generally, thecost savings over the baseline would increase whenapplying multiple variables. The mechanisms foraccomplishing this process are included in the DARPASSProgram.
--;The methodology and results are based on a pointconceptual design. For the government to see theappropriate Aime phased'impact the parametric grouprecommends that when wLightsat"lis awarded, an actualcharacterization be generated and that characterizationlive with the design and build life cycle. Real-timeadjustments and decisions (cost and schedule) can beimplemented from DARPASS data to arrive at the lowestpossible program cost. h
IEXECUTIVE SUMMARY - 4

jru.ErUWWj wxwwu.A n--
DARPA - SPACE SYSTEM COST STUDYBASELINE COSTS
FEBRUARY 4, 1988(TABLE 1.3.0)
BASELINE: MAJOR ELEMENTS
o TYPICAL SPACE DIVISION PROGRAMo PEP INCLUDES RF AND C&DH SUBSYSTEM RE-DESIGNo PRODUCTION IS CONTINUOUS BUILDo FUNDING IS NOT A CONSTRAINTo SCHEDULE - DEVELOPMENT = 30 MONTHS, PEP = 20 MONTHS,
PRODUCTION = 48 MONTHS
TOTAL COSTS - THROUGH G&A: (xlOOO)
UNIT QUANTITY DEVELOPMENT PEP PRODUCTION TOTAL
DEVELOPMENT $47,323.8 $47,323.85 $12,850.6 $31,811.0 $44,661.6
25 $16,181.0 $96,402.2 $112,583.250 $20,062.6 $147,291.3 $167,353.9
100 $24,742.0 $232,213.7 $256,955.7150 $32,274.3 $315,319.3 $347,593.6
UNIT COSTS - THROUGH G&A: (xl000)
AVERAGE UNIT COST BY SEGMENT
UNIT QUANTITY DEVELOPMENT PEP PRODUCTION TOTAL
2 $23,661.9 $23,661.95 $9,464.8 $2,570.1 $6,362.2 $18,397.1
25 $1,893.0 $647.2 $3,856.1 $6,396.350 $946.5 $401.3 $2,945.8 $4,293.6100 $473.2 $247.4 $2,322.1 $3,042.8150 $315.5 $215.2 $2,102.1 $2,632.8
EXECUTIVE SUMMARY - 5
IDARPA - SPACE SYSTEM COST STUDY
VARIABLE 1OPTION 1
(TABLE 1.3.1.$)
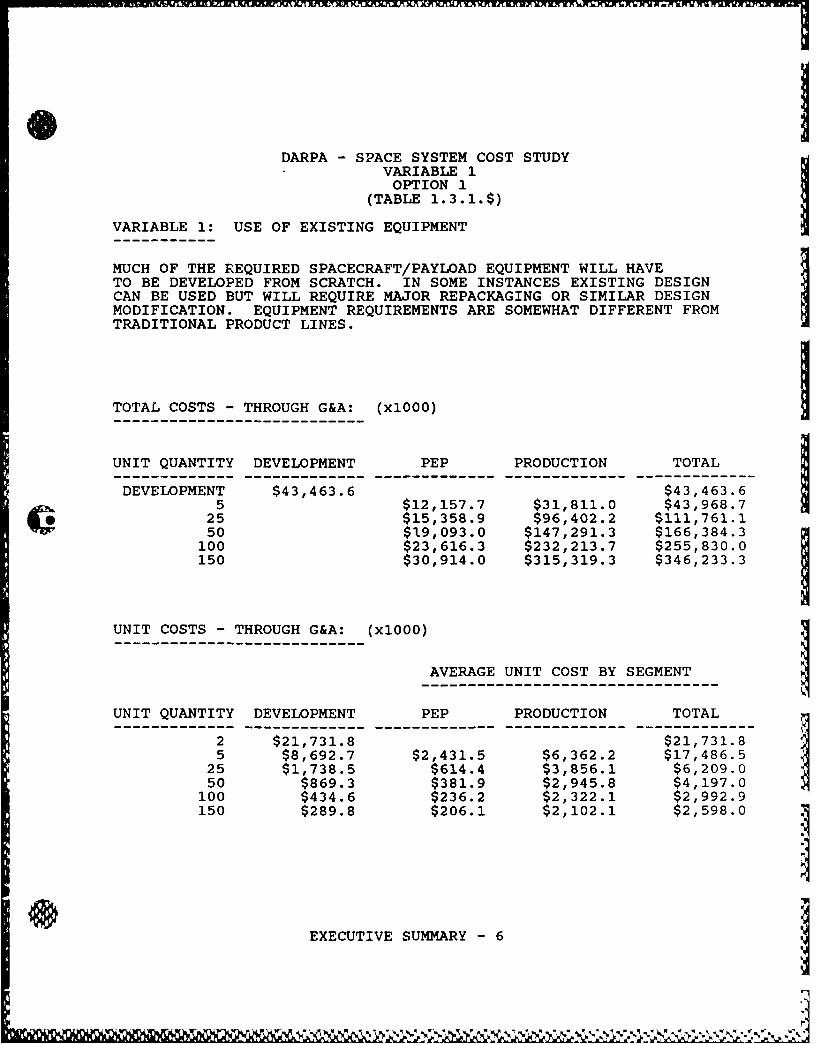
VARIABLE 1: USE OF EXISTING EQUIPMENT
MUCH OF THE REQUIRED SPACECRAFT/PAYLOAD EQUIPMENT WILL HAVETO BE DEVELOPED FROM SCRATCH. IN SOME INSTANCES EXISTING DESIGNCAN BE USED BUT WILL REQUIRE MAJOR REPACKAGING OR SIMILAR DESIGNMODIFICATION. EQUIPMENT REQUIREMENTS ARE SOMEWHAT DIFFERENT FROMTRADITIONAL PRODUCT LINES.
TOTAL COSTS - THROUGH G&A: (xlOOO)
UNIT QUANTITY DEVELOPMENT PEP PRODUCTION TOTAL
DEVELOPMENT $43,463.6 $43,463.65 $12,157.7 $31,811.0 $43,968.7
25 $15,358.9 $96,402.2 $111,761.150 $19,093.0 $147,291.3 $166,384.3
100 $23,616.3 $232,213.7 $255,830.0150 $30,914.0 $315,319.3 $346,233.3
UNIT COSTS - THROUGH G&A: (xlOOO)
AVERAGE UNIT COST BY SEGMENT
UNIT QUANTITY DEVELOPMENT PEP PRODUCTION TOTAL
2 $21,731.8 $21,731.85 $8,692.7 $2,431.5 $6,362.2 $17,486.5
25 $1,738.5 $614.4 $3,856.1 $6,209.050 $869.3 $381.9 $2,945.8 $4,197.0100 $434.6 $236.2 $2,322.1 $2,992.9150 $289.8 $206.1 $2,102.1 $2,598.0
EXECUTIVE SUMMARY - 6
V "
~]

DARPA - SPACE SYSTEM COST STUDYVARIABLE 1OPTION 1
(TABLE 1.3.1.%)
VARIABLE 1: USE OF EXISTING EQUIPMENT
MUCH OF THE REQUIRED SPACECRAFT/PAYLOAD EQUIPMENT WILL HAVETO BE DEVELOPED FROM SCRATCH. IN SOME INSTANCES EXISTING DESIGNCAN BE USED BUT WILL REQUIRE MAJOR REPACKAGING OR SIMILAR DESIGNMODIFICATION. EQUIPMENT REQUIREMENTS ARE SOMEWHAT DIFFERENT FROMTRADITIONAL PRODUCT LINES.
COST EFFECTS: PERCENT CHANGE FROM BASELINE COSTS
UNIT QUANTITY DEVELOPMENT PEP PRODUCTION TOTAL
DEVELOPMENT 8.2% 8.2%5 5.4% 0.0% 1.6%
25 5.1% 0.0% 0.7%50 4.8% 0.0% 0.6%
100 4.5% 0.0% 0.4%150 4.2% 0.0% 0.4%
DST EFFECTS: PERCENT CHANGE FROM BASELINE COSTS
AVERAGE UNIT COST BY SEGMENT
UNIT QUANTITY DEVELOPMENT PEP PRODUCTION TOTAL
2 8.2% 8.2%5 8.2% 5.4% 0.0% 4.9%
25 8.2% 5.1% 0.0% 2.9%50 8.2% 4.8% 0.0% 2.2%
100 8.2% 4.5% 0.0% 1.6%150 8.2% 4.2% 0.0% 1.3%
EXECUTIVE SUMMARY - 7
DARPA - SPACE SYSTEM COST STUDYVARIABLE 1OPTION 2
(TABLE 1.3.1.$)
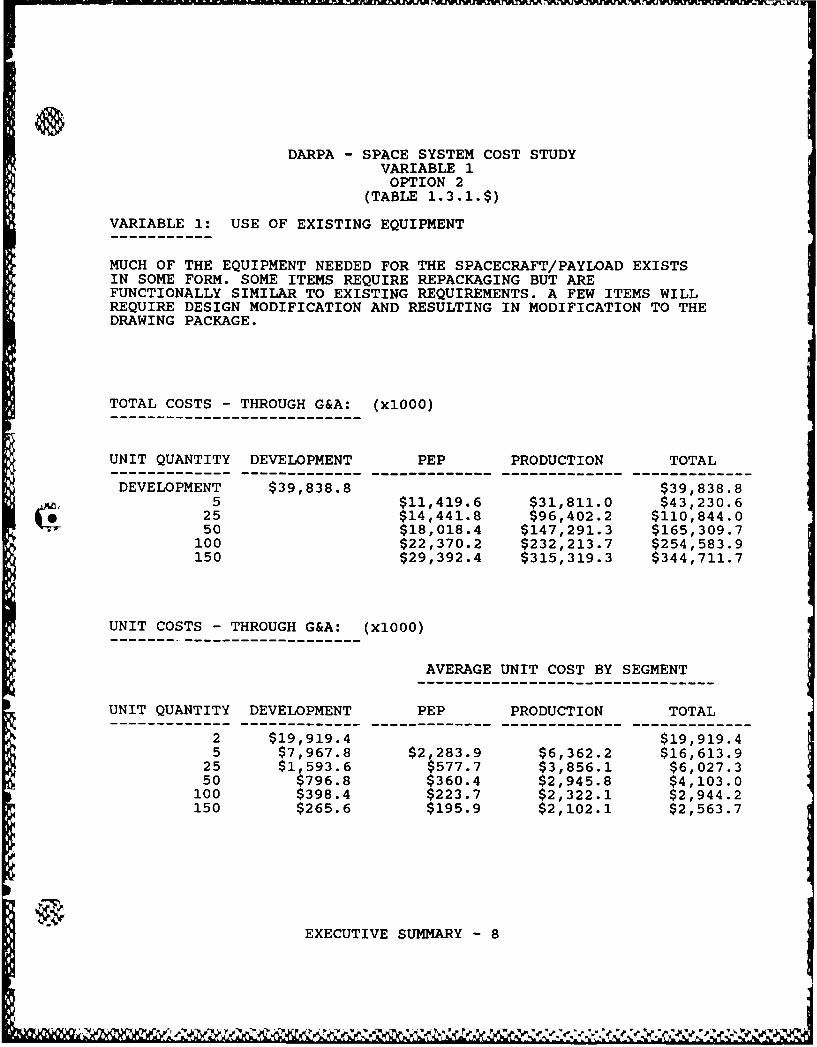
VARIABLE 1: USE OF EXISTING EQUIPMENT
MUCH OF THE EQUIPMENT NEEDED FOR THE SPACECRAFT/PAYLOAD EXISTSIN SOME FORM. SOME ITEMS REQUIRE REPACKAGING BUT AREFUNCTIONALLY SIMILAR TO EXISTING REQUIREMENTS. A FEW ITEMS WILLREQUIRE DESIGN MODIFICATION AND RESULTING IN MODIFICATION TO THEDRAWING PACKAGE.
TOTAL COSTS - THROUGH G&A: (xlOOO)
UNIT QUANTITY DEVELOPMENT PEP PRODUCTION TOTAL
DEVELOPMENT $39,838.8 $39,838.85 $11,419.6 $31,811.0 $43,230.6
25 $14,441.8 $96,402.2 $110,844.050 $18,018.4 $147,291.3 $165,309.7
100 $22,370.2 $232,213.7 $254,583.9150 $29,392.4 $315,319.3 $344,711.7
UNIT COSTS - THROUGH G&A: (xlOOO)
AVERAGE UNIT COST BY SEGMENT
UNIT QUANTITY DEVELOPMENT PEP PRODUCTION TOTAL
2 $19,919.4 $19,919.45 $7,967.8 $2,283.9 $6,362.2 $16,613.9
25 $1,593.6 $577.7 $3,856.1 $6,027.350 $796.8 $360.4 $2,945.8 $4,103.0
100 $398.4 $223.7 $2,322.1 $2,944.2150 $265.6 $195.9 $2,102.1 $2,563.7
EXECUTIVE SUMMARY - 8
DARPA - SPACE SYSTEM COST STUDYVARIABLE 1
OPTION 2(TABLE 1.3.1.%)
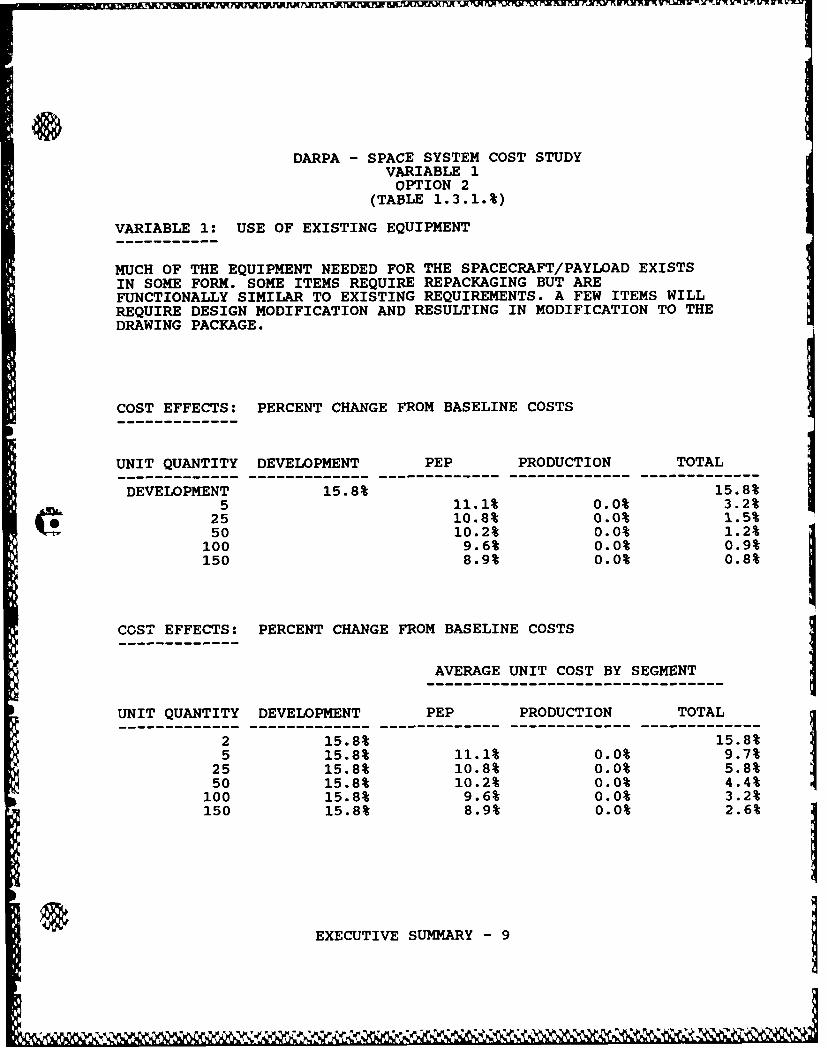
VARIABLE 1: USE OF EXISTING EQUIPMENT
MUCH OF THE EQUIPMENT NEEDED FOR THE SPACECRAFT/PAYLOAD EXISTSIN SOME FORM. SOME ITEMS REQUIRE REPACKAGING BUT AREFUNCTIONALLY SIMILAR TO EXISTING REQUIREMENTS. A FEW ITEMS WILLREQUIRE DESIGN MODIFICATION AND RESULTING IN MODIFICATION TO THEDRAWING PACKAGE.
COST EFFECTS: PERCENT CHANGE FROM BASELINE COSTS
UNIT QUANTITY DEVELOPMENT PEP PRODUCTION TOTAL
---------------------- ------------- ------------- --- --------- -------------
DEVELOPMENT 15.8% 15.8%5 11.1% 0.0% 3.2%
25 10.8% 0.0% 1.5%50 10.2% 0.0% 1.2%
100 9.6% 0.0% 0.9%150 8.9% 0.0% 0.8%
COST EFFECTS: PERCENT CHANGE FROM BASELINE COSTS
AVERAGE UNIT COST BY SEGMENT
UNIT QUANTITY DEVELOPMENT PEP PRODUCTION TOTAL
15.8% 11.1% 0.0% 9.7%25 15.8% 10.8% 0.0% 5.8%50 15.8% 10.2% 0.0% 4.4%
100 15.8% 9.6% 0.0% 3.2%150 15.8% 8.9% 0.0% 2.6%
EXECUTIVE SUMMARY - 9.(

DARPA - SPACE SYSTEM COST STUDYVARIABLE 1OPTION 3
(TABLE 1.3.1.$)
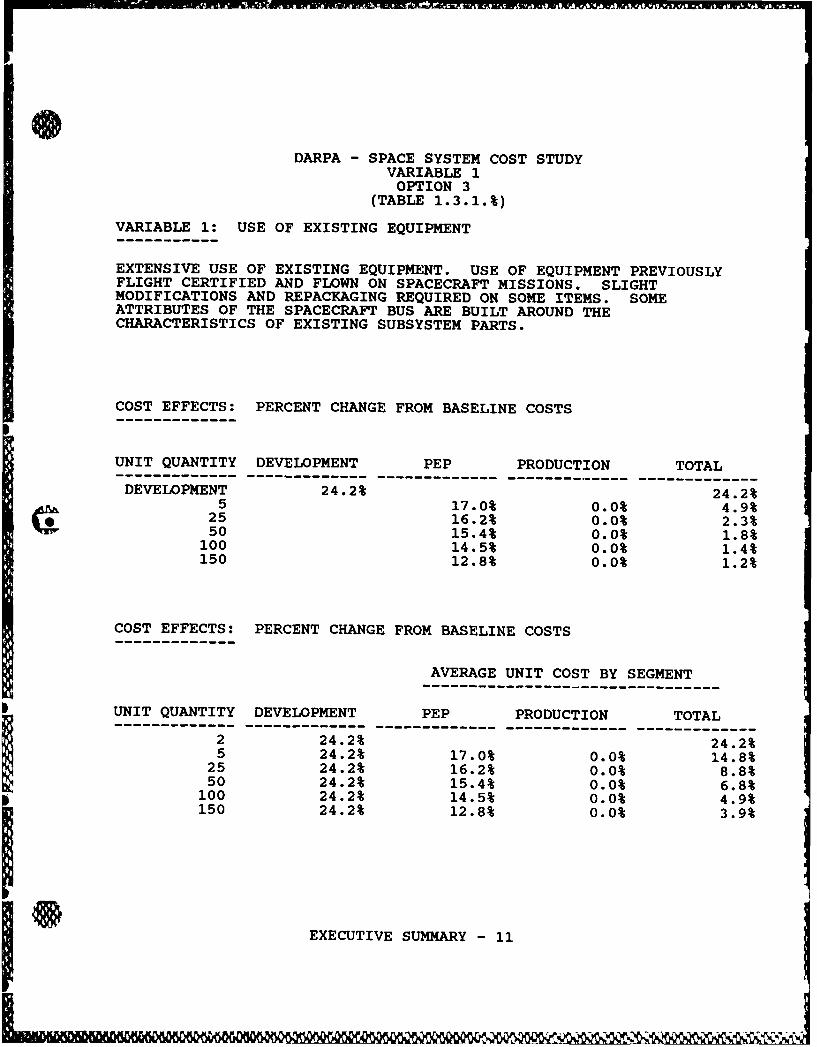
VARIABLE 1: USE OF EXISTING EQUIPMENT
EXTENSIVE USE OF EXISTING EQUIPMENT. USE OF EQUIPMENT PREVIOUSLYFLIGHT CERTIFIED AND FLOWN ON SPACECRAFT MISSIONS. SLIGHTMODIFICATIONS AND REPACKAGING REQUIRED ON SOME ITEMS. SOMEATTRIBUTES OF THE SPACECRAFT BUS ARE BUILT AROUND THECHARACTERISTICS OF EXISTING SUBSYSTEM PARTS.
TOTAL COSTS - THROUGH G&A: (xlOOO)
UNIT QUANTITY DEVELOPMENT PEP PRODUCTION TOTAL
DEVELOPMENT $35,877.5 $35,877.55 $10,664.3 $31,811.0 $42,475.3
25 $13,561.8 $96,402.2 $109,964.050 $16,973.7 $147,291.3 $164,265.0
100 $21,157.9 $232,213.7 $253,371.6150 $28,147.6 $315,319.3 $343,466.9
UNIT COSTS - THROUGH G&A: (xlOOO)
AVERAGE UNIT COST BY SEGMENT
UNIT QUANTITY DEVELOPMENT PEP PRODUCTION TOTAL
2 $17,938.8 $17,938.85 $7,175.5 $2,132.9 $6,362.2 $15,670.6
25 $1,435.1 $542.5 $3,856.1 $5,833.750 $717.6 $339.5 $2,945.8 $4,002.8100 $358.8 $211.6 $2,322.1 $2,892.5150 $239.2 $187.7 $2,102.1 $2,529.0
EXECUTIVE SUMMARY - 10
,jj I
DARPA - SPACE SYSTEM COST STUDYVARIABLE 1OPTION 3
(TABLE 1.3.1.%)
VARIABLE 1: USE OF EXISTING EQUIPMENT
EXTENSIVE USE OF EXISTING EQUIPMENT. USE OF EQUIPMENT PREVIOUSLYFLIGHT CERTIFIED AND FLOWN ON SPACECRAFT MISSIONS. SLIGHTMODIFICATIONS AND REPACKAGING REQUIRED ON SOME ITEMS. SOMEATTRIBUTES OF THE SPACECRAFT BUS ARE BUILT AROUND THECHARACTERISTICS OF EXISTING SUBSYSTEM PARTS.
COST EFFECTS: PERCENT CHANGE FROM BASELINE COSTS
UNIT QUANTITY DEVELOPMENT PEP PRODUCTION TOTAL------------ ------------- ------------- ------------- -------------DEVELOPMENT 24.2% 24.2%
A 5 17.0% 0.0% 4.9%25 16.2% 0.0% 2.3%50 15.4% 0.0% 1.8%100 14.5% 0.0% 1.4%150 12.8% 0.0% 1.2%
COST EFFECTS: PERCENT CHANGE FROM BASELINE COSTS
AVERAGE UNIT COST BY SEGMENT---------------------------------------------
UNIT QUANTITY DEVELOPMENT PEP PRODUCTION TOTAL------------ ------------- ------------- ------------- -------------
2 24.2% 24.2%5 24.2% 17.0% 0.0% 14.8%25 24.2% 16.2% 0.0% 8.8%
50 24.2% 15.4% 0.0% 6.8%100 24.2% 14.5% 0.0% 4.9%150 24.2% 12.8% 0.0% 3.9%
EXECUTIVE SUMMARY - 11
JvvJ
DARPA - SPACE SYSTEM COST STUDYVARIABLE 2OPTION 1
(TABLE 1.3.2.$)
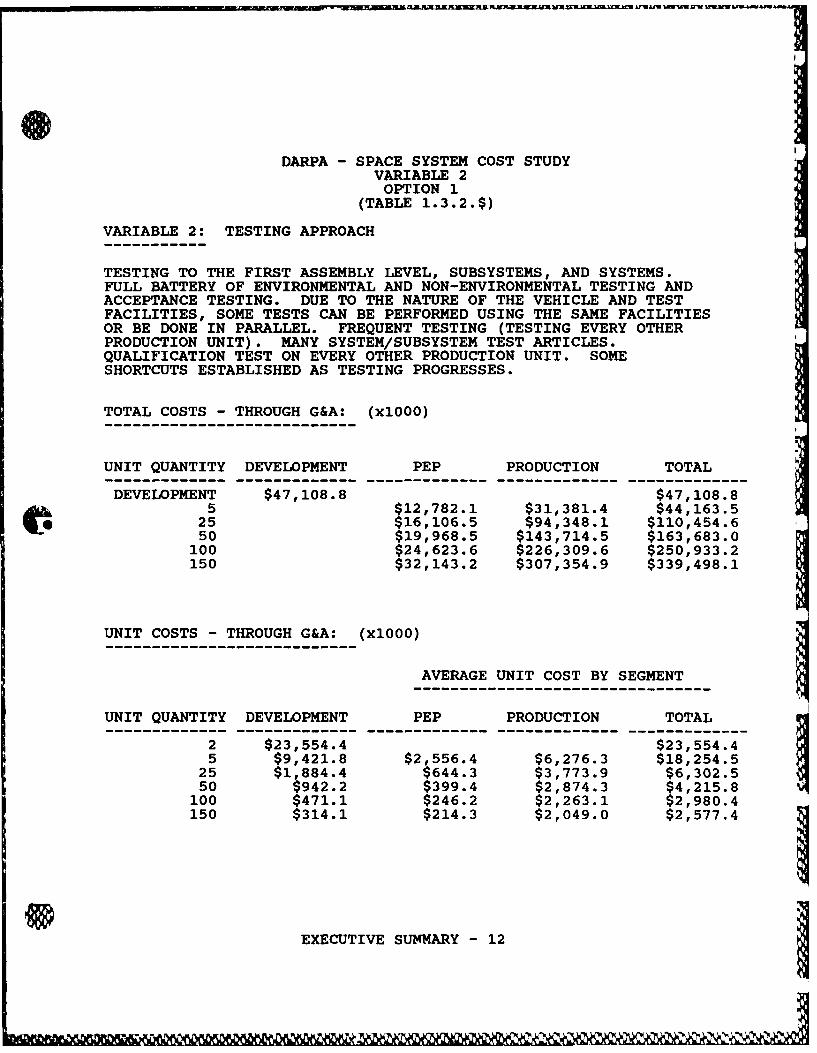
VARIABLE 2: TESTING APPROACH
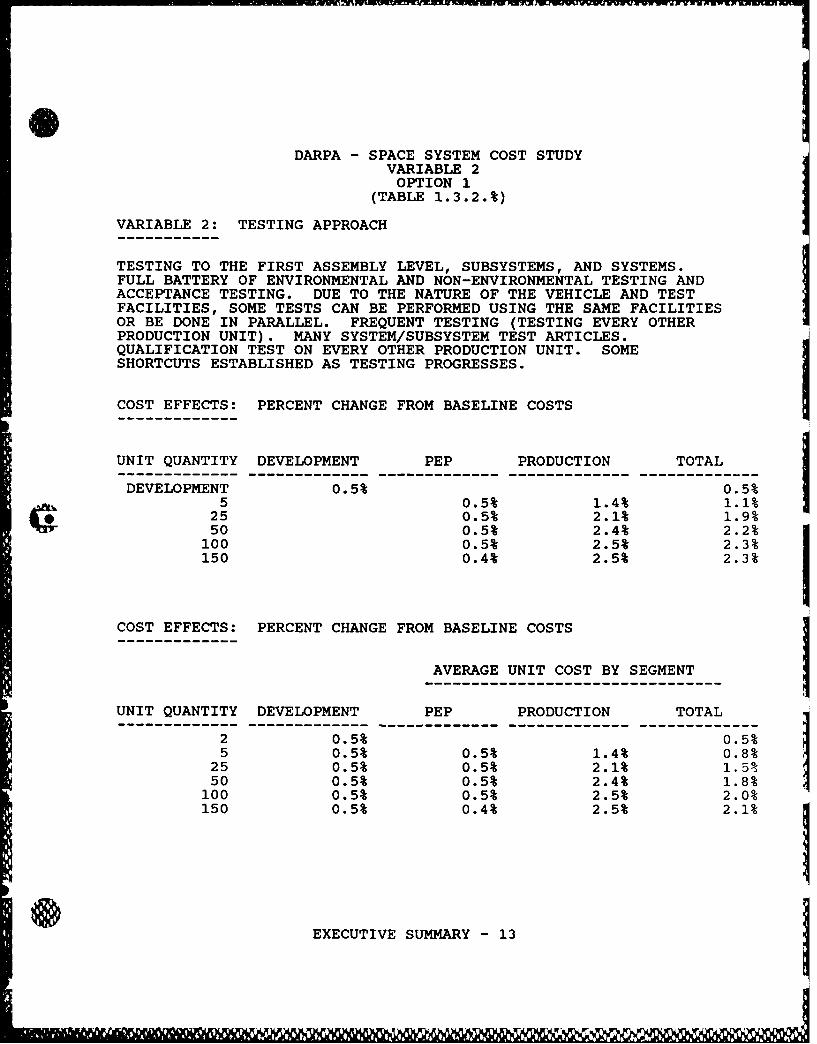
TESTING TO THE FIRST ASSEMBLY LEVEL, SUBSYSTEMS, AND SYSTEMS.FULL BATTERY OF ENVIRONMENTAL AND NON-ENVIRONMENTAL TESTING ANDACCEPTANCE TESTING. DUE TO THE NATURE OF THE VEHICLE AND TESTFACILITIES, SOME TESTS CAN BE PERFORMED USING THE SAME FACILITIESOR BE DONE IN PARALLEL. FREQUENT TESTING (TESTING EVERY OTHERPRODUCTION UNIT). MANY SYSTEM/SUBSYSTEM TEST ARTICLES.QUALIFICATION TEST ON EVERY OTHER PRODUCTION UNIT. SOMESHORTCUTS ESTABLISHED AS TESTING PROGRESSES.
TOTAL COSTS - THROUGH G&A: (xl000)
UNIT QUANTITY DEVELOPMENT PEP PRODUCTION TOTAL
DEVELOPMENT $47,108.8 $47,108.85 $12,782.1 $31,381.4 $44,163.5
25 $16,106.5 $94,348.1 $110,454.650 $19,968.5 $143,714.5 $163,683.0
100 $24,623.6 $226,309.6 $250,933.2150 $32,143.2 $307,354.9 $339,498.1
UNIT COSTS - THROUGH G&A: (xlOOO)
AVERAGE UNIT COST BY SEGMENT
UNIT QUANTITY DEVELOPMENT PEP PRODUCTION TOTAL
2 $23,554.4 $23,554.45 $9,421.8 $2,556.4 $6,276.3 $18,254.5
25 $1,884.4 $644.3 $3,773.9 $6,302.550 $942.2 $399.4 $2,874.3 $4,215.8
100 $471.1 $246.2 $2,263.1 $2,980.4150 $314.1 $214.3 $2,049.0 $2,577.4
EXECUTIVE SUMMARY - 12
vt~vvw
0DARPA - SPACE SYSTEM COST STUDY
VARIABLE 2OPTION 1
(TABLE 1.3.2.%)
VARIABLE 2: TESTING APPROACH
TESTING TO THE FIRST ASSEMBLY LEVEL, SUBSYSTEMS, AND SYSTEMS.FULL BATTERY OF ENVIRONMENTAL AND NON-ENVIRONMENTAL TESTING ANDACCEPTANCE TESTING. DUE TO THE NATURE OF THE VEHICLE AND TESTFACILITIES, SOME TESTS CAN BE PERFORMED USING THE SAME FACILITIESOR BE DONE IN PARALLEL. FREQUENT TESTING (TESTING EVERY OTHERPRODUCTION UNIT). MANY SYSTEM/SUBSYSTEM TEST ARTICLES.QUALIFICATION TEST ON EVERY OTHER PRODUCTION UNIT. SOMESHORTCUTS ESTABLISHED AS TESTING PROGRESSES.
COST EFFECTS: PERCENT CHANGE FROM BASELINE COSTS
UNIT QUANTITY DEVELOPMENT PEP PRODUCTION TOTAL
DEVELOPMENT 0.5% 0.5%5 0.5% 1.4% 1.1%
25 0.5% 2.1% 1.9%
50 0.5% 2.4% 2.2%100 0.5% 2.5% 2.3%150 0.4% 2.5% 2.3%
COST EFFECTS: PERCENT CHANGE FROM BASELINE COSTS
AVERAGE UNIT COST BY SEGMENT
UNIT QUANTITY DEVELOPMENT PEP PRODUCTION TOTAL
2 0.5% 0.5%5 0.5% 0.5% 1.4% 0.8%
25 0.5% 0.5% 2.1% 1.5%50 0.5% 0.5% 2.4% 1.8%100 0.5% 0.5% 2.5% 2.0%
150 0.5% 0.4% 2.5% 2.1%
EXECUTIVE SUMMARY - 13
11 w l

DARPA - SPACE SYSTEM COST STUDYVARIABLE 2OPTION 2
(TABLE 1.3.2.$)
VARIABLE 2: TESTING APPROACH
TESTING AT SUBSYSTEM AND SYSTEM LEVELS. REDUCED SPACEVEHICLE TESTING (SOME ENVIRONMENTAL/NON-ENVIRONMENTAL TESTSARE NOT REQUIRED). THERMAL TESTING NOT REQUIRED DUE TO KNOWNENVIRONMENT AND COMPONENT CAPABILITIES REDUCED TRANSPONDEREM TESTING. TEST OCCURS ONLY WHEN CHANGES MADE TO DESIGNBASELINE. INFREQUENT USE OF TEST ARTICLES. QUALIFICATIONTESTS ON ABOUT EVERY 3RD PRODUCTION UNIT.
TOTAL COSTS - THROUGH G&A: (xlOOO)
UNIT QUANTITY DEVELOPMENT PEP PRODUCTION TOTAL
DEVELOPMENT $46,599.1 $46,599.15 $12,666.4 $31,095.1 $43,761.5
25 $15,973.3 $93,596.3 $109,569.650 $19,809.0 $142,393.9 $162,202.9
100 $24,422.4 $224,121.4 $248,543.8150 $31,910.6 $304,814.2 $336,724.8
UNIT COSTS - THROUGH G&A: (xlOOO)
AVERAGE UNIT COST BY SEGMENT
UNIT QUANTITY DEVELOPMENT PEP PRODUCTION TOTAL
2 $23,299.6 $23,299.65 $9,319.8 $2,533.3 $6,219.0 $18,072.1
25 $1,864.0 $638.9 $3,743.9 $6,246.750 $932.0 $396.2 $2,847.9 $4,176.0100 $466.0 $244.2 $2,241.2 $2,951.4150 $310.7 $212.7 $2,032.1 $2,555.5
EXECUTIVE SUMMARY - 14

DARPA - SPACE SYSTEM COST STUDYVARIABLE 2OPTION 2
(TABLE 1.3.2.%)
VARIABLE 2: TESTING APPROACH
TESTING AT SUBSYSTEM AND SYSTEM LEVELS. REDUCED SPACEVEHICLE TESTING (SOME ENVIRONMENTAL/NON-ENVIRONMENTAL TESTSARE NOT REQUIRED). THERMAL TESTING NOT REQUIRED DUE TO KNOWNENVIRONMENT AND COMPONENT CAPABILITIES REDUCED TRANSPONDEREM TESTING. TEST OCCURS ONLY WHEN CHANGES MADE TO DESIGNBA- LINE. INFREQUENT USE OF TEST ARTICLES. QUALIFICATIONTESTS ON ABOUT EVERY 3RD PRODUCTION UNIT.
COST EFFECTS: PERCENT CHANGE FROM BASELINE COSTS
UNIT QUANTITY DEVELOPMENT PEP PRODUCTION TOTAL
DEVELOPMENT 1.5% 1.5%5 1.4% 2.3% 2.0%
25 1.3% 2.9% 2.7%50 1.3% 3.3% 3.1%
100 1.3% 3.5% 3.3%150 1.1% 3.3% 3.1%
COST EFFECTS: PERCENT CHANGE FROM BASELINE COSTS
AVERAGE UNIT COST BY SEGMENT
UNIT QUANTITY DEVELOPMENT PEP PRODUCTION TOTAL
2 1.5% 1.5%5 1.5% 1.4% 2.3% 1.8%
25 1.5% 1.3% 2.9% 2.3%50 1.5% 1.3% 3.3% 2.7%
100 1.5% 1.3% 3.5% 3.0%150 1.5% 1.1% 3.3% 2.9%
EXECUTIVE SUMMARY - 15

DARPA - SPACE SYSTEM COST STUDY 0VARIABLE 2
OPTION 3(TABLE 1.3.2.$)
VARIABLE 2: TESTING APPROACH
TESTING IS PERFORMED ESSENTIALLY AT JUST THE SYSTEM LEVEL. FORPRODUCTION, TEST EVERY 5TH UNIT DEPENDING ON LOT MATERIAL BUYS.VERY LIMITED AND ACCEPTANCE TESTING ONLY. NON-DESTRUCTIVE TESTINGOR DYNAMIC TESTING AGAINST MASS SIMULATOR, REFURBISHING NOTREQUIRED. REDUCED SPACE VEHICLE TESTING (SOME ENVIRONMENTAL/NON-ENVIRONMENTAL TESTS ARE NOT REQUIRED). THERMAL TELTING NOTREQUIRED DUE TO KNOWN ENVIRONMENT AND COMPONENT CAPABILITIES.REDUCED TRANSPONDER EM TESTING BECAUSE OF PREVIOUSLY CERTIFIEDUNIT.
TOTAL COSTS - THROUGH G&A: (xlOOO)
UNIT QUANTITY DEVELOPMENT PEP PRODUCTION TOTAL
DEVELOPMENT $46,384.6 $46,384.65 $12,548.5 $30,807.7 $43,356.2
25 $15,850.4 $93,036.8 $108,887.250 $19,675.4 $141,360.3 $161,035.7
100 $24,281.1 $222,384.9 $246,666.0150 $31,763.8 $302,042.6 $333,806.4
UNIT COSTS - THROUGH G&A: (xlOOO)
AVERAGE UNIT COST BY SEGMENT
UNIT QUANTITY DEVELOPMENT PEP PRODUCTION TOTAL 0
2 $23,192.3 $23,192.35 $9,276.9 $2,509.7 $6,161.5 $17,948.2
25 $1,855.4 $634.0 $3,721.5 $6,210.950 $927.7 $393.5 $2,827.2 $4,148.4
100 $463.8 $242.8 $2,223.8 $2,930.5150 $309.2 $211.8 $2,013.6 $2,534.6
EXECUTIVE SUMMARY - 16
DARPA - SPACE SYSTEM COST STUDYVARIABLE 2OPTION 3
(TABLE 1.3.2.%)
VARIABLE 2: TESTING APPROACH
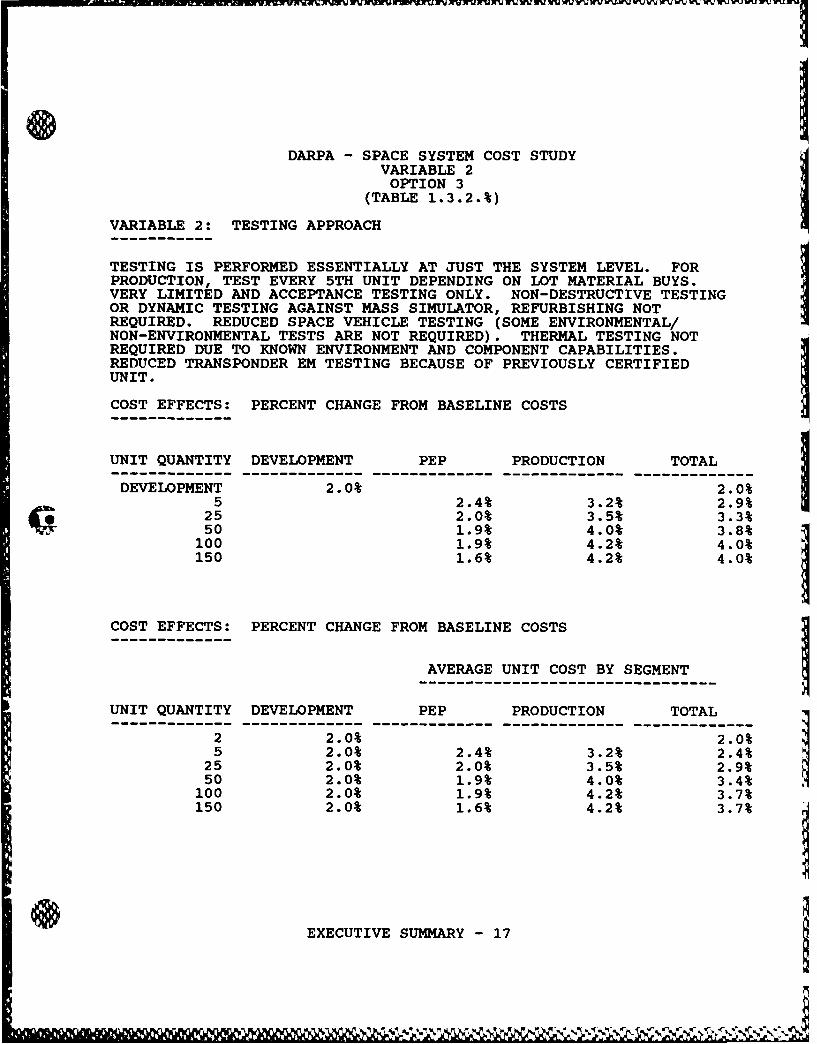
TESTING IS PERFORMED ESSENTIALLY AT JUST THE SYSTEM LEVEL. FORPRODUCTION, TEST EVERY 5TH UNIT DEPENDING ON LOT MATERIAL BUYS.VERY LIMITED AND ACCEPTANCE TESTING ONLY. NON-DESTRUCTIVE TESTINGOR DYNAMIC TESTING AGAINST MASS SIMULATOR, REFURBISHING NOTREQUIRED. REDUCED SPACE VEHICLE TESTING (SOME ENVIRONMENTAL/NON-ENVIRONMENTAL TESTS ARE NOT REQUIRED). THERMAL TESTING NOTREQUIRED DUE TO KNOWN ENVIRONMENT AND COMPONENT CAPABILITIES.REDUCED TRANSPONDER EM TESTING BECAUSE OF PREVIOUSLY CERTIFIEDUNIT.
COST EFFECTS: PERCENT CHANGE FROM BASELINE COSTS
UNIT QUANTITY DEVELOPMENT PEP PRODUCTION TOTAL
DEVELOPMENT 2.0% 2.0%5 2.4% 3.2% 2.9%
25 2.0% 3.5% 3.3%c 50 1.9% 4.0% 3.8%
100 1.9% 4.2% 4.0%150 1.6% 4.2% 4.0%
COST EFFECTS: PERCENT CHANGE FROM BASELINE COSTS
AVERAGE UNIT COST BY SEGMENT
UNIT QUANTITY DEVELOPMENT PEP PRODUCTION TOTAL---------------------- ------------- ------------- ------------- -------------
2 2.0% 2.0%5 2.0% 2.4% 3.2% 2.4%
25 2.0% 2.0% 3.5% 2.9%50 2.0% 1.9% 4.0% 3.4%
100 2.0% 1.9% 4.2% 3.7%150 2.0% 1.6% 4.2% 3.7%
EXECUTIVE SUMMARY - 17
DARPA - SPACE SYSTEM COST STUDYVARIABLE 3OPTION 1
(TABLE 1.3.3.$)
VARIABLE 3: SYSTEM MODULARITY/DESIGN MODULARITY
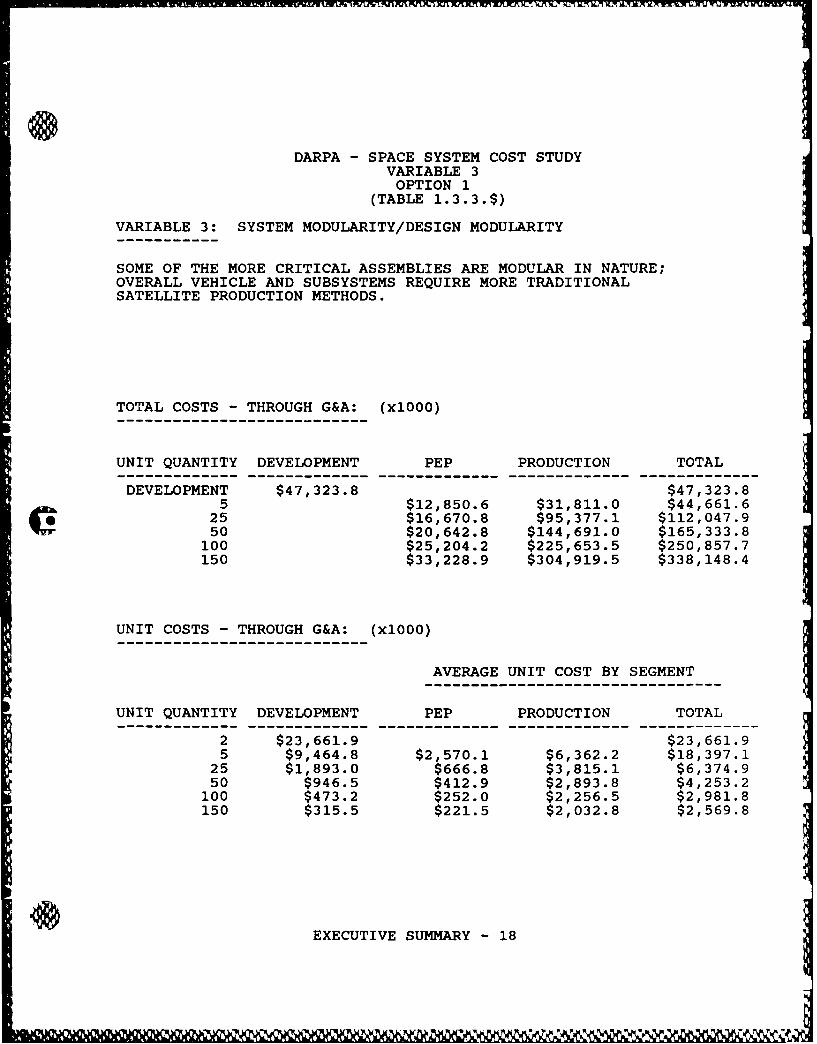
SOME OF THE MORE CRITICAL ASSEMBLIES ARE MODULAR IN NATURE;OVERALL VEHICLE AND SUBSYSTEMS REQUIRE MORE TRADITIONALSATELLITE PRODUCTION METHODS.
TOTAL COSTS - THROUGH G&A: (xlOOO)
UNIT QUANTITY DEVELOPMENT PEP PRODUCTION TOTAL
DEVELOPMENT $47,323.8 $47,323.85 $12,850.6 $31,811.0 $44,661.6
25 $16,670.8 $95,377.1 $112,047.950 $20,642.8 $144,691.0 $165,333.8100 $25,204.2 $225,653.5 $250,857.7150 $33,228.9 $304,919.5 $338,148.4
UNIT COSTS - THROUGH G&A: (xlOOO)
AVERAGE UNIT COST BY SEGMENT
UNIT QUANTITY DEVELOPMENT PEP PRODUCTION TOTAL
2 $23,661.9 $23,661.95 $9,464.8 $2,570.1 $6,362.2 $18,397.1
25 $1,893.0 $666.8 $3,815.1 $6,374.950 $946.5 $412.9 $2,893.8 $4,253.2
100 $473.2 $252.0 $2,256.5 $2,981.8150 $315.5 $221.5 $2,032.8 $2,569.8
EXECUTIVE SUMMARY - 18

DARPA - SPACE SYSTEM COST STUDYVARIABLE 3OPTION 1
(TABLE 1.3.3.%)
VARIABLE 3: SYSTEM MODULARITY/DESIGN MODULARITY
SOME OF THE MORE CRITICAL ASSEMBLIES ARE MODULAR IN NATURE;OVERALL VEHICLE AND SUBSYSTEMS REQUIRE MORE TRADITIONALSATELLITE PRODUCTION METHODS.
COST EFFECTS: PERCENT CHANGE FROM BASELINE COSTS
UNIT QUANTITY DEVELOPMENT PEP PRODUCTION TOTAL
DEVELOPMENT 0.0% 0.0%5 0.0% 0.0% 0.0%
25 -3.0% 1.1% 0.5%50 -2.9% 1.8% 1.2%
100 -1.9% 2.8% 2.4%150 -3.0% 3.3% 2.7%
COST EFFECTS: PERCENT CHANGE FROM BASELINE COSTS
AVERAGE UNIT COST BY SEGMENT
--------------------------- ---- ---- --------
UNIT QUANTITY DEVELOPMENT PEP PRODUCTION TOTAL
2 0.0% 0.0%5 0.0% 0.0% 0.0% 0.0%
25 0.0% -3.0% 1.1% 0.3%50 0.0% -2.9% 1.8% 0.9%
100 0.0% -1.9% 2.8% 2.0%150 0.0% -3.0% 3.3% 2.4%
EXECUTIVE SUMMARY - 19
15 '' D, ?)C 11111

DARPA - SPACE SYSTEM COST STUDYVARIABLE 3OPTION 2
(TABLE 1.3.3.$)
VARIABLE 3: SYSTEM MODULARITY/DESIGN MODULARITY
COMPONENT PARTS ARE MODULAR, SUBSYSTEMS ARE NOT.PRODUCTION OF INDIVIDUAL SUBSYSTEMS OCCURS IN AN ASSEMBLYLINE FASHION WHILE SYSTEM ASSEMBLY REQUIRES MORE TRADITIONALMETHODS.
TOTAL COSTS - THROUGH G&A: (xlOOO)
UNIT QUANTITY DEVELOPMENT PEP PRODUCTION TOTAL
DEVELOPMENT $47,323.8 $47,323.8I 5 $12,850.6 $31,811.0 $44,661.6
25 $17,248.4 $94,518.9 $111.767.350 $21,223.7 $143,406.7 $164,630.4
100 $26,312.9 $224,005.4 $250,318.3150 $34,469.5 $302,264.0 $336,733.5
UNIT COSTS - THROUGH G&A: (xlOOO)
AVERAGE UNIT COST BY SEGMENT
UNIT QUANTITY DEVELOPMENT PEP PRODUCTION TOTAL
2 $23,661.9 $23,661.95 $9,464.8 $2,570.1 $6,362.2 $18,397.1
25 $1,893.0 $689.9 $3,780.8 $6,363.650 $946.5 $424.5 $2,868.1 $4,239.1
100 $473.2 $263.1 $2,240.1 $2,976.4150 $315.5 $229.8 $2,015.1 $2,560.4
EXECUTIVE SUMMARY - 20
DARPA - SPACE SYSTEM COST STUDYVARIABLE 3OPTION 2
(TABLE 1.3.3.%)
VARIABLE 3: SYSTEM MODULARITY/DESIGN MODULARITY
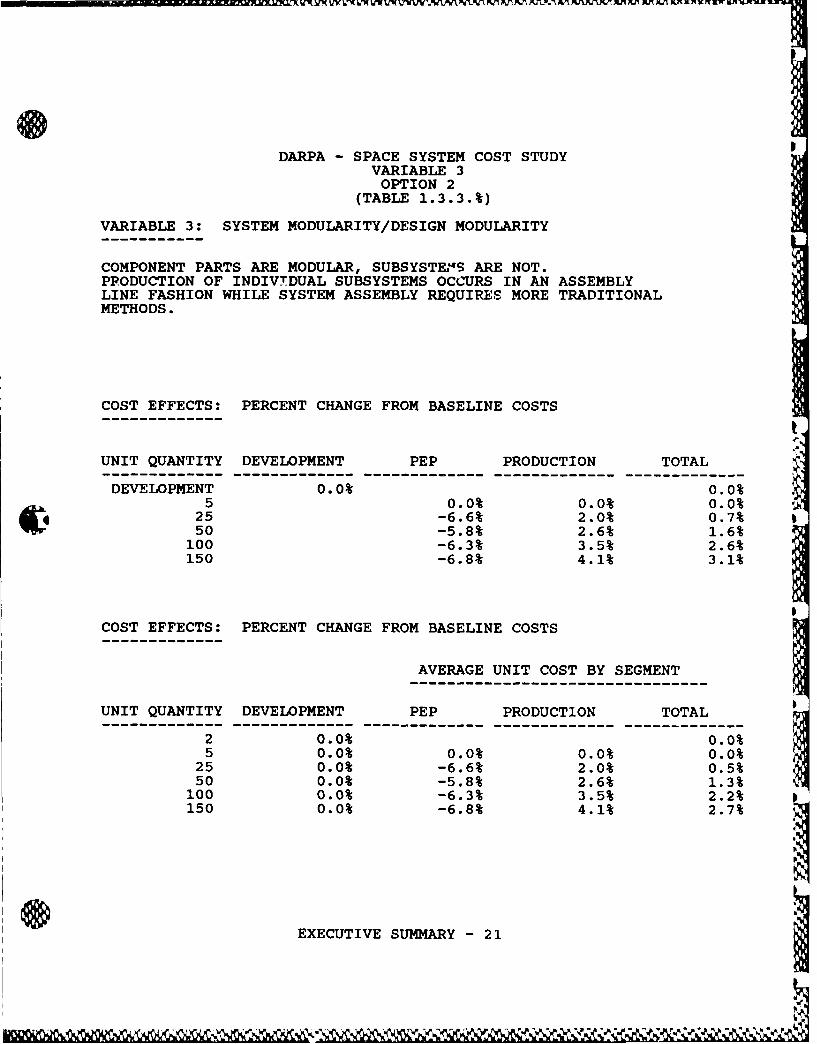
COMPONENT PARTS ARE MODULAR, SUBSYSTE,"S ARE NOT.PRODUCTION OF INDIVTDUAL SUBSYSTEMS OCCURS IN AN ASSEMBLYLINE FASHION WHILE SYSTEM ASSEMBLY REQUIRES MORE TRADITIONALMETHODS.
COST EFFECTS: PERCENT CHANGE FROM BASELINE COSTS
UNIT QUANTITY DEVELOPMENT PEP PRODUCTION TOTAL
DEVELOPMENT 0.0% 0.0%5 0.0% 0.0% 0.0%
25 -6.6% 2.0% 0.7%50 -5.8% 2.6% 1.6%
100 -6.3% 3.5% 2.6%150 -6.8% 4.1% 3.1%
COST EFFECTS: PERCENT CHANGE FROM BASELINE COSTS
AVERAGE UNIT COST BY SEGMENT
UNIT QUANTITY DEVELOPMENT PEP PRODUCTION TOTAL
2 0.0% 0.0%5 0.0% 0.0% 0.0% 0.0%
25 0.0% -6.6% 2.0% 0.5%50 0.0% -5.8% 2.6% 1.3%100 0.0% -6.3% 3.5% 2.2%150 0.0% -6.8% 4.1% 2.7%
EXECUTIVE SUMMARY - 21
DARPA - SPACE SYSTEM COST STUDYVARIABLE 3OPTION 3
(TABLE 1.3.3.$)
VARIABLE 3: SYSTEM MODULARITY/DESIGN MODULARITY
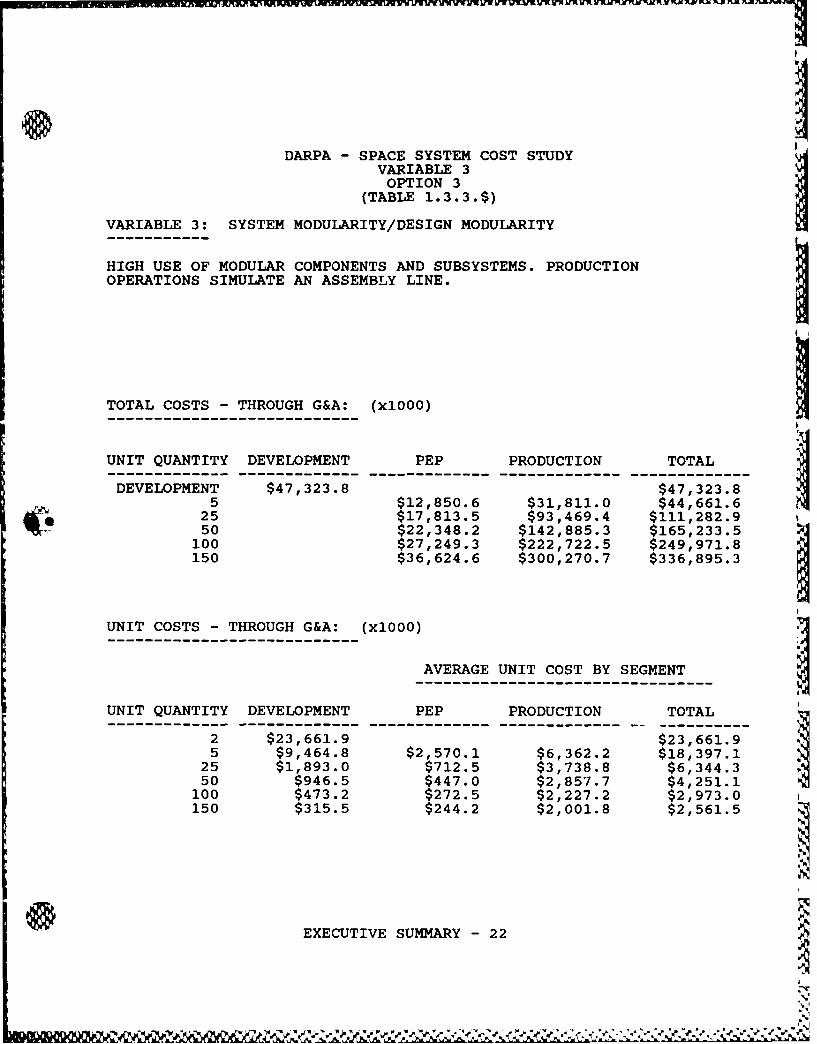
HIGH USE OF MODULAR COMPONENTS AND SUBSYSTEMS. PRODUCTIONOPERATIONS SIMULATE AN ASSEMBLY LINE.
TOTAL COSTS - THROUGH G&A: (xlOOO)
UNIT QUANTITY DEVELOPMENT PEP PRODUCTION TOTAL
DEVELOPMENT $47,323.8 $47,323.85 $12,850.6 $31,811.0 $44,661.6
25 $17,813.5 $93,469.4 $111,282.950 $22,348.2 $142,885.3 $165,233.5
100 $27,249.3 $222,722.5 $249,971.8150 $36,624.6 $300,270.7 $336,895.3
UNIT COSTS - THROUGH G&A: (xlOOO)
AVERAGE UNIT COST BY SEGMENT
UNIT QUANTITY DEVELOPMENT PEP PRODUCTION TOTAL
2 $23,661.9 $23,661.95 $9,464.8 $2,570.1 $6,362.2 $18,397.1
25 $1,893.0 $712.5 $3,738.8 $6,344.350 $946.5 $447.0 $2,857.7 $4,251.1100 $473.2 $272.5 $2,227.2 $2,973.0150 $315.5 $244.2 $2,001.8 $2,561.5
EXECUTIVE SUMMARY - 22
DARPA - SPACE SYSTEM COST STUDYVARIABLE 3OPTION 3
(TABLE 1.3.3.%)
VARIABLE 3: SYSTEM MODULARITY/DESIGN MODULARITY
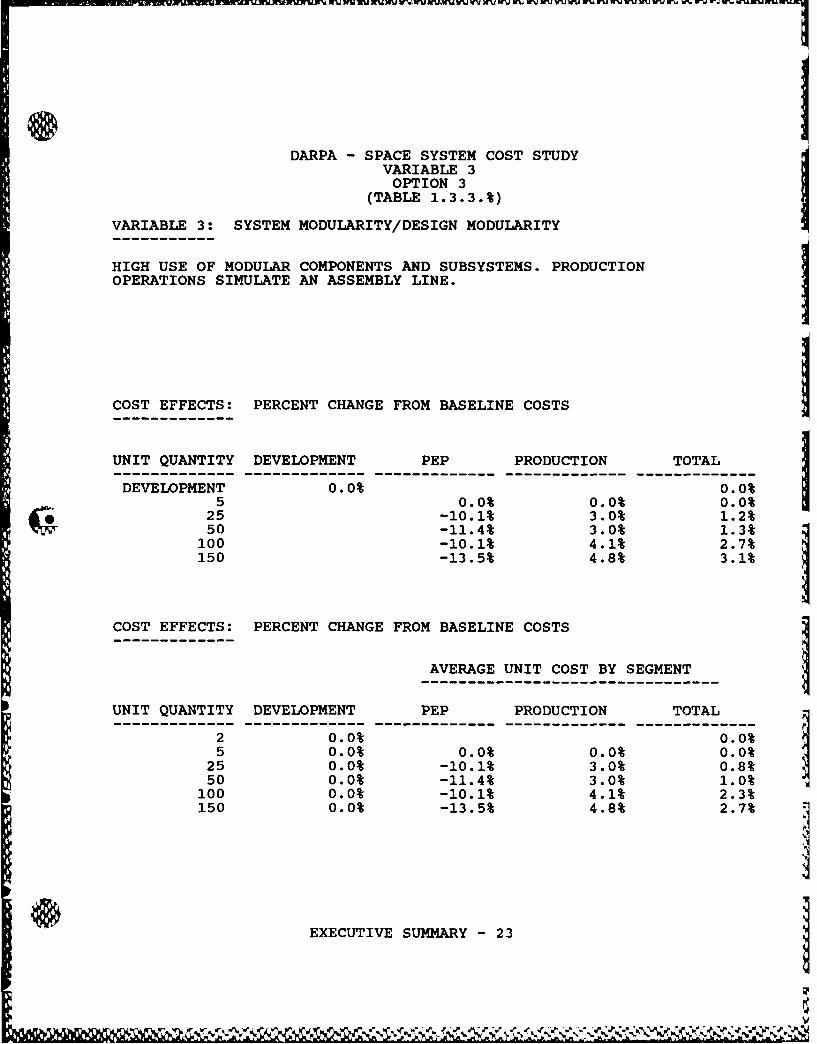
HIGH USE OF MODULAR COMPONENTS AND SUBSYSTEMS. PRODUCTIONOPERATIONS SIMULATE AN ASSEMBLY LINE.
COST EFFECTS: PERCENT CHANGE FROM BASELINE COSTS
UNIT QUANTITY DEVELOPMENT PEP PRODUCTION TOTAL
DEVELOPMENT 0.0% 0.0%5 0.0% 0.0% 0.0%
25 -10.1% 3.0% 1.2%50 -11.4% 3.0% 1.3%t
100 -10.1% 4.1% 2.7%150 -13.5% 4.8% 3.1%
COST EFFECTS: PERCENT CHANGE FROM BASELINE COSTS
AVERAGE UNIT COST BY SEGMENT
UNIT QUANTITY DEVELOPMENT PEP PRODUCTION TOTAL
2 0.0% 0.0%5 0.0% 0.0% 0.0% 0.0%
25 0.0% -10.1% 3.0% 0.8%50 0.0% -11.4% 3.0% 1.0%
100 0.0% -10.1% 4.1% 2.3%150 0.0% -13.5% 4.8% 2.7%
EXECUTIVE SUMMARY -23
o IDARPA - SPACE SYSTEM COST STUDY
VARIABLE 4OPTION 1
(TABLE 1.3.4.$)
VARIABLE 4: MISSION LIFE
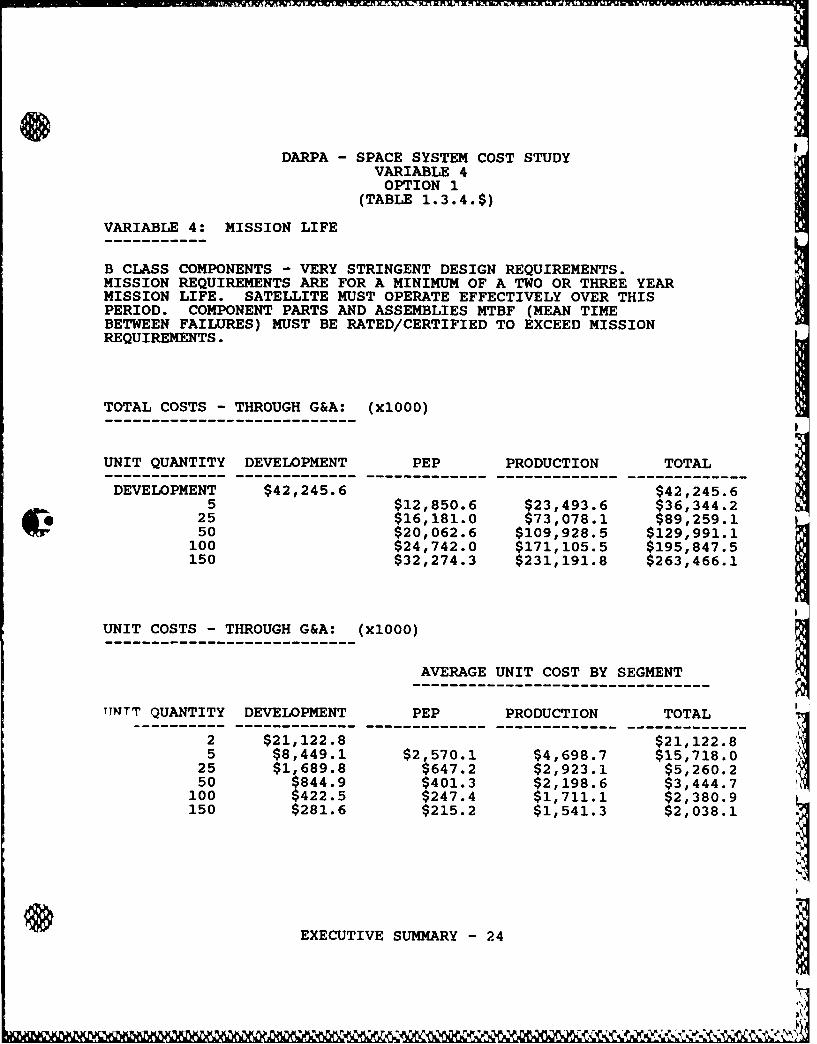
B CLASS COMPONENTS - VERY STRINGENT DESIGN REQUIREMENTS.MISSION REQUIREMENTS ARE FOR A MINIMUM OF A TWO OR THREE YEARMISSION LIFE. SATELLITE MUST OPERATE EFFECTIVELY OVER THISPERIOD. COMPONENT PARTS AND ASSEMBLIES MTBF (MEAN TIMEBETWEEN FAILURES) MUST BE RATED/CERTIFIED TO EXCEED MISSIONREQUIREMENTS.
TOTAL COSTS - THROUGH G&A: (xlOOO)
UNIT QUANTITY DEVELOPMENT PEP PRODUCTION TOTAL
DEVELOPMENT $42,245.6 $42,245.65 $12,850.6 $23,493.6 $36,344.2
25 $16,181.0 $73,078.1 $89,259.150 $20,062.6 $109,928.5 $129,991.1100 $24,742.0 $171,105.5 $195,847.5150 $32,274.3 $231,191.8 $263,466.1
UNIT COSTS - THROUGH G&A: (xlOOO)
AVERAGE UNIT COST BY SEGMENT
ITNTT QUANTITY DEVELOPMENT PEP PRODUCTION TOTAL-------------------- ------------- ------------- ------------- -------------
2 $21,122.8 $21,122.85 $8,449.1 $2,570.1 $4,698.7 $15,718.0
25 $1,689.8 $647.2 $2,923.1 $5,260.250 $844.9 $401.3 $2,198.6 $3,444.7100 $422.5 $247.4 $1, 711.1 $2,380.9150 $281.6 $215.2 $1,541.3 $2,038.1
EXECUTIVE SUMMARY - 24

DARPA - SPACE SYSTEM COST STUDYVARIABLE 4
OPTION 1(TABLE 1.3.4.%)
VARIABLE 4: MISSION LIFE
B CLASS COMPONENTS - VERY STRINGENT DESIGN REQUIREMENTS.
MISSION REQUIREMENTS ARE FOR A MINIMUM OF A TWO OR THREE YEARMISSION LIFE. SATELLITE MUST OPERATE EFFECTIVELY OVER THISPERIOD. COMPONENT PARTS AND ASSEMBLIES MTBF (MEAN TIMEBETWEEN FAILURES) MUST BE RATED/CERTIFIED TO EXCEED MISSIONREQUIREMENTS.
COST EFFECTS: PERCENT CHANGE FROM BASELINE COSTS
UNIT QUANTITY DEVELOPMENT PEP PRODUCTION TOTAL
DEVELOPMENT 10.7% 10.7%5 0.0% 26.1% 18.6%
25 0.0% 24.2% 20.7%50 0.0% 25.4% 22.3%
100 0.0% 26.3% 23.8%150 0.0% 26.7% 24.2%
COST EFFECTS: PERCENT CHANGE FROM BASELINE COSTS
AVERAGE UNIT COST BY SEGMENT
UNIT QUANTITY DEVELOPMENT PEP PRODUCTION TOTAL
2 10.7% 10.7%5 10.7% 0.0% 26.1% 14.6%
25 10.7% 0.0% 24.2% 17.8%50 10.7% 0.0% 25.4% 19.8%
100 10.7% 0.0% 26.3% 21.8%150 10.7% 0.0% 26.7% 22.6%
EXECUTIVE SUMMARY - 25
DARPA - SPACE SYSTEM COST STUDYVARIABLE 4OPTION 2
(TABLE 1.3.4.$)
VARIABLE 4: MISSION LIFE
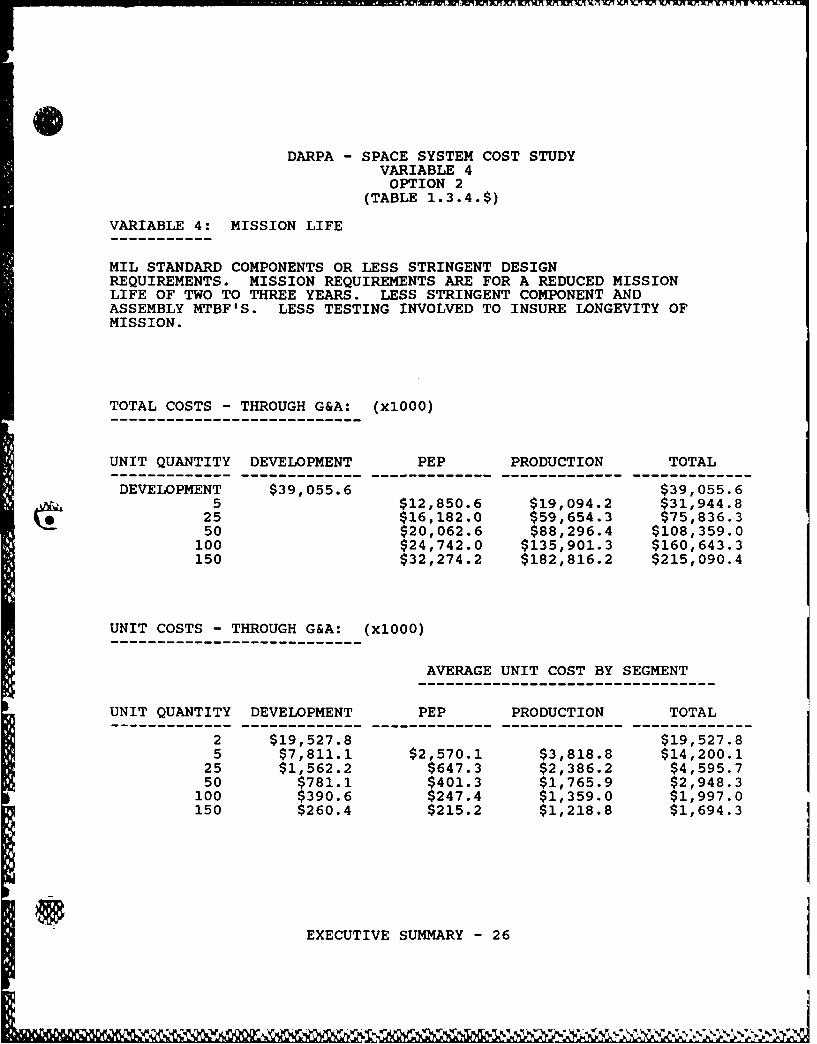
MIL STANDARD COMPONENTS OR LESS STRINGENT DESIGNREQUIREMENTS. MISSION REQUIREMENTS ARE FOR A REDUCED MISSIONLIFE OF TWO TO THREE YEARS. LESS STRINGENT COMPONENT ANDASSEMBLY MTBF'S. LESS TESTING INVOLVED TO INSURE LONGEVITY OFMISSION.
TOTAL COSTS - THROUGH G&A: (xl000)
UNIT QUANTITY DEVELOPMENT PEP PRODUCTION TOTAL
DEVELOPMENT $39,055.6 $39,055.65 $12,850.6 $19,094.2 $31,944.8
25 $16,182.0 $59,654.3 $75,836.350 $20,062.6 $88,296.4 $108,359.0
100 $24,742.0 $135,901.3 $160,643.3150 $32,274.2 $182,816.2 $215,090.4
UNIT COSTS - THROUGH G&A: (xlOOO)
AVERAGE UNIT COST BY SEGMENT
UNIT QUANTITY DEVELOPMENT PEP PRODUCTION TOTAL
2 $19,527.8 $19,527.85 $7,811.1 $2,570.1 $3,818.8 $14,200.1
25 $1,562.2 $647.3 $2,386.2 $4,595.750 $781.1 $401.3 $1,765.9 $2,948.3
100 $390.6 $247.4 $1,359.0 $1,997.0150 $260.4 $215.2 $1,218.8 $1,694.3
EXECUTIVE SUMMARY - 26

DARPA - SPACE SYSTEM COST STUDYVARIABLE 4OPTION 2
(TABLE 1.3.4.%)
VARIABLE 4: MISSION LIFE
MIL STANDARD COMPONENTS OR LESS STRINGENT DESIGNREQUIREMENTS. MISSION REQUIREMENTS ARE FOR A REDUCED MISSIONLIFE OF TWO TO THREE YEARS. LESS STRINGENT COMPONENT ANDASSEMBLY MTBF'S. LESS TESTING INVOLVED TO INSURE LONGEVITY OFMISSION.
COST EFFECTS: PERCENT CHANGE FROM BASELINE COSTS
UNIT QUANTITY DEVELOPMENT PEP PRODUCTION TOTAL--------------------- ------------- ------------- ------------- -------------DEVELOPMENT 17.5% 17.5%
5 0.0% 40.0% 28.5%25 0.0% 38.1% 32.6%50 0.0% 40.1% 35.3%
100 0.0% 41.5% 37.5%150 0.0% 42.0% 38.1%
COST EFFECTS: PERCENT CHANGE FROM BASELINE COSTS
AVERAGE UNIT COST BY SEGMENT
UNIT QUANTITY DEVELOPMENT PEP PRODUCTION TOTAL--------------------- ------------- ------------- ------------- -------------
2 17.5% 17.5%5 17.5% 0.0% 40.0% 22.8%
25 17.5% 0.0% 38.1% 28.2%50 17.5% 0.0% 40.1% 31.3%
100 17.5% 0.0% 41.5% 34.4%150 17.5% 0.0% 42.0% 35.6%
EXECUTIVE SUMMARY - 27

DARPA - SPACE SYSTEM COST STUDYVARIABLE 4OPTION 3
(TABLE 1.3.4.$)
VARIABLE 4: MISSION LIFE
COMMERCIAL PARTS ARE AVAILABLE THAT MEET PERFORMANCE/RELIABILITY REQUIREMENTS. MISSION REQUIREMENTS ARE FOR ASHORT MISSION LIFE OF LESS THAN TWO YEARS. ALL COMPONENTSAND ASSEMBLIES ARE OF REDUCED RELIABILITY.
TOTAL COSTS - THROUGH G&A: (xlOOO)
UNIT QUANTITY DEVELOPMENT PEP PRODUCTION TOTAL
DEVELOPMENT $37,160.7 $37,160.75 $12,850.6 $16,641.2 $29,491.8
25 $16,182.0 $52,395.7 $68,577.750 $20,062.6 $76,386.5 $96,449.1100 $24,742.0 $116,564.6 $119,195.4150 $32,274.2 $156,246.7 $188,520.9
UNIT COSTS - THROUGH G&A: (xl000)
AVERAGE UNIT COST BY SEGMENT
UNIT QUANTITY DEVELOPMENT PEP PRODUCTION TOTAL
2 $18,580.4 $18,580.45 $7,432.1 $2,570.1 $3,328.2 $13,330.5
25 $1,486.4 $647.3 $2,095.8 $4,229.550 $743.2 $401.3 $1,527.7 $2,672.2100 $371.6 $247.4 $1,165.6 $1,784.7150 $247.7 $215.2 $1,041.6 $1,504.5
EXECUTIVE SUMMARY - 28

~rwF
DARPA - SPACE SYSTEM COST STUDYVARIABLE 4OPTION 3
(TABLE 1.3.4.%)
VARIABLE 4: MISSION LIFE
COMMERCIAL PARTS ARE AVAILABLE THAT MEET PERFORMANCE/RELIABILITY REQUIREMENTS. MISSION REQUIREMENTS ARE FOR ASHORT MISSION LIFE OF LESS THAN TWO YEARS. ALL COMPONENTSAND ASSEMBLIES ARE OF REDUCED RELIABILITY.
COST EFFECTS: PERCENT CHANGE FROM BASELINE COSTS
UNIT QUANTITY DEVELOPMENT PEP PRODUCTION TOTAL------------------------- ------------- ------------- ------------- -------------DEVELOPMENT 21.5% 21.5%
5 0.0% 47.7% 34.0%25 0.0% 45.6% 39.1%50 0.0% 48.1% 42.4%
100 0.0% 49.8% 53.6%150 0.0% 50.4% 45.8%
COST EFFECTS: PERCENT CHANGE FROM BASELINE COSTS
AVERAGE UNIT COST BY SEGMENT
UNIT QUANTITY DEVELOPMENT PEP PRODUCTION TOTAL------------------------- ------------- ------------- ------------- -------------
2 21.5% 21.5%5 21.5% 0.0% 47.7% 27.5%
25 21.5% 0.0% 45.6% 33.9%50 21.5% 0.0% 48.1% 37.8%
100 21.5% 0.0% 49.8% 41.3%150 21.5% 0.0% 50.4% 42.9%
EXECUTIVE SUMMARY - 29]
oo , o, ooo .l.,
DARPA - SPACE SYSTEM COST STUDYVARIABLE 5OPTION 1
(TABLE 1.3.5.$)
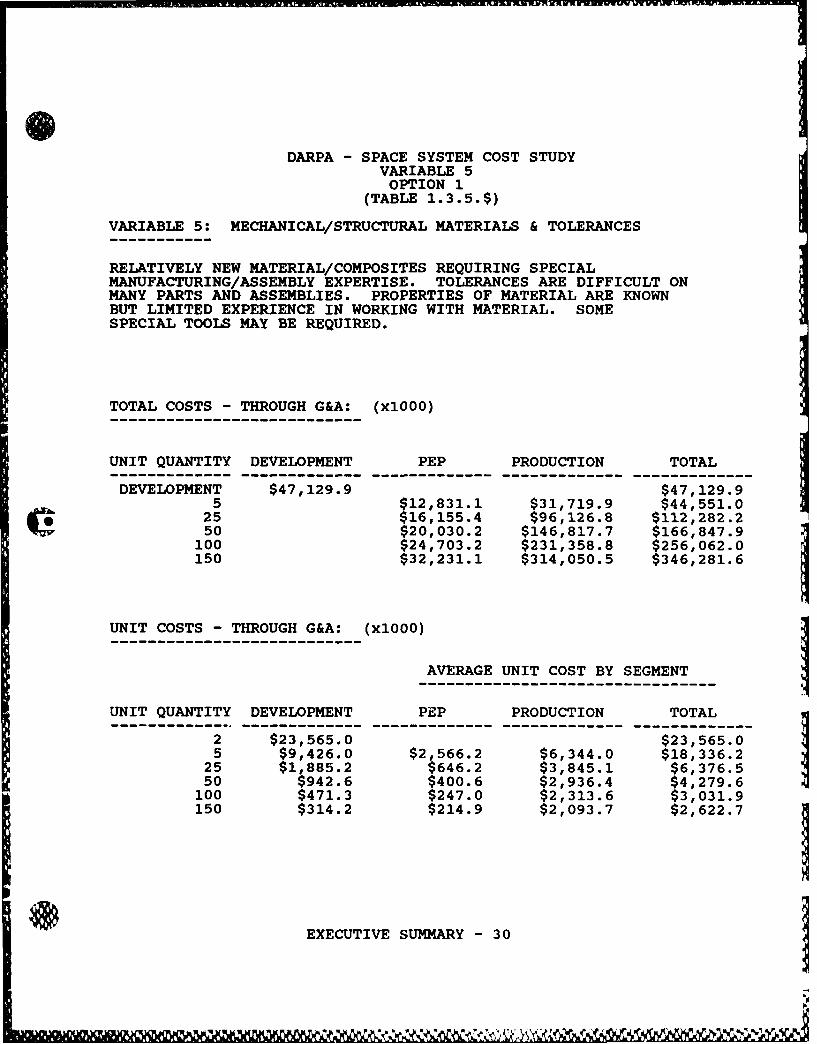
VARIABLE 5: MECHANICAL/STRUCTURAL MATERIALS & TOLERANCES
RELATIVELY NEW MATERIAL/COMPOSITES REQUIRING SPECIALMANUFACTURING/ASSEMBLY EXPERTISE. TOLERANCES ARE DIFFICULT ONMANY PARTS AND ASSEMBLIES. PROPERTIES OF MATERIAL ARE KNOWNBUT LIMITED EXPERIENCE IN WORKING WITH MATERIAL. SOMESPECIAL TOOLS MAY BE REQUIRED.
TOTAL COSTS - THROUGH G&A: (xl000)
UNIT QUANTITY DEVELOPMENT PEP PRODUCTION TOTAL
DEVELOPMENT $47,129.9 $47,129.95 $12,831.1 $31,719.9 $44,551.0
25 $16,155.4 $96,126.8 $112,282.2q 50 $20,030.2 $146,817.7 $166,847.9
100 $24,703.2 $231,358.8 $256,062.0150 $32,231.1 $314,050.5 $346,281.6
UNIT COSTS - THROUGH G&A: (xlOOO)
AVERAGE UNIT COST BY SEGMENT
UNIT QUANTITY DEVELOPMENT PEP PRODUCTION TOTAL
2 $23,565.0 $23,565.05 $9,426.0 $2,566.2 $6,344.0 $18,336.2
25 $1,885.2 $646.2 $3,845.1 $6,376.550 $942.6 $400.6 $2,936.4 $4,279.6
100 $471.3 $247.0 $2,313.6 $3,031.9150 $314.2 $214.9 $2,093.7 $2,622.7
EXECUTIVE SUMMARY - 30

7FVP A1M
DARPA - SPACE SYSTEM COST STUDYVARIABLE 5OPTION 1
(TABLE 1.3.5.%)
VARIABLE 5: MECHANICAL/STRUCTURAL MATERIALS & TOLERANCES
RELATIVELY NEW MATERIAL/COMPOSITES REQUIRING SPECIALMANUFACTURING/ASSEMBLY EXPERTISE. TOLERANCES ARE DIFFICULT ONMANY PARTS AND ASSEMBLIES. PROPERTIES OF MATERIAL ARE KNOWNBUT LIMITED EXPERIENCE IN WORKING WITH MATERIAL. SOMESPECIAL TOOLS MAY BE REQUIRED.
COST EFFECTS: PERCENT CHANGE FROM BASELINE COSTS
UNIT QUANTITY DEVELOPMENT PEP PRODUCTION TOTAL
DEVELOPMENT 0.4% 0.4%5 0.2% 0.3% 0.2%
25 0.2% 0.3% 0.3%50 0.2% 0.3% 0.3%
100 0.2% 0.4% 0.3%150 0.1% 0.4% 0.4%
COST EFFECTS: PERCENT CHANGE FROM BASELINE COSTS
AVERAGE UNIT COST BY SEGMENT
UNIT QUANTITY DEVELOPMENT PEP PRODUCTION TOTAL
2 0.4% 0.4%5 0.4% 0.2% 0.3% 0.3%
25 0.4% 0.2% 0.3% 0.3%50 0.4% 0.2% 0.3% 0.3%100 0.4% 0.2% 0.4% 0.4%
150 0.4% 0.1% 0.4% 0.4%
EXECUTIVE SUMMARY - 31
r IA AA-JkI 6P I % "W .'k

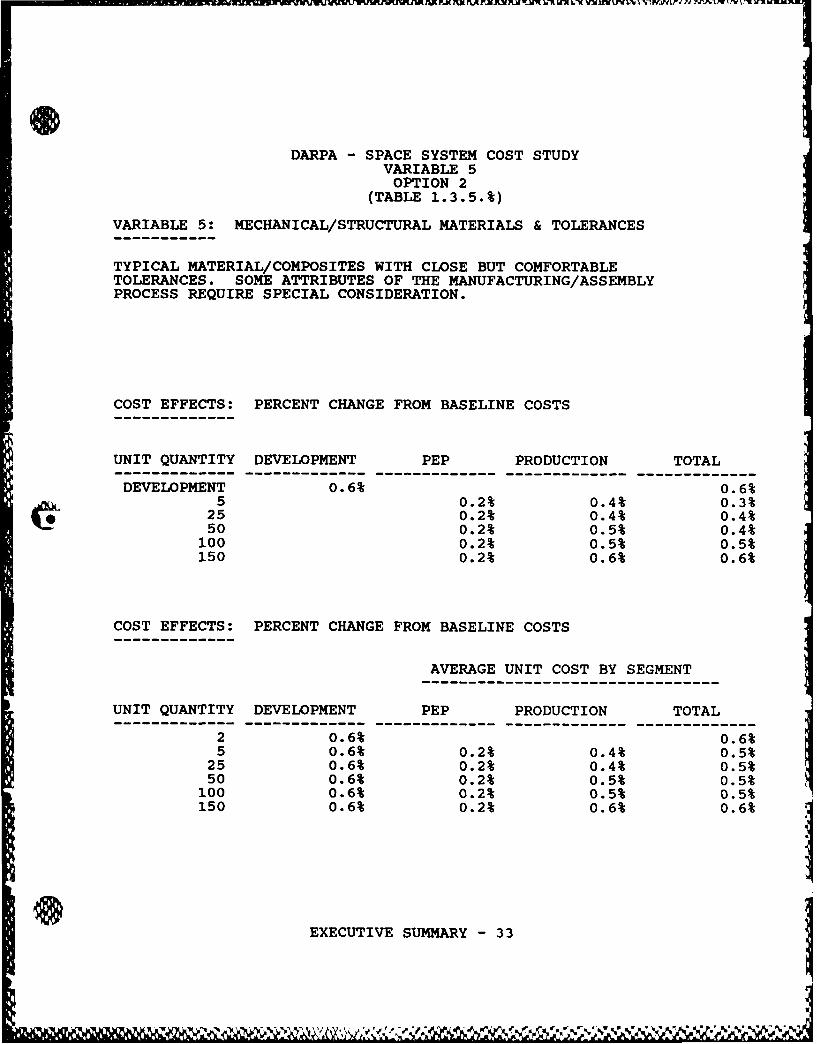
DARPA - SPACE SYSTEM COST STUDYVARIABLE 5OPTION 2
(TABLE 1.3.5.$)
VARIABLE 5: MECHANICAL/STRUCTURAL MATERIALS & TOLERANCES
TYPICAL MATERIAL/COMPOSITES WITH CLOSE BUT COMFORTABLETOLERANCES. SOME ATTRIBUTES OF THE MANUFACTURING/ASSEMBLYPROCESS REQUIRE SPECIAL CONSIDERATION.
TOTAL COSTS - THROUGH G&A: (xlOOO)
UNIT QUANTITY DEVELOPMENT PEP PRODUCTION TOTAL
DEVELOPMENT $47,039.8 $47,039.85 $12,830.4 $31,675.8 $44,506.2
25 $16,154.9 $95,986.6 $112,141.550 $20,024.1 $146,586.3 $166,610.4100 $24,693.9 $230,948.3 $255,642.2150 $32,220.3 $313,434.4 $345,654.7
UNIT COSTS - THROUGH G&A: (xlOOO)
AVERAGE UNIT COST BY SEGMENT
UNIT QUANTITY DEVELOPMENT PEP PRODUCTION TOTAL
2 $23,519.9 $23,519.95 $9,408.0 $2,566.1 $6,335.2 $18,309.2
25 $1,881.6 $646.2 $3,839.5 $6,367.350 $940.8 $400.5 $2,931.7 $4,273.0100 $470.4 $246.9 $2,309.5 $3,026.8150 $313.6 $214.8 $2,089.6 $2,618.0
EXECUTIVE SUMMARY - 32
DARPA - SPACE SYSTEM COST STUDYVARIABLE 5OPTION 2
(TABLE 1.3.5.%)
VARIABLE 5: MECHANICAL/STRUCTURAL MATERIALS & TOLERANCES
TYPICAL MATERIAL/COMPOSITES WITH CLOSE BUT COMFORTABLETOLERANCES. SOME ATTRIBUTES OF THE MANUFACTURING/ASSEMBLYPROCESS REQUIRE SPECIAL CONSIDERATION.
COST EFFECTS: PERCENT CHANGE FROM BASELINE COSTS
UNIT QUANTITY DEVELOPMENT PEP PRODUCTION TOTAL
DEVELOPMENT 0.6% 0.6%5 0.2% 0.4% 0.3%
25 0.2% 0.4% 0.4%50 0.2% 0.5% 0.4%100 0.2% 0.5% 0.5%150 0.2% 0.6% 0.6%
COST EFFECTS: PERCENT CHANGE FROM BASELINE COSTS
AVERAGE UNIT COST BY SEGMENT
UNIT QUANTITY DEVELOPMENT PEP PRODUCTION TOTAL
2 0.6% 0.6%5 0.6% 0.2% 0.4% 0.5%
25 0.6% 0.2% 0.4% 0.5%50 0.6% 0.2% 0.5% 0.5%100 0.6% 0.2% 0.5% 0.5%150 0.6% 0.2% 0.6% 0.6%
_IEXECUTIVE SUMMARY -33
1A~~~r2.it A ~ e.
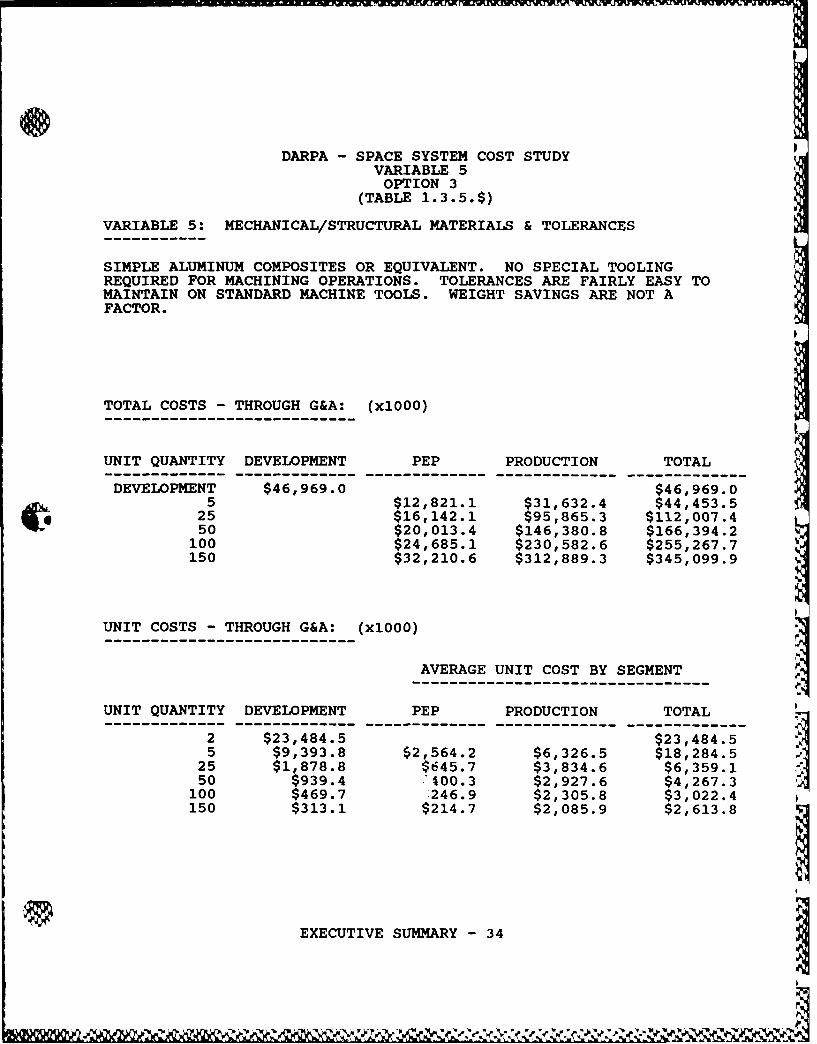
DARPA - SPACE SYSTEM COST STUDYVARIABLE 5OPTION 3
(TABLE 1.3.5.$)
VARIABLE 5: MECHANICAL/STRUCTURAL MATERIALS & TOLERANCES
SIMPLE ALUMINUM COMPOSITES OR EQUIVALENT. NO SPECIAL TOOLINGREQUIRED FOR MACHINING OPERATIONS. TOLERANCES ARE FAIRLY EASY TOMAINTAIN ON STANDARD MACHINE TOOLS. WEIGHT SAVINGS ARE NOT AFACTOR.
TOTAL COSTS - THROUGH G&A: (xlOOO)
UNIT QUANTITY DEVELOPMENT PEP PRODUCTION TOTAL
DEVELOPMENT $46,969.0 $46,969.05 $12,821.1 $31,632.4 $44,453.5
25 $16,142.1 $95,865.3 $112,007.450 $20,013.4 $146,380.8 $166,394.2100 $24,685.1 $230,582.6 $255,267.7150 $32,210.6 $312,889.3 $345,099.9
UNIT COSTS - THROUGH G&A: (xlOOO)
AVERAGE UNIT COST BY SEGMENT
UNIT QUANTITY DEVELOPMENT PEP PRODUCTION TOTAL------------- ------------- ------------- ------------- -------------
2 $23,484.5 $23,484.55 $9,393.8 $2,564.2 $6,326.5 $18,284.5
25 $1,878.8 $645.7 $3,834.6 $6,359.150 $939.4 400.3 $2,927.6 $4,267.3100 $469.7 246.9 $2,305.8 $3,022.4150 $313.1 $214.7 $2,085.9 $2,613.8
EXECUTIVE SUMMARY - 34
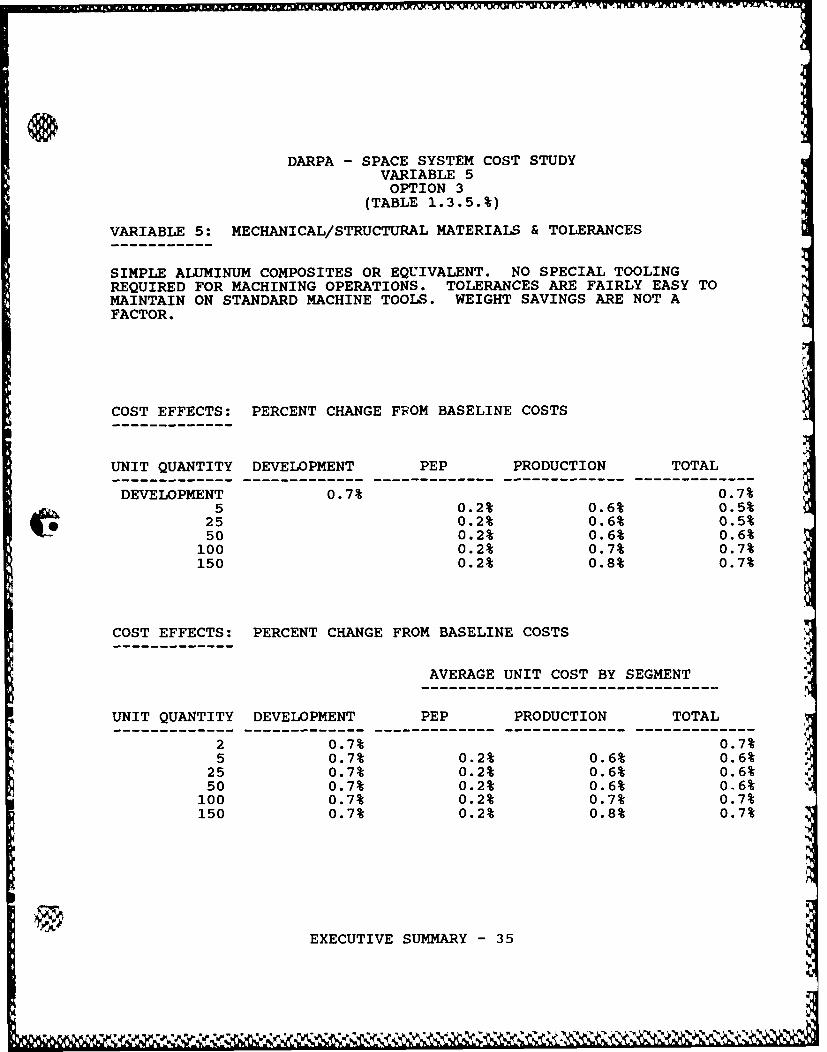
DARPA - SPACE SYSTEM COST STUDYVARIABLE 5
OPTION 3(TABLE 1.3.5.%)
VARIABLE 5: MECHANICAL/STRUCTURAL MATERIALS & TOLERANCES
SIMPLE ALUMINUM COMPOSITES OR EQUIVALENT. NO SPECIAL TOOLINGREQUIRED FOR MACHINING OPERATIONS. TOLERANCES ARE FAIRLY EASY TOMAINTAIN ON STANDARD MACHINE TOOLS. WEIGHT SAVINGS ARE NOT AFACTOR.
COST EFFECTS: PERCENT CHANGE FROM BASELINE COSTS
UNIT QUANTITY DEVELOPMENT PEP PRODUCTION TOTAL
DEVELOPMENT 0.7% 0.7%5 0.2% 0.6% 0.5%
25 0.2% 0.6% 0.5%50 0.2% 0.6% 0.6%100 0.2% 0.7% 0.7%150 0.2% 0.8% 0.7%
COST EFFECTS: PERCENT CHANGE FROM BASELINE COSTS
AVERAGE UNIT COST BY SEGMENT
UNIT QUANTITY DEVELOPMENT PEP PRODUCTION TOTAL
2 0.7% 0.7%5 0.7% 0.2% 0.6% 0.6%
25 0.7% 0.2% 0.6% 0.6%50 0.7% 0.2% 0.6% 0.6%
100 0.7% 0.2% 0.7% 0.7%150 0.7% 0.2% 0.8% 0.7%
EXECUTIVE SUMMARY - 35
• 'V
DARPA - SPACE SYSTEM COST STUDYVARIABLE 6OPTION 1
(TABLE 1.3.6.$)
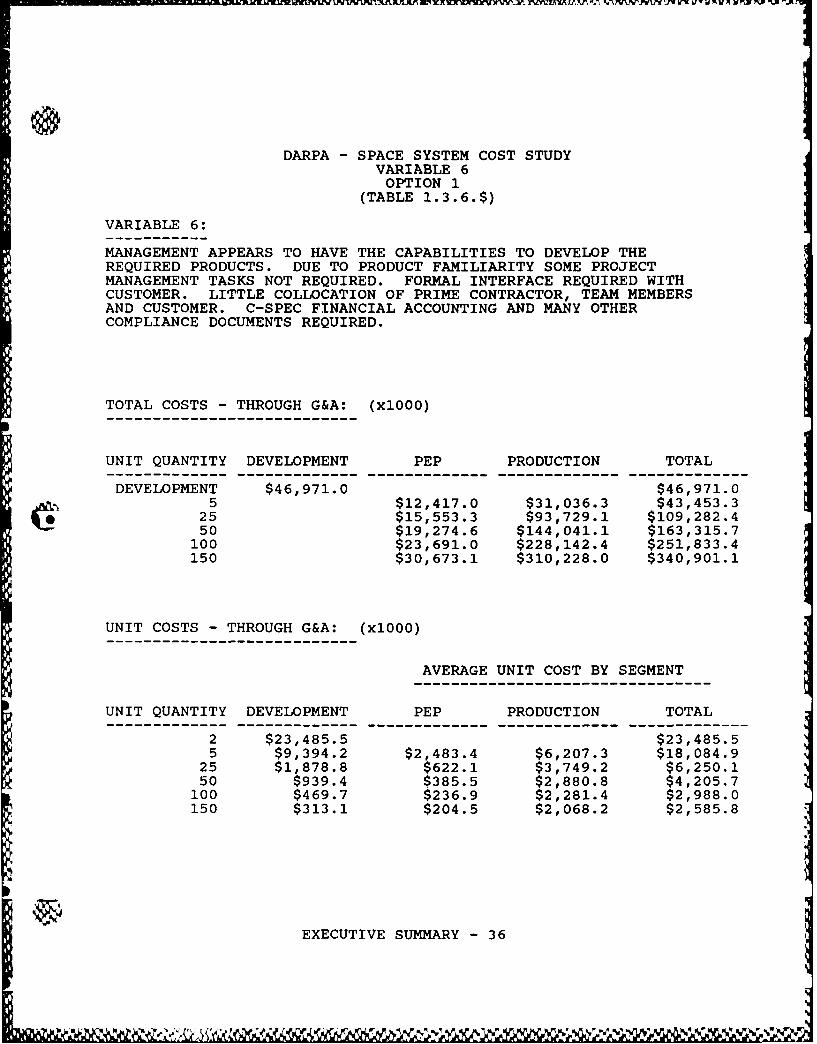
VARIABLE 6:
MANAGEMENT APPEARS TO HAVE THE CAPABILITIES TO DEVELOP THEREQUIRED PRODUCTS. DUE TO PRODUCT FAMILIARITY SOME PROJECTMANAGEMENT TASKS NOT REQUIRED. FORMAL INTERFACE REQUIRED WITHCUSTOMER. LITTLE COLLOCATION OF PRIME CONTRACTOR, TEAM MEMBERSAND CUSTOMER. C-SPEC FINANCIAL ACCOUNTING AND MANY OTHERCOMPLIANCE DOCUMENTS REQUIRED.
TOTAL COSTS - THROUGH G&A: (xlOOO)
UNIT QUANTITY DEVELOPMENT PEP PRODUCTION TOTAL
DEVELOPMENT $46,971.0 $46,971.0A' 5 $12,417.0 $31,036.3 $43,453.3
25 $15,553.3 $93,729.1 $109,282.450 $19,274.6 $144,041.1 $163,315.7100 $23,691.0 $228,142.4 $251,833.4150 $30,673.1 $310,228.0 $340,901.1
UNIT COSTS - THROUGH G&A: (xlOOO)
AVERAGE UNIT COST BY SEGMENT
UNIT QUANTITY DEVELOPMENT PEP PRODUCTION TOTAL
2 $23,485.5 $23,485.55 $9,394.2 $2,483.4 $6,207.3 $18,084.9
25 $1,878.8 $622.1 $3,749.2 $6,250.150 $939.4 $385.5 $2,880.8 $4,205.7100 $469.7 $236.9 $2,281.4 $2,988.0150 $313.1 $204.5 $2,068.2 $2,585.8
EXECUTIVE SUMMARY - 36
IDARPA - SPACE SYSTEM COST STUDY
VARIABLE 6OPTION 1
(TABLE 1.3.6.%)
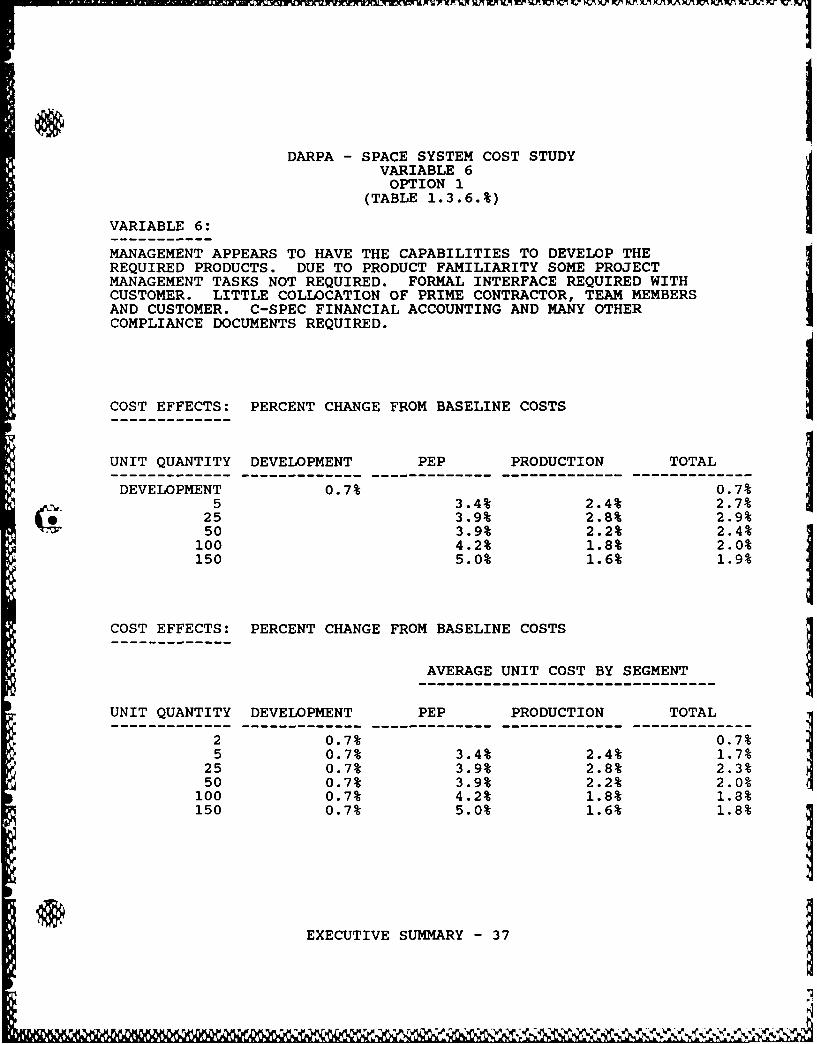
VARIABLE 6:
MANAGEMENT APPEARS TO HAVE THE CAPABILITIES TO DEVELOP THEREQUIRED PRODUCTS. DUE TO PRODUCT FAMILIARITY SOME PROJECTMANAGEMENT TASKS NOT REQUIRED. FORMAL INTERFACE REQUIRED WITHCUSTOMER. LITTLE COLLOCATION OF PRIME CONTRACTOR, TEAM MEMBERS IAND CUSTOMER. C-SPEC FINANCIAL ACCOUNTING AND MANY OTHERCOMPLIANCE DOCUMENTS REQUIRED.
COST EFFECTS: PERCENT CHANGE FROM BASELINE COSTS
UNIT QUANTITY DEVELOPMENT PEP PRODUCTION TOTAL
DEVELOPMENT 0.7% 0.7%5 3.4% 2.4% 2.7%
25 3.9% 2.8% 2.9%50 3.9% 2.2% 2.4%
100 4.2% 1.8% 2.0%150 5.0% 1.6% 1.9%
COST EFFECTS: PERCENT CHANGE FROM BASELINE COSTS--------AVERAGE UNIT COST BY SEGMENT
UNIT QUANTITY DEVELOPMENT PEP PRODUCTION TOTAL
2 0.7% 0.7%5 0.7% 3.4% 2.4% 1.7%
25 0.7% 3.9% 2.8% 2.3%50 0.7% 3.9% 2.2% 2.0%
100 0.7% 4.2% 1.8% 1.8%150 0.7% 5.0% 1.6% 1.8%
EXECUTIVE SUMMARY - 37
DARPA - SPACE SYSTEM COST STUDYVARIABLE 6OPTION 2
(TABLE 1.3.6.$)
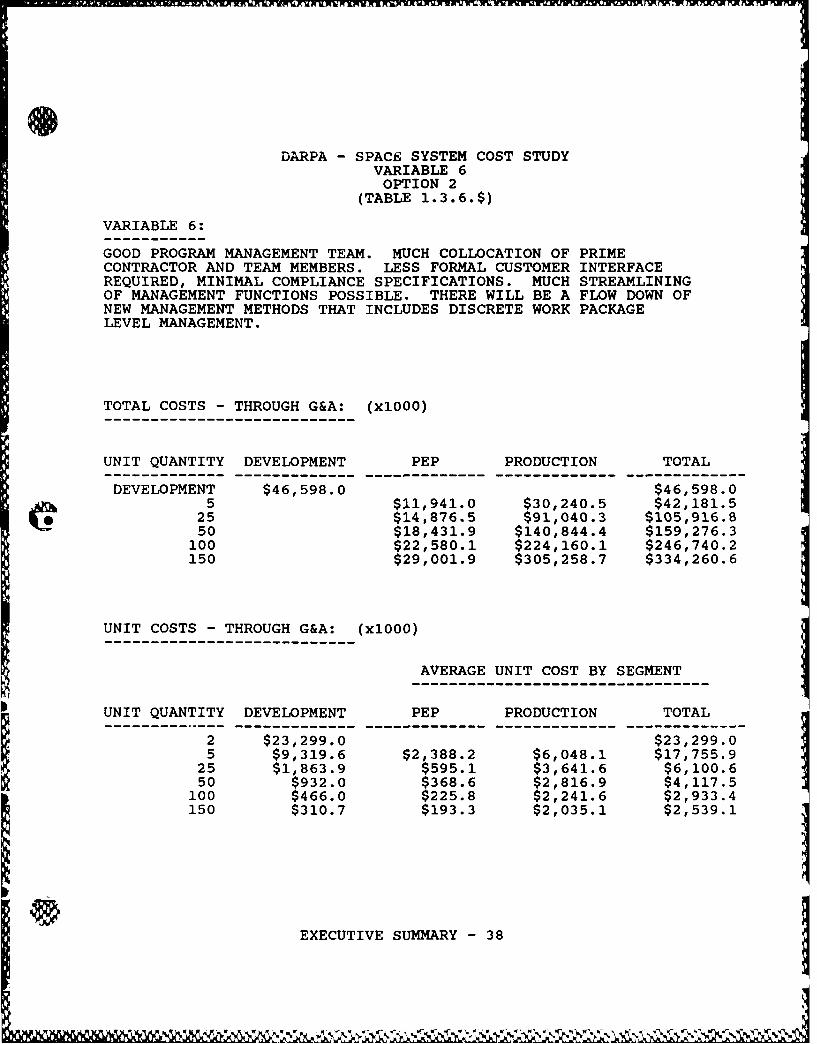
VARIABLE 6:
GOOD PROGRAM MANAGEMENT TEAM. MUCH COLLOCATION OF PRIMECONTRACTOR AND TEAM MEMBERS. LESS FORMAL CUSTOMER INTERFACEREQUIRED, MINIMAL COMPLIANCE SPECIFICATIONS. MUCH STREAMLININGOF MANAGEMENT FUNCTIONS POSSIBLE. THERE WILL BE A FLOW DOWN OFNEW MANAGEMENT METHODS THAT INCLUDES DISCRETE WORK PACKAGELEVEL MANAGEMENT.
TOTAL COSTS - THROUGH G&A: (xlOOO)
UNIT QUANTITY DEVELOPMENT PEP PRODUCTION TOTAL
DEVELOPMENT $46,598.0 $46,598.0A5 $11,941.0 $30,240.5 $42,181.5
25 $14,876.5 $91,040.3 $105,916.8
50 $18,431.9 $140,844.4 $159,276.3100 $22,580.1 $224,160.1 $246,740.2150 $29,001.9 $305,258.7 $334,260.6
UNIT COSTS - THROUGH G&A: (xlOOO)
AVERAGE UNIT COST BY SEGMENT
UNIT QUANTITY DEVELOPMENT PEP PRODUCTION TOTAL
2 $23,299.0 $23,299.05 $9,319.6 $2,388.2 $6,048.1 $17,755.9
25 $1,863.9 $595.1 $3,641.6 $6,100.650 $932.0 $368.6 $2,816.9 $4,117.5
100 $466.0 $225.8 $2,241.6 $2,933.4150 $310.7 $193.3 $2,035.1 $2,539.1
EXECUTIVE SUMMARY - 38

DARPA - SPACE SYSTEM COST STUDYVARIABLE 6OPTION 2
(TABLE 1.3.6.%)
VARIABLE 6:
GOOD PROGRAM MANAGEMENT TEAM. MUCH COLLOCATION OF PRIMECONTRACTOR AND TEAM MEMBERS. LESS FORMAL CUSTOMER INTERFACEREQUIRED, MINIMAL COMPLIANCE SPECIFICATIONS. MUCH STREAMLININGOF MANAGEMENT FUNCTIONS POSSIBLE. THERE WILL BE A FLOW DOWN OFNEW MANAGEMENT METHODS THAT INCLUDES DISCRETE WORK PACKAGELEVEL MANAGEMENT.
COST EFFECTS: PERCENT CHANGE FROM BASELINE COSTS
UNIT QUANTITY DEVELOPMENT PEP PRODUCTION TOTAL
DEVELOPMENT 1.5% 1.5%5 7.1% 4.9% 5.6%
25 8.1% 5.6% 5.9%50 8.1% 4.4% 4.8%
100 8.7% 3.5% 4.0%150 10.1% 3.2% 3.8%
COST EFFECTS: PERCENT CHANGE FROM BASELINE COSTS
AVERAGE UNIT COST BY SEGMENT
UNIT QUANTITY DEVELOPMENT PEP PRODUCTION TOTAL
2 1.5% 1.5%5 1.5% 7.1% 4.9% 3.5%
25 1.5% 8.1% 5.6% 4.6%50 1.5% 8.1% 4.4% 4.1%
100 1.5% 8.7% 3.5% 3.6%150 1.5% 10.1% 3.2% 3.6%
@IEXECUTIVE SUMMARY - 39
IN*

DARPA - SPACE SYSTEM COST STUDYVARIABLE 6OPTION 3
(TABLE 1.3.6.$)VARIABLE 6 :
MANAGEMENT HAS EXTENSIVE EXPERIENCE IN PRODUCT AREA. PRIME ANDTEAM MEMBERS ARE INDUSTRY LEADERS IN THEIR RESPECTIVE PRODUCTLINES. EXTENSIVE COLLOCATION OF PRIME CONTRACTOR AND TEAM MEMBERS.INFORMAL CUSTOMER INTERFACE REQUIRED, MINIMAL COMPLIANCESPECIFICATIONS. EXTENSIVE STREAMLINING OF MANAGEMENT FUNCTIONSPOSSIBLE. THERE WILL BE A FLOW DOWN OF NEW MANAGEMENT METHODSTHAT INCLUDES DISCRETE WORK PACKAGE LEVEL MANAGEMENT.
TOTAL COSTS - THROUGH G&A: (xl000)
UNIT QUANTITY DEVELOPMENT PEP PRODUCTION TOTAL
DEVELOPMENT $46,379.2 $46,379.25 $11,368.5 $29,460.0 $40,828.5
25 $14,083.5 $88,293.3 $102,376.850 $17,451.7 $137,602.6 $155,054.3
100 $21,308.6 $220,155.8 $241,464.4150 $27,127.0 $300,279.2 $327,406.2
UNIT COSTS - THROUGH G&A: (xlOOO)
AVERAGE UNIT COST BY SEGMENT
UNIT QUANTITY DEVELOPMENT PEP PRODUCTION TOTAL
2 $23,189.6 $23,189.65 $9,275.8 $2,273.7 $5,892.0 $17,441.5
25 $1,855.2 $563.3 $3,531.7 $5,950.250 $927.6 $349.0 $2,752.1 $4,028.7
100 $463.8 $213.1 $2,201.6 $2,878.4150 $309.2 $180.8 $2,001.9 $2,491.9
EXECUTIVE SUMMARY - 40

@IDARPA - SPACE SYSTEM COST STUDY
VARIABLE 6OPTION 3
(TABLE 1.3.6.%)
VARIABLE 6:
MANAGEMENT HAS EXTENSIVE EXPERIENCE IN PRODUCT AREA. PRIME ANDTEAM MEMBERS ARE INDUSTRY LEADERS IN THEIR RESPECTIVE PRODUCTLINES. EXTENSIVE COLLOCATION OF PRIME CONTRACTOR AND TEAM MEMBERS.INFORMAL CUSTOMER INTERFACE REQUIRED, MINIMAL COMPLIANCESPECIFICATIONS. EXTENSIVE STREAMLINING OF MANAGEMENT FUNCTIONSPOSSIBLE. THERE WILL BE A FLOW DOWN OF NEW MANAGEMENT METHODSTHAT INCLUDES DISCRETE WORK PACKAGE LEVEL MANAGEMENT.
COST EFFECTS: PERCENT CHANGE FROM BASELINE COSTS
UNIT QUANTITY DEVELOPMENT PEP PRODUCTION TOTAL
DEVELOPMENT 2.0% 2.0%5 11.5% 7.4% 8.6%
25 13.0% 8.4% 9.1%
50 13.0% 6.6% 7.3%100 13.9% 5.2% 6.0%150 15.9% 4.8% 5.8%
COST EFFECTS: PERCENT CHANGE FROM BASELINE COSTS
AVERAGE UNIT COST BY SEGMENT
UNIT QUANTITY DEVELOPMENT PEP PRODUCTION TOTAL
2 2.0% 2.0%5 2.0% 11.5% 7.4% 5.2%
25 2.0% 13.0% 8.4% 7.0%50 2.0% 13.0% 6.6% 6.2%
100 2.0% 13.9% 5.2% 5.4%150 2.0% 15.9% 4.8% 5.4%
EXECUTIVE SUMMARY - 41
wit
DARPA - SPACE SYSTEM COST STUDYVARIABLE 7OPTION 1
(TABLE 1.3.7.$)
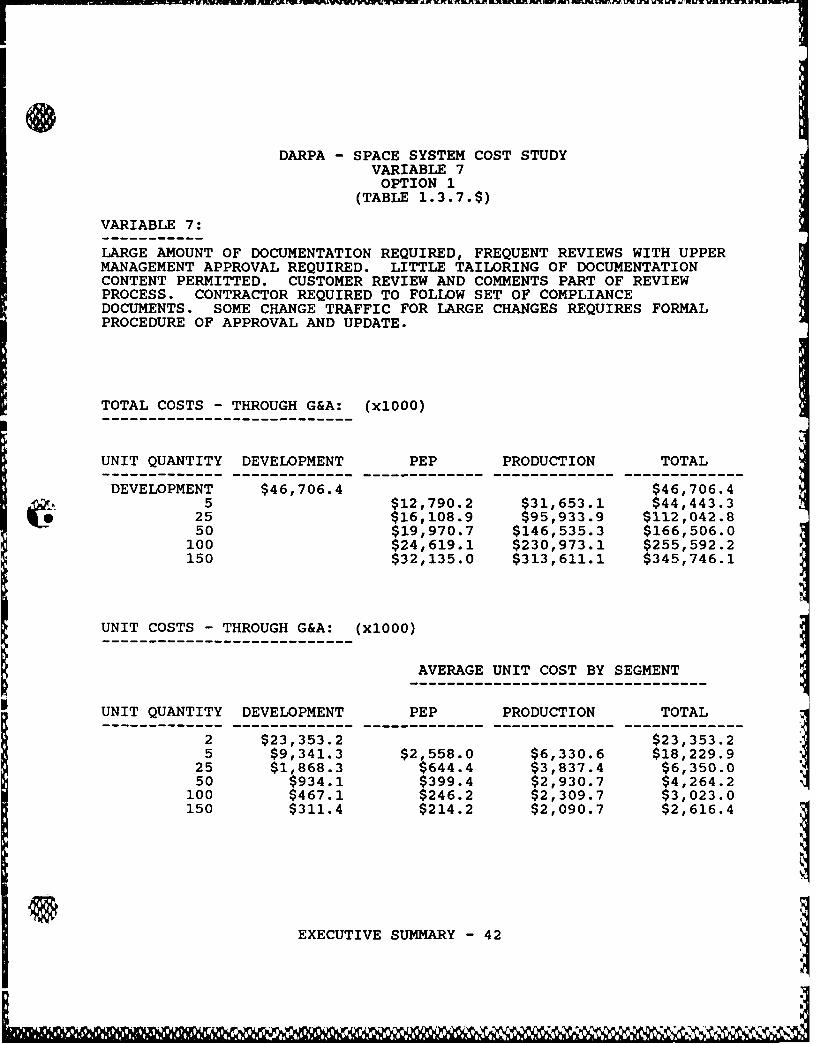
VARIABLE 7:
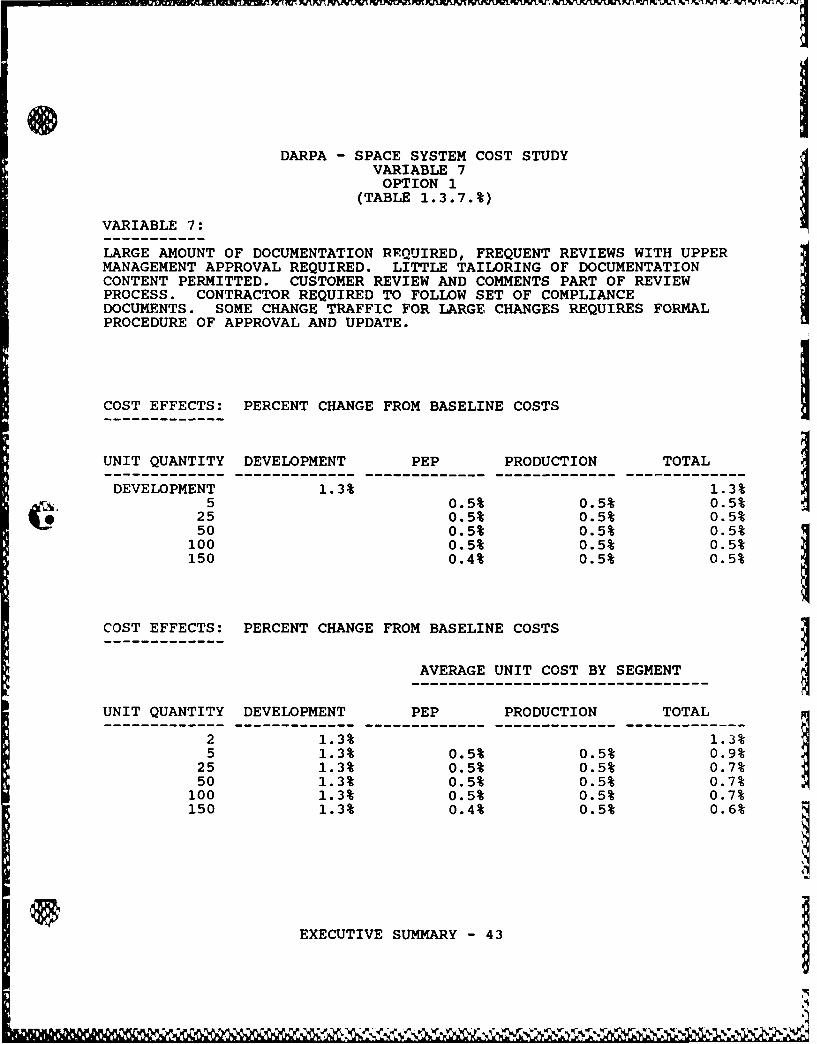
LARGE AMOUNT OF DOCUMENTATION REQUIRED, FREQUENT REVIEWS WITH UPPERMANAGEMENT APPROVAL REQUIRED. LITTLE TAILORING OF DOCUMENTATIONCONTENT PERMITTED. CUSTOMER REVIEW AND COMMENTS PART OF REVIEWPROCESS. CONTRACTOR REQUIRED TO FOLLOW SET OF COMPLIANCEDOCUMENTS. SOME CHANGE TRAFFIC FOR LARGE CHANGES REQUIRES FORMALPROCEDURE OF APPROVAL AND UPDATE.
TOTAL COSTS - THROUGH G&A: (xlOOO)
UNIT QUANTITY DEVELOPMENT PEP PRODUCTION TOTAL
DEVELOPMENT $46,706.4 $46,706.45 $12,790.2 $31,653.1 $44,443.3
25 $16,108.9 $95,933.9 $112,042.850 $19,970.7 $146,535.3 $166,506.0
100 $24,619.1 $230,973.1 $255,592.2150 $32,135.0 $313,611.1 $345,746.1
UNIT COSTS - THROUGH G&A: (xlOOO)
AVERAGE UNIT COST BY SEGMENT
UNIT QUANTITY DEVELOPMENT PEP PRODUCTION TOTAL
2 $23,353.2 $23,353.25 $9,341.3 $2,558.0 $6,330.6 $18,229.9
25 $1,868.3 $644.4 $3,837.4 $6,350.050 $934.1 $399.4 $2,930.7 $4,264.2100 $467.1 $246.2 $2,309.7 $3,023.0150 $311.4 $214.2 $2,090.7 $2,616.4
EXECUTIVE SUMMARY - 42
DARPA - SPACE SYSTEM COST STUDYVARIABLE 7OPTION 1
VARIABLE 7: (TABLE 1.3.7.%)
-----------
LARGE AMOUNT OF DOCUMENTATION REQUIRED, FREQUENT REVIEWS WITH UPPERMANAGEMENT APPROVAL REQUIRED. LITTLE TAILORING OF DOCUMENTATIONCONTENT PERMITTED. CUSTOMER REVIEW AND COMMENTS PART OF REVIEWPROCESS. CONTRACTOR REQUIRED TO FOLLOW SET OF COMPLIANCEDOCUMENTS. SOME CHANGE TRAFFIC FOR LARGE CHANGES REQUIRES FORMALPROCEDURE OF APPROVAL AND UPDATE.
COST EFFECTS: PERCENT CHANGE FROM BASELINE COSTS
UNIT QUANTITY DEVELOPMENT PEP PRODUCTION TOTAL
DEVELOPMENT 1.3% 1.3%5 0.5% 0.5% 0.5%
25 0.5% 0.5% 0.5%50 0.5% 0.5% 0.5%
100 0.5% 0.5% 0.5%150 0.4% 0.5% 0.5%
COST EFFECTS: PERCENT CHANGE FROM BASELINE COSTS
AVERAGE UNIT COST BY SEGMENT
UNIT QUANTITY DEVELOPMENT PEP PRODUCTION TOTAL
2 1.3% 1.3%5 1.3% 0.5% 0.5% 0.9%
25 1.3% 0.5% 0.5% 0.7%50 1.3% 0.5% 0.5% 0.7%100 1.3% 0.5% 0.5% 0.7%
150 1.3% 0.4% 0.5% 0.6%
EXECUTIVE SUMMARY - 43
.9

DARPA - SPACE SYSTEM COST STUDYVARIABLE 7OPTION 2
(TABLE 1.3.7.$)
VARIABLE 7:
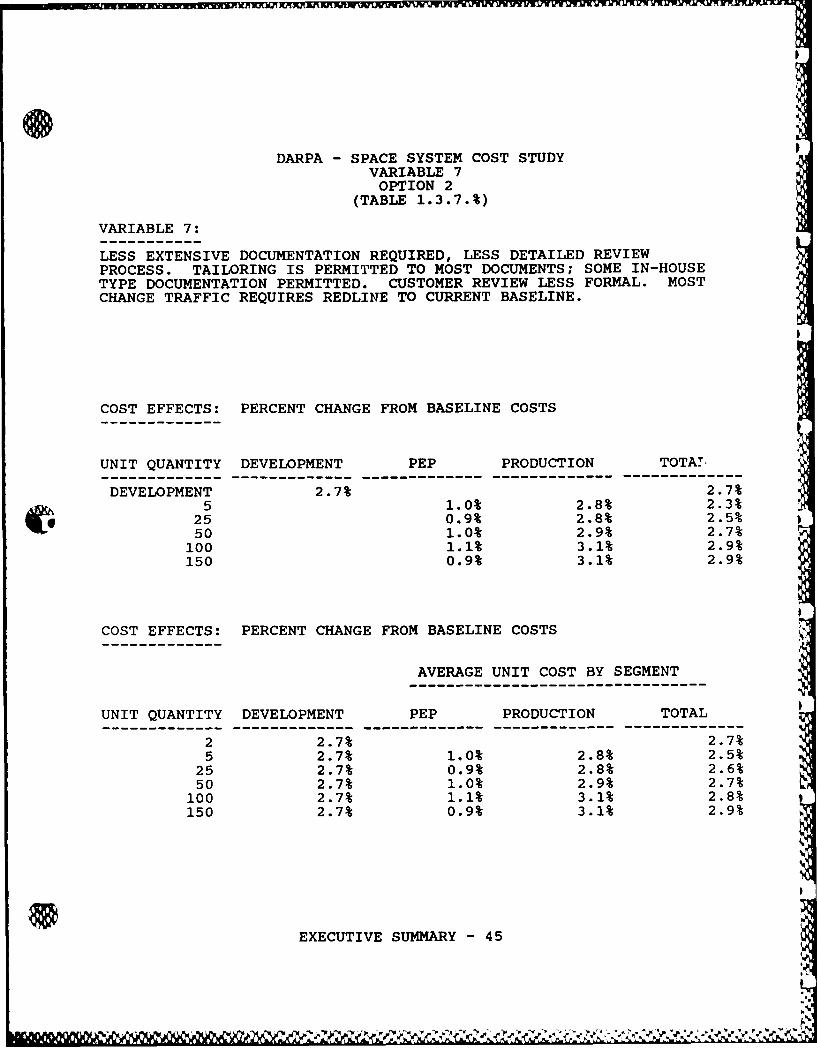
LESS EXTENSIVE DOCUMENTATION REQUIRED, LESS DETAILED REVIEWPROCESS. TAILORING IS PERMITTED TO MOST DOCUMENTS; SOME IN-HOUSETYPE DOCUMENTATION PERMITTED. CUSTOMER REVIEW LESS FORMAL. MOSTCHANGE TRAFFIC REQUIRES REDLINE TO CURRENT BASELINE.
TOTAL COSTS - THROUGH G&A: (xlOOO)
UNIT QUANTITY DEVELOPMENT PEP PRODUCTION TOTAL
DEVELOPMENT $46,022.4 $46,022.45 $12,719.5 $30,912.3 $43,631.8
25 $16,036.4 $93,732.5 $109,768.950 $19,864.5 $142,969.8 $162,834.3
100 $24,473.3 $225,117.0 $249,590.3150 $31,968.8 $305,549.6 $337,518.4
UNIT COSTS - THROUGH G&A: (xlOOO)
AVERAGE UNIT COST BY SEGMENT
UNIT QUANTITY DEVELOPMENT PEP PRODUCTION TOTAL
2 $23,011.2 $23,011.25 $9,204.5 $2,543.9 $6,182.5 $17,930.8
25 $1,840.9 $641.5 $3,749.3 $6,231.750 $920.4 $397.3 $2,859.4 $4,177.1
100 $460.2 $244.7 $2,251.2 $2,956.1150 $306.8 $213.1 $2,037.0 $2,556.9
EXECUTIVE SUMMARY - 44
DARPA - SPACE SYSTEM COST STUDYVARIABLE 7
OPTION 2(TABLE 1.3.7.%)
VARIABLE 7:
LESS EXTENSIVE DOCUMENTATION REQUIRED, LESS DETAILED REVIEWPROCESS. TAILORING IS PERMITTED TO MOST DOCUMENTS; SOME IN-HOUSETYPE DOCUMENTATION PERMITTED. CUSTOMER REVIEW LESS FORMAL. MOSTCHANGE TRAFFIC REQUIRES REDLINE TO CURRENT BASELINE.
COST EFFECTS: PERCENT CHANGE FROM BASELINE COSTS
UNIT QUANTITY DEVELOPMENT PEP PRODUCTION TOTAT
DEVELOPMENT 2.7% 2.7%5 1.0% 2.8% 2.3%
25 0.9% 2.8% 2.5%50 1.0% 2.9% 2.7%
100 1.1% 3.1% 2.9%150 0.9% 3.1% 2.9%
COST EFFECTS: PERCENT CHANGE FROM BASELINE COSTS
AVERAGE UNIT COST BY SEGMENT
UNIT QUANTITY DEVELOPMENT PEP PRODUCTION TOTAL
2 2.7% 2.7%5 2.7% 1.0% 2.8% 2.5%
25 2.7% 0.9% 2.8% 2.6%50 2.7% 1.0% 2.9% 2.7%00 2.7% 1.1% 3.1% 2.8%
150 2.7% 0.9% 3.1% 2.9%
EXECUTIVE SUMMARY - 45
'TIVU~4JV~J~L1~ w u WI , j E''VU 'J Wii vwlru: W% ir
DARPA - SPACE SYSTEM COST STUDYVARIABLE 7OPTION 3
(TABLE 1.3.7.$)
VARIABLE 7:
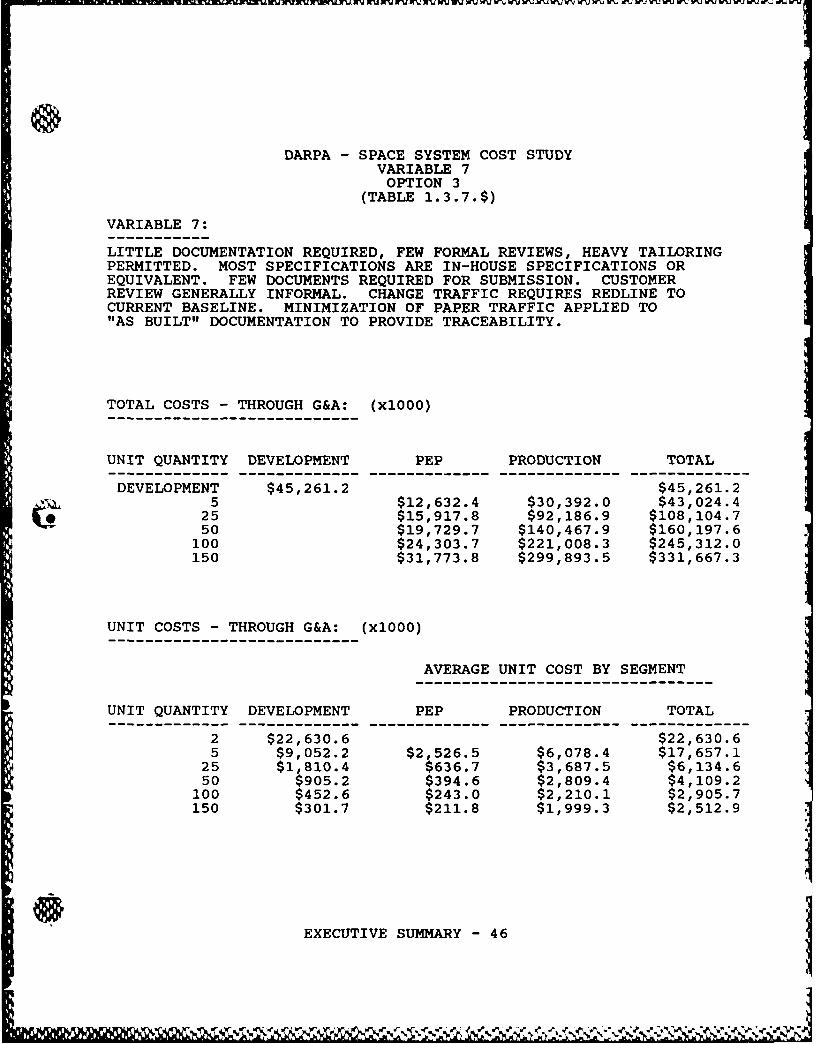
LITTLE DOCUMENTATION REQUIRED, FEW FORMAL REVIEWS, HEAVY TAILORINGPERMITTED. MOST SPECIFICATIONS ARE IN-HOUSE SPECIFICATIONS OREQUIVALENT. FEW DOCUMENTS REQUIRED FOR SUBMISSION. CUSTOMERREVIEW GENERALLY INFORMAL. CHANGE TRAFFIC REQUIRES REDLINE TOCURRENT BASELINE. MINIMIZATION OF PAPER TRAFFIC APPLIED TO"AS BUILT" DOCUMENTATION TO PROVIDE TRACEABILITY.
TOTAL COSTS - THROUGH G&A: (xl000)
UNIT QUANTITY DEVELOPMENT PEP PRODUCTION TOTAL
DEVELOPMENT $45,261.2 $45,261.25 $12,632.4 $30,392.0 $43,024.4
25 $15,917.8 $92,186.9 $108,104.750 $19,729.7 $140,467.9 $160,197.6
100 $24,303.7 $221,008.3 $245,312.0150 $31,773.8 $299,893.5 $331,667.3
UNIT COSTS - THROUGH G&A: (xlOOO)
AVERAGE UNIT COST BY SEGMENT
UNIT QUANTITY DEVELOPMENT PEP PRODUCTION TOTAL
2 $22,630.6 $22,630.65 $9,052.2 $2,526.5 $6,078.4 $17,657.1
25 $1,810.4 $636.7 $3,687.5 $6,134.650 $905.2 $394.6 $2,809.4 $4,109.2
100 $452.6 $243.0 $2,210.1 $2,905.7150 $301.7 $211.8 $1,999.3 $2,512.9
EXECUTIVE SUMMARY - 46
DARPA - SPACE SYSTEM COST STUDYVARIABLE 7OPTION 3
VARIABLE 7: (TABLE 1.3.7.%)
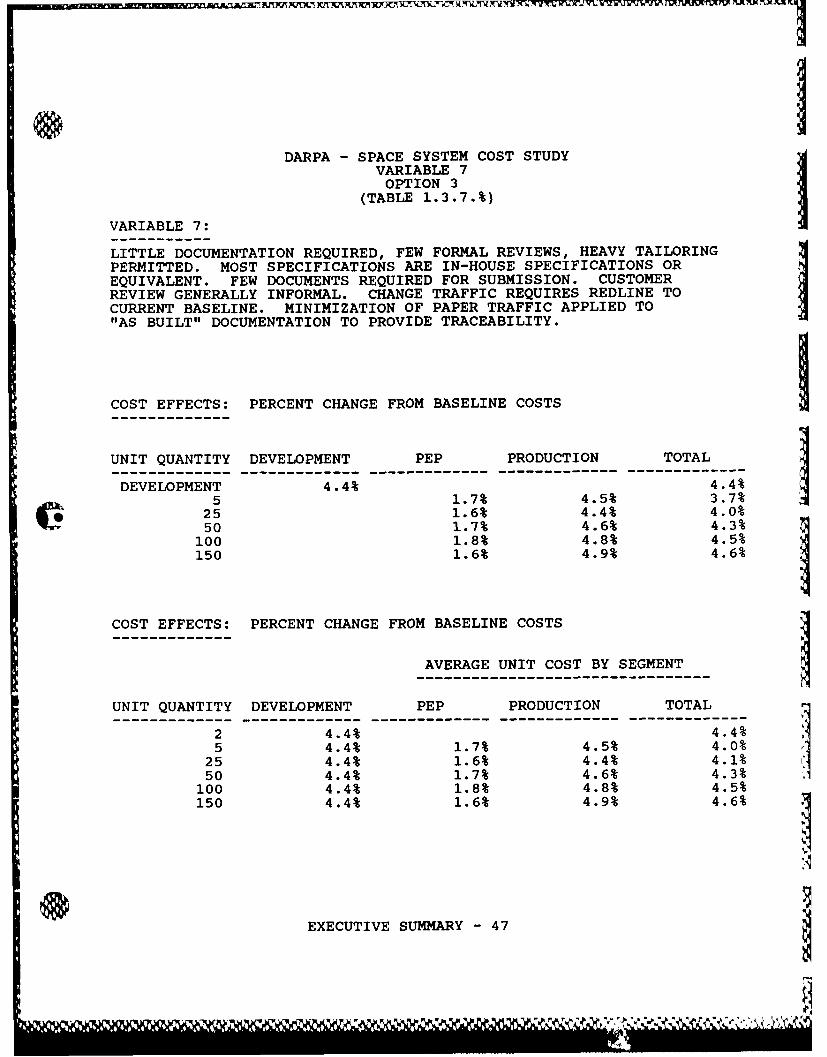
LITTLE DOCUMENTATION REQUIRED, FEW FORMAL REVIEWS, HEAVY TAILORINGPERMITTED. MOST SPECIFICATIONS ARE IN-HOUSE SPECIFICATIONS OREQUIVALENT. FEW DOCUMENTS REQUIRED FOR SUBMISSION. CUSTOMERREVIEW GENERALLY INFORMAL. CHANGE TRAFFIC REQUIRES REDLINE TOCURRENT BASELINE. MINIMIZATION OF PAPER TRAFFIC APPLIED TO"AS BUILT" DOCUMENTATION TO PROVIDE TRACEABILITY.
COST EFFECTS: PERCENT CHANGE FROM BASELINE COSTS
UNIT QUANTITY DEVELOPMENT PEP PRODUCTION TOTAL
DEVELOPMENT 4.4% 4.4%
5 1.7% 4.5% 3.7%25 1.6% 4.4% 4.0%50 1.7% 4.6% 4.3%
100 1.8% 4.8% 4.5%150 1.6% 4.9% 4.6%
COST EFFECTS: PERCENT CHANGE FROM BASELINE COSTS
AVERAGE UNIT COST BY SEGMENT
UNIT QUANTITY DEVELOPMENT PEP PRODUCTION TOTAL
2 4.4% 4.4%5 4.4% 1.7% 4.5% 4.0%
25 4.4% 1.6% 4.4% 4.1%50 4.4% 1.7% 4.6% 4.3%
100 4.4% 1.8% 4.8% 4.5%150 4.4% 1.6% 4.9% 4.6%
ESEXECUTIVE SUMMARY - 47
- xy ;
A.
DARPA - SPACE SYSTEM COST STUDYVARIABLE 8
OPTION 1(TABLE 1.3.8.$)
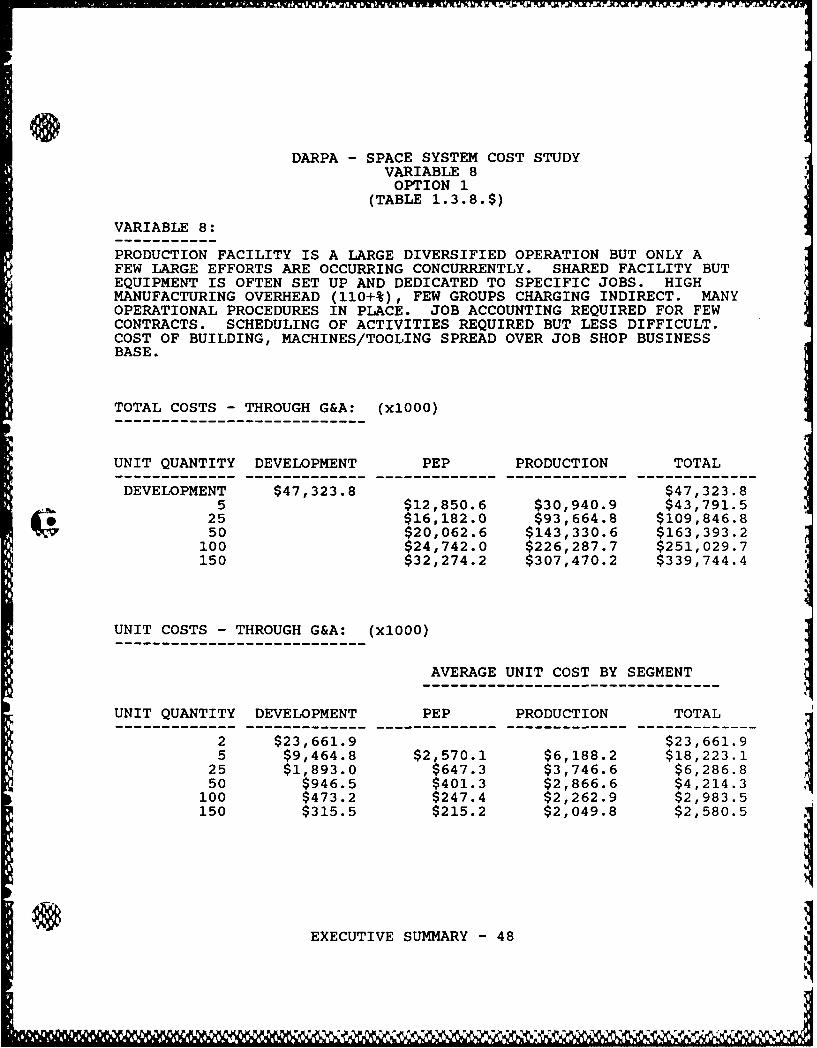
VARIABLE 8:
PRODUCTION FACILITY IS A LARGE DIVERSIFIED OPERATION BUT ONLY AFEW LARGE EFFORTS ARE OCCURRING CONCURRENTLY. SHARED FACILITY BUTEQUIPMENT IS OFTEN SET UP AND DEDICATED TO SPECIFIC JOBS. HIGHMANUFACTURING OVERHEAD (110+%), FEW GROUPS CHARGING INDIRECT. MANYOPERATIONAL PROCEDURES IN PLACE. JOB ACCOUNTING REQUIRED FOR FEWCONTRACTS. SCHEDULING OF ACTIVITIES REQUIRED BUT LESS DIFFICULT.COST OF BUILDING, MACHINES/TOOLING SPREAD OVER JOB SHOP BUSINESSBASE.
TOTAL COSTS - THROUGH G&A: (xlOOO)
UNIT QUANTITY DEVELOPMENT PEP PRODUCTION TOTAL
DEVELOPMENT $47,323.8 $47,323.85 $12,850.6 $30,940.9 $43,791.5
25 $16,182.0 $93,664.8 $109,846.850 $20,062.6 $143,330.6 $163,393.2
100 $24,742.0 $226,287.7 $251,029.7150 $32,274.2 $307,470.2 $339,744.4
UNIT COSTS - THROUGH G&A: (xlOOO)
AVERAGE UNIT COST BY SEGMENT
UNIT QUANTITY DEVELOPMENT PEP PRODUCTION TOTAL
2 $23,661.9 $23,661.95 $9,464.8 $2,570.1 $6,188.2 $18,223.1
25 $1,893.0 $647.3 $3,746.6 $6,286.850 $946.5 $401.3 $2,866.6 $4,214.3
100 $473.2 $247.4 $2,262.9 $2,983.5150 $315.5 $215.2 $2,049.8 $2,580.5
EXECUTIVE SUMMARY - 48
p~km o ' ' - --- -- - s.
DARPA - SPACE SYSTEM COST STUDYVARIABLE 8OPTION 1
(TABLE 1.3.8.%)
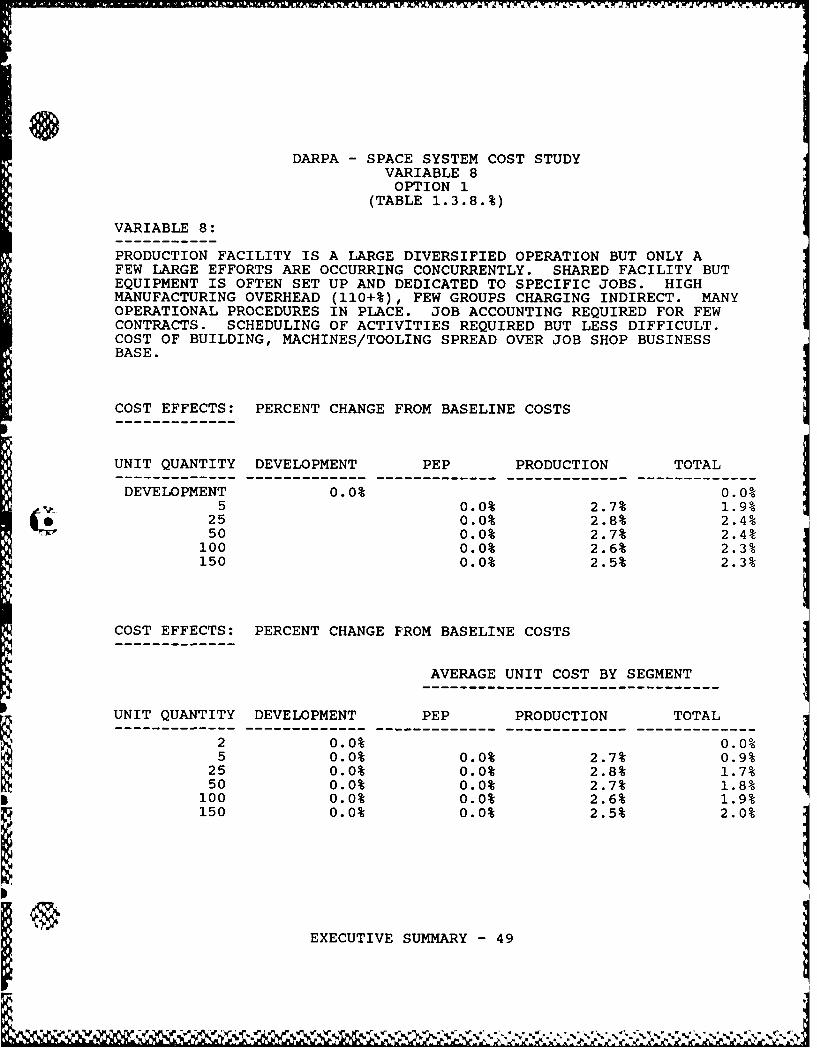
VARIABLE 8:
PRODUCTION FACILITY IS A LARGE DIVERSIFIED OPERATION BUT ONLY AFEW LARGE EFFORTS ARE OCCURRING CONCURRENTLY. SHARED FACILITY BUTEQUIPMENT IS OFTEN SET UP AND DEDICATED TO SPECIFIC JOBS. HIGHMANUFACTURING OVERHEAD (110+%), FEW GROUPS CHARGING INDIRECT. MANYOPERATIONAL PROCEDURES IN PLACE. JOB ACCOUNTING REQUIRED FOR FEWCONTRACTS. SCHEDULING OF ACTIVITIES REQUIRED BUT LESS DIFFICULT.COST OF BUILDING, MACHINES/TOOLING SPREAD OVER JOB SHOP BUSINESSBASE.
COST EFFECTS: PERCENT CHANGE FROM BASELINE COSTS
UNIT QUANTITY DEVELOPMENT PEP PRODUCTION TOTAL
DEVELOPMENT 0.0% 0.0%5 0.0% 2.7% 1.9%
25 0.0% 2.8% 2.4%50 0.0% 2.7% 2.4%
100 0.0% 2.6% 2.3%150 0.0% 2.5% 2.3%
COST EFFECTS: PERCENT CHANGE FROM BASELINE COSTS
AVERAGE UNIT COST BY SEGMENT
UNIT QUANTITY DEVELOPMENT PEP PRODUCTION TOTAL
2 0.0% 0.0%5 0.0% 0.0% 2.7% 0.9%
25 0.0% 0.0% 2.8% 1.7%50 0.0% 0.0% 2.7% 1.8%
100 0.0% 0.0% 2.6% 1.9%150 0.0% 0.0% 2.5% 2.0%
EXECUTIVE SUMMARY - 49
DARPA - SPAVE SYSTEM COST STUDYVARIABLE 8OPTION 2
(TABLE 1.3.8.$)
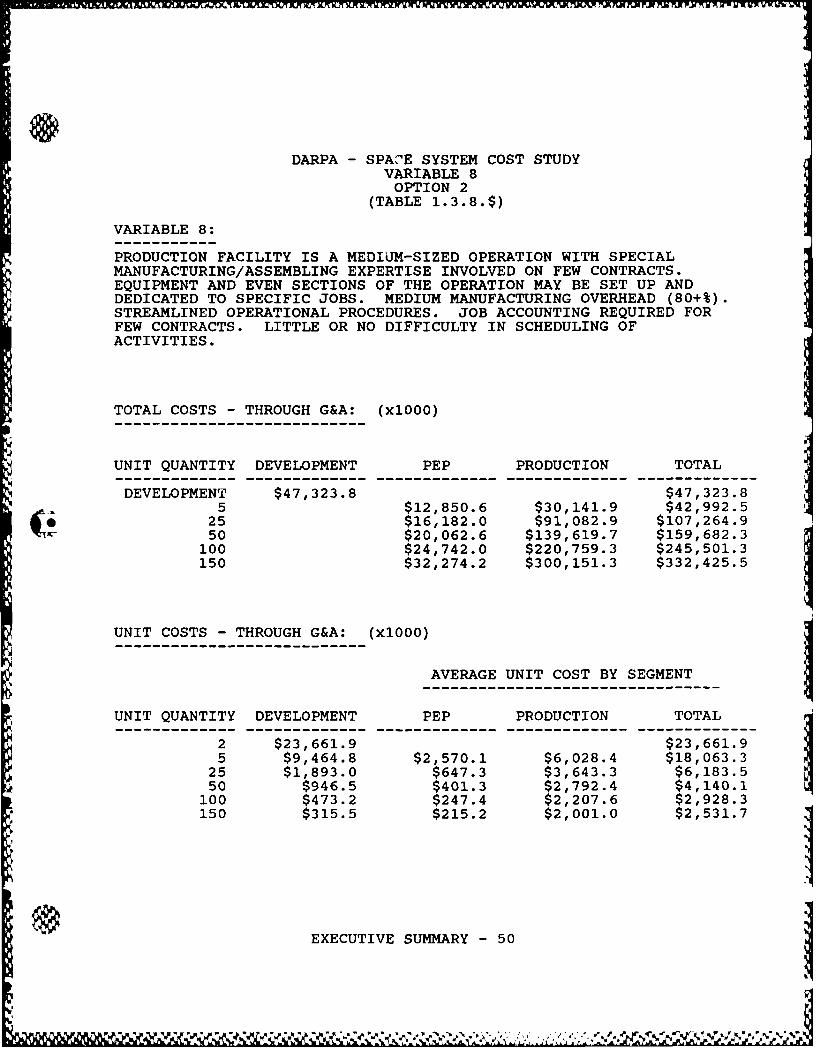
VARIABLE 8:
PRODUCTION FACILITY IS A MEDIUM-SIZED OPERATION WITH SPECIALMANUFACTURING/ASSEMBLING EXPERTISE INVOLVED ON FEW CONTRACTS.EQUIPMENT AND EVEN SECTIONS OF THE OPERATION MAY BE SET UP ANDDEDICATED TO SPECIFIC JOBS. MEDIUM MANUFACTURING OVERHEAD (80+%).STREAMLINED OPERATIONAL PROCEDURES. JOB ACCOUNTING REQUIRED FORFEW CONTRACTS. LITTLE OR NO DIFFICULTY IN SCHEDULING OFACTIVITIES.
TOTAL COSTS - THROUGH G&A: (xlOOO)
UNIT QUANTITY DEVELOPMENT PEP PRODUCTION TOTAL
DEVELOPMENT $47,323.8 $47,323.85 $12,850.6 $30,141.9 $42,992.5
25 $16,182.0 $91,082.9 $107,264.950 $20,062.6 $139,619.7 $159,682.3
100 $24,742.0 $220,759.3 $245,501.3150 $32,274.2 $300,151.3 $332,425.5
UNIT COSTS - THROUGH G&A: (xlOOO)
AVERAGE UNIT COST BY SEGMENT
UNIT QUANTITY DEVELOPMENT PEP PRODUCTION TOTAL
2 $23,661.9 $23,661.95 $9,464.8 $2,570.1 $6,028.4 $18,063.3
25 $1,893.0 $647.3 $3,643.3 $6,183.550 $946.5 $401.3 $2,792.4 $4,140.1100 $473.2 $247.4 $2,207.6 $2,928.3
150 $315.5 $215.2 $2,001.0 $2,531.7
EXECUTIVE SUMMARY - 50

DARPA - SPACE SYSTEM COST STUDYVARIABLE 8OPTION 2
(TABLE 1.3.8.%)
VARIABLE 8:
PRODUCTION FACILITY IS A MEDIUM-SIZED OPERATION WITH SPECIALMANUFACTURING/ASSEMBLING EXPERTISE INVOLVED ON FEW CONTRACTS.EQUIPMENT AND EVEN SECTIONS OF THE OPERATION MAY BE SET UP ANDDEDICATED TO SPECIFIC JOBS. MEDIUM MANUFACTURING OVERHEAD (80+%).STREAMLINED OPERATIONAL PROCEDURES. JOB ACCOUNTING REQUIRED FORFEW CONTRACTS. LITTLE OR NO DIFFICULTY IN SCHEDULING OFACTIVITIES.
COST EFFECTS: PERCENT CHANGE FROM BASELINE COSTS
UNIT QUANTITY DEVELOPMENT PEP PRODUCTION TOTAL
DEVELOPMENT 0.0% 0.0%5 0.0% 5.2% 3.7%
25 0.0% 5.5% 4.7%50 0.0% 5.2% 4.6%
100 0.0% 4.9% 4.5%150 0.0% 4.8% 4.4%
COST EFFECTS: PERCENT CHANGE FROM BASELINE COSTS
AVERAGE UNIT COST BY SEGMENT
UNIT QUANTITY DEVELOPMENT PEP PRODUCTION TOTAL
2 0.0% 0.0%5 0.0% 0.0% 5.2% 1.8%
25 0.0% 0.0% 5.5% 3.3%50 0.0% 0.0% 5.2% 3.6%
100 0.0% 0.0% 4.9% 3.8%150 0.0% 0.0% 4.8% 3.8%
EXECUTIVE SUMMARY 51

@IDARPA - SPACE SYSTEM COST STUDY
VARIABLE 8OPTION 3
VARIABLE 8: (TABLE 1.3.8.$)
PRODUCTION FACILITY IS A MEDIUM TO SMALL OPERATION WITH SPECIALMANUFACTURING/ASSEMBLING EXPERTISE DEDICATED TO ONE SPECIFICCONTRACT OR ORIENTED TOWARD PRODUCING A GENERIC FAMILY OFPRODUCTS. MUCH OF THE EQUIPMENT AND FACILITY IS DEDICATED TO ASPECIFIED CONTRACT. LOW MANUFACTURING OVERHEAD (50+%).STREAMLINED OPERATIONAL PROCEDURES. SIMPLE JOB ACCOUNTINGREQUIRED. SCHEDULING OF ACTIVITIES IS NOT DIFFICULT.
TOTAL COSTS - THROUGH G&A: (xlOOO)
UNIT QUANTITY DEVELOPMENT PEP PRODUCTION TOTAL
DEVELOPMENT $47,323.8 $47,323.85 $12,850.6 $29,336.8 $42,187.4
25 $16,182.0 $88,483.5 $104,665.550 $20,062.2 $135,895.9 $155,958.1
100 $24,742.0 $215,229.0 $239,971.0150 $32,274.2 $292,865.8 $325,140.0
UNIT COSTS - THROUGH G&A: (xlOOO)
AVERAGE UNIT COST BY SEGMENT
UNIT QUANTITY DEVELOPMENT PEP PRODUCTION TOTAL
2 $23,661.9 $23,661.95 $9,464.8 $2,570.1 $5,867.4 $17,902.2
25 $1,893.0 $647.3 $3,539.3 $6,079.6
50 $946.5 $401.2 $2,717.9 $4,065.6100 $473.2 $247.4 $2,152.3 $2,872.9150 $315.5 $215.2 $1,952.4 $2,483.1
EXECUTIVE SUMMARY - 52
I;.
0
DARPA - SPACE SYSTEM COST STUDYVARIABLE 8OPTION 3(TABLE 1. 3.8. %)
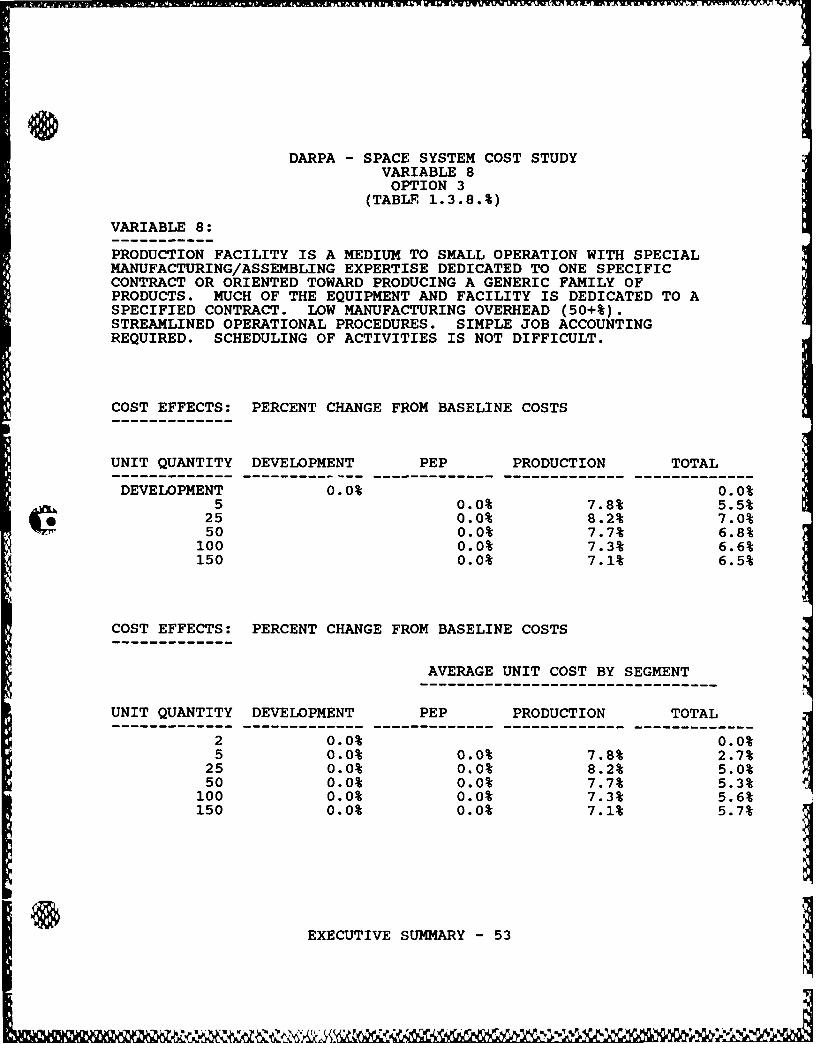
VARIABLE 8:
PRODUCTION FACILITY IS A MEDIUM TO SMALL OPERATION WITH SPECIALMANUFACTURING/ASSEMBLING EXPERTISE DEDICATED TO ONE SPECIFICCONTRACT OR ORIENTED TOWARD PRODUCING A GENERIC FAMILY OFPRODUCTS. MUCH OF THE EQUIPMENT AND FACILITY IS DEDICATED TO ASPECIFIED CONTRACT. LOW MANUFACTURING OVERHEAD (50+%).STREAMLINED OPERATIONAL PROCEDURES. SIMPLE JOB ACCOUNTINGREQUIRED. SCHEDULING OF ACTIVITIES IS NOT DIFFICULT.
COST EFFECTS: PERCENT CHANGE FROM BASELINE COSTS
UNIT QUANTITY DEVELOPMENT PEP PRODUCTION TOTAL
DEVELOPMENT 0.0% 0.0%5 0.0% 7.8% 5.5%
25 0.0% 8.2% 7.0%50 0.0% 7.7% 6.8%
100 0.0% 7.3% 6.6%150 0.0% 7.1% 6.5%
COST EFFECTS: PERCENT CHANGE FROM BASELINE COSTS
AVERAGE UNIT COST BY SEGMENT
UNIT QUANTITY DEVELOPMENT PEP PRODUCTION TOTAL
2 0.0% 0.0%5 0.0% 0.0% 7.8% 2.7%
25 0.0% 0.0% 8.2% 5.0%50 0.0% 0.0% 7.7% 5.3%
100 0.0% 0.0% 7.3% 5.6%150 0.0% 0.0% 7.1% 5.7%
EXECUTIVE SUMMARY - 53

DARPA - SPACE SYSTEM COST STUDYVARIABLE 9OPTION 1
(TABLE 1.3.9.$)
VARIABLE 9:
MOST PRODUCTION OPERATIONS ARE PERFORMED ON OLDER, MORE TRADITIONALMACHINE TOOL EQUIPMENT. SOME CRITICAL OPERATIONS ARE PERFORMED ONNEWER MACHINE TOOLS PROVIDING SOME IMPROVEMENT IN MANUFACTURINGEFFICIENCY. SOME TEST TOOLS ARE AVAILABLE DUE TO LOW COST.SOME ENHANCEMENT TO TESTING EFFICIENCY.
TOTAL COSTS - THROUGH G&A: (x1000)
UNIT QUANTITY DEVELOPMENT PEP PRODUCTION TOTAL
DEVELOPMENT $47,323.8 $47,323.85 $13,264.7 $31,274.1 $44,538.8
25 $16,652.5 $94,679.6 $111,332.1
50 $20,694.5 $144,309.4 $165,003.9100 $25,532.0 $227,161.7 $252,693.7150 $33,174.8 $308,376.0 $341,550.8
UNIT COSTS - THROUGH G&A: (xl000)
AVERAGE UNIT COST BY SEGMENT
UNIT QUANTITY DEVELOPMENT PEP PRODUCTION TOTAL
2 $23,661.9 $23,661.95 $9,464.8 $2,652.9 $6,254.8 $18,372.5
25 $1,893.0 $666.1 $3,787.2 $6,346.250 $946.5 $413.9 $2,886.2 $4,246.6100 $473.2 $255.3 $2,271.6 $3,000.2
150 $315.5 $221.2 $2,055.8 $2,592.5
EXECUTIVE SUMMARY - 54
0DARPA - SPACE SYSTEM COST STUDY
VARIABLE 9OPTION 1
(TABLE 1.3.9.%)
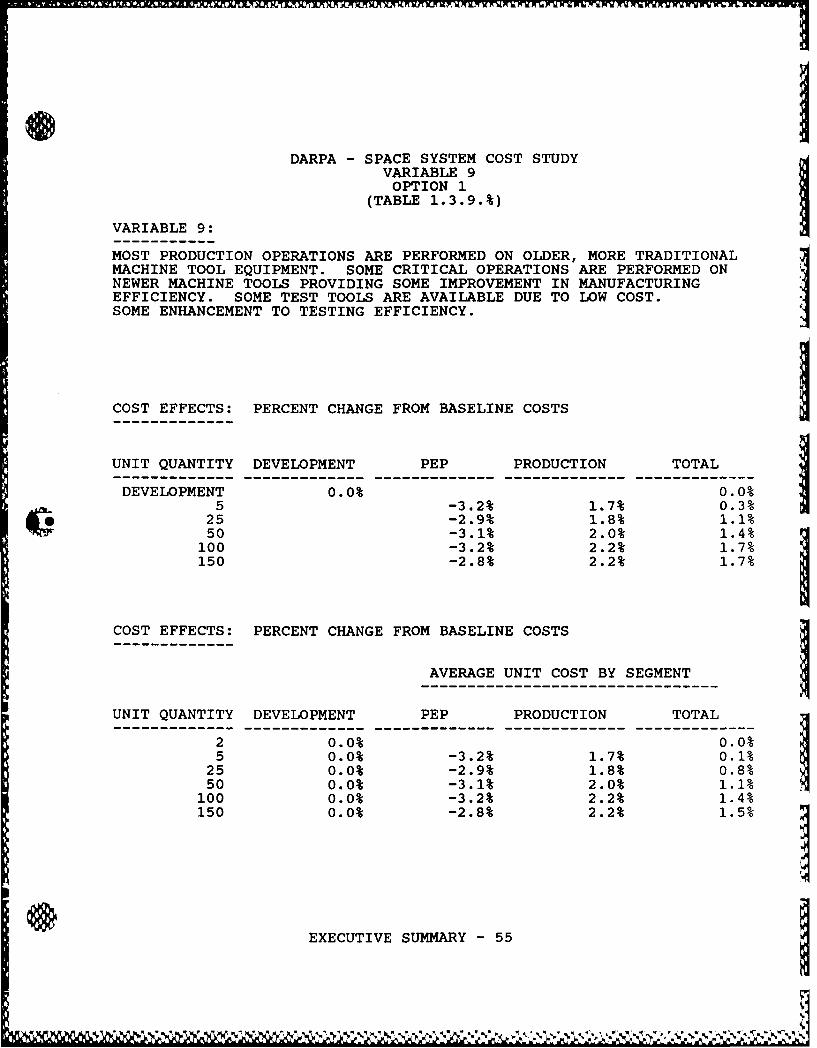
VARIABLE 9:
MOST PRODUCTION OPERATIONS ARE PERFORMED ON OLDER, MORE TRADITIONALMACHINE TOOL EQUIPMENT. SOME CRITICAL OPERATIONS ARE PERFORMED ONNEWER MACHINE TOOLS PROVIDING SOME IMPROVEMENT IN MANUFACTURINGEFFICIENCY. SOME TEST TOOLS ARE AVAILABLE DUE TO LOW COST.SOME ENHANCEMENT TO TESTING EFFICIENCY.
COST EFFECTS: PERCENT CHANGE FROM BASELINE COSTS
UNIT QUANTITY DEVELOPMENT PEP PRODUCTION TOTAL
DEVELOPMENT 0.0% 0.0%5 -3.2% 1.7% 0.3%25 -2.9% 1.8% 1.1%
50 -3.1% 2.0% 1.4%100 -3.2% 2.2% 1.7%150 -2.8% 2.2% 1.7%
COST EFFECTS: PERCENT CHANGE FROM BASELINE COSTS
AVERAGE UNIT COST BY SEGMENT
UNIT QUANTITY DEVELOPMENT PEP PRODUCTION TOTAL
2 0.0% 0.0%5 0.0% -3.2% 1.7% 0.1%
25 0.0% -2.9% 1.8% 0.8%50 0.0% -3.1% 2.0% 1.1%100 0.0% -3.2-% 2.2% 1.426
150 0.0% -2.8% 2.2% 1.5%
EXECUTIVE SUMMARY - 55
L~'%%

0
DARPA - SPACE SYSTEM COST STUDYVARIABLE 9OPTION 2
(TABLE 1.3.9.$)
VARIABLE 9:
AUTOMATED/COMPUTER-ENHANCED MANUFACTURING METHODS ARE USED IN MOSTCOMPLEX OPERATIONS. THESE TOOLS REDUCE PRODUCTION COSTS. TOOLSARE AVAILABLE ON THE FACTORY FLOOR - NO SPECIAL EQUIPMENT ISPURCHASED. TEST TOOLS ARE AVAILABLE IN MOST CRITICAL ASPECTS OFTESTING ACTIVITIES. SIGNIFICANT IMPROVEMENT OVER MANUAL TESTING.
TOTAL COSTS - THROUGH G&A: (xlOOO)
UNIT QUANTITY DEVELOPMENT PEP PRODUCTION TOTAL
DEVELOPMENT $47,323.8 $47,323.85 $13,601.4 $30,809.8 $44,411.2
25 $17,031.6 $93,181.9 $110,213.550 $21,208.2 $141,714.1 $162,922.3100 $26,167.7 $222,752.6 $248,920.3150 $33,895.5 $302,291.1 $336,186.6
UNIT COSTS - THROUGH G&A: (xlOOO)
AVERAGE UNIT COST BY SEGMENT
UNIT QUANTITY DEVELOPMENT PEP PRODUCTION TOTAL
2 $23,661.9 $23,661.95 $9,464.8 $2,720.3 $6,162.0 $18,347.0
25 $1,893.0 $681.3 $3,727.3 $6,301.550 $946.5 $424.2 $2,834.3 $4,204.9
100 $473.2 $261.7 $2,227.5 $2,962.4150 $315.5 $226.0 $2,015.3 $2,556.7
EU
EXECUTIVE SUMMARY - 56
DARPA - SPACE SYSTEM COST STUDYVARIABLE 9OPTION 2
(TABLE 1.3.9.%)
VARIABLE 9:
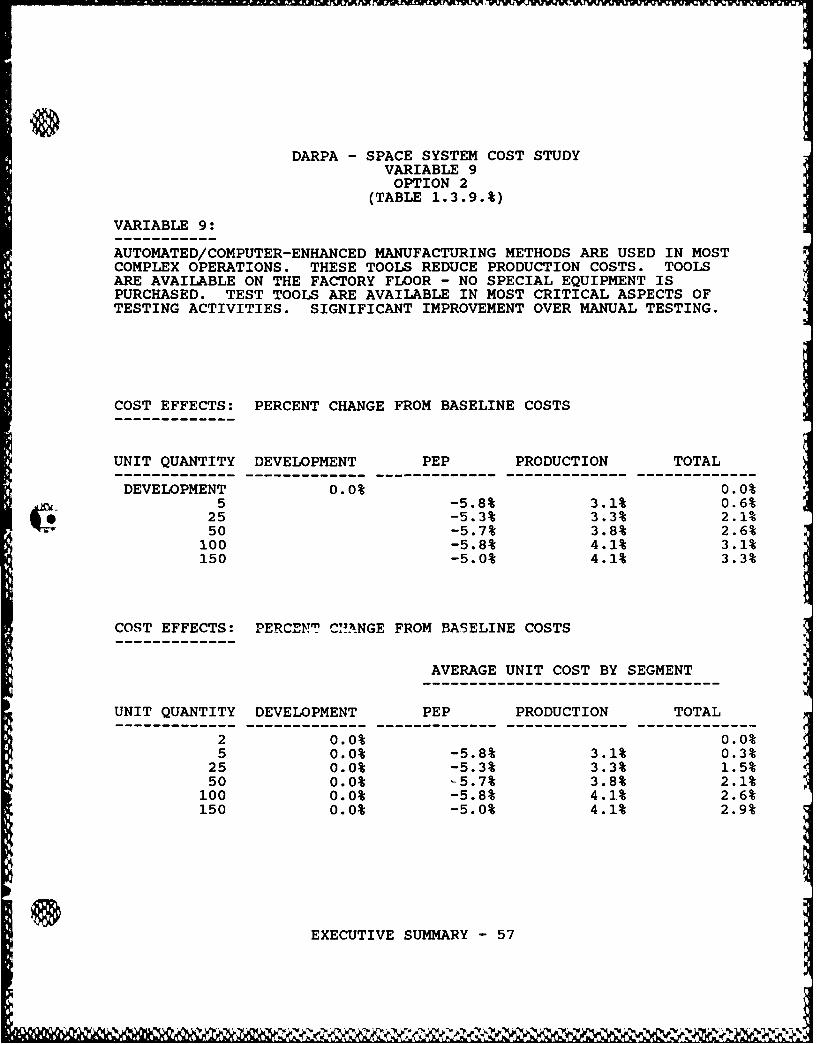
AUTOMATED/COMPUTER-ENHANCED MANUFACTURING METHODS ARE USED IN MOSTCOMPLEX OPERATIONS. THESE TOOLS REDUCE PRODUCTION COSTS. TOOLSARE AVAILABLE ON THE FACTORY FLOOR - NO SPECIAL EQUIPMENT ISPURCHASED. TEST TOOLS ARE AVAILABLE IN MOST CRITICAL ASPECTS OFTESTING ACTIVITIES. SIGNIFICANT IMPROVEMENT OVER MANUAL TESTING.
COST EFFECTS: PERCENT CHANGE FROM BASELINE COSTS
UNIT QUANTITY DEVELOPMENT PEP PRODUCTION TOTAL
DEVELOPMENT 0.0% 0.0%5 -5.8% 3.1% 0.6%
25 -5.3% 3.3% 2.1%50 -5.7% 3.8% 2.6%
100 -5.8% 4.1% 3.1%150 -5.0% 4.1% 3.3%
COST EFFECTS: PERCENT CI!ANGE FROM BASELINE COSTS
AVERAGE UNIT COST BY SEGMENT
UNIT QUANTITY DEVELOPMENT PEP PRODUCTION TOTAL
2 0.0% 0.0%5 0.0% -5.8% 3.1% 0.3%
25 0.0% -5.3% 3.3% 1.5%50 0.0% -5.7% 3.8% 2.1%
100 0.0% -5.8% 4.1% 2.6%150 0.0% -5.0% 4.1% 2.9%
EXECUTIVE SUMMARY - 57
DARPA - SPACE SYSTEM COST STUDYVARIABLE 9OPTION 3
(TABLE 1.3.9.$)
VARIABLE 9:
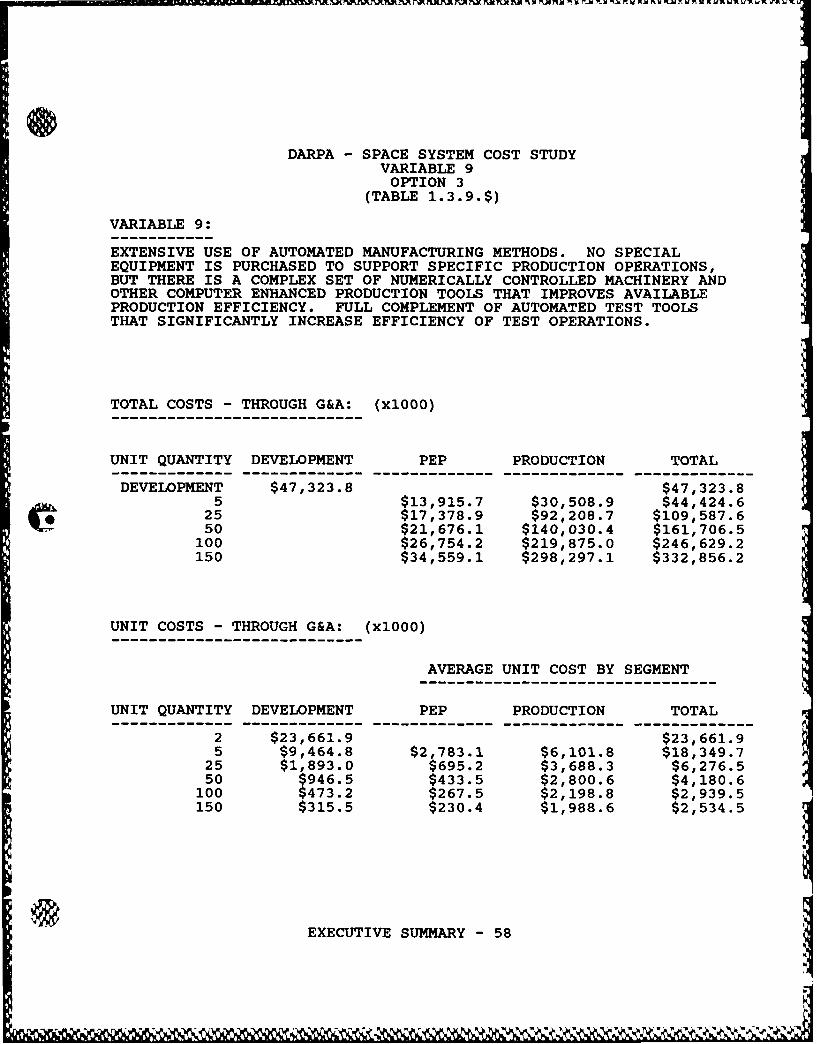
EXTENSIVE USE OF AUTOMATED MANUFACTURING METHODS. NO SPECIALEQUIPMENT IS PURCHASED TO SUPPORT SPECIFIC PRODUCTION OPERATIONS,BUT THERE IS A COMPLEX SET OF NUMERICALLY CONTROLLED MACHINERY ANDOTHER COMPUTER ENHANCED PRODUCTION TOOLS THAT IMPROVES AVAILABLEPRODUCTION EFFICIENCY. FULL COMPLEMENT OF AUTOMATED TEST TOOLSTHAT SIGNIFICANTLY INCREASE EFFICIENCY OF TEST OPERATIONS.
TOTAL COSTS - THROUGH G&A: (xl000)
UNIT QUANTITY DEVELOPMENT PEP PRODUCTION TOTAL
DEVELOPMENT $47,323.8 $47,323.85 $13,915.7 $30,508.9 $44,424.6
25 $17,378.9 $92,208.7 $109,587.650 $21,676.1 $140,030.4 $161,706.5100 $26,754.2 $219,875.0 $246,629.2150 $34,559.1 $298,297.1 $332,856.2
UNIT COSTS - THROUGH G&A: (xlOOO)
AVERAGE UNIT COST BY SEGMENT
UNIT QUANTITY DEVELOPMENT PEP PRODUCTION TOTAL
2 $23,661.9 $23,661.95 $9,464.8 $2,783.1 $6,101.8 $18,349.7
25 $1,893.0 $695.2 $3,688.3 $6,276.550 $946.5 $433.5 $2,800.6 $4,180.6
100 $473.2 $267.5 $2,198.8 $2,939.5150 $315.5 $230.4 $1,988.6 $2,534.5
EXECUTIVE SUMMARY - 58
DARPA - SPACE SYSTEM COST STUDYVARIABLE 9OPTION 3
(TABLE 1.3.9.%)
VARIABLE 9:
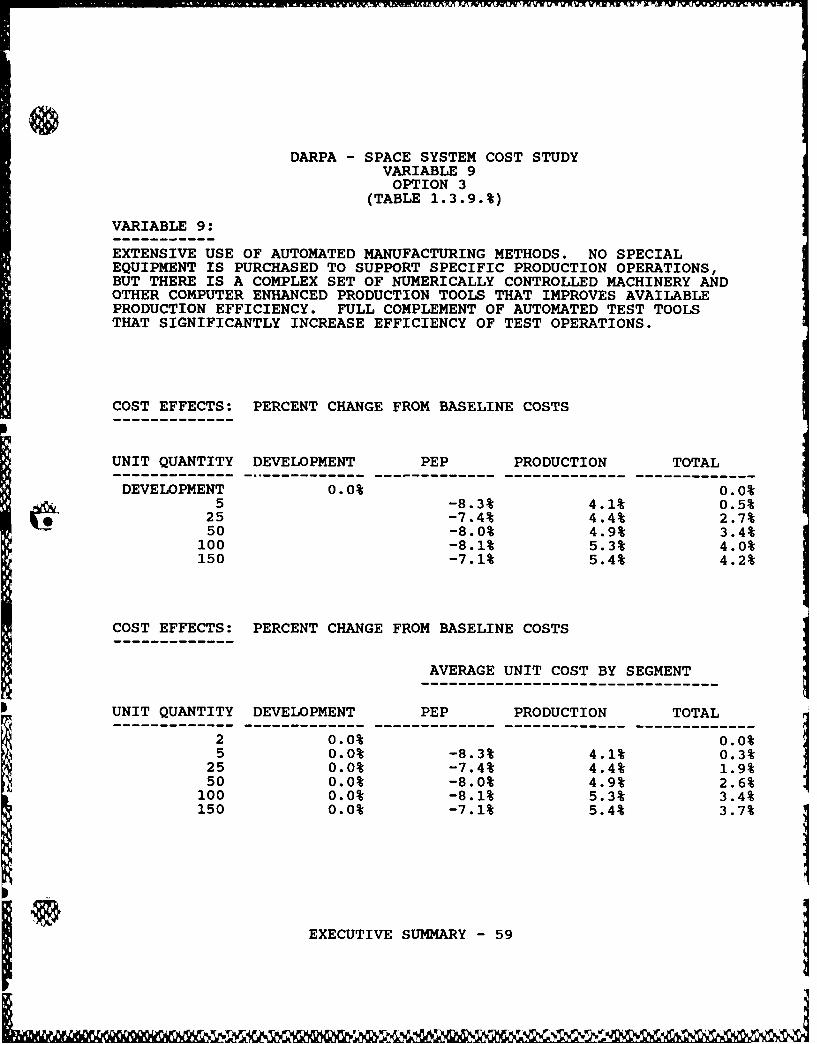
EXTENSIVE USE OF AUTOMATED MANUFACTURING METHODS. NO SPECIALEQUIPMENT IS PURCHASED TO SUPPORT SPECIFIC PRODUCTION OPERATIONS,BUT THERE IS A COMPLEX SET OF NUMERICALLY CONTROLLED MACHINERY ANDOTHER COMPUTER ENHANCED PRODUCTION TOOLS THAT IMPROVES AVAILABLEPRODUCTION EFFICIENCY. FULL COMPLEMENT OF AUTOMATED TEST TOOLSTHAT SIGNIFICANTLY INCREASE EFFICIENCY OF TEST OPERATIONS.
COST EFFECTS: PERCENT CHANGE FROM BASELINE COSTS
UNIT QUANTITY DEVELOPMENT PEP PRODUCTION TOTAL
DEVELOPMENT 0.0% 0.0%5 -8.3% 4.1% 0.5%
25 -7.4% 4.4% 2.7%50 -8.0% 4.9% 3.4%
100 -8.1% 5.3% 4.0%150 -7.1% 5.4% 4.2%
COST EFFECTS: PERCENT CHANGE FROM BASELINE COSTS
AVERAGE UNIT COST BY SEGMENT
UNIT QUANTITY DEVELOPMENT PEP PRODUCTION TOTAL------------- ------------- ------------- ------------- -------------
2 0.0% 0.0%5 0.0% -8.3% 4.1% 0.3%
25 0.0% -7.4% 4.4% 1.9%50 0.0% -8.0% 4.9% 2.6%
100 0.0% -8.1% 5.3% 3.4%150 0.0% -7.1% 5.4% 3.7%
EXECUTIVE SUMMARY - 59
J,
DARPA - SPACE SYSTEM COST STUDYVARIABLE 10OPTION 1
(TABLE 1.3.10.$)
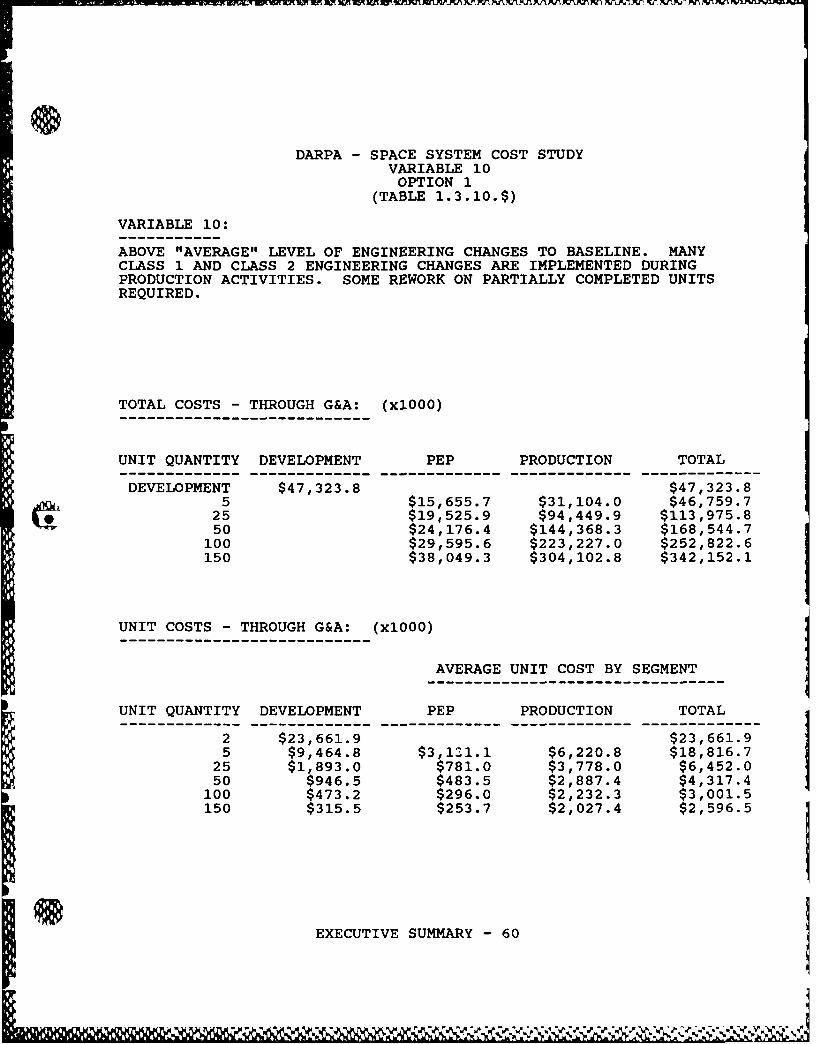
VARIABLE 10:
ABOVE "AVERAGE" LEVEL OF ENGINEERING CHANGES TO BASELINE. MANYCLASS 1 AND CLASS 2 ENGINEERING CHANGES ARE IMPLEMENTED DURINGPRODUCTION ACTIVITIES. SOME REWORK ON PARTIALLY COMPLETED UNITSREQUIRED.
TOTAL COSTS - THROUGH G&A: (xlOOO)
UNIT QUANTITY DEVELOPMENT PEP PRODUCTION TOTAL
DEVELOPMENT $47,323.8 $47,323.85 $15,655.7 $31,104.0 $46,759.7
25 $19,525.9 $94,449.9 $113,975.850 $24,176.4 $144,368.3 $168,544.7
100 $29,595.6 $223,227.0 $252,822.6150 $38,049.3 $304,102.8 $342,152.1
UNIT COSTS - THROUGH G&A: (xlOOO)
AVERAGE UNIT COST BY SEGMENT
UNIT QUANTITY DEVELOPMENT PEP PRODUCTION TOTAL
2 $23,661.9 $23,661.95 $9,464.8 $3,121.1 $6,220.8 $18,816.7
25 $1,893.0 $781.0 $3,778.0 $6,452.050 $946.5 $483.5 $2,887.4 $4,317.4
100 $473.2 $296.0 $2,232.3 $3,001.5150 $315.5 $253.7 $2,027.4 $2,596.5
EXECUTIVE SUMMARY - 60
~ b-i
DARPA - SPACE SYSTEM COST STUDYVARIABLE 10OPTION 1
(TABLE 1.3.10.%)
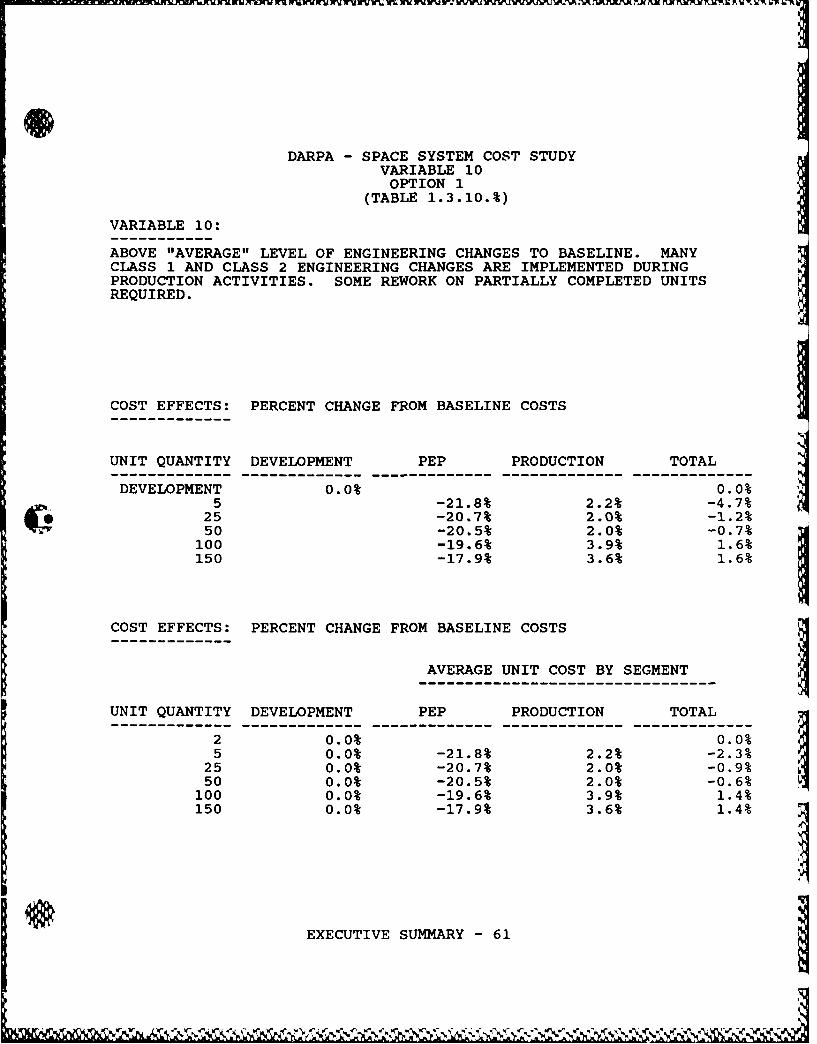
VARIABLE 10:
ABOVE "AVERAGE" LEVEL OF ENGINEERING CHANGES TO BASELINE. MANYCLASS 1 AND CLASS 2 ENGINEERING CHANGES ARE IMPLEMENTED DURINGPRODUCTION ACTIVITIES. SOME REWORK ON PARTIALLY COMPLETED UNITSREQUIRED.
COST EFFECTS: PERCENT CHANGE FROM BASELINE COSTS
UNIT QUANTITY DEVELOPMENT PEP PRODUCTION TOTAL
DEVELOPMENT 0.0% 0.0%5 -21.8% 2.2% -4.7%
25 -20.7% 2.0% -1.2%50 -20.5% 2.0% -0.7%
100 -19.6% 3.9% 1.6%150 -17.9% 3.6% 1.6%
COST EFFECTS: PERCENT CHANGE FROM BASELINE COSTS
AVERAGE UNIT COST BY SEGMENT
UNIT QUANTITY DEVELOPMENT PEP PRODUCTION TOTAL
2 0.0% 0.0%5 0.0% -21.8% 2.2% -2.3%
25 0.0% -20.7% 2.0% -0.9%50 0.0% -20.5% 2.0% -0.6%100 0.0% -19.6% 3.9% 1.4%
150 0.0% -17.9% 3.6% 1.4%
EXECUTIVE SUMMARY - 61
~%
DARPA - SPACE SYSTEM COST STUDYVARIABLE 10OPTION 2
(TABLE 1.3.10.$)
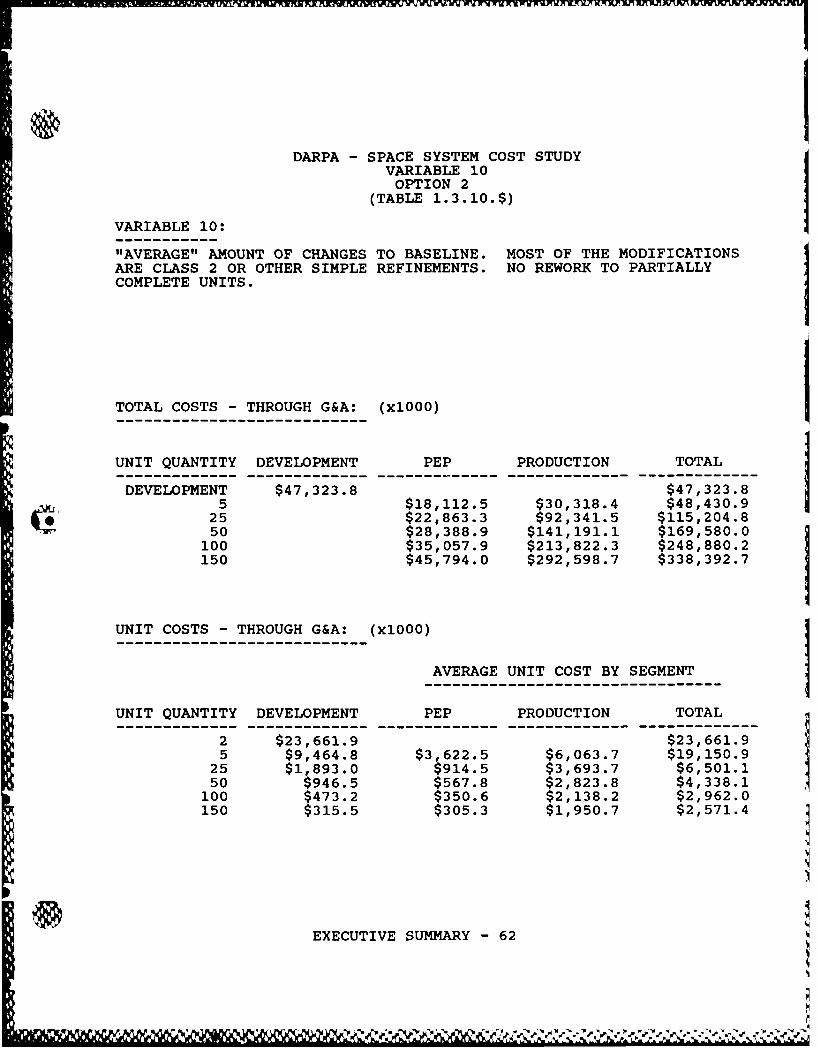
VARIABLE 10:
"AVERAGE" AMOUNT OF CHANGES TO BASELINE. MOST OF THE MODIFICATIONSARE CLASS 2 OR OTHER SIMPLE REFINEMENTS. NO REWORK TO PARTIALLYCOMPLETE UNITS.
TOTAL COSTS - THROUGH G&A: (Xl000)
UNIT QUANTITY DEVELOPMENT PEP PRODUCTION TOTAL
DEVELOPMENT $47,323.8 $47,323.85 $18,112.5 $30,318.4 $48,430.9
25 $22,863.3 $92,341.5 $115,204.850 $28,388.9 $141,191.1 $169,580.0
100 $35,057.9 $213,822.3 $248,880.2150 $45,794.0 $292,598.7 $338,392.7
UNIT COSTS - THROUGH G&A: (xl000)
AVERAGE UNIT COST BY SEGMENT
UNIT QUANTITY DEVELOPMENT PEP PRODUCTION TOTAL
2 $23,661.9 $23,661.95 $9,464.8 $3,622.5 $6,063.7 $19,150.9
25 $1,893.0 $914.5 $3,693.7 $6,501.150 $946.5 $567.8 $2,823.8 $4,338.1100 $473.2 $350.6 $2,138.2 $2,962.0150 $315.5 $305.3 $1,950.7 $2,571.4
EXECUTIVE SUMMARY - 62
I II Al
DARPA - SPACE SYS'-r,-. COST STUDYVARIABL. 0OPTION 2
(TABLE 1.3.10.%)
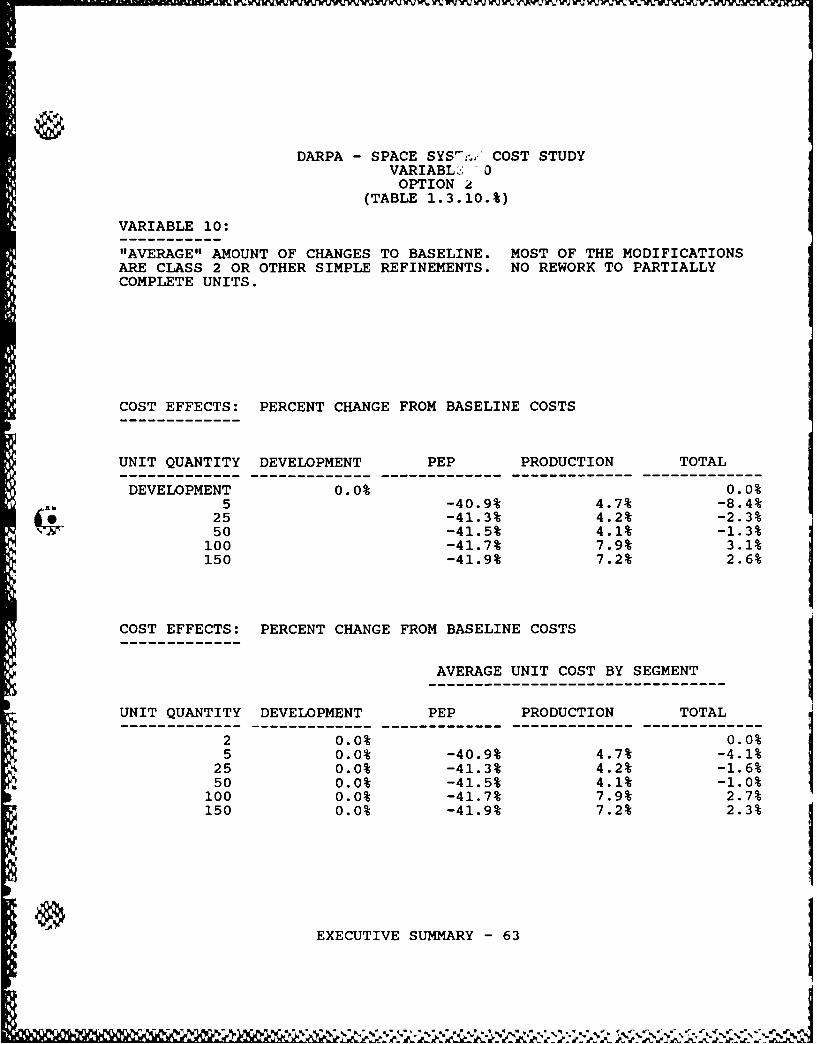
VARIABLE 10:
"AVERAGE" AMOUNT OF CHANGES TO BASELINE. MOST OF THE MODIFICATIONSARE CLASS 2 OR OTHER SIMPLE REFINEMENTS. NO REWORK TO PARTIALLYCOMPLETE UNITS.
COST EFFECTS: PERCENT CHANGE FROM BASELINE COSTS
UNIT QUANTITY DEVELOPMENT PEP PRODUCTION TOTAL
DEVELOPMENT 0.0% 0.0%5 -40.9% 4.7% -8.4%
25 -41.3% 4.2% -2.3%50 -41.5% 4.1% -1.3%
100 -41.7% 7.9% 3.1%150 -41.9% 7.2% 2.6%
COST EFFECTS: PERCENT CHANGE FROM BASELINE COSTS
AVERAGE UNIT COST BY SEGMENT
UNIT QUANTITY DEVELOPMENT PEP PRODUCTION TOTAL
2 0.0% 0.0%5 0.0% -40.9% 4.7% -4.1%
25 0.0% -41.3% 4.2% -1.6%50 0.0% -41.5% 4.1% -1.0%
100 0.0% -41.7% 7.9% 2.7%150 0.0% -41.9% 7.2% 2.3%
EXECUTIVE SUMMARY - 63

DARPA - SPACE SYSTEM COST STUDYVARIABLE 10OPTION 3
(TABLE 1.3.10.$)
VARIABLE 10:
NO CHANGES OR ONLY SLIGHT MODIFICATIONS TO SPACECRAFT/PAYLOADBASELINE. PRODUCTION ACTIVITIES PROCEED WITHOUT INTERRUPTION DUETO INCORPORATING THESE CHANGES.
TOTAL COSTS - THROUGH G&A: (xlOOO)
UNIT QUANTITY DEVELOPMENT PEP PRODUCTION TOTAL--------------- ------------- ------------- ------------- -------------
DEVELOPMENT $47,323.8 $47,323.85 $17,759.5 $28,799.6 $46,559.1
25 $22,033.9 $88,046.5 $110,080.450 $27,261.7 $134,582.5 $161,844.2100 $33,235.7 $203,790.6 $237,026.3150 $42,380.6 $280,218.7 $322,599.3
UNIT COSTS - THROUGH G&A: (xlOOO)----------------------
AVERAGE UNIT COST BY SEGMENT------------------------------------------------
UNIT QUANTITY DEVELOPMENT PEP PRODUCTION TOTAL--------------- ------------- ------------- ------------- -------------
2 $23,661.9 $23,661.95 $9,464.8 $3,551.9 $5,759.9 $18,776.6
25 $1,893.0 $881.4 $3,521.9 $6,296.250 $946.5 $545.2 $2,691.7 $4,183.4
100 $473.2 $332.4 $2,037.9 $2,843.5150 $315.5 $282.5 $1,868.1 $2,466.2 j
EXECUTIVE SUMMARY - 64
I 'j,.IN.:

o 1DARPA - SPACE SYSTEM COST STUDY
VARIABLE 10OPTION 3(TABLE 1. 3.1i0A )
VARIABLE 10:
NO CHANGES OR ONLY SLIGHT MODIFICATIONS TO SPACECRAFT/PAYLOADBASELINE. PRODUCTION ACTIVITIES PROCEED WITHOUT INTERRUPTION DUETO INCORPORATING THESE CHANGES.
COST EFFECTS: PERCENT CHANGE FROM BASELINE COSTS
UNIT QUANTITY DEVELOPMENT PEP PRODUCTION TOTAL
DEVELOPMENT 0.0% 0.0%5 -38.2% 9.5% -4.2%
25 -36.2% 8.7% 2.2%50 -35.9% 8.6% 3.3%
100 -34.3% 12.2% 7.8%150 -31.3% 11.1% 7.2%
COST EFFECTS: PERCENT CHANGE FROM BASELINE COSTS
AVERAGE UNIT COST BY SEGMENT-------------------------------------------------------------
UNIT QUANTITY DEVELOPMENT PEP PRODUCTION TOTAL---------------------------- ------------- ------------- ------------- -------------
2 0.0% 0.0%5 0.0% -38.2% 9.5% -2.1%
25 0.0% -36.2% 8.7% 1.6%50 0.0% -35.9% 8.6% 2.6%
100 0.0% -34.3% 12.2% 6.5%150 0.0% -31.3% 11.1% 6.3%
EXECUTIVE SUMMARY - 65

0DARPA - SPACE SYSTEM COST STUDY
VARIABLE 11OPTION 1
(TABLE 1.3.11.$)
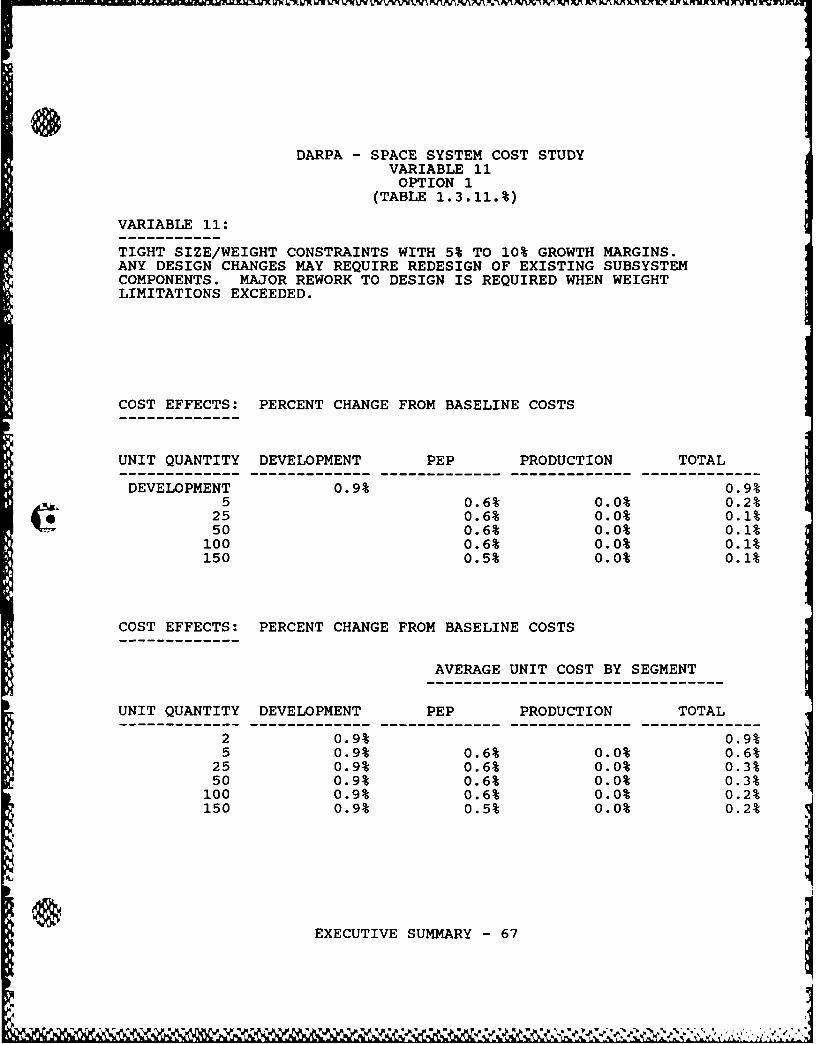
VARIABLE 11:
TIGHT SIZE/WEIGHT CONSTRAINTS WITH 5% TO 10% GROWTH MARGINS.ANY DESIGN CHANGES MAY REQUIRE REDESIGN OF EXISTING SUBSYSTEMCOMPONENTS. MAJOR REWORK TO DESIGN IS REQUIRED WHEN WEIGHTLIMITATIONS EXCEEDED.
TOTAL COSTS - THROUGH G&A: (xlOOO)
UNIT QUANTITY DEVELOPMENT PEP PRODUCTION TOTAL
DEVELOPMENT $46,875.3 $46,875.35 $12,778.8 $31,811.0 $44,589.8
25 $16,092.7 $96,402.2 $112,494.950 $19,944.4 $147,291.3 $167,235.7100 $24,596.3 $232,213.7 $256,810.0150 $32,099.9 $315,319.3 $347,419.2
UNIT COSTS - THROUGH G&A: (xlOOO)
AVERAGE UNIT COST BY SEGMENT
UNIT QUANTITY DEVELOPMENT PEP PRODUCTION TOTAL
2 $23,437.7 $23,437.75 $9,375.1 $2,555.8 $6,362.2 $18,293.0
25 $1,875.0 $643.7 $3,856.1 $6,374.850 $937.5 $398.9 $2,945.8 $4,282.2
100 $468.8 $246.0 $2,322.1 $3,036.9150 $312.5 $214.0 $2,102.1 $2,628.6
EXECUTIVE SUMMARY - 66
DARPA - SPACE SYSTEM COST STUDYVARIABLE 11OPTION 1
(TABLE 1.3.11.%)
VARIABLE 11:
TIGHT SIZE/WEIGHT CONSTRAINTS WITH 5% TO 10% GROWTH MARGINS.ANY DESIGN CHANGES MAY REQUIRE REDESIGN OF EXISTING SUBSYSTEMCOMPONENTS. MAJOR REWORK TO DESIGN IS REQUIRED WHEN WEIGHTLIMITATIONS EXCEEDED.
COST EFFECTS: PERCENT CHANGE FROM BASELINE COSTS
UNIT QUANTITY DEVELOPMENT PEP PRODUCTION TOTAL
DEVELOPMENT 0.9% 0.9%5 0.6% 0.0% 0.2%
25 0.6% 0.0% 0.1%50 0.6% 0.0% 0.1%
100 0.6% 0.0% 0.1%150 0.5% 0.0% 0.1%
COST EFFECTS: PERCENT CHANGE FROM BASELINE COSTS
AVERAGE UNIT COST BY SEGMENT
UNIT QUANTITY DEVELOPMENT PEP PRODUCTION TOTAL
2 0.9% 0.9%5 0.9% 0.6% 0.0% 0.6%
25 0.9% 0.6% 0.0% 0.3%50 0.9% 0.6% 0.0% 0.3%
100 0.9% 0.6% 0.0% 0.2%150 0.9% 0.5% 0.0% 0.2%
EXECUTIVE SUMMARY - 67

DARPA - SPACE SYSTEM COST STUDYVARIABLE 11OPTION 2
(TABLE 1.3.11.4)
VARIABLE 11:
MORE RELAXED SIZE/WEIGHT CONSTRAINTS: 10% - 20% GROWTH MARGINS.MOST CHANGES CAN BE MADE WITH A MINIMUM DEGREE OF IMPACT ONEXISTING COMPONENTS AND SUBSYSTEMS. SMALL REDESIGN EFFORTS MAYBE REQUIRED TO INCORPORATE CHANGES THAT RESULT IN WEIGHT GROWTH.
TOTAL COSTS - THROUGH G&A: (xlOOO)
UNIT QUANTITY DEVELOPMENT PEP PRODUCTION TOTAL
DEVELOPMENT $46,044.4 $46,044.45 $12,670.8 $31,811.0 $44,481.8
25 $15,938.6 $96,402.2 $112,340.850 $19,741.6 $147,291.3 $167,032.9100 $24,336.9 $232,213.7 $256,550.6150 $31,795.6 $315,319.3 $347,114.9
UNIT COSTS - THROUGH G&A: (xlOOO)
AVERAGE UNIT COST BY SEGMENT
UNIT QUANTITY DEVELOPMENT PEP PRODUCTION TOTAL
2 $23,022.2 $23,022.25 $9,208.9 $2,534.2 $6,362.2 $18,105.215 $1,841.8 $637.5 $3,856.1 $6,335.450 $920.9 $394.8 $2,945.8 $4,261.5100 $460.4 $243.4 $2,322.1 $3,026.0150 $307.0 $212.0 $2,102.1 $2,621.1
EXECUTIVE SUMMARY - 68

DARPA - SPACE SYSTEM COST STUDYVARIABLE 11OPTION 2
(TABLE 1.3.11.%)
VARIABLE 11:
MORE RELAXED SIZE/WEIGHT CONSTRAINTS: 10% - 20% GROWTH MARGINS.MOST CHANGES CAN BE MADE WITH A MINIMUM DEGREE OF IMPACT ONEXISTING COMPONENTS AND SUBSYSTEMS. SMALL REDESIGN EFFORTS MAYBE REQUIRED TO INCORPORATE CHANGES THAT RESULT IN WEIGHT GROWTH.
COST EFFECTS: PERCENT CHANGE FROM BASELINE COSTS
UNIT QUANTITY DEVELOPMENT PEP PRODUCTION TOTAL--------------- ------------- ------------- ------------- -------------
DEVELOPMENT 2.7% 2.7%5 1.4% 0.0% U.4%
25 1.5% 0.0% 0.2%5 1.5% 0.0% 0.2%100 1.6% 0.0% 0.2%150 1.5% 0.0% 0.1%
COST EFFECTS: PERCENT CHANGE FROM BASELINE COSTS
AVERAGE UNIT COST BY SEGMENT
UNIT QUANTITY DEVELOPMENT PEP PRODUCTION TOTAL--------------- ------------- ------------- ------------- -------------
2 2.7% 2.7%5 2.7% 1.4% 0.0% 1.6%
25 2.7% 1.5% 0.0% 1.0%50 2.7% 1.6% 0.0% 0.7%100 2.7% 1.6% 0.0% 0.6%150 2.7% 1.5% 0.0% 0.4%
EXECUTIVE SUMMARY - 69
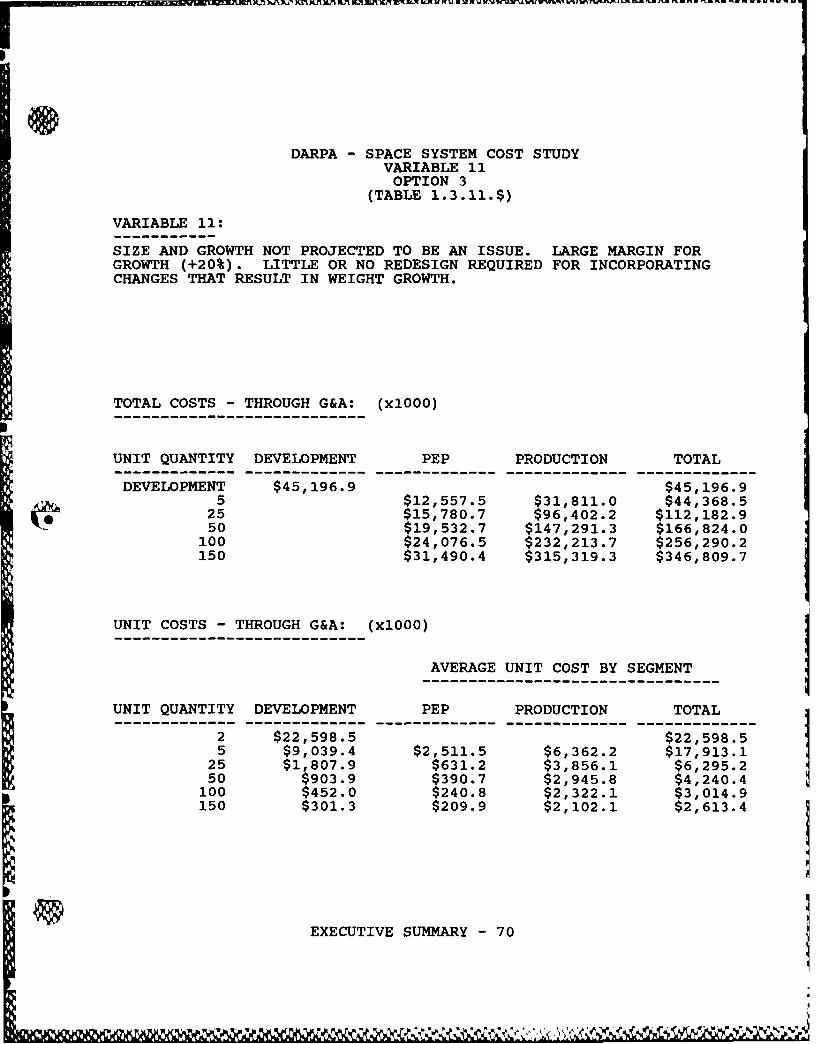
DARPA - SPACE SYSTEM COST STUDYVARIABLE 11OPTION 3
(TABLE 1.3.11.$)
VARIABLE 11:
SIZE AND GROWTH NOT PROJECTED TO BE AN ISSUE. LARGE MARGIN FORGROWTH (+20%). LITTLE OR NO REDESIGN REQUIRED FOR INCORPORATINGCHANGES THAT RESULT IN WEIGHT GROWTH.
TOTAL COSTS - THROUGH G&A: (xlOOO)
UNIT QUANTITY DEVELOPMENT PEP PRODUCTION TOTAL
DEVELOPMENT $45,196.9 $45,196.95 $12,557.5 $31,811.0 $44,368.5
25 $15,780.7 $96,402.2 $112,182.950 $19,532.7 $147,291.3 $166,824.0
100 $24,076.5 $232,213.7 $256,290.2150 $31,490.4 $315,319.3 $346,809.7
UNIT COSTS - THROUGH G&A: (xl000)
AVERAGE UNIT COST BY SEGMENT
UNIT QUANTITY DEVELOPMENT PEP PRODUCTION TOTAL
2 $22,598.5 $22,598.55 $9,039.4 $2,511.5 $6,362.2 $17,913.1
25 $1,807.9 $631.2 $3,856.1 $6,295.250 $903.9 $390.7 $2,945.8 $4,240.4
100 $452.0 $240.8 $2,322.1 $3,014.9150 $301.3 $209.9 $2,102.1 $2,613.4
EXECUTIVE SUMMARY - 70
P ]

DARPA - SPACE SYSTEM COST STUDYVARIABLE 11OPTION 3
(TABLE 1.3.11.%)
VARIABLE 11:
SIZE AND GROWTH NOT PROJECTED TO BE AN ISSUE. LARGE MARGIN FORGROWTH (+20%). LITTLE OR NO REDESIGN REQUIRED FOR INCORPORATINGCHANGES THAT RESULT IN WEIGHT GROWTH.
COST EFFECTS: PERCENT CHANGE FROM BASELINE COSTS
UNIT QUANTITY DEVELOPMENT PEP PRODUCTION TOTAL
DEVELOPMENT 4.5% 4.5%5 2.3% 0.0% 0.7%25 2.5% 0.0% 0.4%50 2.6% 0.0% 0.3%
100 2.7% 0.0% 0.3%150 2.4% 0.0% 0.2%
COST EFFECTS: PERCENT CHANGE FROM BASELINE COSTS
AVERAGE UNIT COST BY SEGMENT
UNIT QUANTITY DEVELOPMENT PEP PRODUCTION TOTAL
2 4.5% 4.5%5 4.5% 2.3% 0.0% 2.6%
25 4.5% 2.5% 0.0% 1.6%50 4.5% 2.6% 0.0% 1.2%100 4.5% 2.7% 0.0% 0.9%150 4.5% 2.4% 0.0% 0.7%
EXECUTIVE SUMMARY - 71
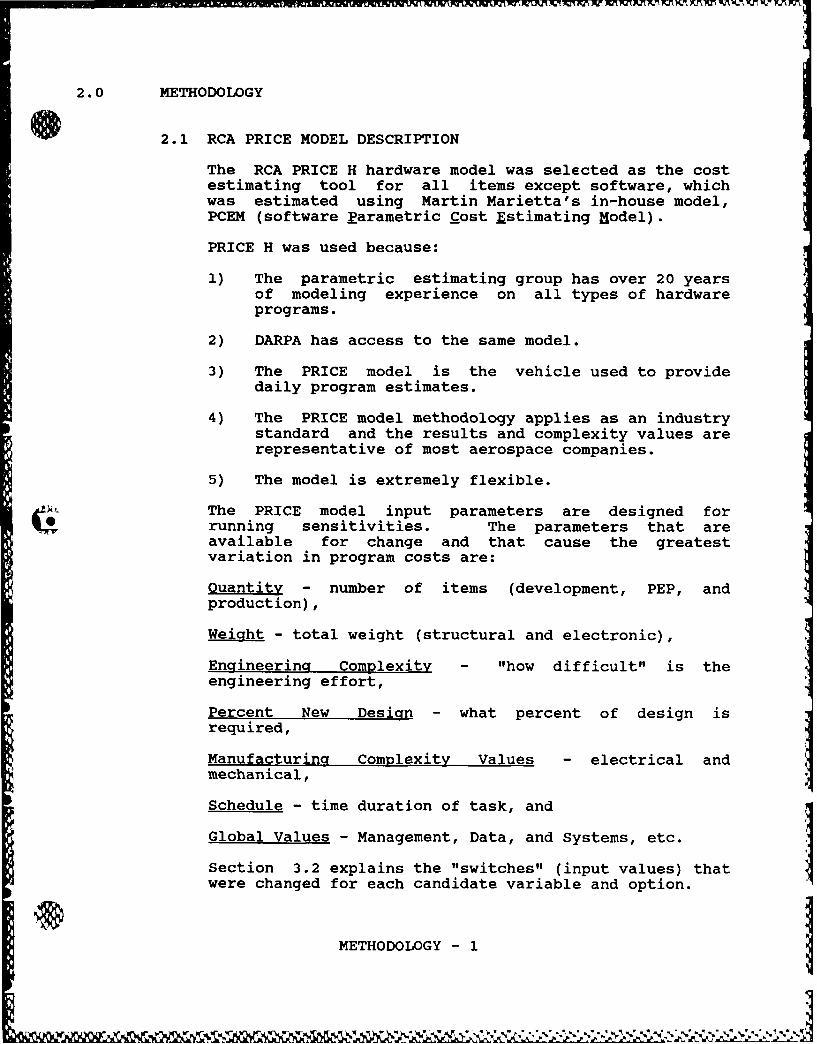
2.0 METHODOLOGY
2.1 RCA PRICE MODEL DESCRIPTION
The RCA PRICE H hardware model was selected as the costestimating tool for all items except software, whichwas estimated using Martin Marietta's in-house model,PCEM (software Parametric Cost Estimating Model).
PRICE H was used because:
1) The parametric estimating group has over 20 yearsof modeling experience on all types of hardwareprograms.
2) DARPA has access to the same model.
3) The PRICE model is the vehicle used to providedaily program estimates.
4) The PRICE model methodology applies as an industrystandard and the results and complexity values arerepresentative of most aerospace companies.
5) The model is extremely flexible.
The PRICE model input parameters are designed forrunning sensitivities. The parameters that areavailable for change and that cause the greatestvariation in program costs are:
Quantity - number of items (development, PEP, andproduction),
Weight - total weight (structural and electronic),
Engineering Complexity - "how difficult" is theengineering effort,
Percent New Design - what percent of design isrequired,
Manufacturing Complexity Values - electrical andmechanical,
Schedule - time duration of task, and
Global Values - Management, Data, and Systems, etc.
Section 3.2 explains the "switches" (input values) that
were changed for each candidate variable and option.
METHODOLOGY - 1
2.2 MODELING METHODOLOGY
The Martin Marietta concept design for "Lightsat" wasused as the starting point for the modeling effort. Asmentioned previously, the light satellite cost studybaseline is similar to the Martin Marietta "Lightsat"design, but does not mirror it due to continual designupdates. A Work Breakdown Structure (WBS) wasdeveloped as was an equipment list for the lightsatellite. The equipment list varies slightly betweenprogram phases (Development, PEP, and Production).
Figures 2.2-1 to 2.2-4 illustrate the WBS and equipmentlists used for modeling the baseline. Any change tocomponents to simulate the effect of a Primary orSecondary cost variable was reflected by appropriatechanges to those same items in the succeeding phases(i.e., PEP, Production). The dollar impacts andpercent savings statistics are provided through theDARPASS model in either tabular or graphic format.
M O
iIII
METHODOLOGY - 2
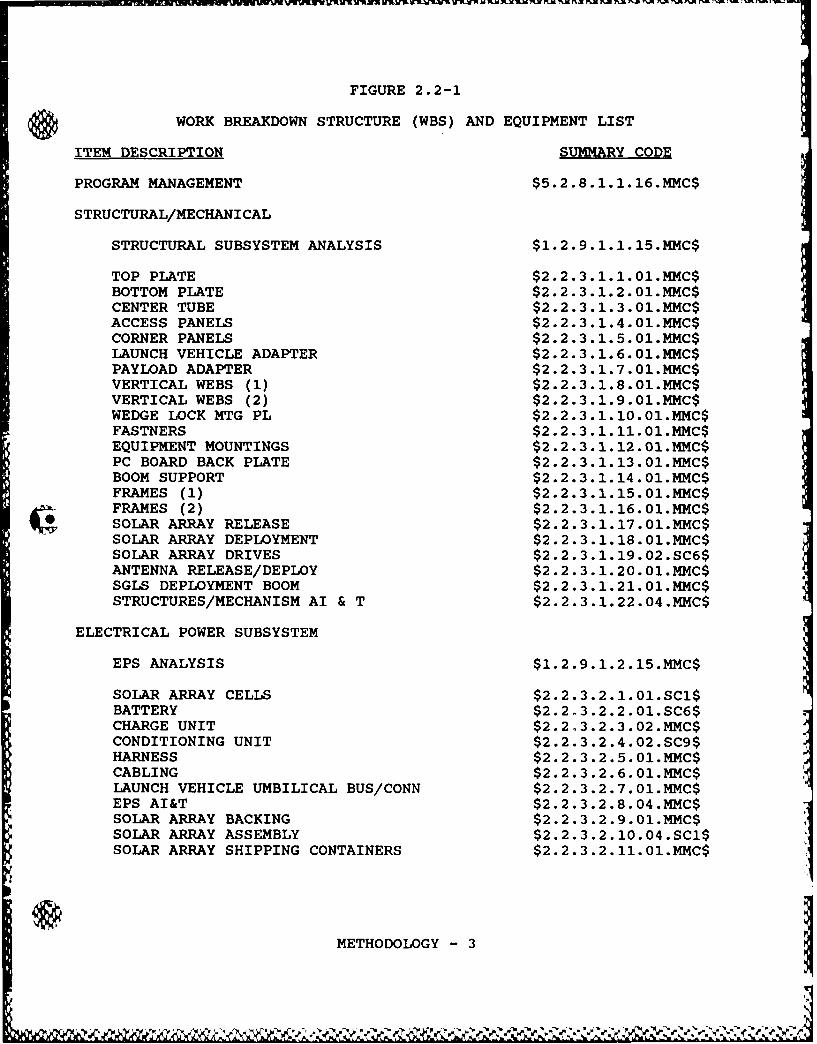
FIGURE 2.2-1
WORK BREAKDOWN STRUCTURE (WBS) AND EQUIPMENT LIST
ITEM DESCRIPTION SUMMARY CODE
PROGRAM MANAGEMENT $5.2.8.1. 1.16.MMC$
STRUCTURAL/MECHANICAL
STRUCTURAL SUBSYSTEM ANALYSIS $1.2.9.1.1.15.MMC$
TOP PLATE $2 .2.3.1.1. 01.MMC$BOTTOM PLATE $2.2.3.1.2.01.MMC$CENTER TUBE $2.2.3. 1.3.o1.MMC$ACCESS PANELS $2.2.3. 1.4.01.MMC$CORNER PANELS $2.2.3. 1.5.O1.MMC$LAUNCH VEHICLE ADAPTER $2.2.3. 1.6.O1.MMC$PAYLOAD ADAPTER $2.2.3 .1.7.01.MMC$VERTICAL WEBS (1) $2.2.3.1.8.O1.MMC$VERTICAL WEBS (2) $2 .2.3.1.9. 01.MMC$WEDGE LOCK MTG PL $2 .2.3.1.10. 01.MMC$FASTNERS $2 .2.3.1.11. o1.MMC$EQUIPMENT MOUNTINGS $2.2.3.1.12.o1.MMC$PC BOARD BACK PLATE $2 .2.3.1.13. 01.MMC$BOOM SUPPORT $2 .2.3.1.14. O1.MMCSFRAMES (1) $2.2.3.1.15.O1.MMC$(Z FRAMES (2) $2 .2.3.1.16. 01.MMC$SOLAR ARRAY RELEASE $2.2.3.1.17.0.M4C$SOLAR ARRAY DEPLOYMENT $2 .2.3.1.18. 01.MMC$SOLAR ARRAY DRIVES $2.2.3.1.19.02.SC6$ANTENNA RELEASE/DEPLOY $2 .2.3. 1.20.01.MMC$SGLS DEPLOYMENT BOOM $2.2.3. 1.21.O1.MMC$STRUCTURES/MECHANISM AI & T $2.2.3.1.22.04.MMC$
ELECTRICAL POWER SUBSYSTEM
EPS ANALYSIS $1.2.9.1.2.15.MMC$
SOLAR ARRAY CELLS $2.2.3.2.1.o1.SC1$BATTERY $2.2-3.2.2.o1.SC6$CHARGE UNIT $2.2, 3.2.3.02.MMC$CONDITIONING UNIT $2.2.3.2.4.02.SC9$HARNESS $2 .2.3.2.5. 01.MMC$CABLING $2 .2.3.2.6. 01.MMC$LAUNCH VEHICLE UMBILICAL BUS/COHN $2.2. 3.2.7.01.MMC$EPS AI&T $2.2.3.2.8.04.MMC$SOLAR ARRAY BACKING $2.2.3.2.9.o1.MMC$SOLAR ARRAY ASSEMBLY $2.2.3.2. 10.04.SC1$SOLAR ARRAY SHIPPING CONTAINERS $2.2.3.2.11.O1.MMC$
METHODOLOGY -3
r, &-Z -
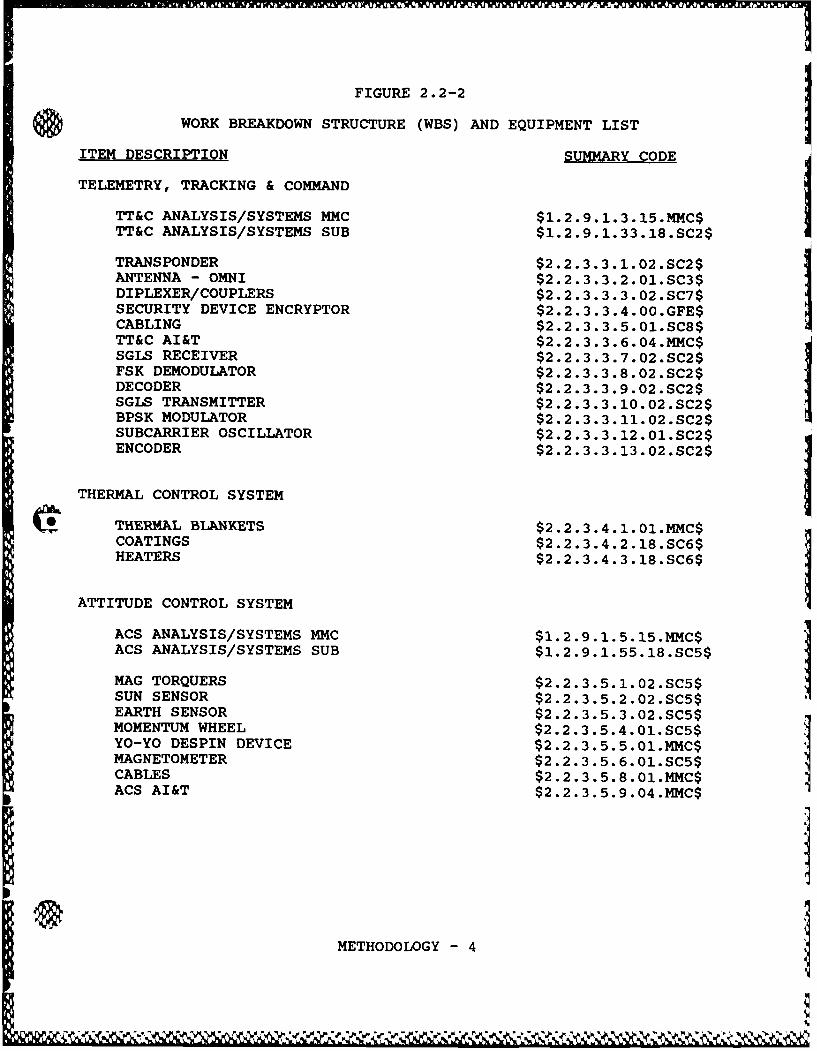
FIGURE 2.2-2
WORK BREAKDOWN STRUCTURE (WBS) AND EQUIPMENT LISTITEM DESCRIPTION SUMMARY CODE
TELEMETRY, TRACKING & COMMANDTT&CANAYSISSYSEMSMMC 1.29.1..15MMITT&C ANALYSIS/SYSTEMS SUB $1.2.9.1.3.1.SC$
TRANSPONDER $2.2.3.3.1.02.SC2$ANTENNA - OMNI $2.2.3.3.2.O1.SC3$DIPLEXER/COUPLERS $2.2.3.3.3.02.SC7$ISECURITY DEVICE ENCRYPTOR $2.2.3.3.4.0o.GFE$CABLING $2.2.3. 3.5.O1.SC8$TT&C AI&T $2.2.3.3.6.04.MMC$SGLS RECEIVER $2.2.3.3.7.02.SC2$FSK DEMODULATOR $2.2.3.3.8.02.SC2$
DECODER $2.2.3.3.9.02.SC2$SGLS TRANSMITTER $2.2.3.3.lo.02.SC2$BPSK MODULATOR $2.2.3.3.11.02.SC2$SUBCARRIER OSCILLATOR S2.2.3. 3.12.O1.SC2$
ENCODER $2.2. 3.3.13 .02.SC2$
THERMAL CONTROL SYSTEMITHERM4AL BLANKETS $2.2.3.4.1.O1.MMC$COATINGS $2.2.3.4.2.18.SC6$
HEATERS $2.2.3.4.3.18.SC6$
ATTITUDE CONTROL SYSTEMI
ACS ANALYSIS/SYSTEMS MMC S1.2.9.1.5.15.MMC$ACS ANALYSIS/SYSTEMS SUB $1.2.9.1.55.18.SC5$
HAG TORQUERS $2.2.3.5. 1.02.SC5$SUN SENSOR $2.2.3.5.2.02.SC5$EARTH SENSOR $2.2.3.5.3.02.SC5$MOMENTUM WHEEL $2.2.3.5.4.O1.SC5$YO-YO DESPIN DEVICE S2.2.3.5.5.ol.M4C$MAGNETOMETER $2.2.3.5.6.O1.SC5$CABLES $2.2.3.5.8.01.MMC$ACS AI&T $2.2.3.5.9.04.MMC$
METHODOLOGY -4
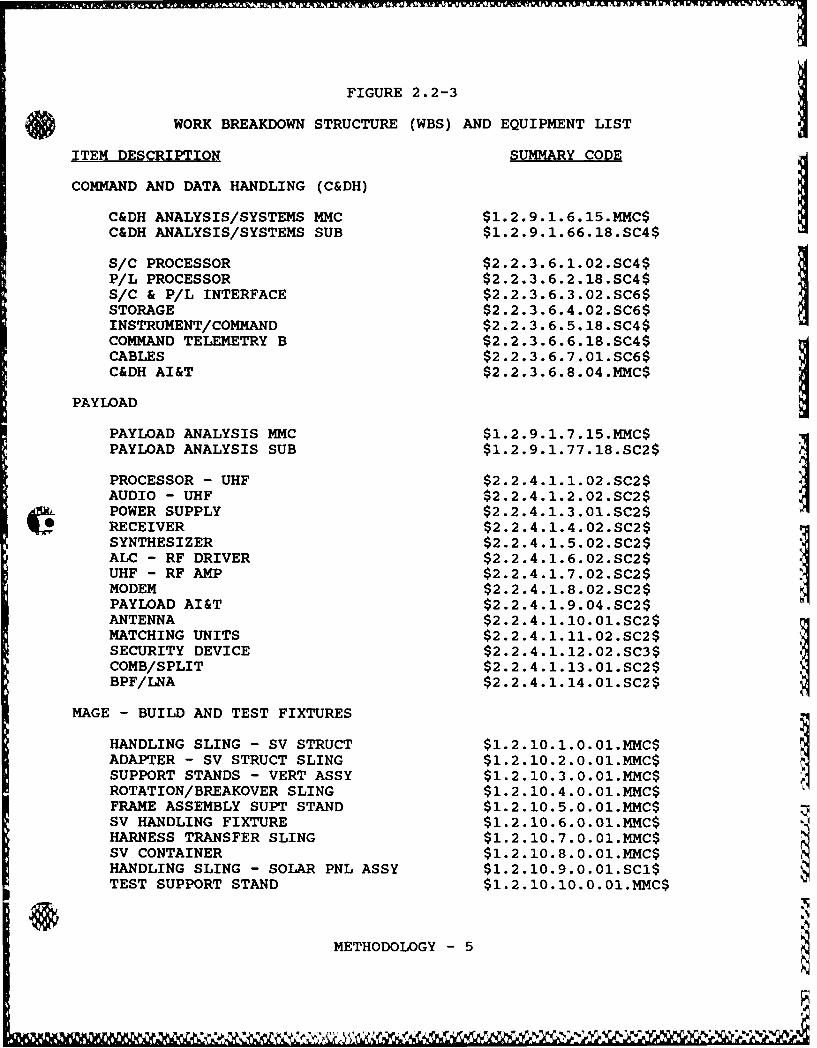
FIGURE 2.2-3
WORK BREAKDOWN STRUCTURE (WBS) AND EQUIPMENT LIST
ITEM DESCRIPTION SUMMARY CODE
COMMAND AND DATA HANDLING (C&DH)
C&DH ANALYSIS/SYSTEMS MMC $1.2.9.1.6.15.MMC$IC&DH ANALYSIS/SYSTEMS SUB $1.2.9.1.66.18.SC4$
S/C PROCESSOR $2.2.3.6. 1.02.SC4$P/L PROCESSOR $2.2.3.6.2.18.SC4$S/C & P/L INTERFACE $2.2.3.6.3.02.SC6SSTORAGE $2.2.3.6.4.02.SC6$INSTRUMENT/COMMAND $2.2. 3.6.5.18.5C4$COMMAND TELEMETRY B $2.2.3.6.6.18.SC4$CABLES $2.2.3.6.7.01.SC6$C&DH AI&T $2.2.3.6.8.04.MMC$
PAYLOAD
PAYLOAD ANALYSIS MMC $1.2.9.1.7.15.MMC$
PAYLOAD ANALYSIS SUB $1.2.9.1.77.18.SC2$
PROCESSOR - UHF $2.2.4.1.1.02.SC2$IAUDIO - UHF $2.2.4.1.2.o2.SC2$
CML. POWER SUPPLY $2.2.4. 1.3 .01.SC2$RECEIVER $2.2 .4. 1.4. 02.SC2$SYNTHESIZER $2.2.4.1.5.02.SC2$ALC - RF DRIVER $2.2.4.1.6.02.SC2$UHF - RF AMP $2.2.4.1.7.02.SC2$IMODEM $2.2.4.1.8.o2.SC2$PAYLOAD AI&T $2.2 .4. 1.9.04.SC2$ANTENNA $2 .2.4. 1.10. O1.SC2$MATCHING UNITS $2 .2.4.1.11.02 .SC2$SECURITY DEVICE $2.2.4.1.12.02.SC3$COMB/SPLIT $2.2.4. 1. 13.01.SC2$BPF/LNA $2.2.4.1. 14.01.SC2$
MAGE - BUILD AND TEST FIXTURES
HANDLING SLING - SV STRUCT $1.2.10.1.o.ol.MMC$ADAPTER - SV STRUCT SLING $1.2.10.2.o.o1.M4C$SUPPORT STANDS - VERT ASSY $1.2.10.3.o.0l.M4C$ROTATION/BREAKOVER SLING $1.2. 10.4.0.01.MMC$FRAME ASSEMBLY SUPT STAND $1.2.10.5.o.o1.rn4C$SV HANDLING FIXTURE $1.2.10.6.0.o1.MMC$HARNESS TRANSFER SLING $1.2.10.7.o.0l.MMC$SV CONTAINER $1. 2.10.8.0. 01.MMC$tHANDLING SLING - SOLAR PNL ASSY $1.2.10.9.o.01.SCI$TEST SUPPORT STAND $1.2.10.10.0. 01.MMC$
METHODOLOGY -5
If I'l , .,
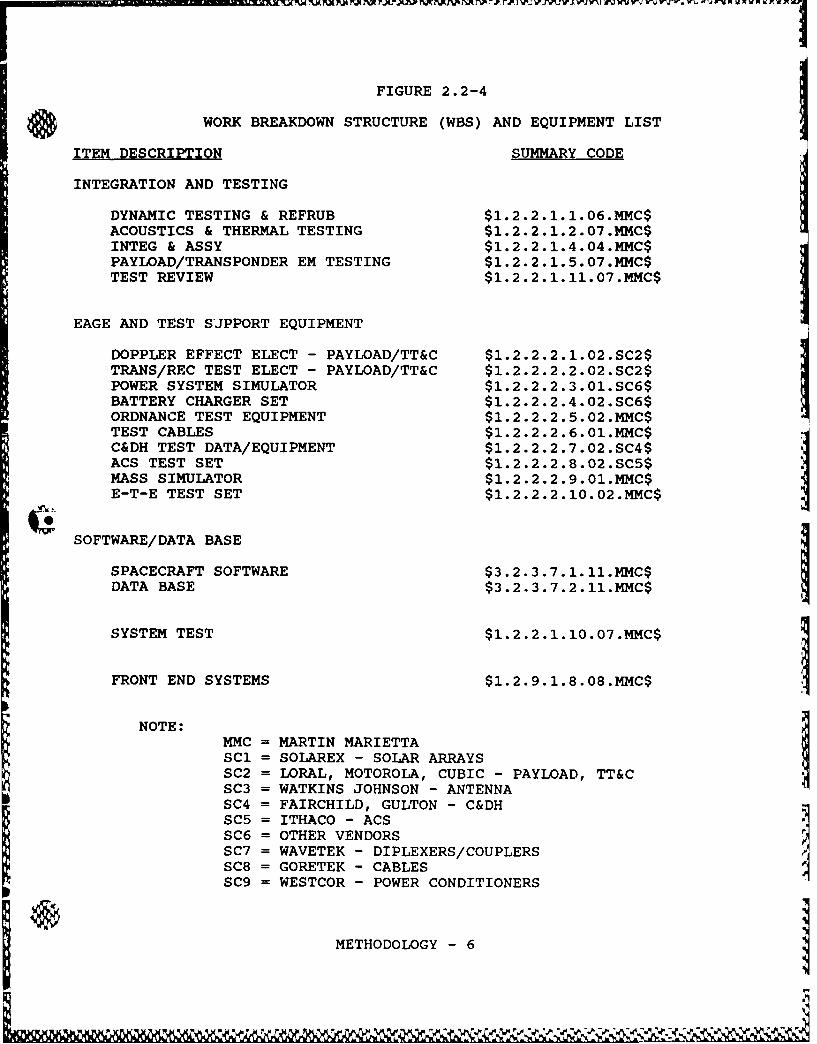
FIGURE 2.2-4
WORK BREAKDOWN STRUCTURE (WBS) AND EQUIPMENT LIST
ITEM DESCRIPTION SUMMARY CODE
INTEGRATION AND TESTING
DYNAMIC TESTING & REFRUB $1.2.2.1.1.06.MMC$ACOUSTICS & THERMAL TESTING $1.2.2.1.2.07.MMC$INTEG & ASSY $1.2.2.1.4.04.MMC$PAYLOAD/TRANSPONDER EM TESTING $1.2.2.1.5.07.MMC$TEST REVIEW $1.2.2.1.11.07.MMC$
EAGE AND TEST SUPPORT EQUIPMENT
DOPPLER EFFECT ELECT - PAYLOAD/TT&C $1.2.2.2.1.02.SC2$TRANS/REC TEST ELECT - PAYLOAD/TT&C $1.2.2.2.2.02.SC2$POWER SYSTEM SIMULATOR $1.2.2.2.3.01.SC65BATTERY CHARGER SET $1.2.2.2.4.02.SC6$ORDNANCE TEST EQUIPMENT $1.2.2.2.5.02.MMC$TEST CABLES $1.2.2.2.6.01.MMC$C&DH TEST DATA/EQUIPMENT $1.2.2.2.7.02.SC4$ACS TEST SET $1.2.2.2.8.02.SC55MASS SIMULATOR $1.2.2.2.9.01.MMC$E-T-E TEST SET $1.2.2.2.10.02.MMC$
SOFTWARE/DATA BASE
SPACECRAFT SOFTWARE $3.2.3.7.1. 1.MMC$DATA BASE $3.2.3.7.2.11.MMC$
SYSTEM TEST $1.2.2.1.10.07.MMC$
FRONT END SYSTEMS $1.2.9.1.8.08.MMC$
NOTE:MMC = MARTIN MARIETTA
SCI = SOLAREX - SOLAR ARRAYSSC2 = LORAL, MOTOROLA, CUBIC - PAYLOAD, TT&CSC3 = WATKINS JOHNSON - ANTENNASC4 = FAIRCHILD, GULTON - C&DHSC5 = ITHACO - ACSSC6 = OTHER VENDORSSC7 = WAVETEK - DIPLEXERS/COUPLERSSC8 = GORETEK - CABLESSC9 = WESTCOR - POWER CONDITIONERS
METHODOLOGY - 6

r?" X A77 . , -7 W7 V. F%
2.3 PHASE DESCRIPTIONS
2.3.1 BASELINE DEVELOPMENT
To model and estimate the development phase costs,the parametric estimating group evaluated thescope of work to be accomplished during thisperiod. The end product of the Development Phasewas two protoflight units and the supporting buildand test equipment.
The equipment lists in figures 2.2-1 to 2.2-4,show the items that were modeled and estimated.Following is a list of programmatic assumptionsthat, coupled with the equipment list, detailswhat was included in the development baselinecosts.
1) Two protoflight (flight qualified) units weredesigned and built under the Developmentsegment. A low level of scrap parts/assemblies were factored into this effort.
2) Manufacturing spares were included.
3) There was a robust level of systems/subsystems design and analysis for thedemonstration units.
4) The spacecraft/payload required the highestpossible performance/reliability - Class Selectrical parts were required. This levelof screening included RF components.
5) Traditional Space Division type contractualrequirements included high reliability,extensive documentation, extensiveenvironmental-acceptance-systems testing,narrow tolerances, expensive structuralmaterials, and the Aerospace Corporationinvolvement.
6) All documentation was to form anddeliverable.
7) Launch vehicle interface loads and interfaceswere assumed to be worst case (complex).
8) An inert mass simulator was built to supportmass properties, tooling fit checks, sometesting, and design changes.
METHODOLOGY - 7
9) A 30-month development schedule.
10) C-Spec financial reporting required.
11) All mechanisms qualified at the subsystemlevel.
12) All subsystems and components were new designwith varying engineering complexities.
13) A full complement of build and test fixtures(MAGE) was i, luded in the protoflight unitdevelopment ac-ivities, including:
Handling slingsSupport standsFrame assembly support standsHandling fixturesContainersTest support stands
14) A full complement of electrical assemblyground equipment was included in theprotoflight unit development activities,including:
Payload test electronics!Battery charger set
Power system simulator LC&DH test data/equipmentACS test setOrdnance test equipmentTest cables
15) A rigorous test program was applied underbaseline conditions, including:
Dynamic-vibration testingAcoustics and thermal testingPayload/transponder EM testingSystems testingQualification and acceptance testing
16) Additional support equipment was included inthe form of shipping and storage containers.
17) New software was developed to support thedemonstration units.
METHODOLOGY - 8
,1'r . %*&'V
18) Costs for subcontracted and off-the-shelfitems represent the total price to a primecontractor plus the appropriate G&A andprocurement burdens. Costs for the primecontractor developed items were costincluding overheads and G&A, less profit.Total cost value is total cost less CAS andprofit.
METHODOLOGY - 9
W~p~j' ~ * ~~ ~~*% ~.A

2.3.2 BASELINE PEP - PRODUCEABILITY ENGINEERING PHASE
The PEP activity is intended to follow thedevelopment activity. Experience in the aerospaceindustry has shown that during a developmentprogram (or during most limited quantityspacecraft programs) the first few vehicles arenever identical. The vehicle user usuallyrequires slight modifications from one unit to thenext. In modeling the development (baseline), theparametric group assumed that the developmentvehicles would be similar but not identical.
PEP also represented the level of redesign anddocumentation clean up required to make themanufactured items produceable and to tune theproduction process. Included in this segmentwere: reviewing and tuning the design ofmanufactured items, implementing changes betweenthe development units and the production units,building the required MAGE and EAGE, etc.
One of the activities of PEP was to generate aconsolidated design. For example, suppose thatthe vehicles produced in the next phase(production) were identical. Drawings would needto be configured during PEP with production as theprimary goal, where possible. To estimate thisdocumentation effort and design review, the itemsmodeled during the development phase wereaddressed as a paper task, i.e., no new hardwarewas built. The analysis effort was increased toinsure that any changes would not affect the enditem performance.
A major portion of PEP effort was directed towardstooling and test equipment items. This effortvaried depending upon the production quantitysince more time was spent on tooling as therequired quantity increased. The toolingdocumentation was assumed to be controlled byusing the same procedures as flight hardware.
The specific assumptions and scope concerning PEPwere as follows:
1) All appropriate assumptions from developmentwere applicable.
2) All economic conditions for PEP wereidentical to development.
METHODOLOGY - 10

3) A flight equivalent unit was not built duringPEP. Breadboard items or productionpathfinder hardware were built to verifytooling, process plans, and test procedures.
4) Varying levels of design activity wereaccomplished depending upon productionquantities; the greater the productionquantity, the more intense the designactivity.
5) Production lots were 5, 25, 50, 100, and 150.
6) The level of PEP did increase proportionallywith the production quantity; it increased ata decreasing rate.
7) The appropriate build tools, test fixtures,and test sets were included in the estimatefor PEP (see list of build tools and testfixtures for the Development Phase).
8) Prime contractor and vendor items wereincluded in the PEP estimate.
9) Testing activities associated with designmodifications and changes/upgrades to testequipment were included in PEP.
10) Design changes entertained in PEP weredefined as non-block in nature. This doesnot imply that block changes cannot beaccommodated with this methodology. Rather,it demonstrates that the current estimate andcandidate variables do not include suchactivities.
11) PEP was intended to be a stand alone activitythat ran parallel to the production effort.The intent of modeling the effort this waywas to isolate the nonrecurring segment ofthe production effort. An added feature ofthis approach was that changes could beevaluated prior to their incorporation duringan actual program. Thus, the user could testthe affordability of any modification.
12) There were no testing activities associatedwith the PEP segment, with the exception oftest procedure tuning activities.
METHODOLOGY - 11
I.II A.u I I n , , -- = Z

2.3.3 BASELINE PRODUCTION
Production represented "building to print" thespacecraft baseline designed in the DevelopmentPhase using the techniques and equipmentestablished/built in the PEP segment. TheProduction Phase included most of the recurringcosts associated with building a spacecraft.Production Phase assumptions were as follows:
1) All economic conditions associated withproduction were identical to that of PEP.
2) All appropriate assumptions from Developmentand PEP still applied.
3) Production included lots of 5, 25, 50, 100,and 150.
4) Under "business as usual" conditions, it wasassumed that there was a certain amount ofchange traffic during the production processthat increased somewhat proportionately witheach production quantity.
5) The quantities did not reflect en masseproduction, rather a product that was
Uevolving as user demands were accommodated.User demands did not include block changes.
6) Appropriate learning curves or prnductimprovement factors were applied dependiag onquantity, item, and process.
7) The production effort did not includenonrecurring costs.
8) The baseline included a rigorous testprogram.
9) The production run was assumed to be acontinuous build activity peaking at fivespacecraft per month.
10) Funding was not a production consideration.
METHODOLOGY - 12

PRIMARY COST VARIABLES
1) USE OF EXISTING EQUIPMENT
This variable addresses the cost effect of using equipmentthat already exists and is flight certified or exists in thefield and needs slight modification, versus equipment thatmust be developed from scratch or requires extensivemodification to an existing design.
2) TESTING APPROACH
This variable addresses the cost effect of alternate testingapproaches. It encompasses the level of testing, i.e.,system, subsystem, module, etc., the types of testing, andthe frequency of testing.
3) SYSTEM MODULARITY/DESIGN MODULARITY
This variable addresses the cost impact of a modular versusa non-modular design and how modular design affects designand production costs.
4) MISSION LIFE - LEVEL OF PERFORMANCE/RELIABILITY REOUIRED
This variable addresses the cost impact related to length ofmission life. It also indicates the effect of more reliableparts on component and assembly costs.
5) MECHANICAL/STRUCTURAL MATERIALS AND TOLERANCES
This variable relates cost to the types of materials used toproduce the spacecraft/payload and the precision to whichthese parts must be produced.
SUMMARY OF CANDIDATE VARIABLES

SECONDARY COST VARIABLES
6) STREAMLINING MANAGEMENT OPERATIONS
This variable accounts for changes in the managementphilosophy. There are controllable programmatic factorsthat can reduce the level of management and streamline themanagement process.
7) LEVEL OF DELIVERABLE DOCUMENTATION REQUIRED
This variable addresses the cost of various levels ofrequired documentation. It also reveals the associatedcosts of management and customer reviews.
8) SIZE/EFFICIENCY OF PRODUCTION FACILITY
This variable addresses the cost impact of using a largefacility involved in many contracts and having many requiredoperating procedures, versus using a smaller, morestreamlined operation with additional flexible operatingprocedures. This small operation could represent a specialsubcontractor or a splinter operation from the maincontractor.
9) MANUAL VERSUS AUTOMATED MANUFACTURING & TEST METHODS
This variable addresses the cost savings/added costs ofusing automated, autonomous type manufacturing machine toolsversus traditional labor intensive machine tools. It alsoaddresses the added costs/savings of using automated testmethods.
10) LEVEL OF DESIGN/TECHNOLOGY CHANGES AND UPGRADES
This variable addresses cost/savings due to incorporation ofdesign and technology changes during the manufacturingprocess. These changes are assumed to be of minor impactand are more of a tuning function.
11) LAUNCH VEHICLE SIZE AND WEIGHT CONSTRAINTS
This variable addresses the cost impact to development whenthe spacecraft/payload is approaching the limits of the liftcapabilities of the launch vehicle. This variable assumesthat all weight related issues are addressed during designand PEP; therefore, no impact to production is realized.
SUMMARY OF CANDIDATE VARIABLES
u-~ E'.~UVW U ~ WWWVWU-IlflWfl W.U W1JWVWU V V U U'.Uw WX L W
3.0 CANDIDATE VARIABLES
3.1 PRIMARY VARIABLE DESCRIPTIONS & MECHANICS
1) USE OF EXISTING EQUIPMENT
This variable addresses the cost effect of using equipmentthat already exists and is flight certified or exists in thefield and needs slight modification, versus equipment thatmust be developed from scratch or requires extensivemodification to an existing design.Weight:
Qualitative Scale
B) Essentially all equipment developed for thespacecraft/payload will be developed from scratch; noequipment currently exists that supports therequirements. Some equipment is available thatperforms "like" functions, but extensive redesign isrequired to match item characteristics.
1) Much of the required spacecraft/payload equipment willhave to be developed from scratch. In some instances,existing design can be used, but will require majorrepackaging or similar design modification. Equipmentrequirements are somewhat different from teammate'straditional product lines.
2) Much of the equipment needed for the spacecraft/payloadexists in some form. Some items require repackagingbut are functionally similar to existing requirements.A few items will require some design modification andsubsequently require change to the drawing package.
3) Extensive use of existing equipment. Use of equipmentpreviously flight certified and flown on spacecraftmissions. Slight modifications and repackagingrequired on some items. Some attributes of thespacecraft bus are built around the characteristics ofthe existing subsystem parts.
CANDIDATE VARIABLES - 1
.. .. .. . . . . .. . . . .. -.. o r or

RCA Model Parameters
Notes:- Changes should be made to purchased items only; ROM bidsmust indicate that existing design is to be used or pricelists must be available.
- Reductions to input parameters should be made from currentvalues, i.e., -.1, -.2 values are subtracted from currentones.
- Changes are made only to spacecraft/payload electro-mechanical parts - no change to any of the structuralitems or integration; there is no existing design for thestructural subsystem.Reduce analysis for all subsystems where some equipmentcurrently exists.No reduction to PEP and Production segments.
INPUT PARAMETER BASELINE OPTION 1 OPTION 2 OPTION 3
DEVELOPMENTECMPLX - SUB** -.1 -.2 .2 OR .3**ANALYSIS ECMPLX
1.2.9.1.3 - TT&C - -.05 -.1 -.151.2.9.1.33 - TT&C SUB - -.05 -.1 -.151.2.9.1.5 - ACS - -.05 -.1 -.151.2.9.1.55 - ACS SUB - -.05 -.1 -.151.2.9.1.6 - C&DH - -.05 -.1 -.151.2.9.1.66 - C&DH SUB - -.05 -.1 -.151.2.9.1.7 - PAYLOAD - -.05 -.1 -.151.2.9.1.77 - PAY SUB - -.05 -.1 -.151.2.9.1.8 - FRONT END - -.05 -.1 -.15
PEP - Eliminate PEP activities for items that are off-the-shelf- production facilities exist.
PRODUCTION
** - Set value of ECMPLX to .2 or .3 depending on the object - #3
CANDIDATE VARIABLES - 2
------ ------
2) TESTING APPROACH
This variable addresses the cost effect of alternate testingapproaches. It encompasses the level of testing, i.e.,system, subsystem, module, etc., the types of testing, andthe frequency of testing.weight:
Qualitative Scale
B) Extensive testing: testing to the lowest functionallevel, testing of all assemblies, subsystems, andsystems. Full battery of environmental andnon-environmental testing and acceptance testing.Included would be: vibration, acoustical, thermal,thermal vacuum, radiation, and all other space relatedtesting. Individual testing procedures required foreach major test. High frequency of testing; testing ofessentially every production unit. High number ofsystem/subsystem test articles. Each production unitreceives extensive qualification testing.
1) Testing to the first assembly level, subsystems, andsystems. Full battery of environmental andnon-environmental testing and acceptance testing. Dueto the nature of the vehicle and test facilities, sometests can be performed using the same facilities ordone in parallel. Frequent testing; testing everyother production unit. Many system/subsystem testC' articles. Qualification test on every other productionunit. Some testing shortcuts established as testing
progresses.2) Testing at the subsystem and system levels. Reduced
space vehicle testing; some environnmental/non-environmental tests are not required. Thermal testingnot required due to known environment and componentcapabilities; reduced transponder EM testing.Extensive testing only occurs when changes are made todesign baseline. Infrequent use of test articles.Qualification test about every third production unit.
3) Testing is mostly performed at the system level. Forproduction, test every fifth unit depending on lotmaterial buys, i.e., test first spacecraft unit foreach new lot of material. Very limited testing andacceptance testing only. Non-destructive testing ordynamic testing against mass simulator; refurbishingnot required. Reduced space vehicle testing; someenvironmental/non-environmental tests are notrequired. Thermal testing not required due to knownenvironment and component capabilities; reducedtransponder EM testing because of previously certifiedunit.
CANDIDATE VARIABLES - 3

RCA Model Parameters
Notes:- Change globals for both prime and teammates as indicated.- Changes to test boxes affect prime costs only.- Changes to tooling global for test boxes only.- Reduce EAGE support equipment for those tests that havebeen reduced or eliminated.
INPUT PARAMETER BASELINE OPTION 1 OPTION 2 OPTION 3
DEVELOPMENTTest Boxes Weights
Dynamic Test&Refurb - -10% -25% -40%Acoustics & Thermal - -10% -25% -40%Payload/Transponder - -15 -30 -50
GDTLGT 2.0 1.9 1.7 1.5EAGE Box Weights
Doppler Effect Elec. 7.0 3.5 0 0 *Trans/Rec. Test Elec 10.0 5.0 0 0 *C&DH Test Data Equip 25 23 20 17ACS Test Set 27 25 22 19Ordnance Test Equip 30 28 25 22
PEPTest Boxes Weights
Test Review 24 21 17 12EAGE Box Weights
Doppler Effect Elec. 7.0 3.5 0 0 *Trans/Rec. Test Elec 10.0 5.0 0 0 *C&DH Test Data Equip 25 23 20 17ACS Test Set 27 25 22 19Ordnance Test Equip 30 28 25 22
PRODUCTIONTest Boxes Weights
Dynamic Test&Refurb - -10% -25% -40%Acoustics & Thermal - -10% -25% -40%Payload/Transponder - -15 -30 -50
GDTLGT 2.0 1.9 1.7 1.5Test Quantities
Dynamic, Acoustics,Thermal, Payload: 5 4 3 225 12 8 5
50 25 17 10100 50 34 20150 75 50 30
A box containing a zero weight value should be commented outof the data file.
CANDIDATE VARIABLES - 4
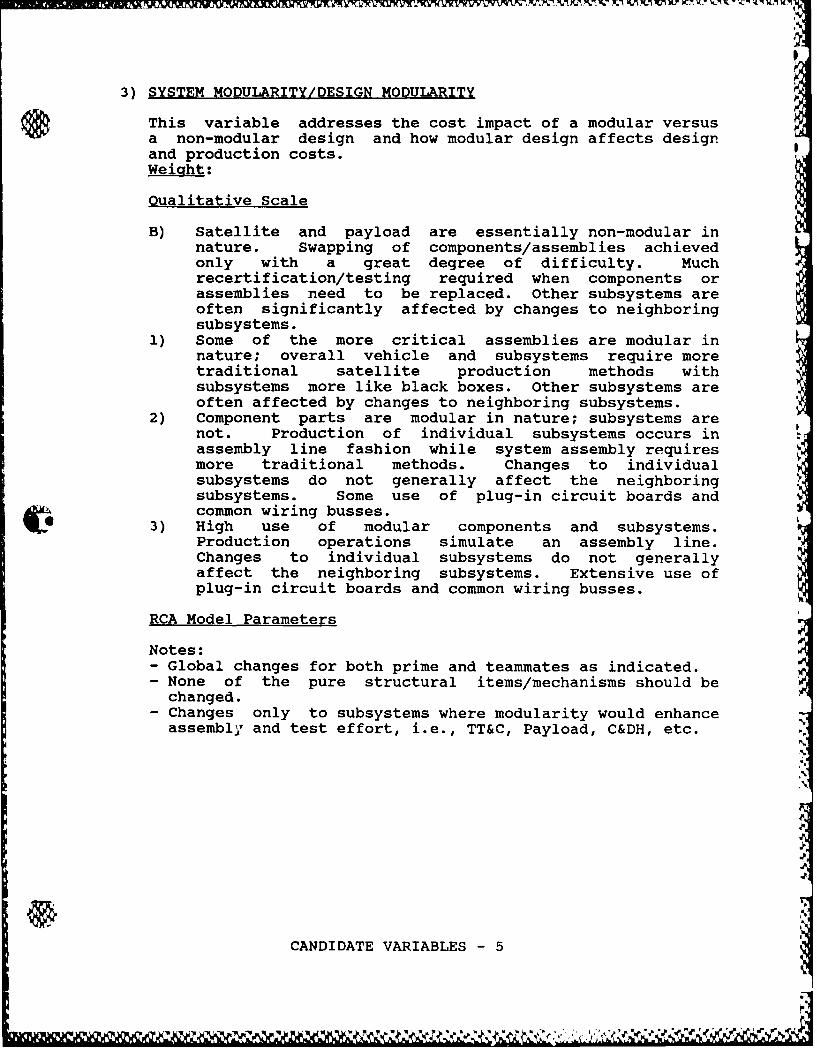
3) SYSTEM MODULARITY/DESIGN MODULARITY
This variable addresses the cost impact of a modular versusa non-modular design and how modular design affects designand production costs.Weight:
Qualitative Scale
B) Satellite and payload are essentially non-modular innature. Swapping of components/assemblies achievedonly with a great degree of difficulty. Muchrecertification/testing required when components orassemblies need to be replaced. Other subsystems areoften significantly affected by changes to neighboringsubsystems.
1) Some of the more critical assemblies are modular innature; overall vehicle and subsystems require moretraditional satellite production methods withsubsystems more like black boxes. Other subsystems areoften affected by changes to neighboring subsystems.
2) Component parts are modular in nature; subsystems arenot. Production of individual subsystems occurs inassembly line fashion while system assembly requiresmore traditional methods. Changes to individualsubsystems do not generally affect the neighboringsubsystems. Some use of plug-in circuit boards andcommon wiring busses.
3) High use of modular components and subsystems.Production operations simulate an assembly line.Changes to individual subsystems do not generallyaffect the neighboring subsystems. Extensive use ofplug-in circuit boards and common wiring busses.
RCA Model Parameters
Notes:- Global changes for both prime and teammates as indicated.- None of the pure structural items/mechanisms should bechanged.
- Changes only to subsystems where modularity would enhanceassembl., and test effort, i.e., TT&C, Payload, C&DH, etc.
CANDIDATE VARIABLES - 5
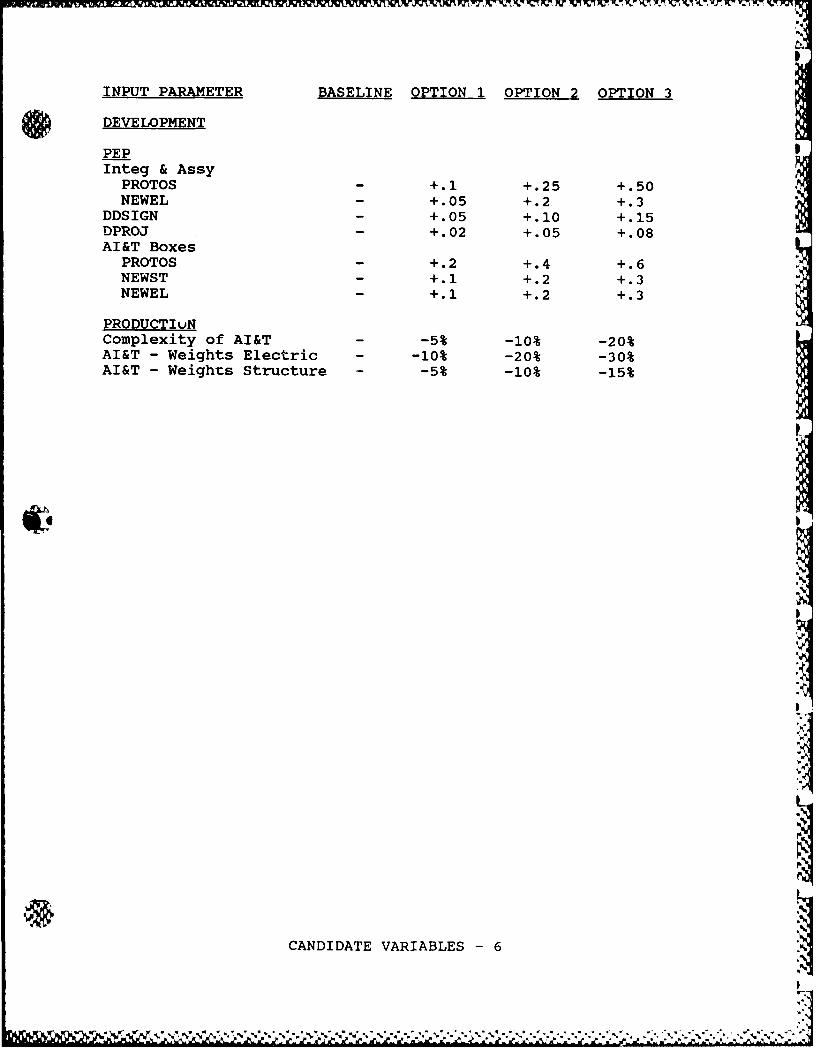
INPUT PARAMETER BASELINE OPTION 1OPTION 2 OPTION 3
~ DEVELOPMENT
PEPInteg & Assy
PROMOS - +.1 +.25 +.50NEWEL - +.05 +.2 .
DDSIGN - +.05 +.10 +.15DPROJ - +.02 +.05 +.08AI&T Boxes
PROMOS - +.2 .4+.6NEWST - +.1 +.2 .NEWEL - +.l +.2 .
PRO DUCT luNComplexity of AI&T - -5% -10% -20%AI&T - Weights Electric - -10% -20% -30%AI&T - Weights Structure - -5% -10% -15%
U.CANDIDATE VARIABLES -6 1

4) MISSION LIFE - LEVEL OF PERFORMANCE/RELIABILITY REOUIRED
This variable addresses the cost impact related to length ofmission life. It also indicates the effect of more reliableparts on component and assembly costs.Weight:
Qualitative Scale
B) Mission requirements are for an extended mission life.S class components - highest possible performance/reliability required. Full up S Class parts have majorCommercial parts are available that meet performance/reliability requirements. Mission requirements are fora short mission life of less than two years. Allcomponents and assemblies are of reduced reliability.Small level of failures expected/tolerable.
1) B Class components - very stringent designrequirements. Mission requirements are for a minimumof two or three year mission life; satellite mustoperate effectively over this period. Component partsand assemblies MTBF (mean time between failures) mustbe rated/certified to exceed mission requirements.Spacecraft reliability must insure mission success.
2) Mil standard components or less stringent designrequirements. Mission requirements are for a reducedmission life of two to three years. Less stringentcomponent and assembly MTBF. Less testing involved toinsure longevity of mission. Wider tolerancespermitted on spacecraft reliability. Very small levelof failures expected/tolerated.
3) Commercial parts are available that meet performance/reliability requirements. Mission requirements are fora short mission life of less than two years. Allcomponents and assemblies are of reduced reliability.Small level of failures expected/tolerable.
CANDIDATE VARIABLES - 7
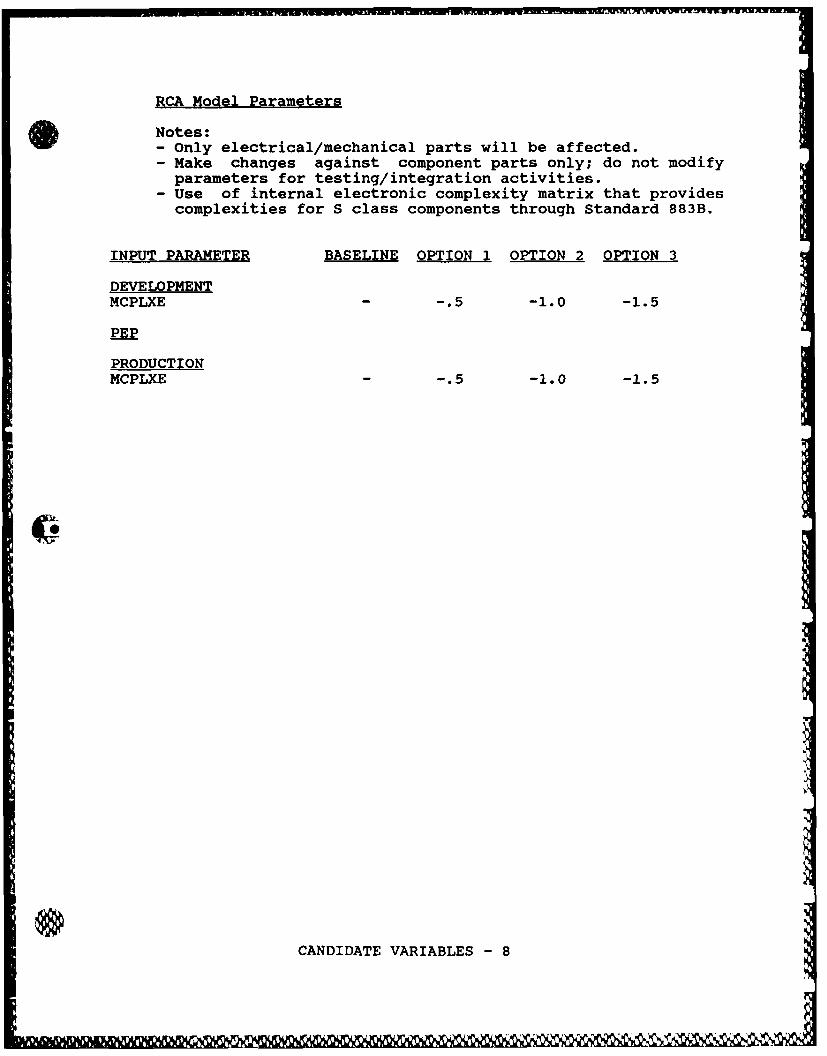
RCA Model Parameters
Notes:- Only electrical/mechanical parts will be affected.- Make changes against component parts only; do not modify
parameters for testing/integration activities.- Use of internal electronic complexity matrix that provides
complexities for S class components through Standard 883B.
INPUT PARAMETER BASELINE OPTION 1 OPTION 2 OPTION 3
DEVELOPMENTMCPLXE -.5 -1.0 -1.5
PEP
PRODUCTIONMCPLXE -.5 -1.0 -1.5
CANDIDATE VARIABLES - 8

5) MECHANICAL/STRUCTURAL MATERIALS AND TOLERANCES
This variable relates cost to the types of materials used toproduce the spacecraft/payload and the precision to whichthese parts must be produced.Weifht:
Oualitative Scale
B) New materials, composites, or difficult alloys. Partsand assemblies have very narrow tolerances. Some partswill require special manufacturing/assembly knowledge.Special cutting tools for machining operations will berequired. Best available material and assemblytechniques employed.
1) Relatively new material/composites requiring specialmanufacturing or assembly expertise. Special berylliumand titanium compounds used for some structuralcomponents. Tolerances are difficult on many parts andassemblies. Properties of material are known butlimited experience in working with material. Somespecial tools may be required.
2) Typical material/composites with close but comfortabletolerances. Some attributes of the manufacturing/assembly process require special considerations. Lessextensive quality control required for monitoringproduction effort.
3) Simple aluminum composites or equivalent. No specialtooling required for machining operations. Tolerancesare fairly easy to maintain on standard machine tools.Weight savings are not a factor.
RCA Model Parameters
Notes:- Impact on cost for development, PEP, and production
activities.- Mechanical/structural items are the only parts receiving
changes to complexity, weight, globals, and platform.- Change integration and test for mechanical/structural
items only.
CANDIDATE VARIABLES - 9
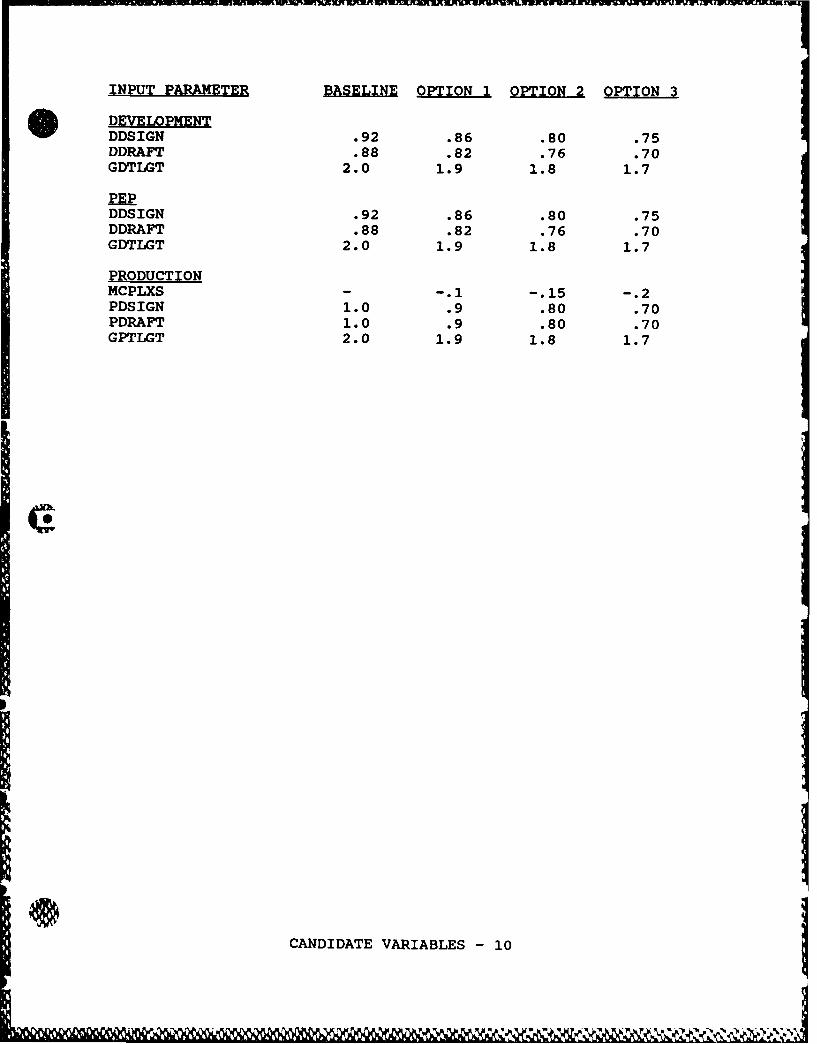
INPUT PARAMETER BASLINE OPTION 1OPTIONL OPTION3
S DEVELOPMENTDDSIGN .92 .86 .80 .75DDRAFT .88 .82 .76 .70GDTLGT 2.0 1.9 1.8 1.7
DDSIGN .92 .86 .80 .75DDRAFT .88 .82 .76 .70GDTLGT 2.0 1.9 1.8 1.7
PRODUCTIONMCPLXS - -.1 -.15 -.2PDSIGN 1.0 .9 .80 .70PDRAFT 1.0 .9 .80 .70GPTLGT 2.0 1.9 1.8 1.7
CANDIDATE VARIABLES -10
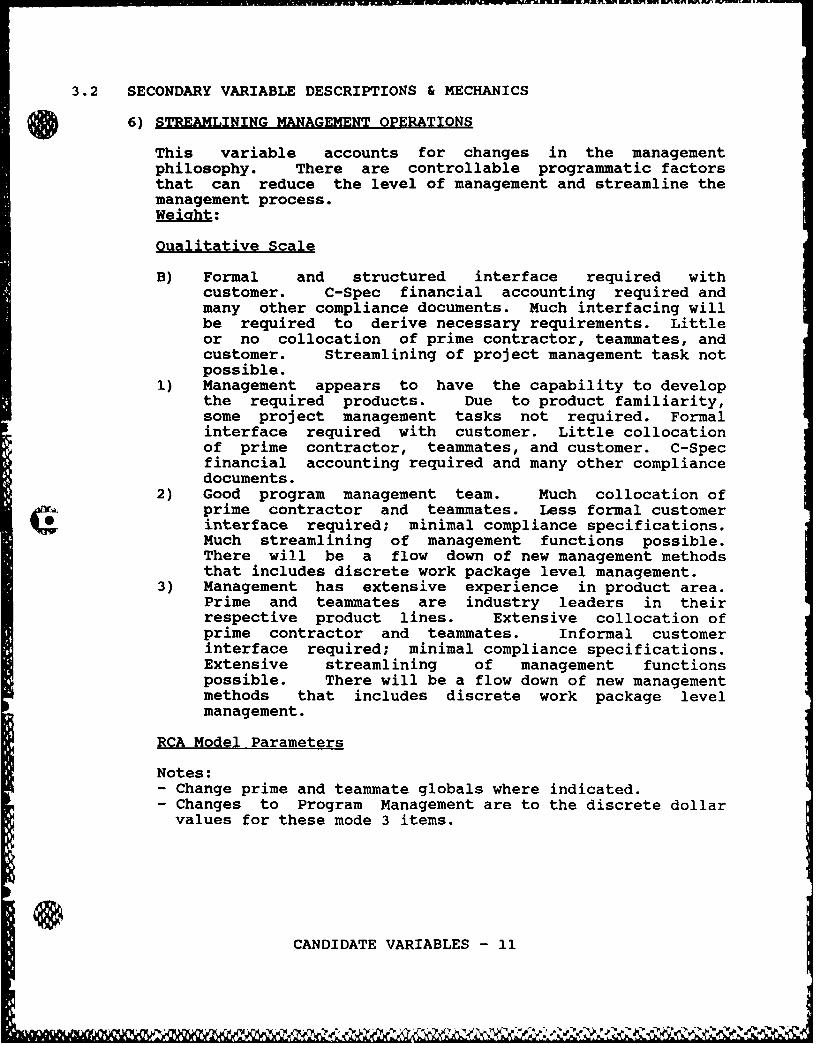
3.2 SECONDARY VARIABLE DESCRIPTIONS & MECHANICS
6) STREAMLINING MANAGEMENT OPERATIONS
This variable accounts for changes in the managementphilosophy. There are controllable programmatic factorsthat can reduce the level of management and streamline themanagement process.Weicrht:
Oualitative Scale
B) Formal and structured interface required withcustomer. C-Spec financial accounting required andmany other compliance documents. Much interfacing willbe required to derive necessary requirements. Littleor no collocation of prime contractor, teammates, andcustomer. Streamlining of project management task notpossible.
1) Management appears to have the capability to developthe required products. Due to product familiarity,some project management tasks not required. Formalinterface required with customer. Little collocationof prime contractor, teammates, and customer. C-Specfinancial accounting required and many other compliancedocuments.
2) Good program management team. Much collocation ofprime contractor and teammates. Less formal customerinterface required; minimal compliance specifications.Much streamlining of management functions possible.There will be a flow down of new management methodsthat includes discrete work package level management.
3) Management has extensive experience in product area.Prime and teammates are industry leaders in theirrespective product lines. Extensive collocation ofprime contractor and teammates. Informal customerinterface required; minimal compliance specifications.Extensive streamlining of management functionspossible. There will be a flow down of new managementmethods that includes discrete work package levelmanagement.
RCA Model Parameters
Notes:- Change prime and teammate globals where indicated.- Changes to Program Management are to the discrete dollarvalues for these mode 3 items.
CANDIDATE VARIABLES - 11
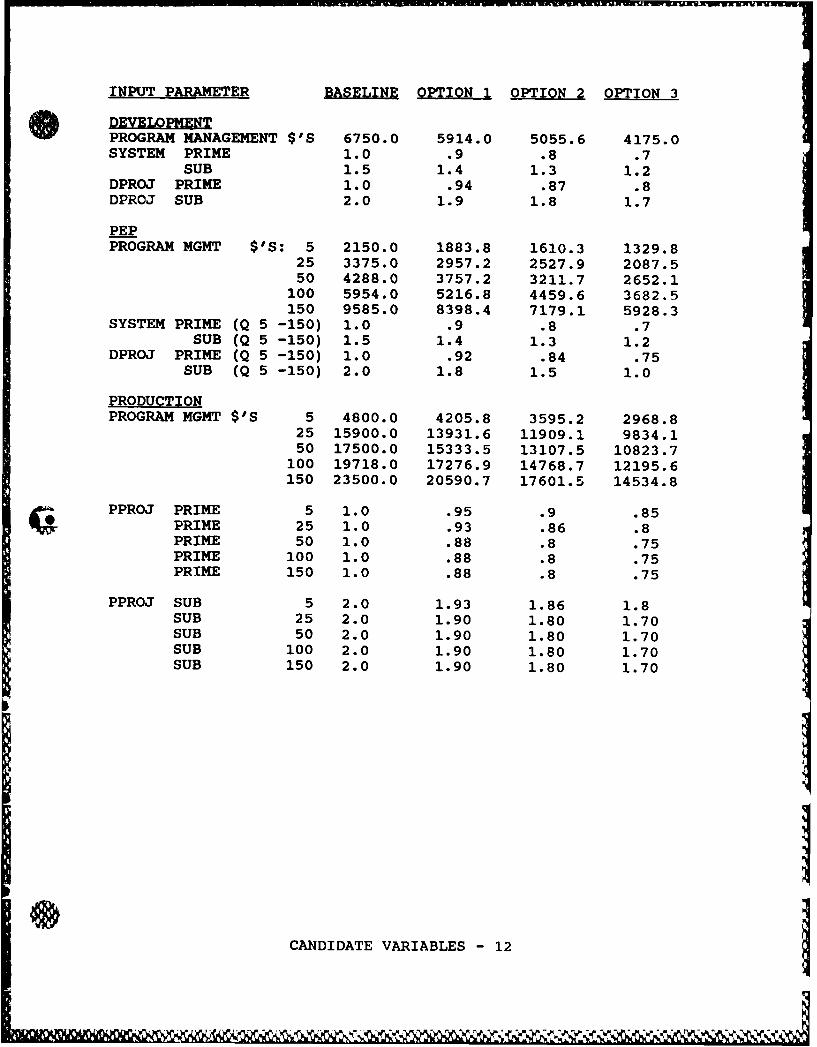
INPUT PARAMETER BASELINE OPTION 1 OPTION _ OPTION3
PROGRAM MANAGEMENT $'S 6750.0 5914.0 5055.6 4175.0SYSTEM PRIME 1.0 .9 .8 .7
SUB 1.5 1.4 1.3 1.2DPROJ PRIME 1.0 .94 .87 .8DPROJ SUB 2.0 1.9 1.8 1.7
PEPPROGRAM MGMT $'S: 5 2150.0 1883.8 1610.3 1329.8
25 3375.0 2957.2 2527.9 2087.550 4288.0 3757.2 3211.7 2652.1
100 5954.0 5216.8 4459.6 3682.5150 9585.0 8398.4 7179.1 5928.3
SYSTEM PRIME (Q 5 -150) 1.0 .9 .8 .7SUB (Q 5 -150) 1.5 1.4 1.3 1.2
DPROJ PRIME (Q 5 -150) 1.0 .92 .84 .75SUB (Q 5 -150) 2.0 1.8 1.5 1.0
PRODUCTIONPROGRAM MGMT $'S 5 4800.0 4205.8 3595.2 2968.8
25 15900.0 13931.6 11909.1 9834.150 17500.0 15333.5 13107.5 10823.7
100 19718.0 17276.9 14768.7 12195.6150 23500.0 20590.7 17601.5 14534.8
PPROJ PRIME 5 1.0 .95 .9 .85PRIME 25 1.0 .93 .86 .8PRIME 50 1.0 .88 .8 .75PRIME 100 1.0 .88 .8 .75PRIME 150 1.0 .88 .8 .75
PPROJ SUB 5 2.0 1.93 1.86 1.8SUB 25 2.0 1.90 1.80 1.70SUB 50 2.0 1.90 1.80 1.70SUB 100 2.0 1.90 1.80 1.70SUB 150 2.0 1.90 1.80 1.70
CICANDIDATE VARIABLES - 12
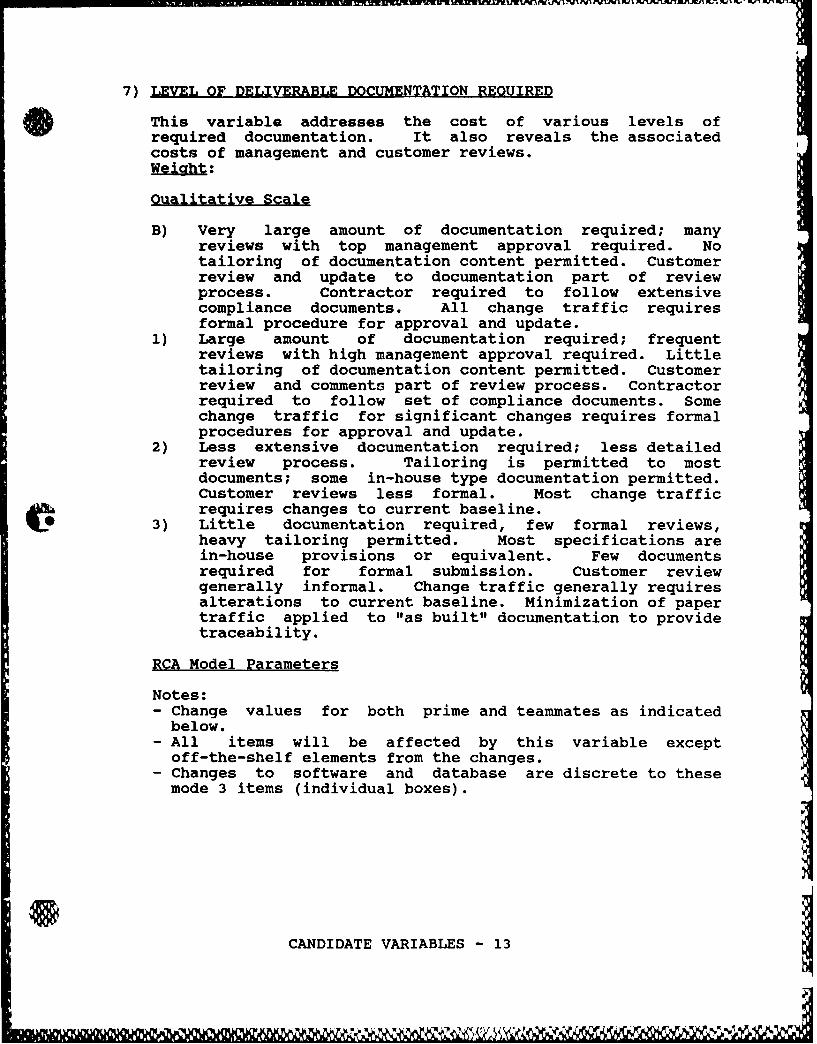
7) LEVEL OF DELIVERABLE DOCUMENTATION REOUIRED
This variable addresses the cost of various levels ofrequired documentation. It also reveals the associatedcosts of management and customer reviews.Weicrht:
Oualitative Scale
B) Very large amount of documentation required; manyreviews with top management approval required. Notailoring of documentation content permitted. Customerreview and update to documentation part of reviewprocess. Contractor required to follow extensivecompliance documents. All change traffic requiresformal procedure for approval and update.
1) Large amount of documentation required; frequentreviews with high management approval required. Littletailoring of documentation content permitted. Customerreview and comments part of review process. Contractorrequired to follow set of compliance documents. Somechange traffic for significant changes requires formalprocedures for approval and update.
2) Less extensive documentation required; less detailedreview process. Tailoring is permitted to mostdocuments; some in-house type documentation permitted.Customer reviews less formal. Most change trafficrequires changes to current baseline.
3) Little documentation required, few formal reviews,heavy tailoring permitted. Most specifications arein-house provisions or equivalent. Few documentsrequired for formal submission. Customer reviewgenerally informal. Change traffic generally requiresalterations to current baseline. Minimization of papertraffic applied to "as built" documentation to providetraceability.
RCA Model Parameters
Notes:- Change values for both prime and teammates as indicatedbelow.
- All items will be affected by this variable exceptoff-the-shelf elements from the changes.
- Changes to software and database are discrete to thesemode 3 items (individual boxes).
CANDIDATE VARIABLES - 13
.. ..... ..
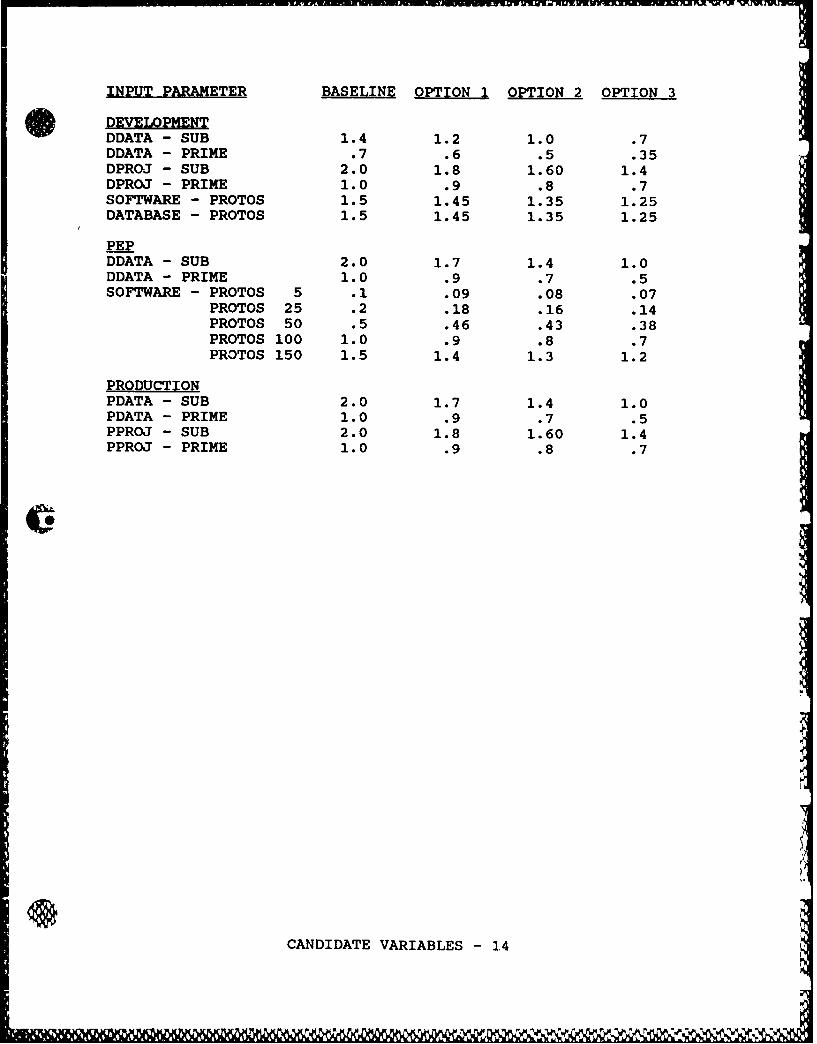
INPUT PARAMETER BASELINE OPTION 1 OPTION 2 OPTION 3
DDATA - SUB 1.4 1.2 1.0 .7DDATA - PRIME .7 .6 .5 .35DPROJ - SUB 2.0 1.8 1.60 1.4DPROJ - PRIME 1.0 .9 .8 .7SOFTWARE - PROTOS 1.5 1.45 1.35 1.25DATABASE - PROTOS 1.5 1.45 1.35 1.25
PEPDDATA - SUB 2.0 1.7 1.4 1.0DDATA - PRIME 1.0 .9 .7 .5SOFTWARE - PROTOS 5 .1 .09 .08 .07
PROTOS 25 .2 .18 .16 .14PROTOS 50 .5 .46 .43 .38PROTOS 100 1.0 .9 .8 .7PROTOS 150 1.5 1.4 1.3 1.2
PRODUCTIONPDATA - SUB 2.0 1.7 1.4 1.0PDATA - PRIME 1.0 .9 .7 .5PPROJ - SUB 2.0 1.8 1.60 1.4PPROJ - PRIME 1.0 .9 .8 .7
CANDIDATE VARIABLES - 14
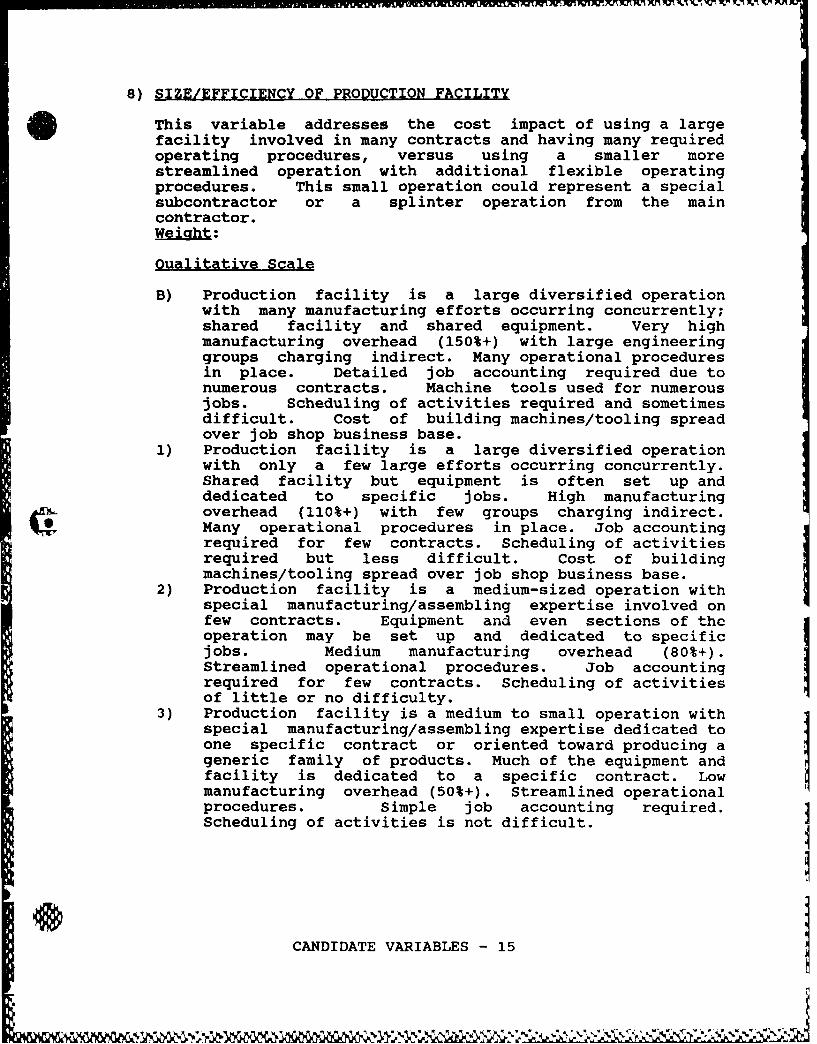
8) SIZE/EFFICIENCY OF PRODUCTION FACILITY
This variable addresses the cost impact of using a largefacility involved in many contracts and having many requiredoperating procedures, versus using a smaller morestreamlined operation with additional flexible operatingprocedures. This small operation could represent a specialsubcontractor or a splinter operation from the maincontractor.Weight:
Oualitative Scale
B) Production facility is a large diversified operationwith many manufacturing efforts occurring concurrently;shared facility and shared equipment. Very highmanufacturing overhead (150%+) with large engineeringgroups charging indirect. Many operational proceduresin place. Detailed job accounting required due tonumerous contracts. Machine tools used for numerousjobs. Scheduling of activities required and sometimesdifficult. Cost of building machines/tooling spreadover job shop business base.
1) Production facility is a large diversified operationwith only a few large efforts occurring concurrently.Shared facility but equipment is often set up anddedicated to specific jobs. High manufacturingoverhead (110%+) with few groups charging indirect.Many operational procedures in place. Job accountingrequired for few contracts. Scheduling of activitiesrequired but less difficult. Cost of buildingmachines/tooling spread over job shop business base. I
2) Production facility is a medium-sized operation withspecial manufacturing/assembling expertise involved onfew contracts. Equipment and even sections of theoperation may be set up and dedicated to specificjobs. Medium manufacturing overhead (80%+).Streamlined operational procedures. Job accountingrequired for few contracts. Scheduling of activitiesof little or no difficulty.
3) Production facility is a medium to small operation withspecial manufacturing/assembling expertise dedicated toone specific contract or oriented toward producing ageneric family of products. Much of the equipment andfacility is dedicated to a specific contract. Lowmanufacturing overhead (50%+). Streamlined operationalprocedures. Simple job accounting required.Scheduling of activities is not difficult.
CANDIDATE VARIABLES - 15
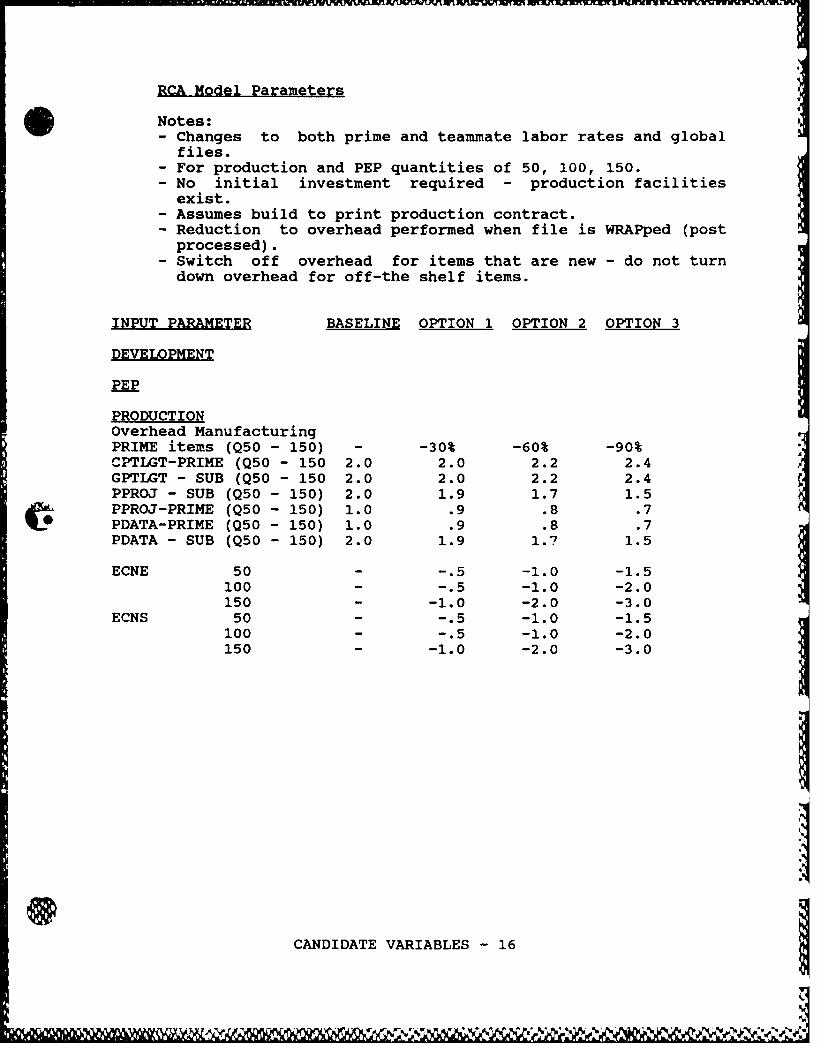
RCA Model Parameters
Notes:- Changes to both prime and teammate labor rates and global
files.- For production and PEP quantities of 50, 100, 150.- No initial investment required - production facilities
exist.- Assumes build to print production contract.- Reduction to overhead performed when file is WRAPped (postprocessed).
- Switch off overhead for items that are new - do not turndown overhead for off-the shelf items.
INPUT PARAMETER BASELINE OPTION 1 OPTION 2 OPTION 3
DEVELOPMENT
PEP
PRODUCTIONOverhead ManufacturingPRIME items (Q50 - 150) - -30% -60% -90%CPTLGT-PRIME (Q50 - 150 2.0 2.0 2.2 2.4GPTLGT - SUB (Q50 - 150 2.0 2.0 2.2 2.4PPROJ - SUB (Q50 - 150) 2.0 1.9 1.7 1.5PPROJ-PRIME (Q50 - 150) 1.0 .9 .8 .7PDATA-PRIME (Q50 - 150) 1.0 .9 .8 .7PDATA - SUB (Q50 - 150) 2.0 1.9 1.7 1.5
ECNE 50 - -.5 -1.0 -1.5100 - -.5 -1.0 -2.0150 - -1.0 -2.0 -3.0
ECNS 50 - -.5 -1.0 -1.5100 - -.5 -1.0 -2.0150 - -1.0 -2.0 -3.0
CANDIDATE VARIABLES - 16
, V,
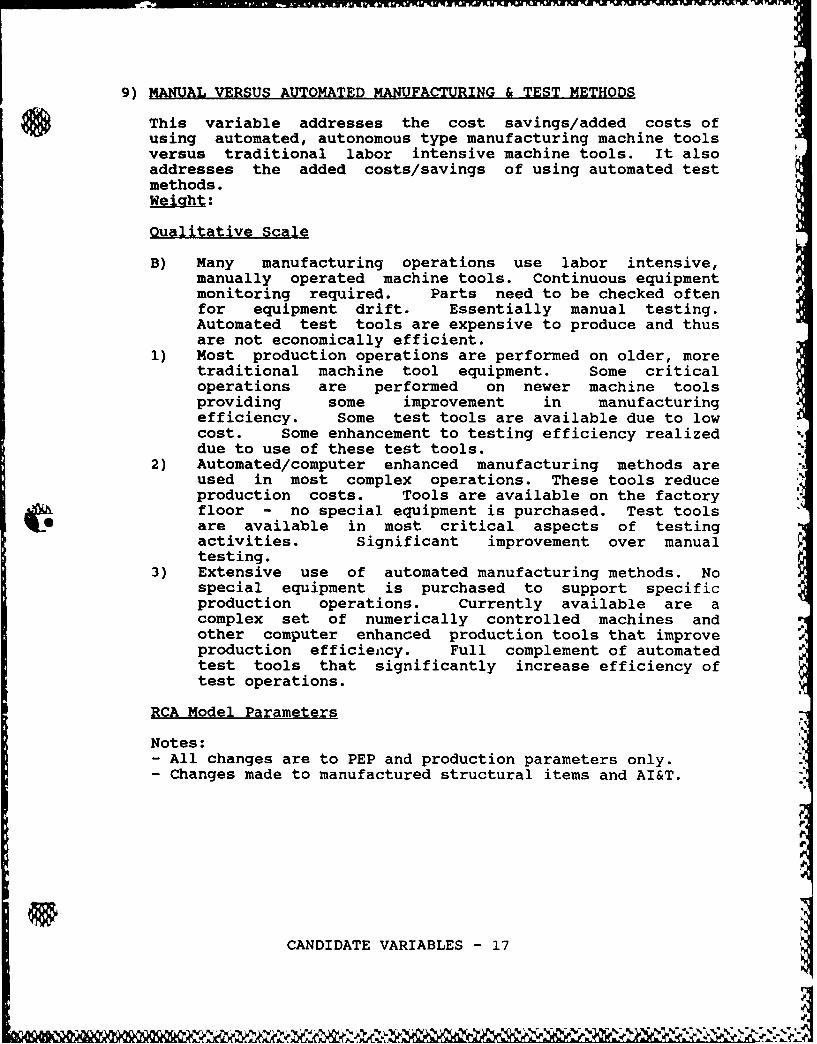
9) MANUAL VERSUS AUTOMATED MANUFACTURING & TEST METHODS
This variable addresses the cost savings/added costs ofusing automated, autonomous type manufacturing machine toolsversus traditional labor intensive machine tools. It alsoaddresses the added costs/savings of using automated testmethods.Weight:
Oualitative Scale
B) Many manufacturing operations use labor intensive,manually operated machine tools. Continuous equipmentmonitoring required. Parts need to be checked oftenfor equipment drift. Essentially manual testing.Automated test tools are expensive to produce and thusare not economically efficient.
1) Most production operations are performed on older, moretraditional machine tool equipment. Some criticaloperations are performed on newer machine toolsproviding some improvement in manufacturingefficiency. Some test tools are available due to lowcost. Some enhancement to testing efficiency realizeddue to use of these test tools.
2) Automated/computer enhanced manufacturing methods areused in most complex operations. These tools reduceproduction costs. Tools are available on the factory
-floor - no special equipment is purchased. Test toolsare available in most critical aspects of testingactivities. Significant improvement over manualtesting.
3) Extensive use of automated manufacturing methods. Nospecial equipment is purchased to support specificproduction operations. Currently available are acomplex set of numerically controlled machines andother computer enhanced production tools that improveproduction efficiency. Full complement of automatedtest tools that significantly increase efficiency oftest operations.
RCA Model Parameters
Notes:- All changes are to PEP and production parameters only.- Changes made to manufactured structural items and AI&T.
CANDIDATE VARIABLES - 17
v! xW m -' v., (

INPUT PARAMETER BASELINE OPTiIN OPT~IONL2 OPTION 3
~ DEVELOP1MENT
PEPStruct. Analysis Box
ECMPLX (Q5 - 150) - +.05 +.1 +.15Structure Boxes (Q5 - 150)
ECMPLX - +.05 +.1 +.15Test Boxes (Q5 - 150)
ECMPLX - +.05 +.l +.15Weight - +10% +15% +18%
EAGE Test EquipmentECMPLX (Q5 - 150) - +.05 +.1 +.15
Test Sets - ACS, C&DH,ETE (Q5 - 150)ECMPLX -+.05 +.l +.15Weight -+10% +15% +18%
PRODUCTIONTest Boxes (Q5 - 150)MCPLXS --. 2 -.5 -.7
AI&T Boxes (Q5 - 150)HCPLXS - -.1 -.2 -.3
Structure Boxes (Q5 - 150)MCPLXS - -.2 -.4 -.6
GPTLGT (Q5 - 150) PRIME 2.0 1.8 1.6 1.4t& GPTLGT (Q5 - 150) SUB 2.0 1.8 1.6 1.4Integ. & Assy Boxes (Q5 - 150)MCPLXS - -.2 -.4 -.6MCPLXE --. 1 -.2 -.3
CANDIDATE VARIABLES -18
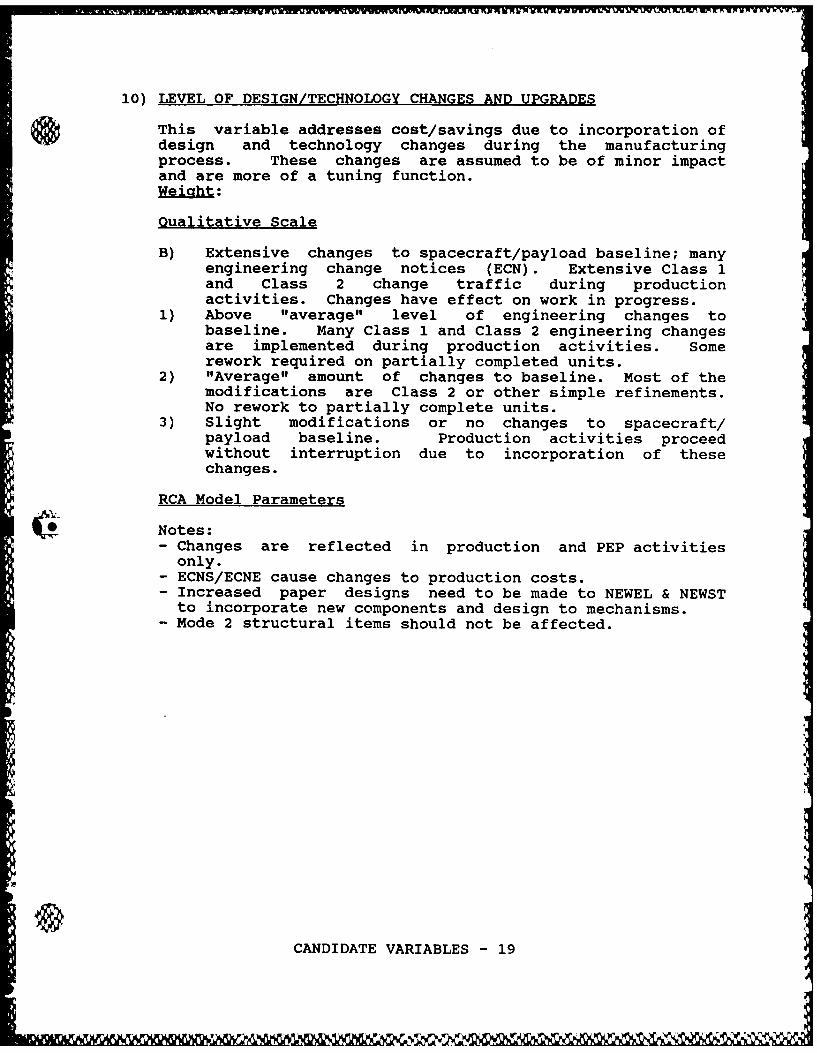
10) LEVEL OF DESIGN/TECHNOLOGY CHANGES AND UPGRADES
This variable addresses cost/savings due to incorporation ofdesign and technology changes during the manufacturingprocess. These changes are assumed to be of minor impactand are more of a tuning function.Weiaht:
Oualitative Scale
B) Extensive changes to spacecraft/payload baseline; manyengineering change notices (ECN). Extensive Class 1and Class 2 change traffic during productionactivities. Changes have effect on work in progress.
1) Above "average" level of engineering changes tobaseline. Many Class 1 and Class 2 engineering changesare implemented during production activities. Somerework required on partially completed units.
2) "Average" amount of changes to baseline. Most of themodifications are Class 2 or other simple refinements.No rework to partially complete units.
3) Slight modifications or no changes to spacecraft/payload baseline. Production activities proceedwithout interruption due to incorporation of thesechanges.
RCA Model Parameters
Notes:- Changes are reflected in production and PEP activitiesonly.
- ECNS/ECNE cause changes to production costs.- Increased paper designs need to be made to NEWEL & NEWSTto incorporate new components and design to mechanisms.
- Mode 2 structural items should not be affected.
CANDIDATE VARIABLES - 19

INPUT PARAMETER BASELINE OPTION 1 OPTION 2 OPTION 3
S DEVELOPMENT
PEP* NEWEL (Q 5 - 150) - +.2 +.3 +.35* NEWST (Q 5 - 150) -+.2 +.3 +.35
PRODUCTIONChange GlobalsECNS
5 2 1.75 1.5 1.025 3 2.75 2.5 2.050 4 3.75 3.5 3.0100 6 5.5 5.0 4.5150 8 7.5 7.0 6.5
ECNE5 2 1.75 1.5 1.0
25 3 2.75 2.5 2.050 4 3.75 3.5 3.0100 6 5.5 5.0 4.5150 8 7.5 7.0 6.5
* - Changes made 1/19/88
IICANDIDATE VARIABLES - 20
L ~w, - .,,,,,- .,,-,, ,Nn ,,e~,,-e-, or w.w

11) LAUNCH VEHICLE SIZE AND WEIGHT CONSTRAINTS
This variable addresses the cost impact to development whenthe spacecraft/payload is approaching the limits of the liftcapabilities of the launch vehicle. This variable assumesthat all weight related issues are addressed during designand PEP, therefore, no impact to production is realized.Weight:
Oualitative Scale
B) Very tight size/weight constraints due to launchvehicle limitations. Essentially no margin for growthin the spacecraft/payload preliminary design. Changesto baseline in one subsystem impact other subsystemsdue to redesign, incorporation of changes, andmaintenance of size and weight limits; result is aninflexible design.
1) Tight size/weight constraints with 5% to 10% growthmargins. Any design changes may require redesign ofexisting subsystem components. Major rework to designis required when weight limitations exceeded.
2) More relaxed size/weight constraints with 10% to 20%growth margins. Most changes can be made with aminimum degree of impact on existing components andsubsystems. Some small redesign efforts may berequired to incorporate changes that result in weight
Mm growth.3) Size and weight limitations not projected to be an
issue. Large margin for growth (+20%). Little or noredesign required for incorporating chpnges that resultin weight growth.
RCA Model Parameters
Notes:- Affects only development and PEP costs.- Analysis changes for structural subsystem only.
CANDIDATE VARIABLES - 21
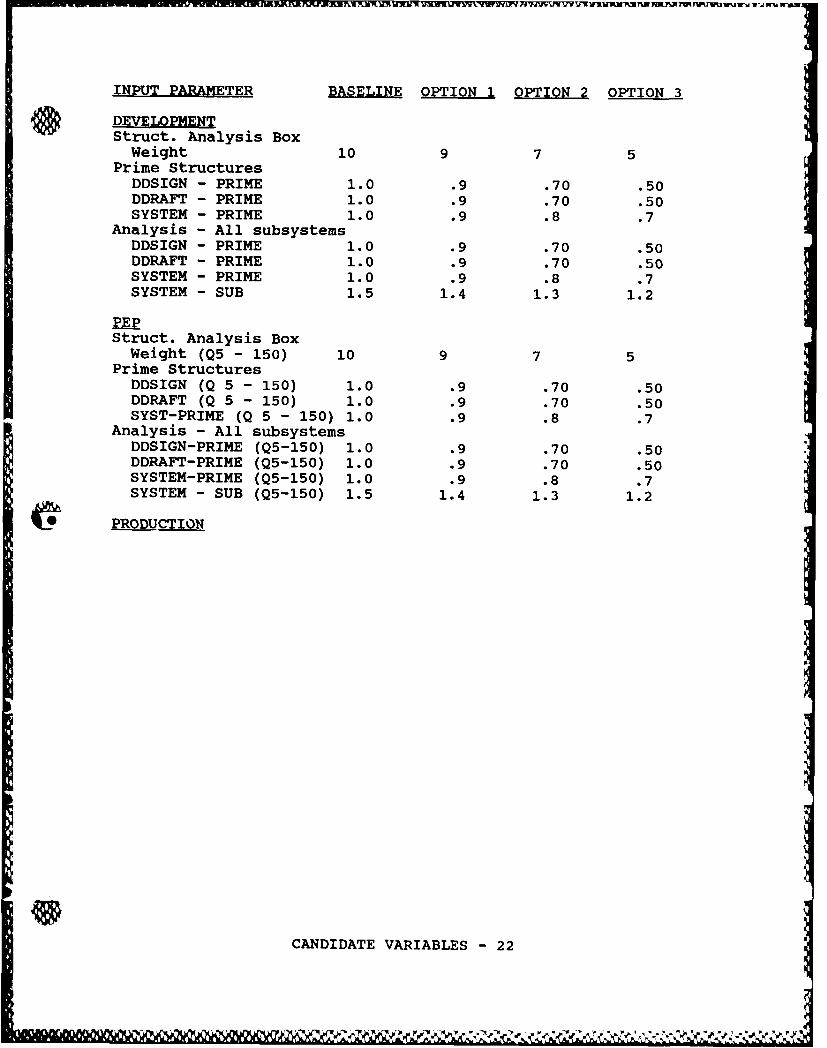
INPUT PARAMETER BASELINE OPTION 1 OPTION 2 OPTION 3
~ DEVELOPMENTStruct. Analysis BoxWeight 10 9 7 5
Prime StructuresDDSIGN - PRIME 1.0 .9 .70 .50DDRAFT - PRIME 1.0 .9 .70 .50SYSTEM - PRIME 1.0 .9 .8 .7
Analysis - All subsystemsDDSIGN - PRIME 1.0 .9 .70 .50DDRAFT - PRIME 1.0 .9 .70 .50SYSTEM - PRIME 1.0 .9 .8 .7SYSTEM - SUB 1.5 1.4 1.3 1.2
PEPStruct. Analysis Box
Weight (Q5 - 150) 10 9 7 5Prime Structures
DDSIGN (Q 5 - 150) 1.0 .9 .70 .50DDRAFT (Q 5 - 150) 1.0 .9 .70 .50SYST-PRIME (Q 5 - 150) 1.0 .9 .8 .7
Analysis - All subsystemsDDSIGN-PRIME (Q5-150) 1.0 .9 .70 .50DDRAFT-PRIME (Q5-150) 1.0 .9 .70 .50SYSTEM-PRIME (Q5-150) 1.0 .9 .8 .7SYSTEM - SUB (Q5-150) 1.5 1.4 1.3 1.2
UO PRODUCTION
CANDIDATE VARIABLES -22

3.3 OTHER COST VARIABLES EVALUATED
1) PRIME CONTRACTOR/TEAMMATE EXPERIENCE
The variable addresses the cost impact of using contractorsthat have experience in developing flight hardware versusthose that have little or no experience. The actualequipment needed does not currently exist (as with Variable1), requiring a given knowledge level to adequately developthe necessary components.Weight:
Oualitative Scale
B) Poor contractor experience. Contractors have little orno experience in developing flight hardware. Productsare not part of the company's regular product line.The equipment represents new technology to thecompany. Much interfacing will be required to derivethe necessary requirements. Consultants may berequired to supplement existing contractor knowledge.
1) Moderate contractor experience. Contractors appear tohave the technological capabilities to develop therequired products. Company has limited experience indeveloping flight hardware. No similar products havebeen developed by the contractor. Current productlines are similar in terms of the level of technologyrequired.
2) Good contractor experience. Teammates are known fortheir capabilities in their respective product lines.Technological product requirements are well withintheir normal lines of business. In some cases similarproducts have been developed.
3) Excellent contractor experience. Teammates haveextensive experience in individual product areas.Teammates are industry leaders in their respectiveproduct lines. Product requirements closely matchexisting product lines although existing equipment isstill not available. Level of technology not an issue.
RCA Model Parameters
Notes:- Change ECMPLX for all items.
CANDIDATE VARIABLES - 23

INPUT PARAMETER BASELINE OPTION 1 OPTION 2 OPTION 3
~ DEVELOPMENTECMPLX (existing H/W) --. 05 -. 1 -. 2ECMPLX (all other boxes) - -. 05 -. 1 -. 15SYSTEM - PRIME 1.0 .9 .8.7SYSTEM - SUB 1.5 1.4 1.2 1.0Analysis boxes ECMPLX
1.2.9.1.1 - Struc. - -.025 -.05 -.0751.2.9.1.1 - EPS - -.025 -.05 -.0751.2.9.1.3 - TT&C - -.05 -.1 -.151.2.9.1.33 - TT&C SUB - -.05 -.1 -.151.2.9.1.5 - ACS - -.05 -.1 -.151.2.9.1.55 - ACS SUB - -.05 -.1 -.151.2.9.1.6 - C&DH - -.05 -.1 -.151.2.9.1.66 - C&DH SUB - -.05 -.1 -.151.2.9.1.7 - PAYLOAD - -. 05 -. 1 -. 151.2.9.1.77 - PAY SUB - -.05 -.1 -.151.2.9.1.8 - FRONT END - -.05 -.1 -.15
PEPGDTLGT (Q5 - 150) 2.0 1.9 1.8 1.7ECMPLX (Q5 - 150) - -.25 -.05 -.1
all boxesSYSTEM-PRIME (Q5 - 150) 1.0 .9 .8 .7SYSTEM - SUB (Q5 - 150) 1.5 1.4 1.2 1.0
PRODUCTION
CANDIDATE VARIABLES -24
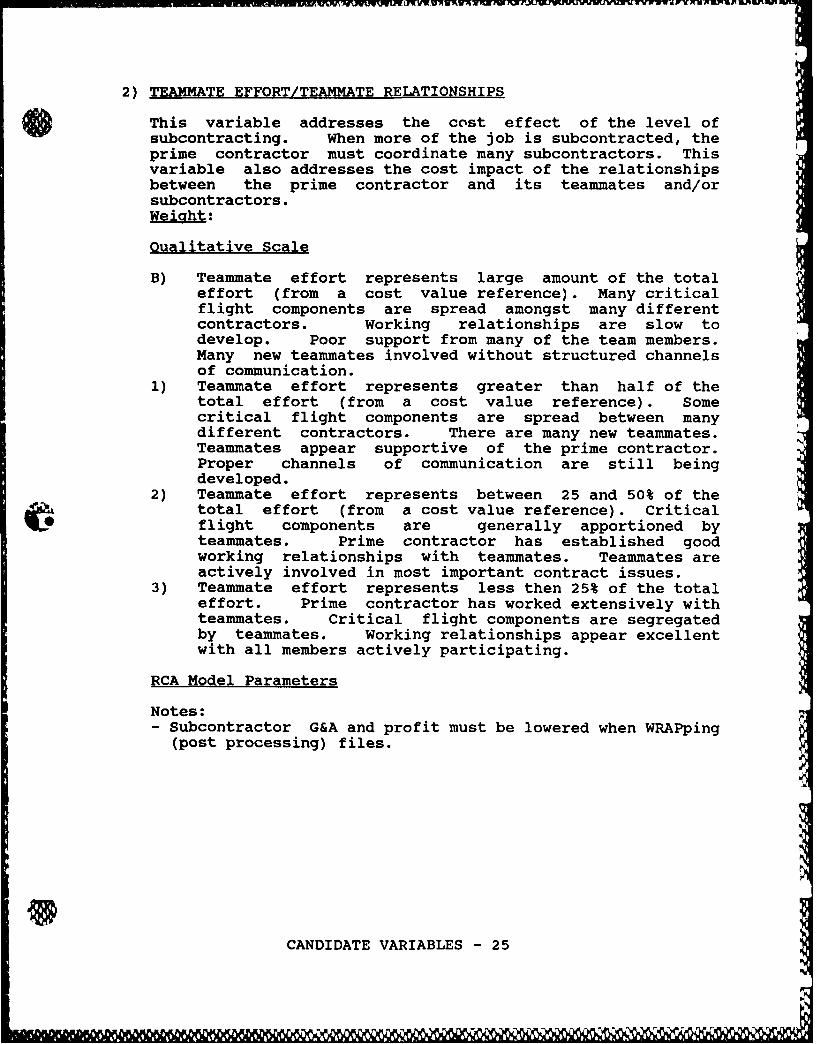
2) TEAMMATE EFFORT/TEAMMATE RELATIONSHIPS
This variable addresses the cost effect of the level ofsubcontracting. When more of the job is subcontracted, theprime contractor must coordinate many subcontractors. Thisvariable also addresses the cost impact of the relationshipsbetween the prime contractor and its teammates and/orsubcontractors.Weight:
Qualitative Scale
B) Teammate effort represents large amount of the totaleffort (from a cost value reference). Many criticalflight components are spread amongst many differentcontractors. Working relationships are slow todevelop. Poor support from many of the team members.Many new teammates involved without structured channelsof communication.
1) Teammate effort represents greater than half of thetotal effort (from a cost value reference). Somecritical flight components are spread between manydifferent contractors. There are many new teammates.Teammates appear supportive of the prime contractor.Proper channels of communication are still beingdeveloped.
2) Teammate effort represents between 25 and 50% of thetotal effort (from a cost value reference). Criticalflight components are generally apportioned byteammates. Prime contractor has established goodworking relationships with teammates. Teammates areactively involved in most important contract issues.
3) Teammate effort represents less then 25% of the totaleffort. Prime contractor has worked extensively withteammates. Critical flight components are segregatedby teammates. Working relationships appear excellentwith all members actively participating.
RCA Model Parameters
Notes:- Subcontractor G&A and profit must be lowered when WRAPping
(post processing) files.
CANDIDATE VARIABLES - 25
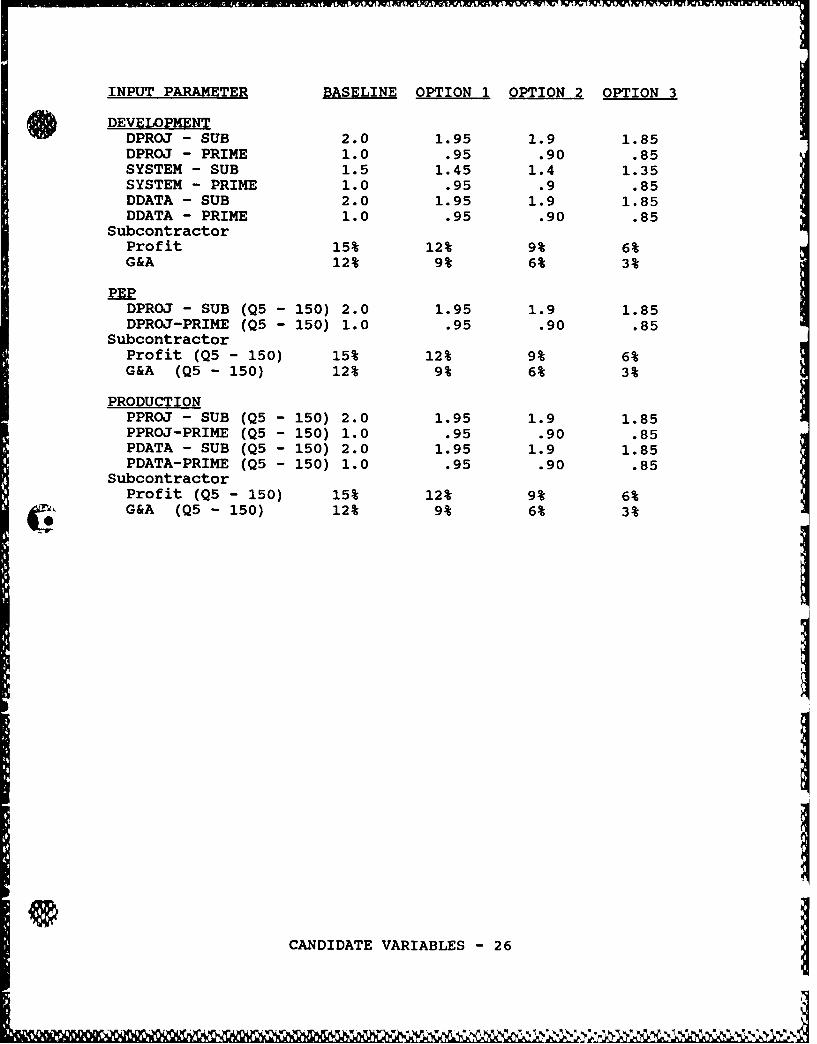
INPUT PARAMETER BASELINE OPTION 1 OPTION 2 OPTION 3
DEVELOPMENTDPROJ - SUB 2.0 1.95 1.9 1.85DPROJ - PRIME 1.0 .95 .90 .85SYSTEM - SUB 1.5 1.45 1.4 1.35SYSTEM - PRIME 1.0 .95 .9 .85DDATA - SUB 2.0 1.95 1.9 1.85DDATA - PRIME 1.0 .95 .90 .85
SubcontractorProfit 15% 12% 9% 6%G&A 12% 9% 6% 3%
PEPDPROJ - SUB (Q5 - 150) 2.0 1.95 1.9 1.85DPROJ-PRIME (Q5 - 150) 1.0 .95 .90 .85
SubcontractorProfit (Q5 - 150) 15% 12% 9% 6%G&A (Q5 - 150) 12% 9% 6% 3%
PRODUCTIONPPROJ - SUB (Q5 - 150) 2.0 1.95 1.9 1.85PPROJ-PRIME (Q5 - 150) 1.0 .95 .90 .85PDATA - SUB (Q5 - 150) 2.0 1.95 1.9 1.85PDATA-PRIME (Q5 - 150) 1.0 .95 .90 .85
SubcontractorProfit (Q5 - 150) 15% 12% 9% 6%
6M G&A (Q5 - 150) 12% 9% 6% 3%
CANDIDATE VARIABLES - 26

3) ENHANCING PRODUCTION TECHNIQUES DURING PRODUCTION
This cost variable addresses the cost impacts and associatedcost savings when incorporating production efficienttechnology improvements during the production segment of thecontract. It is generally expensive to incorporate changesduring the production cycle because of retooling, drawingmodifications, and other issues. However, there areinstances where the cost savings of certain activitiesoutweigh the cost of implementing them.Weight:
Oualitative Scale
B) No impact to production activities due to technologyimprovements. Technclogy improvements are notincorporated during the production segment.
1) Very few production technology improvementsincorporated during the production process. Most ofthese improvements are of limited economicconsequences; incorporating them is fairly inexpensive.
2) There are some significant technology upgrades to theproduction process integrated during the productioneffort. These upgrades provide some cost reductionimprovement in the production activities. Cost ofincorporating these changes versus the cost savingsrealized makes the upgrades attractive.
3) Incorporation of advanced technology into theproduction process. Use of highly specializedrobotics. Significant cost efficiencies are achievedfrom the introduction of this new technology. Cost ofimplementing the production system enhancements issignificantly outweighed by the savings.
RCA Model Parameters
Notes:- Some effects of this variable cause increase in cost while
others decrease cost.- Only Production parameters inputs are affected.
CANDIDATE VARIABLES -27
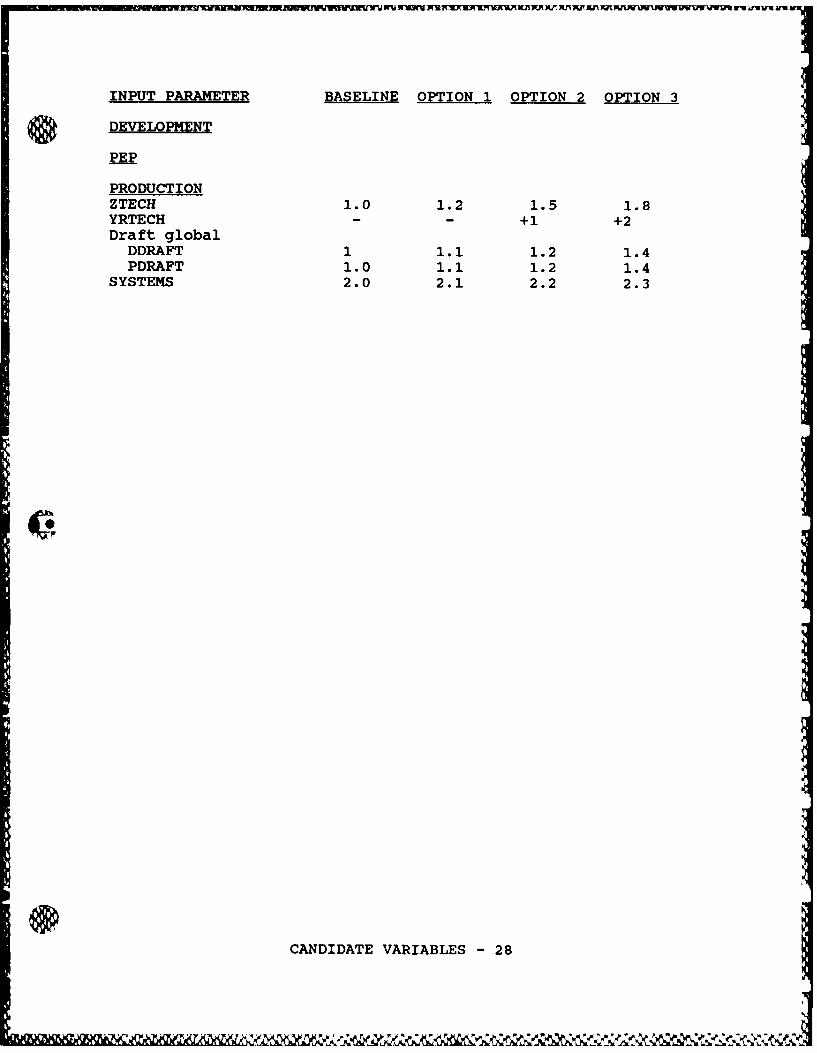
INPUT PARAMETER BASELINE OPTION 1 OPTION 2 OPTION 3
qDEVELOPMENTPEP
PRODUCTIONZTECH 1.0 1.2 1.5 1.8YRTECH - - +1 +2Draft global
DDRAFT 1 1.1 1.2 1.4PDRAFT 1.0 1.1 1.2 1.4
SYSTEMS 2.0 2.1 2.2 2.3
CANDIDATE VARIABLES - 28
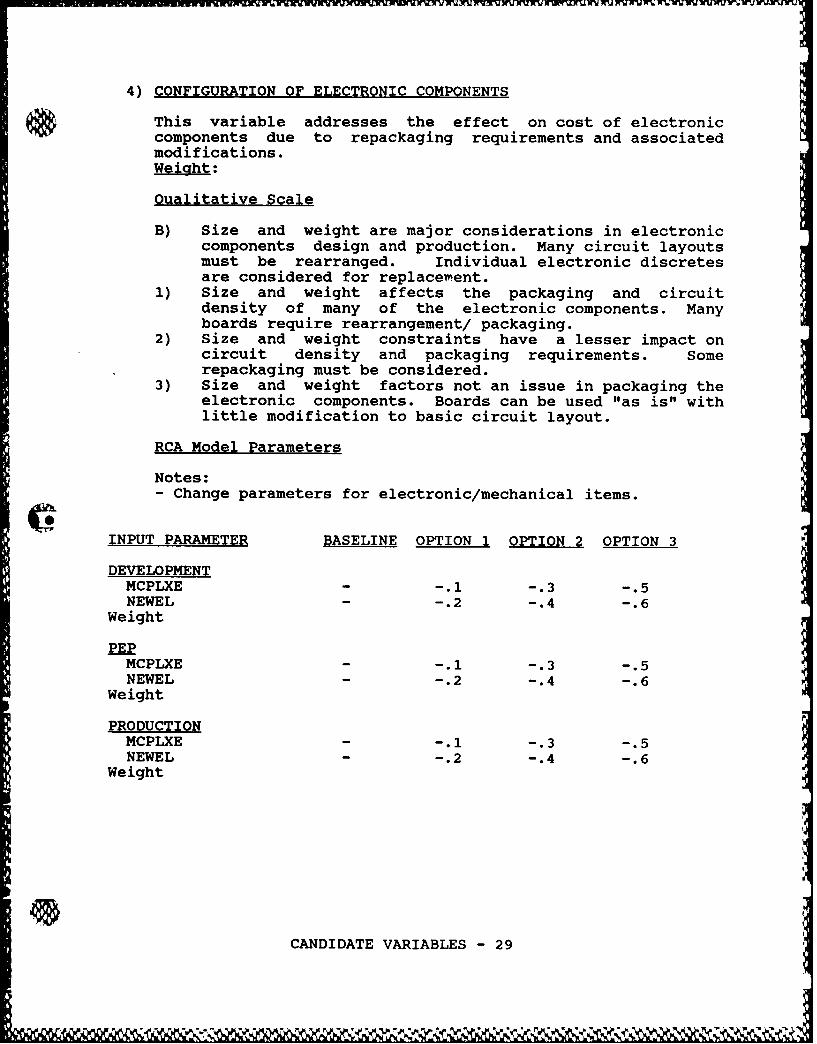
4) CONFIGURATION OF ELECTRONIC COMPONENTS
This variable addresses the effect on cost of electroniccomponents due to repackaging requirements and associatedmodifications.~Weight:
Oualitative Scale
B) Size and weight are major considerations in electroniccomponents design and production. Many circuit layoutsmust be rearranged. Individual electronic discretesare considered for replacerent.
1) Size and weight affects the packaging and circuitdensity of many of the electronic components. Manyboards require rearrangement/ packaging.
2) Size and weight constraints have a lesser impact oncircuit density and packaging requirements. Somerepackaging must be considered.
3) Size and weight factors not an issue in packaging theelectronic components. Boards can be used "as is" withlittle modification to basic circuit layout.
RCA Model Parameters
Notes:- Change parameters for electronic/mechanical items.
INPUT PARAMETER BASELINE OPTION 1 OPTION 2 OPTION 3
DEVELOPMENTMCPLXE - -. 1 -. 3 -. 5NEWEL - -. 2 -. 4 -. 6
Weight
PEPMCPLXE - -. 1 -. 3 -. 5NEWEL - -. 2 -. 4 -. 6
Weight
PRODUCTIONMCPLXE - -. 1 -. 3 -. 5NEWEL - -. 2 -. 4 -. 6
Weight
CANDIDATE VARIABLES - 29

DARPA - SPACE SYSTEMS COST STUDY
AUTOMATED DATABASE
USER'S MANUAL
DARPASS
(DARPA Space Systems model)
VERSION 1.0 FEBRUARY 1988
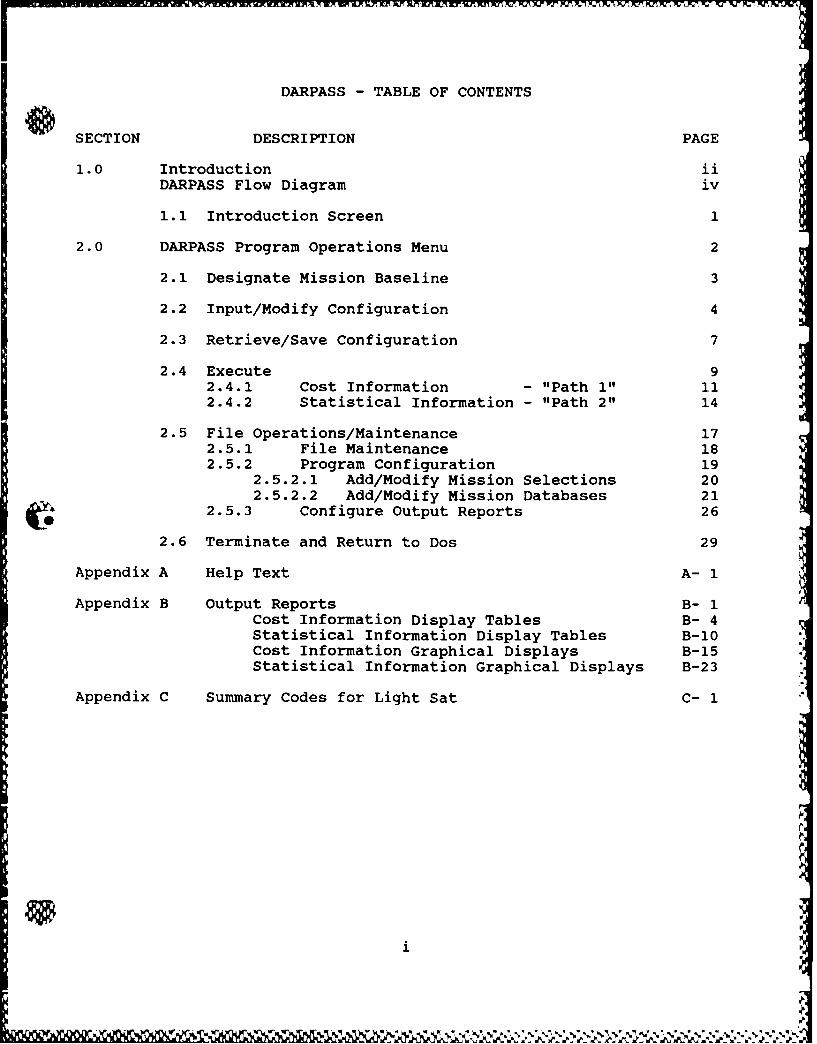
DARPASS - TABLE OF CONTENTS
SECTION DESCRIPTION PAGE
1.0 Introduction iiDARPASS Flow Diagram iv
1.1 Introduction Screen 1
2.0 DARPASS Program Operations Menu 2
2.1 Designate Mission Baseline 3
2.2 Input/Modify Configuration 4
2.3 Retrieve/Save Configuration 7
2.4 Execute 92.4.1 Cost Information - "Path 1" 112.4.2 Statistical Information - "Path 2" 14
2.5 File Operations/Maintenance 172.5.1 File Maintenance 182.5.2 Program Configuration 19
2.5.2.1 Add/Modify Mission Selections 202.5.2.2 Add/Modify Mission Databases 21
. 2.5.3 Configure Output Reports 26
2.6 Terminate and Return to Dos 29
Appendix A Help Text A- 1
Appendix B Output Reports B- 1Cost Information Display Tables B- 4Statistical Information Display Tables B-10Cost Information Graphical Displays B-15Statistical Information Graphical Displays B-23
Appendix C Summary Codes for Light Sat C- 1
i
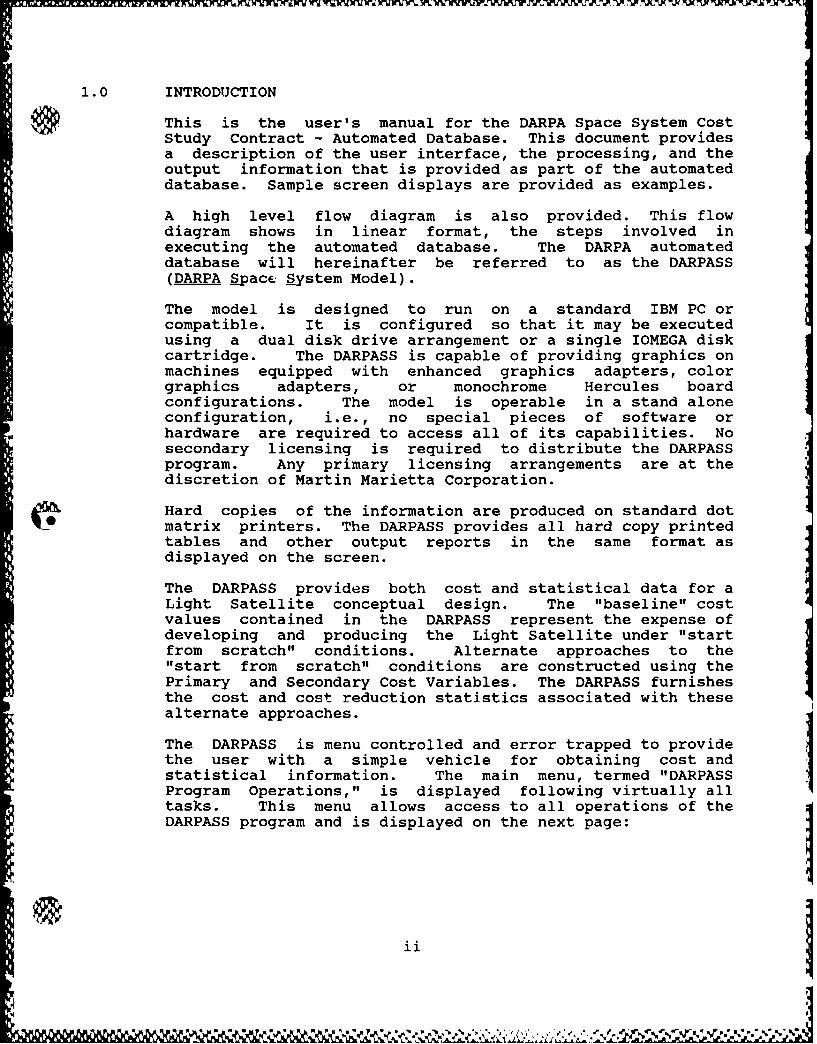
1.0 INTRODUCTION
This is the user's manual for the DARPA Space System CostStudy Contract - Automated Database. This document providesa description of the user interface, the processing, and theoutput information that is provided as part of the automateddatabase. Sample screen displays are provided as examples.
A high level flow diagram is also provided. This flowdiagram shows in linear format, the steps involved inexecuting the automated database. The DARPA automateddatabase will hereinafter be referred to as the DARPASS(DARPA Spacc System Model).
The model is designed to run on a standard IBM PC orcompatible. It is configured so that it may be executedusing a dual disk drive arrangement or a single IOMEGA diskcartridge. The DARPASS is capable of providing graphics onmachines equipped with enhanced graphics adapters, colorgraphics adapters, or monochrome Hercules boardconfigurations. The model is operable in a stand aloneconfiguration, i.e., no special pieces of software orhardware are required to access all of its capabilities. Nosecondary licensing is required to distribute the DARPASSprogram. Any primary licensing arrangements are at thediscretion of Martin Marietta Corporation.
Hard copies of the information are produced on standard dotmatrix printers. The DARPASS provides all hard copy printedtables and other output reports in the same format asdisplayed on the screen.
The DARPASS provides both cost and statistical data for aLight Satellite conceptual design. The "baseline" costvalues contained in the DARPASS represent the expense ofdeveloping and producing the Light Satellite under "startfrom scratch" conditions. Alternate approaches to the"start from scratch" conditions are constructed using thePrimary and Secondary Cost Variables. The DARPASS furnishesthe cost and cost reduction statistics associated with thesealternate approaches.
The DARPASS is menu controlled and error trapped to providethe user with a simple vehicle for obtaining cost andstatistical information. The main menu, termed "DARPASSProgram Operations," is displayed following virtually alltasks. This menu allows access to all operations of theDARPASS program and is displayed on the next page:
"ii

Space System Cost Study Program
DARPASS Program Operations
1 - Designate Mission Baseline2 - Input New Configuration3 - Modify Existing Configuration
4 - Retrieve Configuration5 - Save Configuration
6 - Execute7 - File Operations/Maintenance8 - Terminate & Return to DOS
The DARPASS program is described in detail in the User'sManual that follows. The reader should consult this guidebefore running the DARPASS. The reader should payparticular attention to the information regarding outputreports contained in Appendix B of the manual. Without thisbackground, the user may misinterpret some of the outputinformation.
Questions about this document may be directed to eitherCraig Mogensen (303-971-5107) or Doug Dilts (303-971-5104).
~iii
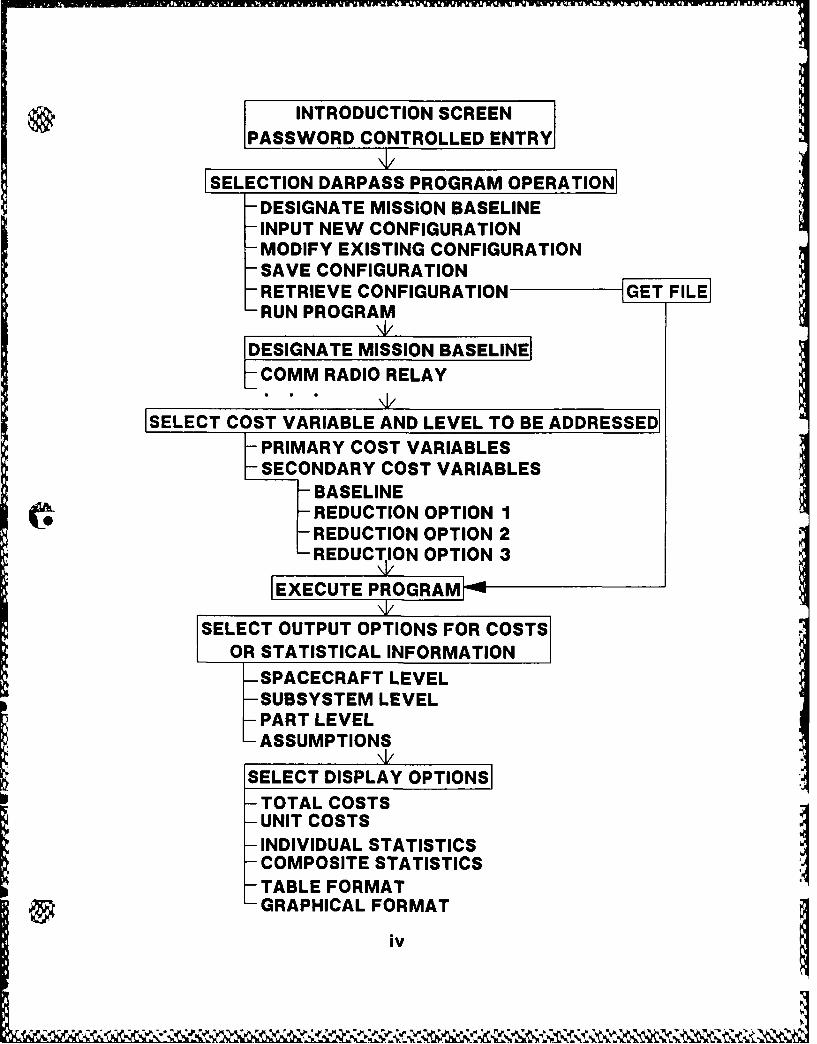
[ INTRODUCTION SCREENIPASS WORD CONTROLLED ENTRY
SELECTION DARPASS PROGRAM OPERATION I
-DESIGNATE MISSION BASELINE-INPUT NEW CONFIGURATION-MODIFY EXISTING CONFIGURATION
SAVE CONFIGURATIONRETRIEVE CONFIGURATION GET FIRUN PROGRAM
DESIGNATE MISSION BASELINECOMM RADIO RELAY
SELECT COST VARIABLE AND LEVEL TO BE ADDRESSEDPRIMARY COST VARIABLESSECONDARY COST VARIABLES
BASELINE-REDUCTION OPTION 1
REDUCTION OPTION 2REDUCTION OPTION 3
EXECUTE PROGRAM I
SELECT OUTPUT OPTIONS FOR COSTSOR STATISTICAL INFORMATION
SPACECRAFT LEVELSUBSYSTEM LEVELPART LEVELASSUMPTIONS
SELECT DISPLAY OPTIONS]-TOTAL COSTS- UNIT COSTS-INDIVIDUAL STATISTICS-COMPOSITE STATISTICS
TABLE FORMAT-GRAPHICAL FORMAT
,Iiv
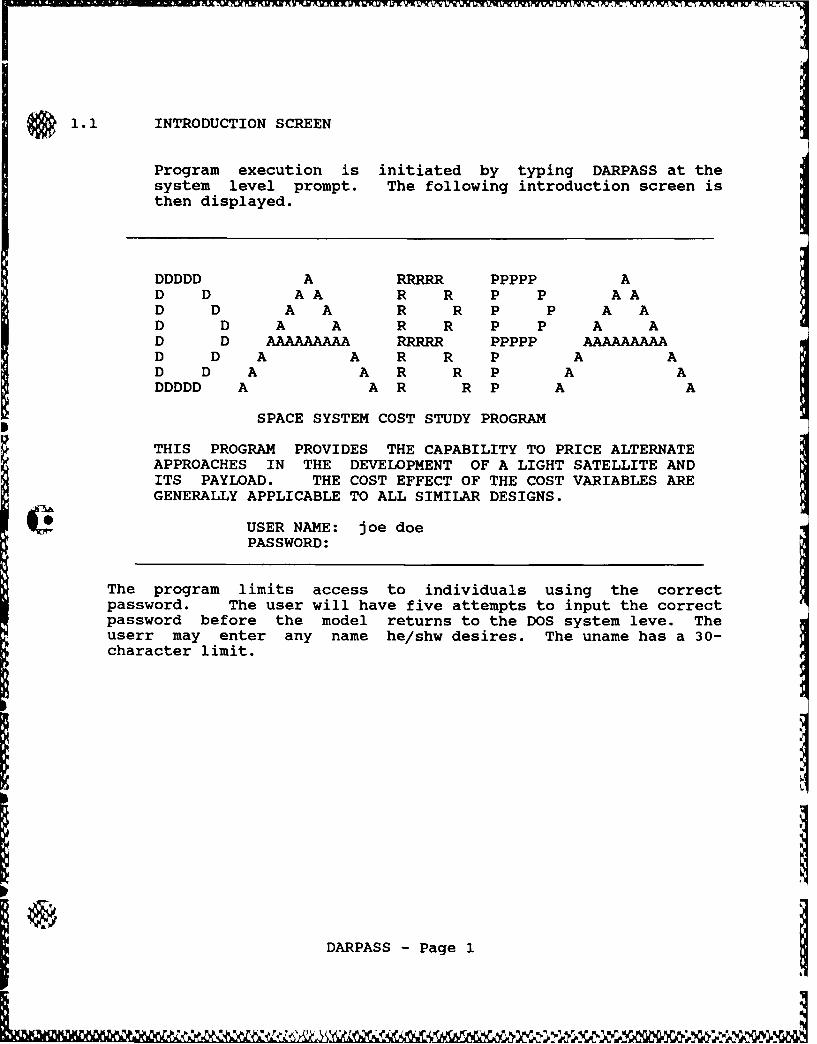
, 1.1 INTRODUCTION SCREEN
Program execution is initiated by typing DARPASS at thesystem level prompt. The following introduction screen isthen displayed.
DDDDD A RRRRR PPPPP AD D AA R R P P AAD D A A R R P P A AD D A A R R P P A AD D AAAAAAAAA RRRRR ppppP AAAAAAAAAD D A A R R P A AD D A A R R P A ADDDDD A A R R P A A
SPACE SYSTEM COST STUDY PROGRAM
THIS PROGRAM PROVIDES THE CAPABILITY TO PRICE ALTERNATEAPPROACHES IN THE DEVELOPMENT OF A LIGHT SATELLITE ANDITS PAYLOAD. THE COST EFFECT OF THE COST VARIABLES AREGENERALLY APPLICABLE TO ALL SIMILAR DESIGNS.
USER NAME: joe doePASSWORD:
The program limits access to individuals using the correctpassword. The user will have five attempts to input the correctpassword before the model returns to the DOS system leve. Theuserr may enter any name he/shw desires. The uname has a 30-character limit.
DARPASS - Page 1
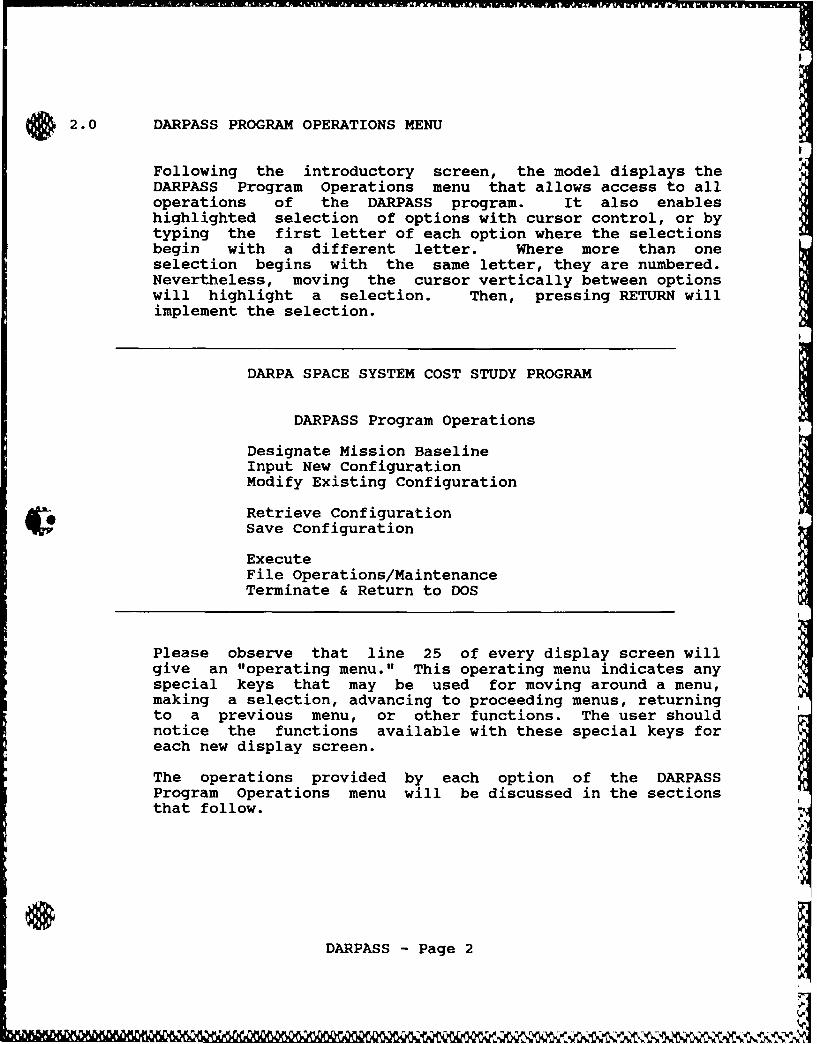
2.0 DARPASS PROGRAM OPERATIONS MENU
Following the introductory screen, the model displays theDARPASS Program Operations menu that allows access to alloperations of the DARPASS program. It also enableshighlighted selection of options with cursor control, or bytyping the first letter of each option where the selectionsbegin with a different letter. Where more than oneselection begins with the same letter, they are numbered.Nevertheless, moving the cursor vertically between optionswill highlight a selection. Then, pressing RETURN willimplement the selection.
DARPA SPACE SYSTEM COST STUDY PROGRAM
DARPASS Program Operations
Designate Mission BaselineInput New ConfigurationModify Existing Configuration
Retrieve ConfigurationSave Configuration
ExecuteFile Operations/MaintenanceTerminate & Return to DOS
Please observe that line 25 of every display screen willgive an "operating menu." This operating menu indicates anyspecial keys that may be used for moving around a menu,making a selection, advancing to proceeding menus, returningto a previous menu, or other functions. The user shouldnotice the functions available with these special keys foreach new display screen.
The operations provided by each option of the DARPASSProgram Operations menu will be discussed in the sectionsthat follow.
DARPASS - Page 2
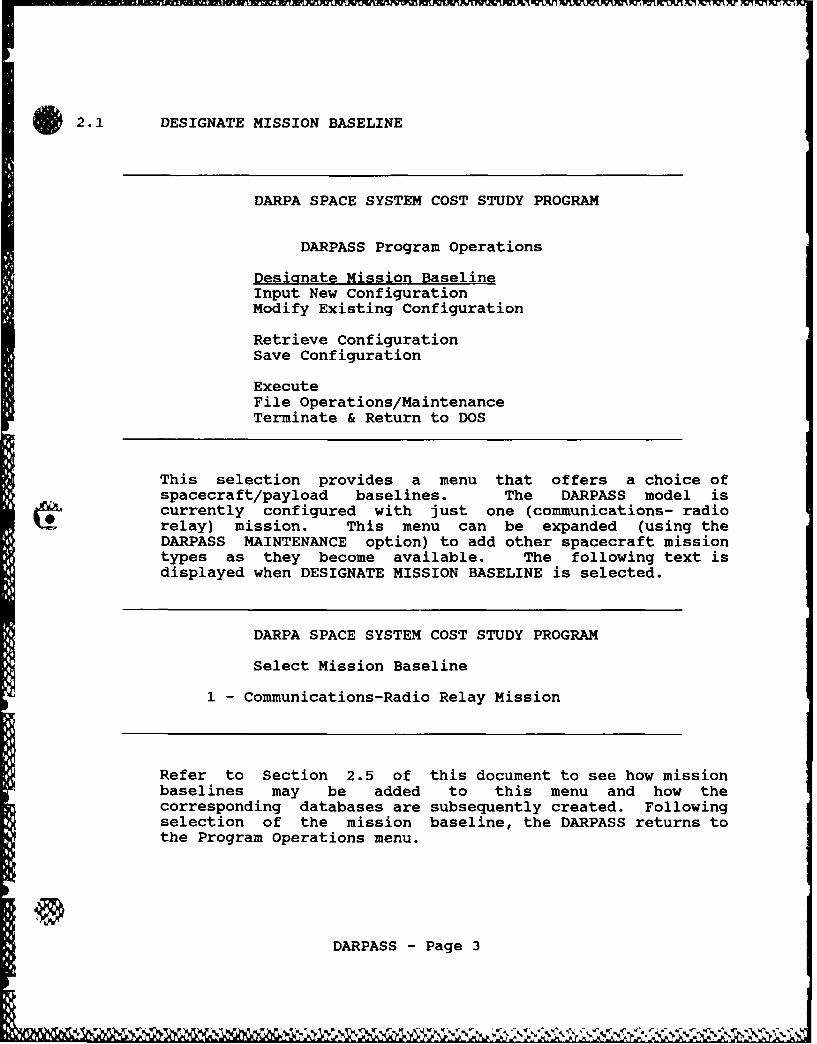
2.1 DESIGNATE MISSION BASELINE
DARPA SPACE SYSTEM COST STUDY PROGRAM
DARPASS Program Operations
Designate Mission BaselineInput New ConfigurationModify Existing Configuration
Retrieve ConfigurationSave Configuration
ExecuteFile Operations/MaintenanceTerminate & Return to DOS
This selection provides a menu that offers a choice ofspacecraft/payload baselines. The DARPASS model iscurrently configured with just one (communications- radiorelay) mission. This menu can be expanded (using theDARPASS MAINTENANCE option) to add other spacecraft missiontypes as they become available. The following text isdisplayed when DESIGNATE MISSION BASELINE is selected.
DARPA SPACE SYSTEM COST STUDY PROGRAM
Select Mission Baseline
1 - Communications-Radio Relay Mission
Refer to Section 2.5 of this document to see how missionbaselines may be added to this menu and how thecorresponding databases are subsequently created. Followingselection of the mission baseline, the DARPASS returns tothe Program Operations menu.
DARPASS - Page 3
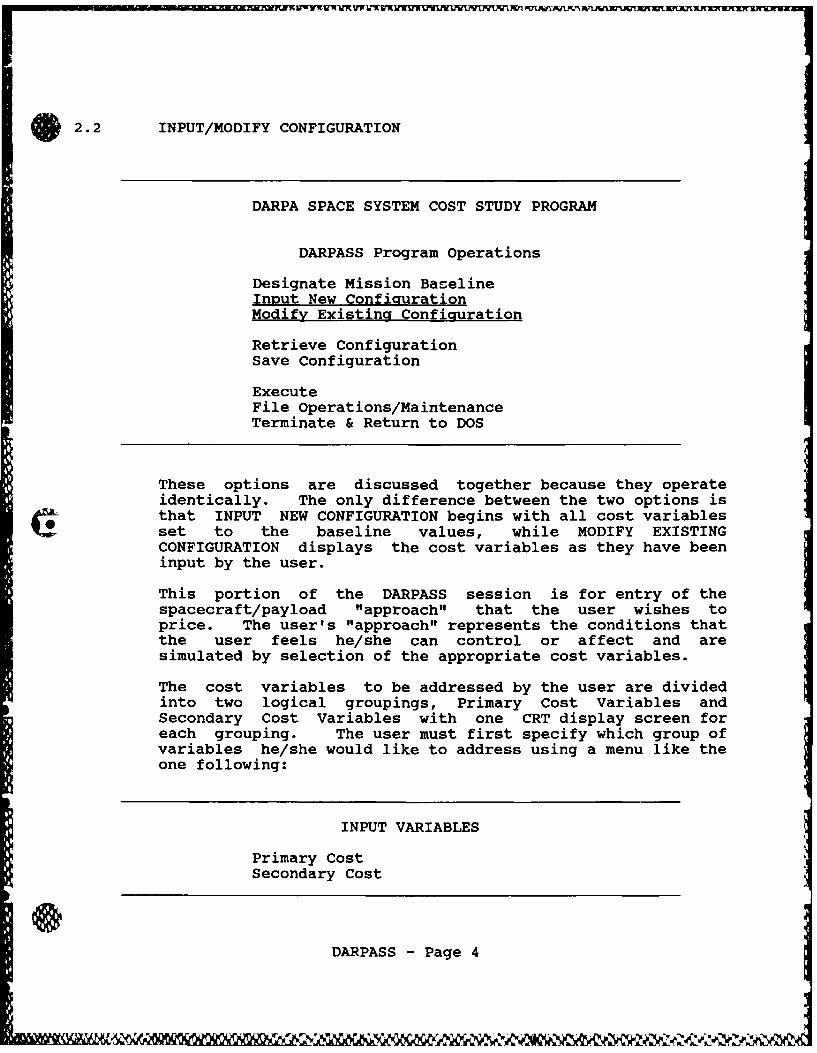
2.2 INPUT/MODIFY CONFIGURATION
DARPA SPACE SYSTEM COST STUDY PROGRAM
DARPASS Program Operations
Designate Mission BaselineInput New ConfigurationModify Existing Configuration
Retrieve ConfigurationSave Configuration
ExecuteFile Operations/MaintenanceTerminate & Return to DOS
These options are discussed together because they operateidentically. The only difference between the two options isthat INPUT NEW CONFIGURATION begins with all cost variablesset to the baseline values, while MODIFY EXISTINGCONFIGURATION displays the cost variables as they have beeninput by the user.
This portion of the DARPASS session is for entry of thespacecraft/payload "approach" that the user wishes toprice. The user's "approach" represents the conditions thatthe user feels he/she can control or affect and aresimulated by selection of the appropriate cost variables.
The cost variables to be addressed by the user are dividedinto two logical groupings, Primary Cost Variables andSecondary Cost Variables with one CRT display screen foreach grouping. The user must first specify which group ofvariables he/she would like to address using a menu like theone following:
INPUT VARIABLES
Primary CostSecondary Cost
DARPASS - Page 4
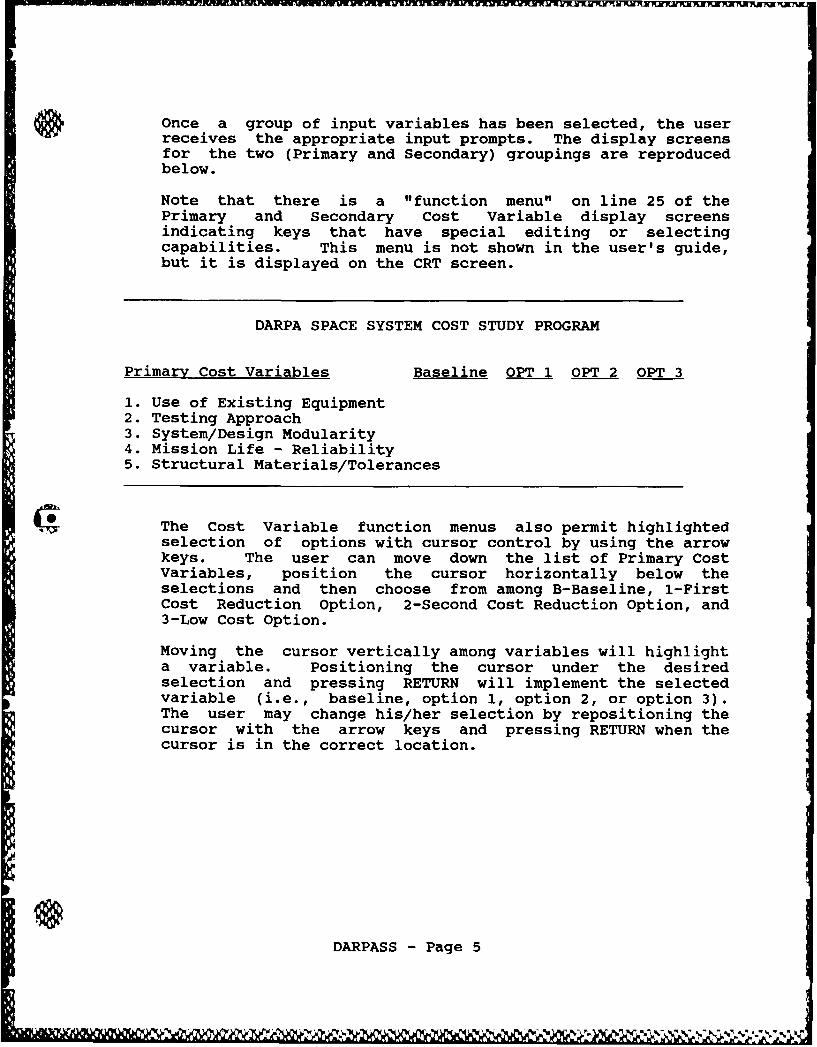
once a group of input variables has been selected, the userreceives the appropriate input prompts. The display screensfor the two (Primary and Secondary) groupings are reproducedbelow.
Note that there is a "function menu" on line 25 of thePrimary and Secondary Cost Variable display screensindicating keys that have special editing or selectingcapabilities. This menu is not shown in the user's guide,but it is displayed on the CRT screen.
DARPA SPACE SYSTEM COST STUDY PROGRAM
Primary Cost Variables Baseline OPT 1 OPT 2 OPT 3
1. Use of Existing Equipment2. Testing Approach3. System/Design Modularity4. Mission Life - Reliability5. Structural Materials/Tolerances
41 The Cost Variable function menus also permit highlightedselection of options with cursor control by using the arrowkeys. The user can move down the list of Primary CostVariables, position the cursor horizontally below theselections and then choose from among B-Baseline, 1-FirstCost Reduction Option, 2-Second Cost Reduction Option, and3-Low Cost Option.
Moving the cursor vertically among variables will highlighta variable. Positioning the cursor under the desiredselection and pressing RETURN will implement the selectedvariable (i.e., baseline, option 1, option 2, or option 3).The user may change his/her selection by repositioning thecursor with the arrow keys and pressing RETURN when thecursor is in the correct location.
DARPASS - Page 5
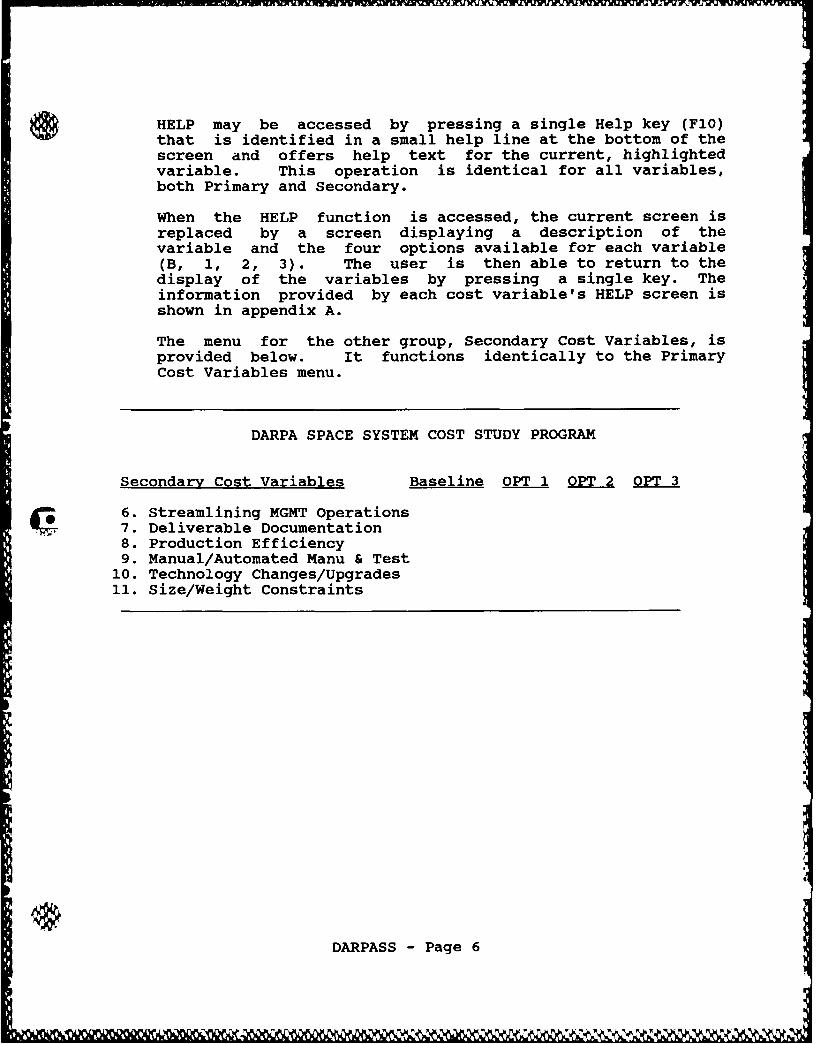
HELP may be accessed by pressing a single Help key (F10)that is identified in a small help line at the bottom of thescreen and offers help text for the current, highlightedvariable. This operation is identical for all variables,both Primary and Secondary.
When the HELP function is accessed, the current screen isreplaced by a screen displaying a description of thevariable and the four options available for each variable(B, 1, 2, 3). The user is then able to return to thedisplay of the variables by pressing a single key. Theinformation provided by each cost variable's HELP screen isshown in appendix A.
The menu for the other group, Secondary Cost Variables, isprovided below. It functions identically to the PrimaryCost Variables menu.
DARPA SPACE SYSTEM COST STUDY PROGRAM
Secondary Cost Variables Baseline OPT 1 OPT 2 OPT 36. Streamlining MGMT Operations7. Deliverable Documentation
8. Production Efficiency9. Manual/Automated Manu & Test10. Technology Changes/Upgrades11. Size/Weight Constraints
DARPASS - Page 6

O 2.3 RETRIEVE/SAVE CONFIGURATION
DARPA SPACE SYSTEM COST STUDY PROGRAM
DARPASS Program Operations
Designate Mission BaselineInput New ConfigurationModify Existing Configuration
Retrieve Configurationsave Configuration
ExecuteFile Operations/MaintenanceTerminate & Return to DOS
These options let the user save, and later retrieve, aconfiguration of cost variables. "Configuration" representsthe Primary and Secondary cost variables that were selectedduring data input (Section 2.2).
SAVE CONFIGURATION saves the selected variable ratings i.e.,baseline, option 1, option 2, etc., so that the costsassociated with a specific approach to developing thehardware can be repeated. Following is an example of themenu displayed when the user decides to save a file. Fileretrieval uses the same method but in the reverse.
DARPASS - Page 7
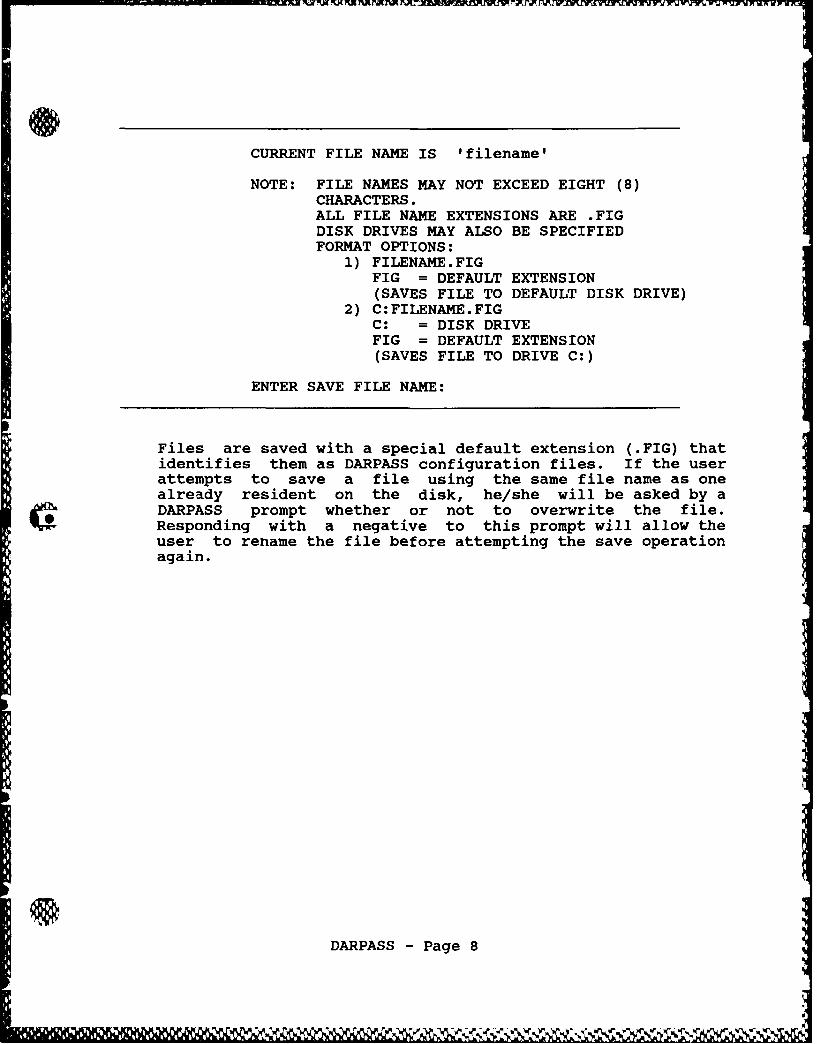
CURRENT FILE NAME IS 'filename'
NOTE: FILE NAMES MAY NOT EXCEED EIGHT (8)CHARACTERS.ALL FILE NAME EXTENSIONS ARE .FIGDISK DRIVES MAY ALSO BE SPECIFIEDFORMAT OPTIONS:
1) FILENAME.FIGFIG = DEFAULT EXTENSION(SAVES FILE TO DEFAULT DISK DRIVE)
2) C:FILENAME.FIGC: = DISK DRIVEFIG = DEFAULT EXTENSION(SAVES FILE TO DRIVE C:)
ENTER SAVE FILE NAME:
Files are saved with a special default extension (.FIG) thatidentifies them as DARPASS configuration files. If the userattempts to save a file using the same file name as onealready resident on the disk, he/she will be asked by a
Am DARPASS prompt whether or not to overwrite the file.Responding with a negative to this prompt will allow theuser to rename the file before attempting the save operationagain.
DARPASS - Page 8
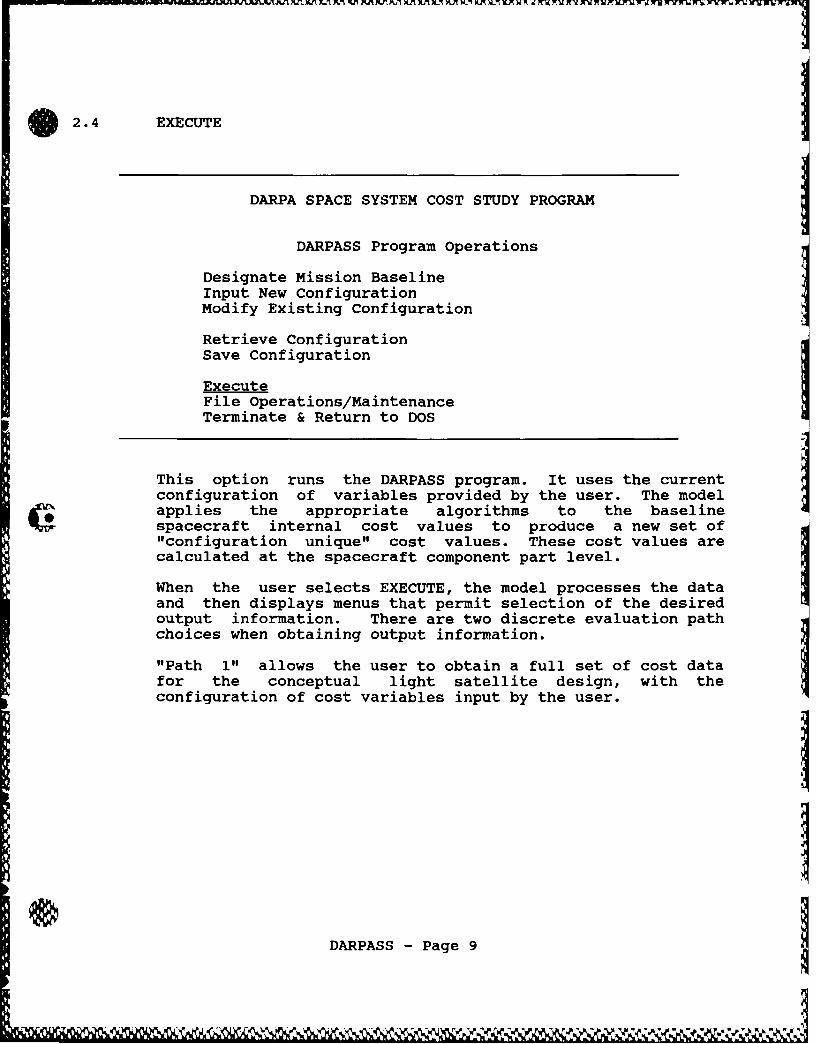
2.4 EXECUTE
DARPA SPACE SYSTEM COST STUDY PROGRAM
DARPASS Program Operations
Designate Mission BaselineInput New ConfigurationModify Existing Configuration
Retrieve ConfigurationSave Configuration
ExecuteFile Operations/MaintenanceTerminate & Return to DOS
This option runs the DARPASS program. It uses the currentconfiguration of variables provided by the user. The modelapplies the appropriate algorithms to the baselinespacecraft internal cost values to produce a new set of"configuration unique" cost values. These cost values arecalculated at the spacecraft component part level.
When the user selects EXECUTE, the model processes the dataand then displays menus that permit selection of the desiredoutput information. There are two discrete evaluation pathchoices when obtaining output information.
"Path 1" allows the user to obtain a full set of cost datafor the conceptual light satellite design, with theconfiguration of cost variables input by the user.
DARPASS - Page 9
9.a
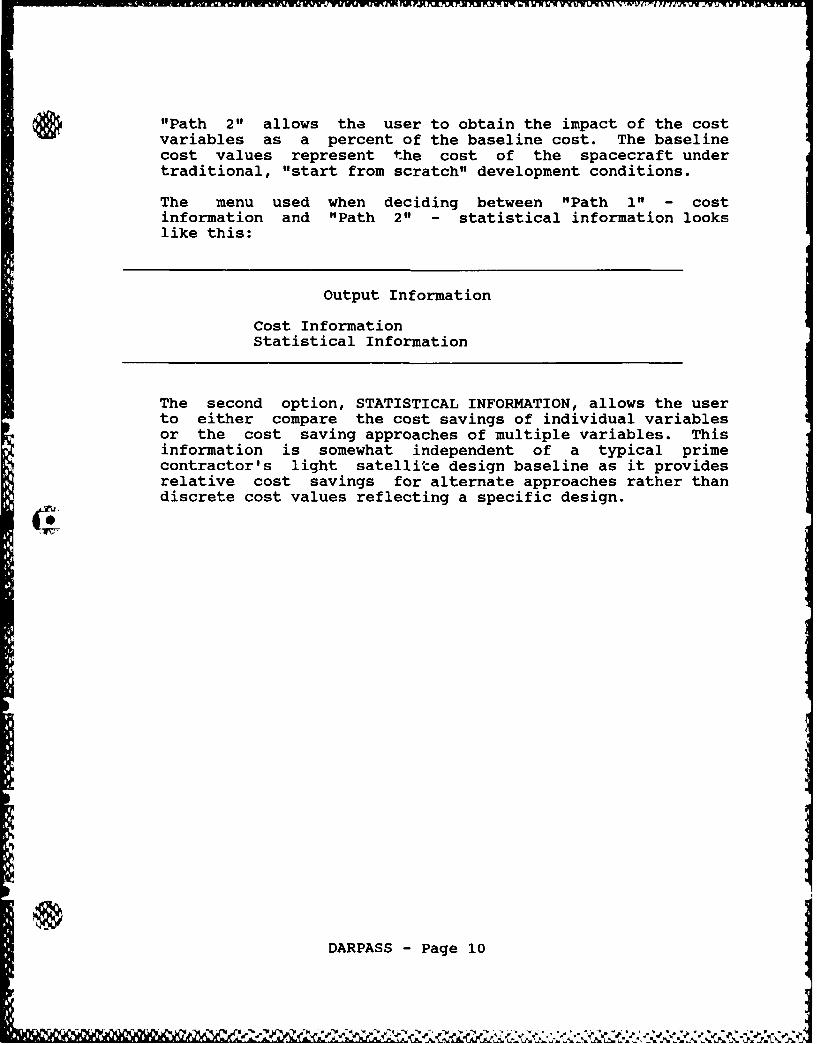
"Path 2" allows the user to obtain the impact of the costvariables as a percent of the baseline cost. The baselinecost values represent the cost of the spacecraft undertraditional, "start from scratch" development conditions.
The menu used when deciding between "Path 1" - costinformation and "Path 2" - statistical information lookslike this:
Output Information
Cost InformationStatistical Information
The second option, STATISTICAL INFORMATION, allows the userto either compare the cost savings of individual variablesor the cost saving approaches of multiple variables. Thisinformation is somewhat independent of a typical primecontractor's light satellite design baseline as it providesrelative cost savings for alternate approaches rather thandiscrete cost values reflecting a specific design.
DARPASS - Page 10
9 ~*~

2.4.1 COST INFORMATION - "PATH 1"
These menus allow the selection of: the level of cost data,the phase of development, the type of cost values, the typeof displays and the mode of display (CRT screen orprinter). The output menus for cost information are asfollows:
Cost Information Display Selections
Data Level
1 - Spacecraft Totals2 - Subsystem Level3 - Component Parts4 - Totals Only
Phase of Development
1 - Development Phase2 - PEP Phase3 - Production Phase4 - Totals Only
Cost Value
Total CostUnit CostCost Savings
Display Format
TablesLine GraphBar Chart
DARPASS - Page 11
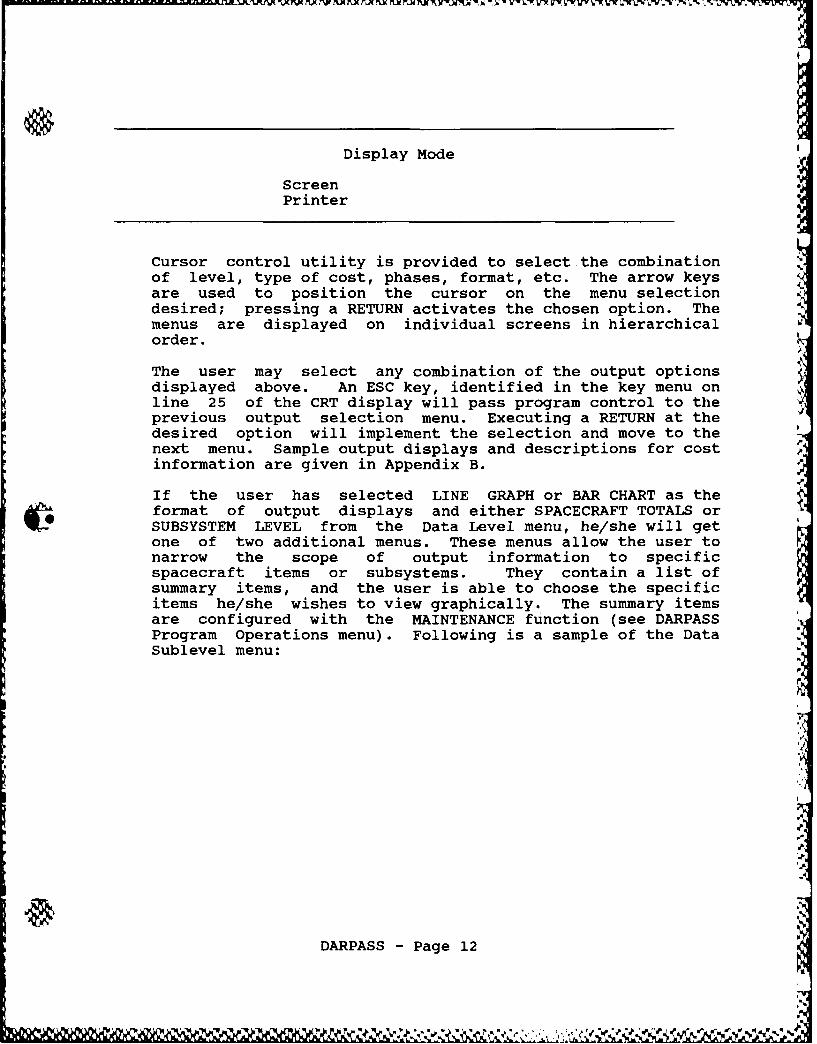
Display Mode
ScreenPrinter
Cursor control utility is provided to select the combinationof level, type of cost, phases, format, etc. The arrow keysare used to position the cursor on the menu selectiondesired; pressing a RETURN activates the chosen option. Themenus are displayed on individual screens in hierarchicalorder.
The user may select any combination of the output optionsdisplayed above. An ESC key, identified in the key menu online 25 of the CRT display will pass program control to theprevious output selection menu. Executing a RETURN at thedesired option will implement the selection and move to thenext menu. Sample output displays and descriptions for costinformation are given in Appendix B.
If the user has selected LINE GRAPH or BAR CHART as theAformat of output displays and either SPACECRAFT TOTALS or
SUBSYSTEM LEVEL from the Data Level menu, he/she will getone of two additional menus. These menus allow the user tonarrow the scope of output information to specificspacecraft items or subsystems. They contain a list ofsummary items, and the user is able to choose the specificitems he/she wishes to view graphically. The summary itemsare configured with the MAINTENANCE function (see DARPASSProgram Operations menu). Following is a sample of the DataSublevel menu:
|P
iY
DARPASS - Page 12
iI
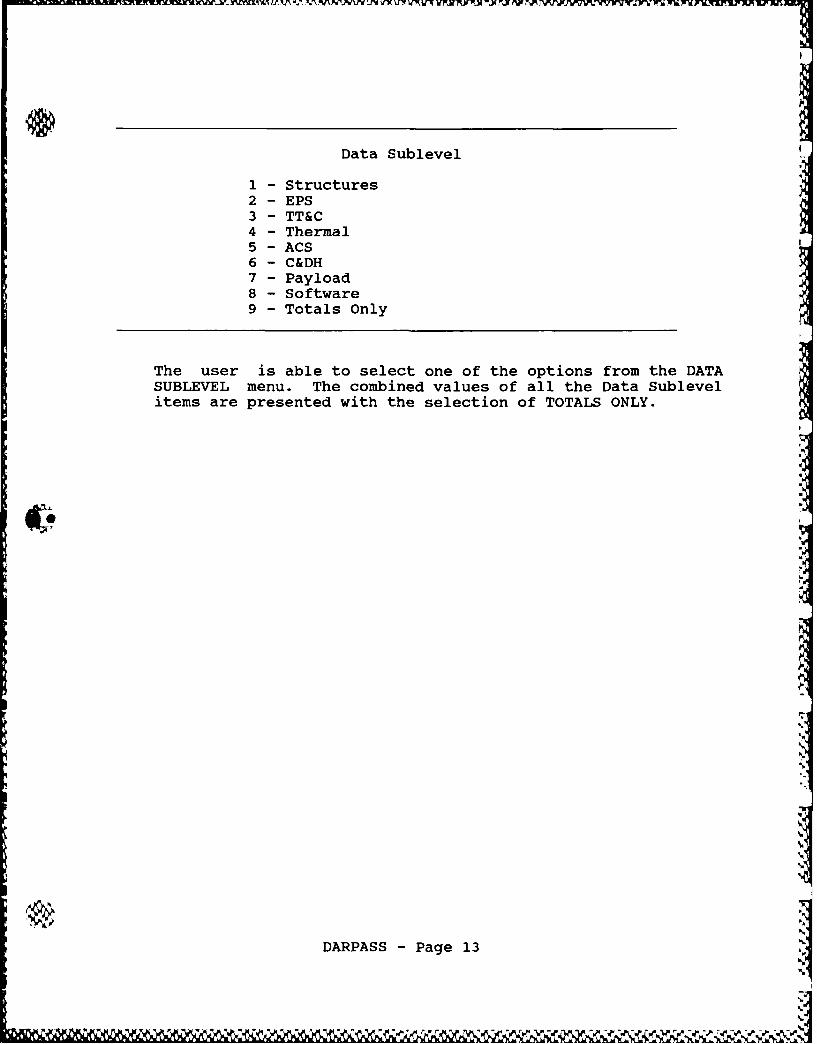
Data Sublevel
1 - Structures2 - EPS3 - TT&C4 - Thermal5 - ACS6 - C&DH7 - Payload8 - Software9 - Totals Only
The user is able to select one of the options from the DATASUBLEVEL menu. The combined values of all the Data Sublevelitems are presented with the selection of TOTALS ONLY.
DARPASS -Page 13
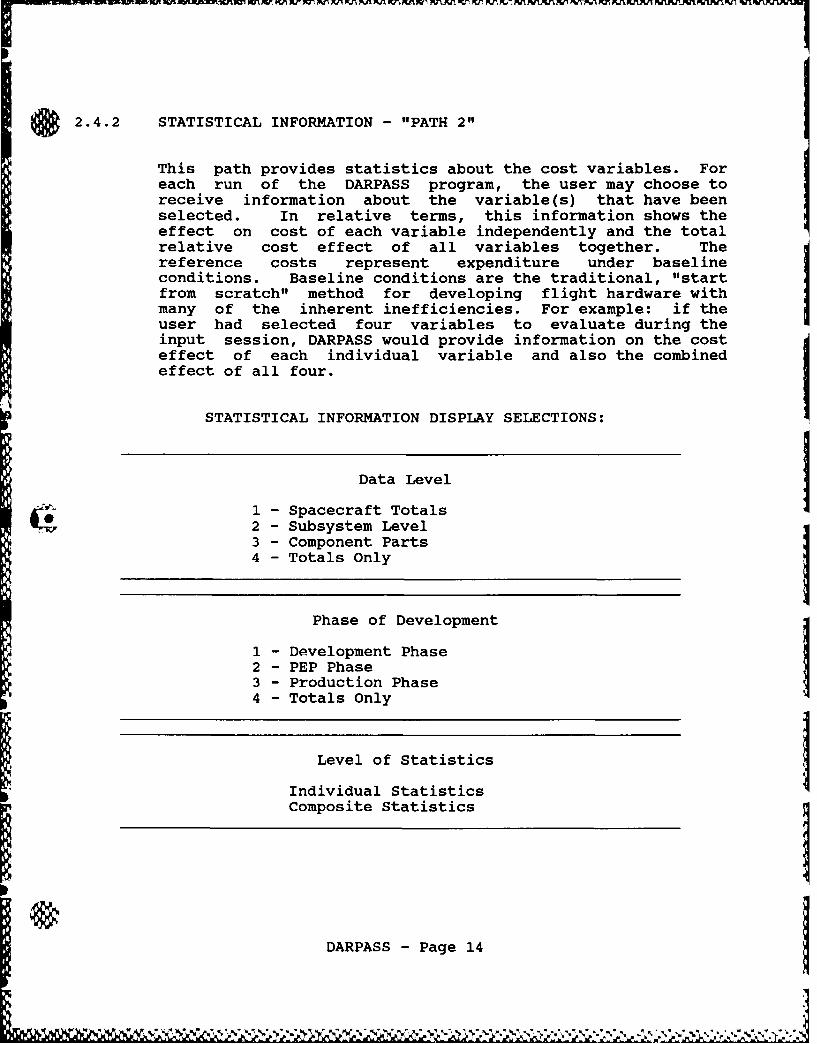
2.4.2 STATISTICAL INFORMATION - "PATH 2"
This path provides statistics about the cost variables. Foreach run of the DARPASS program, the user may choose toreceive information about the variable(s) that have beenselected. In relative terms, this information shows theeffect on cost of each variable independently and the totalrelative cost effect of all variables together. Thereference costs represent expenditure under baselineconditions. Baseline conditions are the traditional, "startfrom scratch" method for developing flight hardware withmany of the inherent inefficiencies. For example: if theuser had selected four variables to evaluate during theinput session, DARPASS would provide information on the costeffect of each individual variable and also the combinedeffect of all four.
STATISTICAL INFORMATION DISPLAY SELECTIONS:
Data Level
1 - Spacecraft Totals2 - Subsystem Level3 - Component Parts4 - Totals Only
Phase of Development
1 - Development Phase2 - PEP Phase3 - Production Phase4 - Totals Only
Level of Statistics
Individual StatisticsComposite Statistics
DARPASS - Page 14
.!-
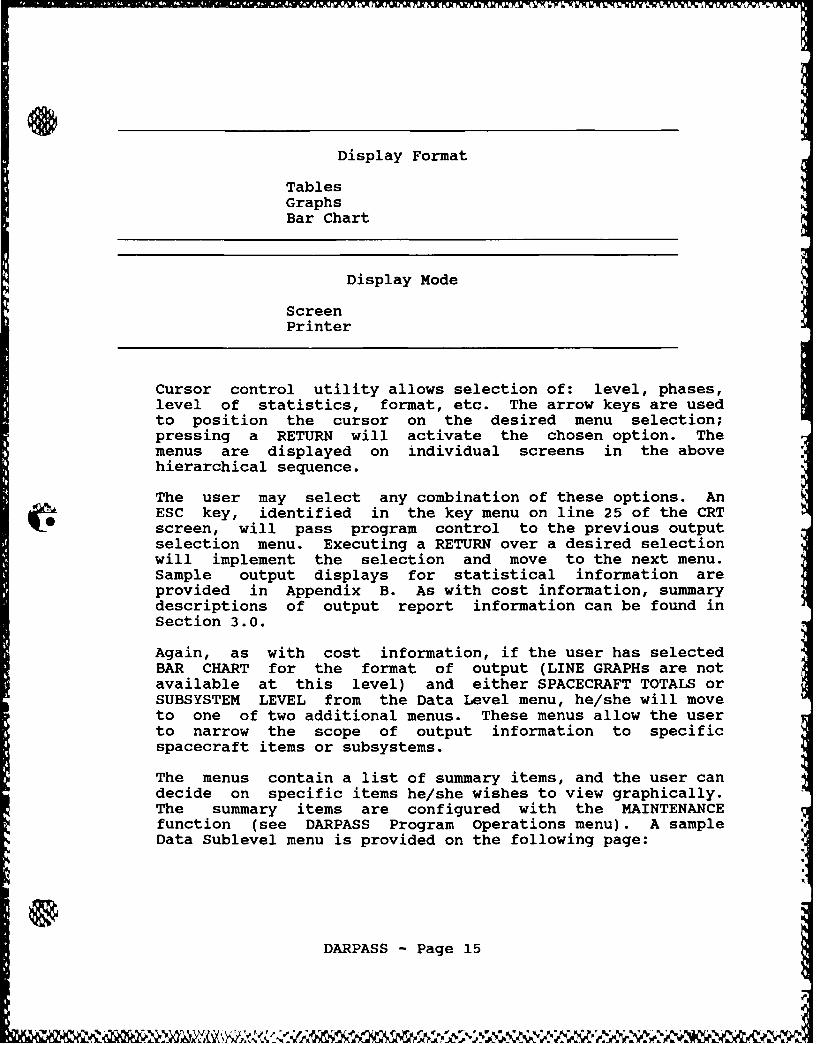
Display Format
TablesGraphsBar Chart
Display Mode
ScreenPrinter
Cursor control utility allows selection of: level, phases,level of statistics, format, etc. The arrow keys are usedto position the cursor on the desired menu selection;pressing a RETURN will activate the chosen option. Themenus are displayed on individual screens in the abovehierarchical sequence.
The user may select any combination of these options. AnESC key, identified in the key menu on line 25 of the CRTscreen, will pass program control to the previous outputselection menu. Executing a RETURN over a desired selectionwill implement the selection and move to the next menu.Sample output displays for statistical information areprovided in Appendix B. As with cost information, summarydescriptions of output report information can be found inSection 3.0.
Again, as with cost information, if the user has selectedBAR CHART for the format of output (LINE GRAPHs are notavailable at this level) and either SPACECRAFT TOTALS orSUBSYSTEM LEVEL from the Data Level menu, he/she will moveto one of two additional menus. These menus allow the userto narrow the scope of output information to specificspacecraft items or subsystems.
The menus contain a list of summary items, and the user candecide on specific items he/she wishes to view graphically.The summary items are configured with the MAINTENANCEfunction (see DARPASS Program Operations menu). A sampleData Sublevel menu is provided on the following page:
DARPASS - Page 15

Data Sublevel
1 - Analysis2 - Comm Payload3 - Electronics4 - Structures5 - Assembly/Integration6 - Test7 - Totals Only
The user is able to select one of the options from the DATASUBLEVEL menu. The combined values of all Data Sublevelitems are represented through the selection of TOTALS ONLY.
The user must specify the production quantity to graphstatistical information. This "quantity" selection is madeafter the DATA SUBLEVEL menu.
Production Quantity
1 - Quantity 52 - Quantity 253 - Quantity 504 - Quantity 1005 - Quantity 150
After the desired output information has been displayed orprinted, the program will pass control back to the OUTPUTINFORMATION menu. At this time the user may request newoutput information or return to the Program Operations menuby pressing the ESC key.
DARPASS - Page 16

2.5 FILE OPERATIONS/MAINTENANCE
DARPA SPACE SYSTEM COST STUDY PROGRAM
DARPASS Program Operations
Designate Mission BaselineInput New ConfigurationModify Existing Configuration
Retrieve ConfigurationSave Configuration
ExecuteFile Operations/MaintenanceTerminate & Return to DOS
This option provides two distinct functions: the firstfunction performs maintenance on files, and the secondprovides the capability to configure the program and theoutput reports. Entry is gained into the desired functionby selecting one of the options from this menu.
Maintenance Functions
File MaintenanceProgram Configuration
-
DARPASS - Page 17
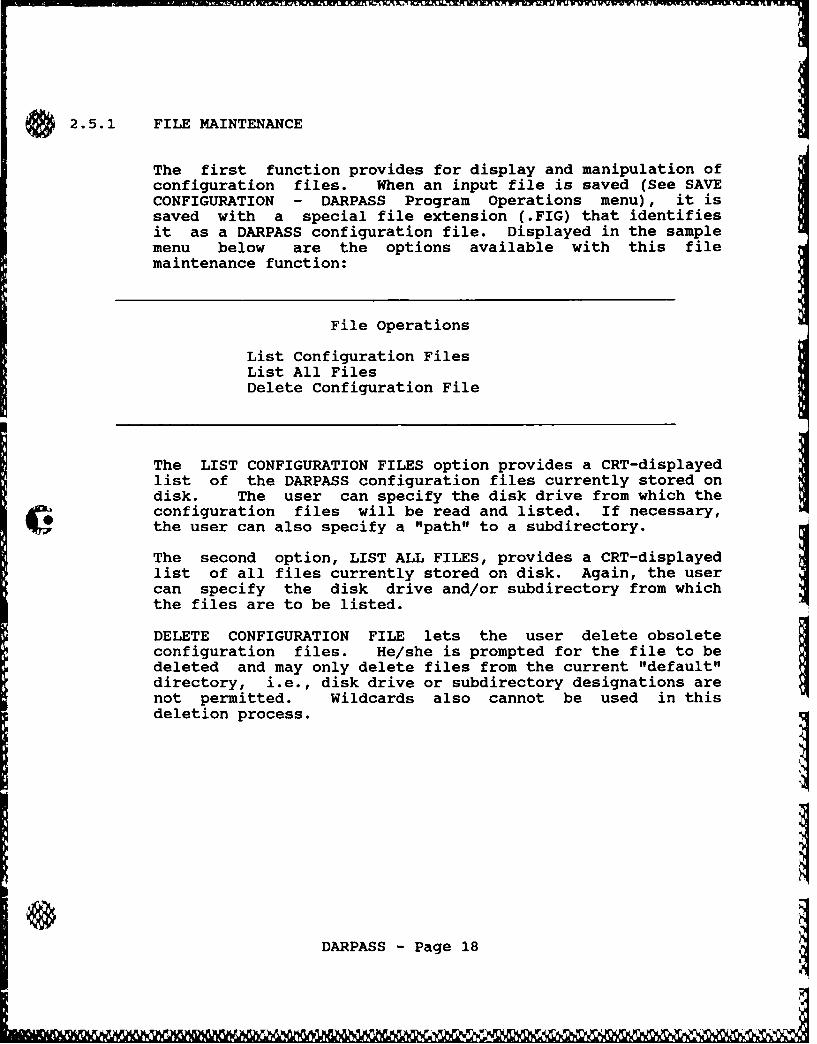
2.5.1 FILE MAINTENANCE
The first function provides for display and manipulation ofconfiguration files. When an input file is saved (See SAVECONFIGURATION - DARPASS Program Operations menu), it issaved with a special file extension (.FIG) that identifiesit as a DARPASS configuration file. Displayed in the samplemenu below are the options available with this filemaintenance function:
File Operations
List Configuration FilesList All FilesDelete Configuration File
The LIST CONFIGURATION FILES option provides a CRT-displayedlist of the DARPASS configuration files currently stored ondisk. The user can specify the disk drive from which theconfiguration files will be read and listed. If necessary,the user can also specify a "path" to a subdirectory.
The second option, LIST ALL FILES, provides a CRT-displayedlist of all files currently stored on disk. Again, the usercan specify the disk drive and/or subdirectory from whichthe files are to be listed.
DELETE CONFIGURATION FILE lets the user delete obsoleteconfiguration files. He/she is prompted for the file to bedeleted and may only delete files from the current "default"directory, i.e., disk drive or subdirectory designations arenot permitted. Wildcards also cannot be used in thisdeletion process.
DARPASS - Page 18
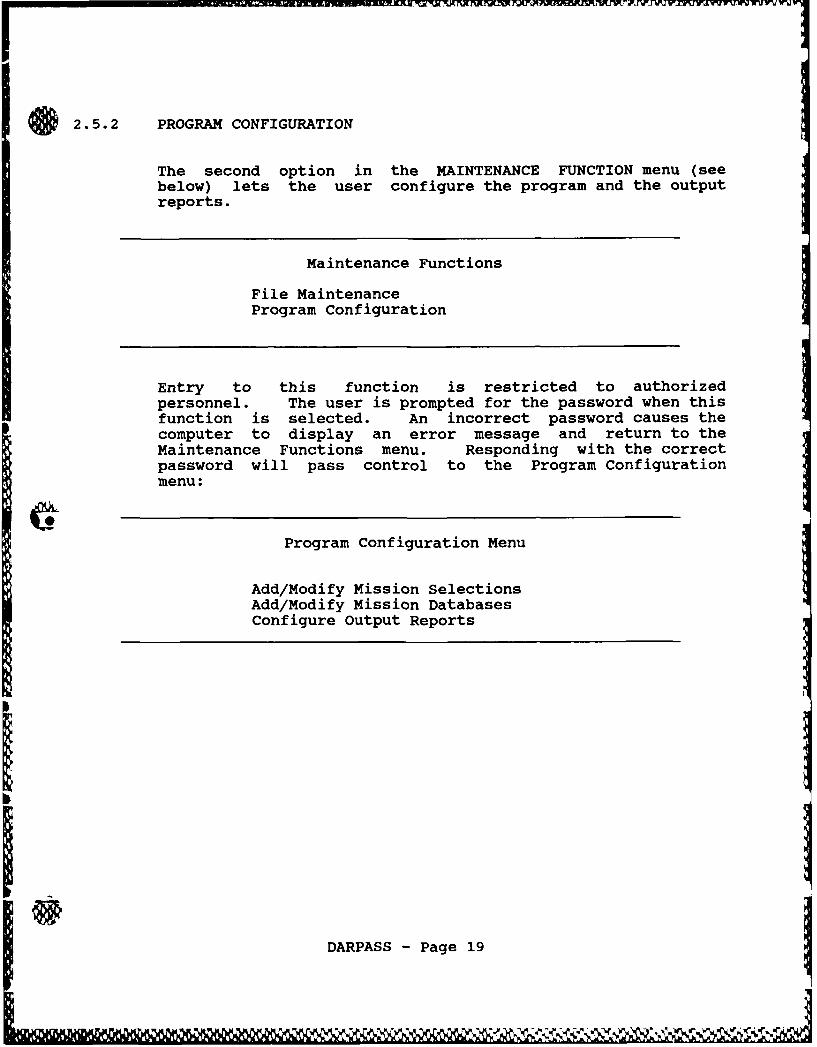
2.5.2 PROGRAM CONFIGURATION
The second option in the MAINTENANCE FUNCTION menu (seebelow) lets the user configure the program and the outputreports.
Maintenance Functions
File MaintenanceProgram Configuration
Entry to this function is restricted to authorizedpersonnel. The user is prompted for the password when thisfunction is selected. An incorrect password causes thecomputer to display an error message and return to theMaintenance Functions menu. Responding with the correctpassword will pass control to the Program Configurationmenu:
Program Configuration Menu
Add/Modify Mission SelectionsAdd/Modify Mission DatabasesConfigure Output Reports
DARPASS - Page 19
. ... .. - .
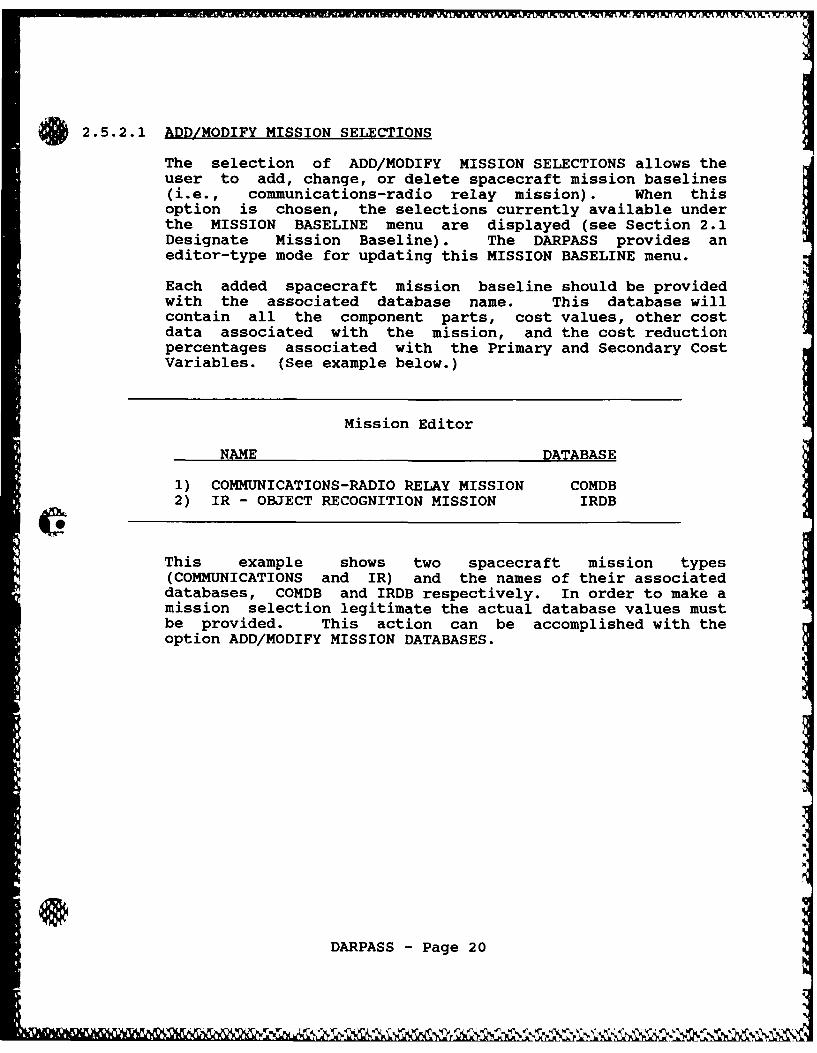
2.5.2.1 ADD/MODIFY MISSION SELECTIONS
The selection of ADD/MODIFY MISSION SELECTIONS allows theuser to add, change, or delete spacecraft mission baselines(i.e., communications-radio relay mission). When thisoption is chosen, the selections currently available underthe MISSION BASELINE menu are displayed (see Section 2.1Designate Mission Baseline). The DARPASS provides aneditor-type mode for updating this MISSION BASELINE menu.
Each added spacecraft mission baseline should be providedwith the associated database name. This database willcontain all the component parts, cost values, other costdata associated with the mission, and the cost reductionpercentages associated with the Primary and Secondary CostVariables. (See example below.)
Mission Editor
NAME DATABASE
1) COMMUNICATIONS-RADIO RELAY MISSION COMDB2) IR - OBJECT RECOGNITION MISSION IRDB
This example shows two spacecraft mission types(COMMUNICATIONS and IR) and the names of their associateddatabases, COMDB and IRDB respectively. In order to make amission selection legitimate the actual database values mustbe provided. This action can be accomplished with theoption ADD/MODIFY MISSION DATABASES.
DARPASS - Page 20
.er W
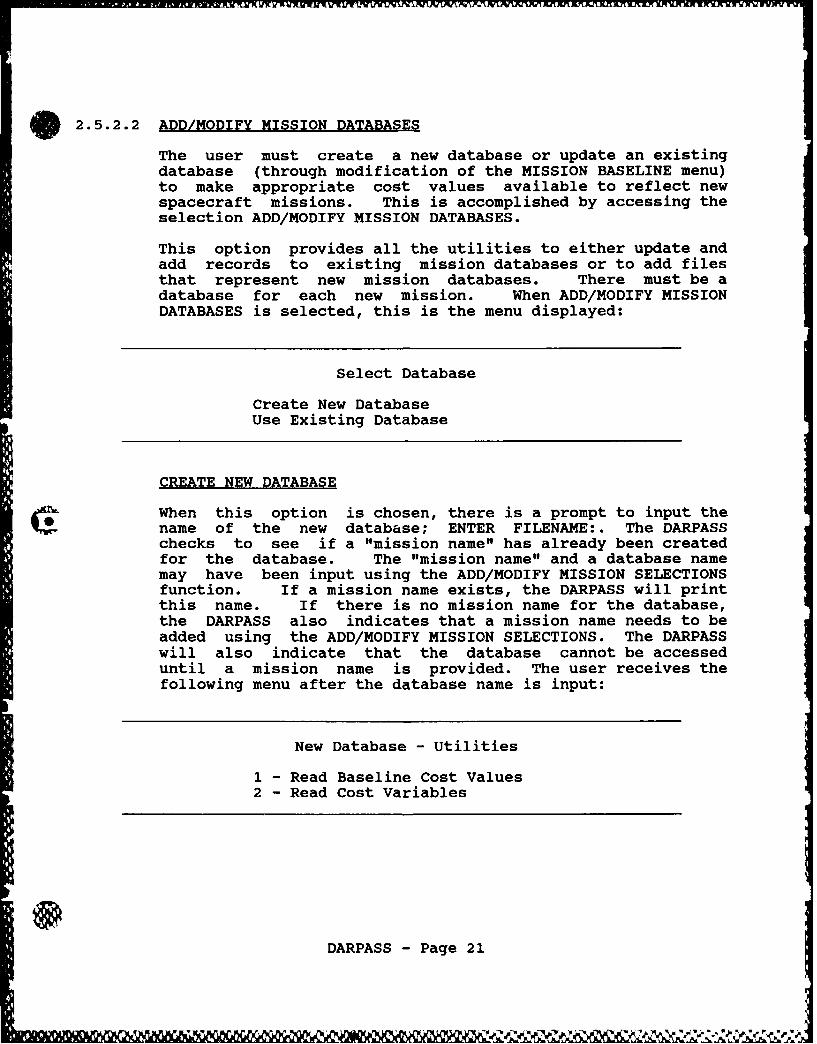
. 2.5.2.2 ADD/MODIFY MISSION DATABASES
The user must create a new database or update an existingdatabase (through modification of the MISSION BASELINE menu)to make appropriate cost values available to reflect newspacecraft missions. This is accomplished by accessing theselection ADD/MODIFY MISSION DATABASES.
This option provides all the utilities to either update andadd records to existing mission databases or to add filesthat represent new mission databases. There must be adatabase for each new mission. When ADD/MODIFY MISSIONDATABASES is selected, this is the menu displayed:
Select Database
Create New DatabaseUse Existing Database
CREATE NEW DATABASE
When this option is chosen, there is a prompt to input thename of the new database; ENTER FILENAME:. The DARPASSchecks to see if a "mission name" has already been createdfor the database. The "mission name" and a database namemay have been input using the ADD/MODIFY MISSION SELECTIONSfunction. If a mission name exists, the DARPASS will printthis name. If there is no mission name for the database,the DARPASS also indicates that a mission name needs to beadded using the ADD/MODIFY MISSION SELECTIONS. The DARPASSwill also indicate that the database cannot be accesseduntil a mission name is provided. The user receives thefollowing menu after the database name is input:
New Database - Utilities
1 - Read Baseline Cost Values2 - Read Cost Variables
DARPASS - Page 21

The capabilities of each selection are detailed below:
READ BASELINE COST VALUES requests the name of the file thatcontains the baseline cost values. There are 11 baselinecost values for each component part: one development, fivePEP (one for each production quantity), and fiveproduction. The DARPASS reads in the file of baseline costvalues and then returns to the NEW DATABASE - UTILITIESmenu.
READ COST VARIABLES reads in the Primary and/or SecondaryCost Variables. The DARPASS then prorpts for the followinginformation:
ENTER FILZNAME:SPECIFY PHASE (1-DEVELOP, 2-PEP, 3-PROD):SPECIFY Quantity (5, 25, 50, 100, 150):SPECIFY VARIABLE (1 - 12):
The DARPASS reads in the cost reduction percentages for theselected phase, production quantity, and variable for alloptions (one to three). That is, each file should containthree cost options for each variable.
USE EXISTING DATABASE
When this option is selected, the user receives a prompt toinput the name of the existing database. Once this isentered, the user receives the following menu:
Existing Database - Utilities
1 - Update Baseline Cost Values2 - Update Cost Variables3 - List All Records4 - List A Record5 - Add A Record6 - Edit A Record7 - Delete A Record
DARPASS - Page 22
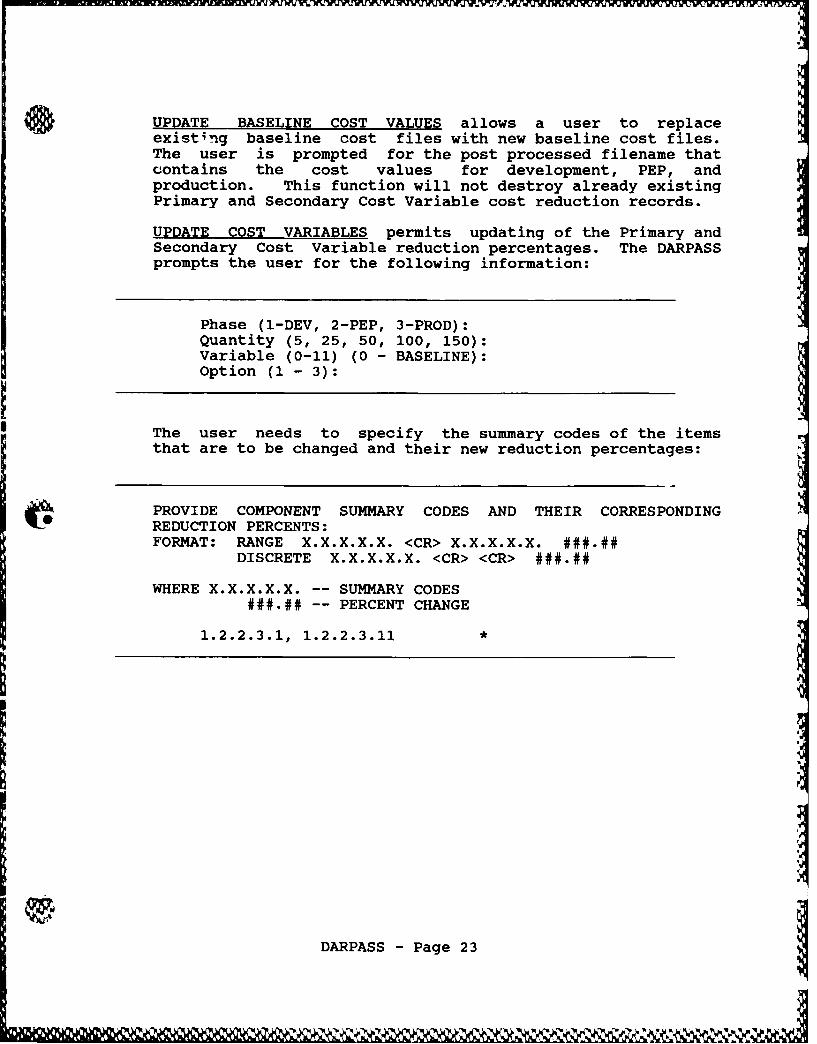
UPDATE BASELINE COST VALUES allows a user to replaceexisting baseline cost files with new baseline cost files.The user is prompted for the post processed filename thatcontains the cost values for development, PEP, andproduction. This function will not destroy already existingPrimary and Secondary Cost Variable cost reduction records.
UPDATE COST VARIABLES permits updating of the Primary andSecondary Cost Variable reduction percentages. The DARPASSprompts the user for the following information:
Phase (I-DEV, 2-PEP, 3-PROD):Quantity (5, 25, 50, 100, 150):Variable (0-11) (0 - BASELINE):Option (1 - 3):
The user needs to specify the summary codes of the itemsthat are to be changed and their new reduction percentages:
PROVIDE COMPONENT SUMMARY CODES AND THEIR CORRESPONDINGREDUCTION PERCENTS:FORMAT: RANGE X.X.X.X.X. <CR> X.X.X.X.X. ###.##
DISCRETE X.X.X.X.X. <CR> <CR> ###.##
WHERE X.X.X.X.X. -- SUMMARY CODES###.##-- PERCENT CHANGE
1.2.2.3.1, 1.2.2.3.11 *
I
DARPASS - Page 23
Lwmmmmalim -m z

UZOLML11 WUWWWWWU1MUWW.NtJVWLA - - - VW WX WX WX 6uW VV v Jrvf
To indicate which percentages are to be updated, the user isrequired to respond to the following prompts. Only thepercentages for these specific summary codes are affected.
Quantity (5, 25, 50, 100, 150):Variable (0-11) (0 - BASELINE):Option (1 - 3):
LIST ALL RECORDS provides a list of all the recordscontained in the database segregated by item summary code.An item summary code is a number used to identify an item inthe same way as an item name. Baseline values by phase foreach production quantity are displayed for each item.
LIST A RECORD provides all the information contained on acomponent part selected by a specific summary code. TheDARPASS prompts the user for the following information:
ENTER PART CODE:SELECT PHASE (1-DEVELOP, 2-PEP, 3-PRODUCTION):ENTER VARIABLE (0 - 12, 0 = BASELINE):ENTER OPTION (1 - 3):
The information displayed by DARPASS will either be thebaseline dollar values or the percent reduction values (ifvariable = 1 to 12) for all quantities (5, 25, ...150) forthe selected part.
DARPASS - Page 24
- -

ADD A RECORD operates in the same manner as described forLIST A RECORD except the DARPASS prompts for the informationinstead of displaying it. After the part code has beenentered,
ENTER PART CODE: 1.2.2.1.22SELECT PHASE (1-DEVELOP, 2-PEP, 3-PRODUCTION): 2ENTER VARIABLE (0 - 12, 0 = BASLEINE): 10ENTER OPTION (I - 3): 2ENTER PEP 5: 90ENTER PEP 25: 91ENTER PEP 50: 93ENTER PEP 100: 95ENTER PEP 150: 97
The information input by the user should be the baselinecost values for all quantities (5, 25,..150) for eachphase. The user should utilize the EDIT A RECORD option toenter percent reduction values for a part.
EDIT A RECORD operates much like the LIST A RECORD optionexcept values are modified rather than listed. Following isan example:
ENTER PART CODE: 1.2.2.1.22SELECT PHASE (1-DEVELOP, 2-PEP, 3-PRODUCTION): 2
GO ENTER VARIABLE (0 - 12, 0 = BASELINE): 10ENTER OPTION (1 - 3): 2ENTER PEP 5 (90): 80ENTER PEP 25 (91): 82ENTER PEP 50 (93): 84ENTER PEP 100 (95): 85ENTER PEP 150 (97): 86
The values in parentheses represent the current valuesfollowed by the new values for that summary item as input bythe user. The information provided is the percent reductionvalues or baseline cost values for all quantities (5,25,..150) for the phase and part selected.
DELETE A RECORD eliminates an item from the database. Anexample has been provided below:
ENTER PART CODE: 1.2.2.1.22DELETE PART? (Y OR N): Y
DARPASS - Page 25
-V
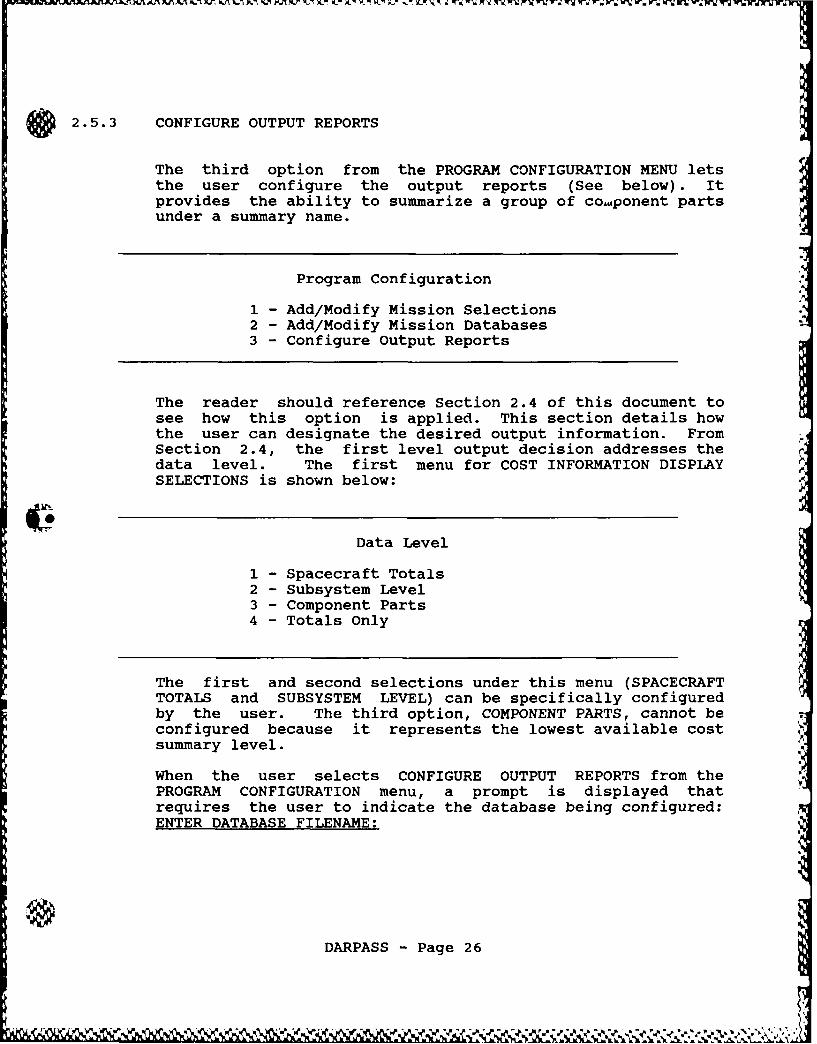
2.5.3 CONFIGURE OUTPUT REPORTS
The third option from the PROGRAM CONFIGURATION MENU letsthe user configure the output reports (See below). Itprovides the ability to summarize a group of co ,ponent partsunder a summary name.
Program Configuration
1 - Add/Modify Mission Selections2 - Add/Modify Mission Databases3 - Configure Output Reports
The reader should reference Section 2.4 of this document tosee how this option is applied. This section details howthe user can designate the desired output information. FromSection 2.4, the first level output decision addresses thedata level. The first menu for COST INFORMATION DISPLAYSELECTIONS is shown below:
Data Level
1 - Spacecraft Totals2 - Subsystem Level3 - Component Parts4 - Totals Only
The first and second selections under this menu (SPACECRAFTTOTALS and SUBSYSTEM LEVEL) can be specifically configuredby the user. The third option, COMPONENT PARTS, cannot beconfigured because it represents the lowest available costsummary level.
When the user selects CONFIGURE OUTPUT REPORTS from thePROGRAM CONFIGURATION menu, a prompt is displayed thatrequires the user to indicate the database being configured:ENTER DATABASE FILENAME:
DARPASS - Page 26
1
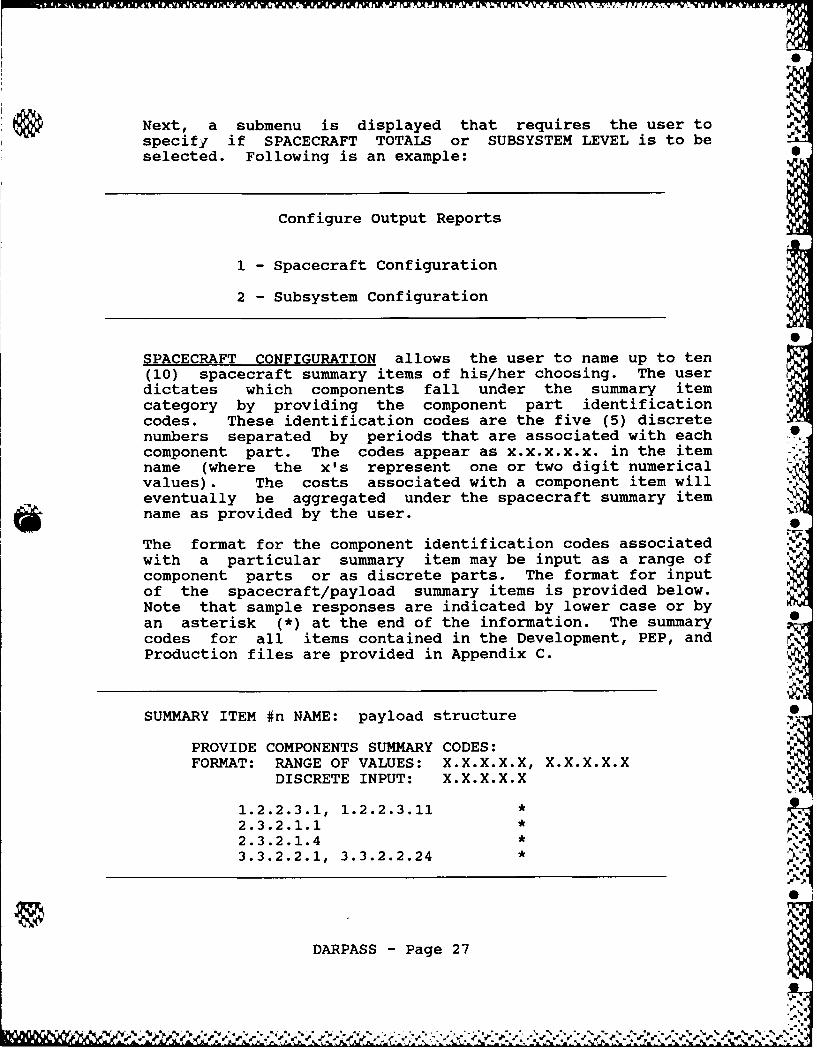
Next, a submenu is displayed that requires the user tospecify if SPACECRAFT TOTALS or SUBSYSTEM LEVEL is to beselected. Following is an example: 0
Configure Output Reports
1 - Spacecraft Configuration
2 - Subsystem Configuration
SPACECRAFT CONFIGURATION allows the user to name up to ten(10) spacecraft summary items of his/her choosing. The userdictates which components fall under the summary itemcategory by providing the component part identificationcodes. These identification codes are the five (5) discretenumbers separated by periods that are associated with each 0component part. The codes appear as x.x.x.x.x. in the itemname (where the x's represent one or two digit numericalvalues). The costs associated with a component item willeventually be aggregated under the spacecraft summary itemname as provided by the user.
The format for the component identification codes associatedwith a particular summary item may be input as a range ofcomponent parts or as discrete parts. The format for inputof the spacecraft/payload summary items is provided below.Note that sample responses are indicated by lower case or byan asterisk (*) at the end of the information. The summarycodes for all items contained in the Development, PEP, andProduction files are provided in Appendix C.
SUMMARY ITEM #n NAME: payload structure
PROVIDE COMPONENTS SUMMARY CODES:FORMAT: RANGE OF VALUES: X.X.X.X.X, X.X.X.X.X
DISCRETE INPUT: X.X.X.X.X
1.2.2.3.1, 1.2.2.3.11 *2.3.2.1.1*2.3.2.1.4 *3.3.2.2.1, 3.3.2.2.24 *
°0
DARPASS - Page 27

The ten (or less) spacecraft summary items appear in theappropriate output report. The component items that havebeen identified with a summary item have costs aggregatedwith a total cost provided for each summary item (seeAppendix B).
SPACE DIVISION SUBSYSTEM CONFIGURATION operates in the samefashion as the previous option. It permits naming of up to25 space division subsystem summaries. The user must againestablish the component identification codes for eachsummary item. The component identification codes for allitems contained in the Development, PEP, and Productionfiles are provided in Appendix C.
The twenty-five (or less) space division subsystem summaryitems appear in the output report. The component items thathave been identified with a summary item have costsaggregated with a total cost provided for each summary item(see Appendix B).
DARPASS - Page 28
@ 2.6 TERMINATE AND RETURN TO DOS
DARPA SPACE SYSTEM COST STUDY PROGRAM
DARPASS Program Operations
Designate Mission BaselineInput New ConfigurationModify Existing Configuration
Retrieve ConfigurationSave Configuration
ExecuteFile Operations/MaintenanceTerminate & Return to DOS
Tnis selection passes control to the DOS system level. Ifthe user has input a new configuration file or has modifiedan existing file and has not yet saved the information, theDARPASS provides an opportunity to save the informationbefore returning to DOS.
DARPASS - Page 29
m2k

APPENDIX A
@INTRODUCTIONThis appendix contains the text for the Help screen providedby the DARPASS for the Primary and Secondary costvariables. In some cases, the text displayed on the CRTscreen has been tailored so that it fits on the screen.
1) USE OF EXISTING EQUIPMENT addresses the cost effect of usingequipment that exists or needs slight modification versusequipment that must be developed from scratch or needsextensive modification.
B) Essentially all equipment developed for the spacecraft/payload is developed from scratch. No equipment currentlyexists that supports the requirements.
1) Much of the required spacecraft/payload equipment has to bedeveloped from scratch. In some instances, existing designcan be used but requires major repackaging or similar designmodification.
2) Much of the equipment needed for the spacecraft/payloadexists in some form. Some items require repackaging but arefunctionally similar to existing requirements.
3) Extensive use of existing equipment. Use of equipmentpreviously flight certified and flown on previous spacecraft
missions.
2) TESTING APPROACH addresses the cost effect of alternatetesting approaches and encompasses the level of testing, thetypes of testing, and the frequency of testing.
B) Extensive testing; testing to the lowest functional level,testing of all assemblies, subsystems, and systems. Fullbattery of environmental and non-environmental testing andacceptance testing.
1) Testing to the first assembly level, subsystems, andsystems. Full battery of environmental and non-environmental testing and acceptance testing. Some testscan be performed using the same facilities or done inparallel.
2) Testing at the subsystem and system levels. Reduced spacevehicle testing; some environmental/non-environmental testsare not required. Thermal testing not required due to knownenvironment and component capabilities; reduced transponderEM testing.
3) Testing is performed essentially at just the system level.For production, test every fifth unit depending on lotmaterial buys. Very limited and only acceptance testing.
A-1
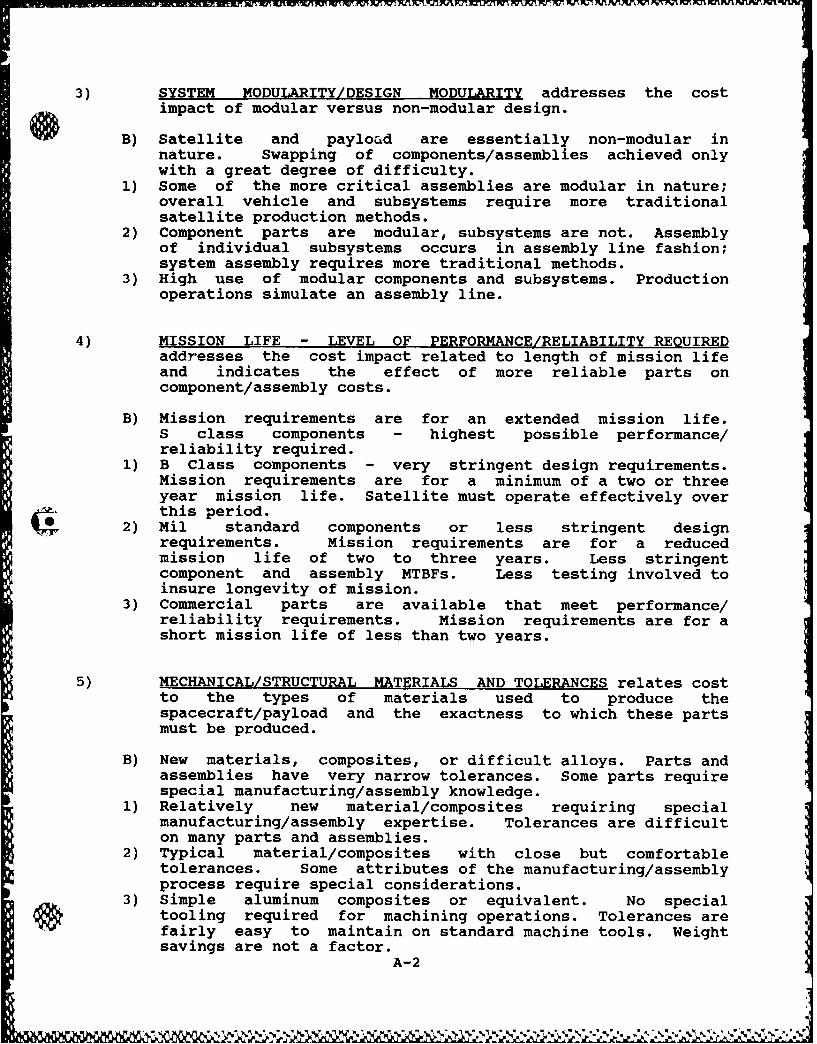
3) SYSTEM MODULARITY/DESIGN MODULARITY addresses the costimpact of modular versus non-modular design.
B) Satellite and payload are essentially non-modular innature. Swapping of components/assemblies achieved onlywith a great degree of difficulty.
1) Some of the more critical assemblies are modular in nature;overall vehicle and subsystems require more traditionalsatellite production methods.
2) Component parts are modular, subsystems are not. Assemblyof individual subsystems occurs in assembly line fashion;system assembly requires more traditional methods.
3) High use of modular components and subsystems. Productionoperations simulate an assembly line.
4) MISSION LIFE - LEVEL OF PERFORMANCE/RELIABILITY REQUIREDaddresses the cost impact related to length of mission lifeand indicates the effect of more reliable parts oncomponent/assembly costs.
B) Mission requirements are for an extended mission life.S class components - highest possible performance/reliability required.
1) B Class components - very stringent design requirements.Mission requirements are for a minimum of a two or threeyear mission life. Satellite must operate effectively overthis period.
2) Mil standard components or less stringent designrequirements. Mission requirements are for a reducedmission life of two to three years. Less stringentcomponent and assembly MTBFs. Less testing involved toinsure longevity of mission.
3) Commercial parts are available that meet performance/reliability requirements. Mission requirements are for ashort mission life of less than two years.
5) MECHANICAL/STRUCTURAL MATERIALS AND TOLERANCES relates costto the types of materials used to produce thespacecraft/payload and the exactness to which these partsmust be produced.
B) New materials, composites, or difficult alloys. Parts andassemblies have very narrow tolerances. Some parts requirespecial manufacturing/assembly knowledge.
1) Relatively new material/composites requiring specialmanufacturing/assembly expertise. Tolerances are difficulton many parts and assemblies.
2) Typical material/composites with close but comfortabletolerances. Some attributes of the manufacturing/assemblyprocess require special considerations.
3) Simple aluminum composites or equivalent. No specialtooling required for machining operations. Tolerances arefairly easy to maintain on standard machine tools. Weightsavings are not a factor.
A-2
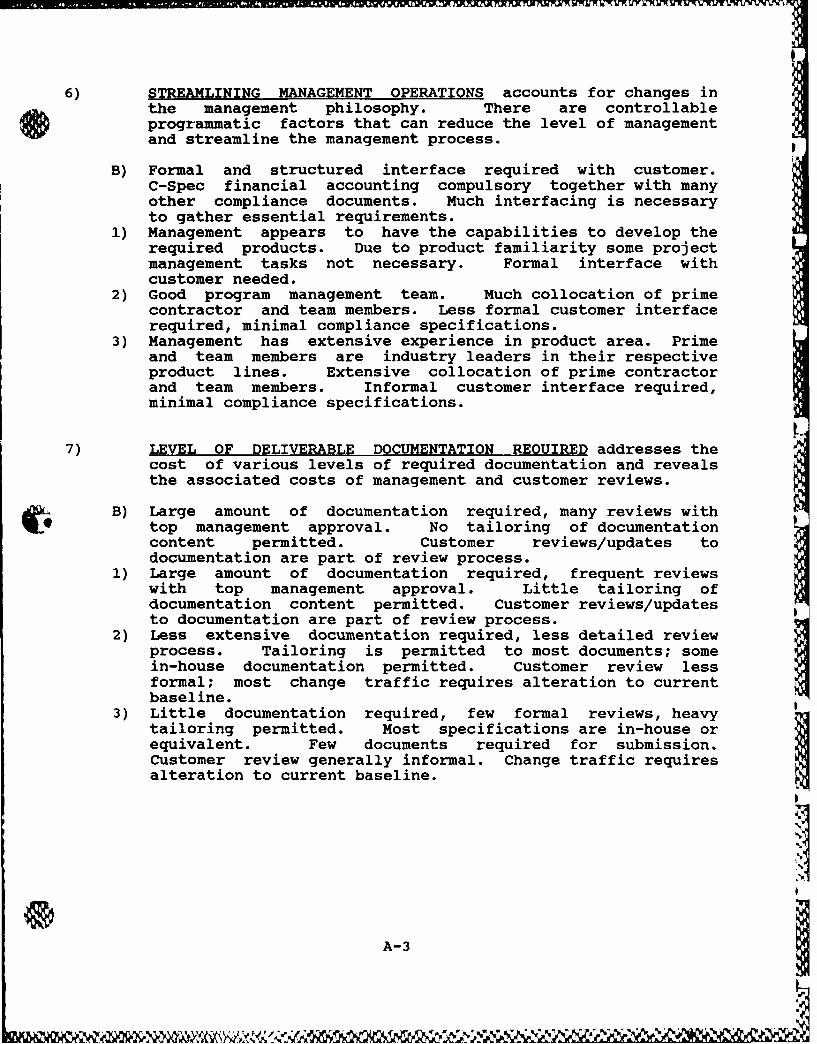
6) STREAMLINING MANAGEMENT OPERATIONS accounts for changes inthe management philosophy. There are controllableprogrammatic factors that can reduce the level of managementand streamline the management process.
B) Formal and structured interface required with customer.C-Spec financial accounting compulsory together with manyother compliance documents. Much interfacing is necessaryto gather essential requirements.
1) Management appears to have the capabilities to develop therequired products. Due to product familiarity some projectmanagement tasks not necessary. Formal interface withcustomer needed.
2) Good program management team. Much collocation of primecontractor and team members. Less formal customer interfacerequired, minimal compliance specifications.
3) Management has extensive experience in product area. Primeand team members are industry leaders in their respectiveproduct lines. Extensive collocation of prime contractorand team members. Informal customer interface required,minimal compliance specifications.
7) LEVEL OF DELIVERABLE DOCUMENTATION REQUIRED addresses thecost of various levels of required documentation and revealsthe associated costs of management and customer reviews.
B) Large amount of documentation required, many reviews withtop management approval. No tailoring of documentationcontent permitted. Customer reviews/updates todocumentation are part of review process.
1) Large amount of documentation required, frequent reviewswith top management approval. Little tailoring ofdocumentation content permitted. Customer reviews/updatesto documentation are part of review process.
2) Less extensive documentation required, less detailed reviewprocess. Tailoring is permitted to most documents; somein-house documentation permitted. Customer review lessformal; most change traffic requires alteration to currentbaseline.
3) Little documentation required, few formal reviews, heavytailoring permitted. Most specifications are in-house orequivalent. Few documents required for submission.Customer review generally informal. Change traffic requiresalteration to current baseline.
A-3
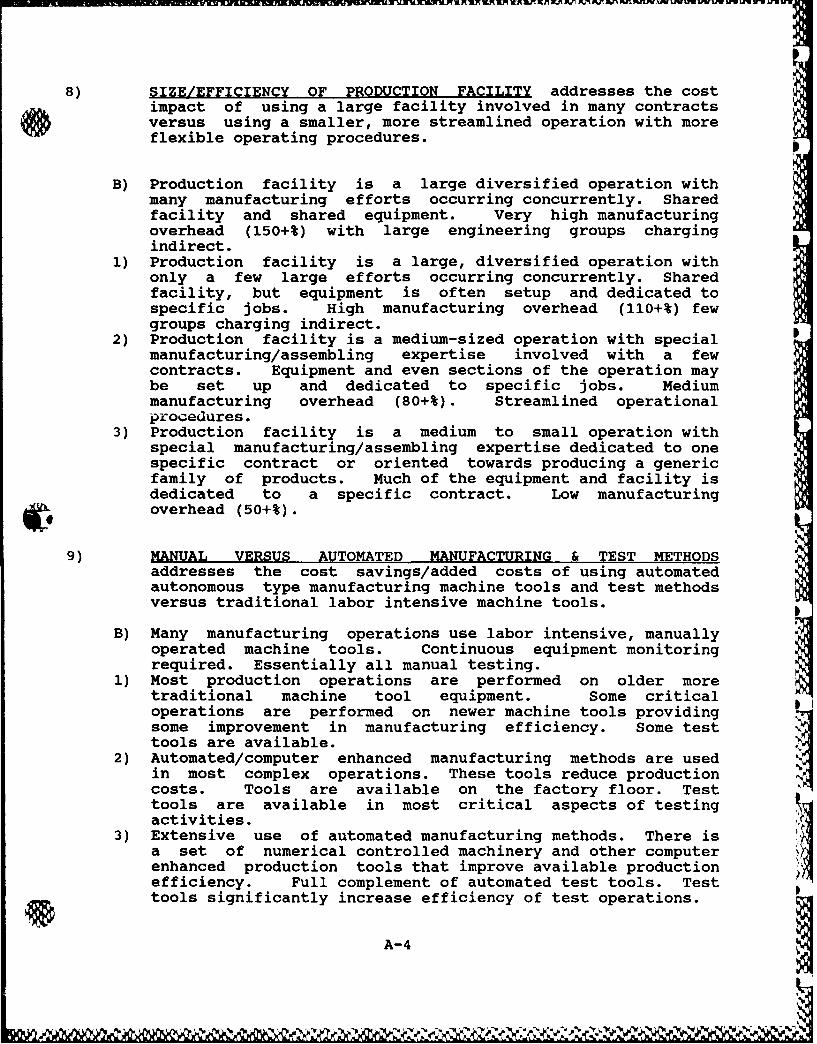
8) SIZE/EFFICIENCY OF PRODUCTION FACILITY addresses the costimpact of using a large facility involved in many contractsSversus using a smaller, more streamlined operation with moreflexible operating procedures.
B) Production facility is a large diversified operation withmany manufacturing efforts occurring concurrently. Sharedfacility and shared equipment. Very high manufacturingoverhead (150+%) with large engineering groups chargingindirect.
1) Production facility is a large, diversified operation withonly a few large efforts occurring concurrently. Sharedfacility, but equipment is often setup and dedicated tospecific jobs. High manufacturing overhead (110+%) fewgroups charging indirect.
2) Production facility is a medium-sized operation with specialmanufacturing/assembling expertise involved with a fewcontracts. Equipment and even sections of the operation maybe set up and dedicated to specific jobs. Mediummanufacturing overhead (80+%). Streamlined operationalprocedures.
3) Production facility is a medium to small operation withspecial manufacturing/assembling expertise dedicated to onespecific contract or oriented towards producing a genericfamily of products. Much of the equipment and facility isdedicated to a specific contract. Low manufacturingoverhead (50+%).
9) MANUAL VERSUS AUTOMATED MANUFACTURING & TEST METHODSaddresses the cost savings/added costs of using automatedautonomous type manufacturing machine tools and test methodsversus traditional labor intensive machine tools.
B) Many manufacturing operations use labor intensive, manuallyoperated machine tools. Continuous equipment monitoringrequired. Essentially all manual testing.
1) Most production operations are performed on older moretraditional machine tool equipment. Some criticaloperations are performed on newer machine tools providingsome improvement in manufacturing efficiency. Some testtools are available.
2) Automated/computer enhanced manufacturing methods are usedin most complex operations. These tools reduce productioncosts. Tools are available on the factory floor. Testtools are available in most critical aspects of testingactivities.
3) Extensive use of automated manufacturing methods. There isa set of numerical controlled machinery and other computerenhanced production tools that improve available productionefficiency. Full complement of automated test tools. Testtools significantly increase efficiency of test operations.
A-4
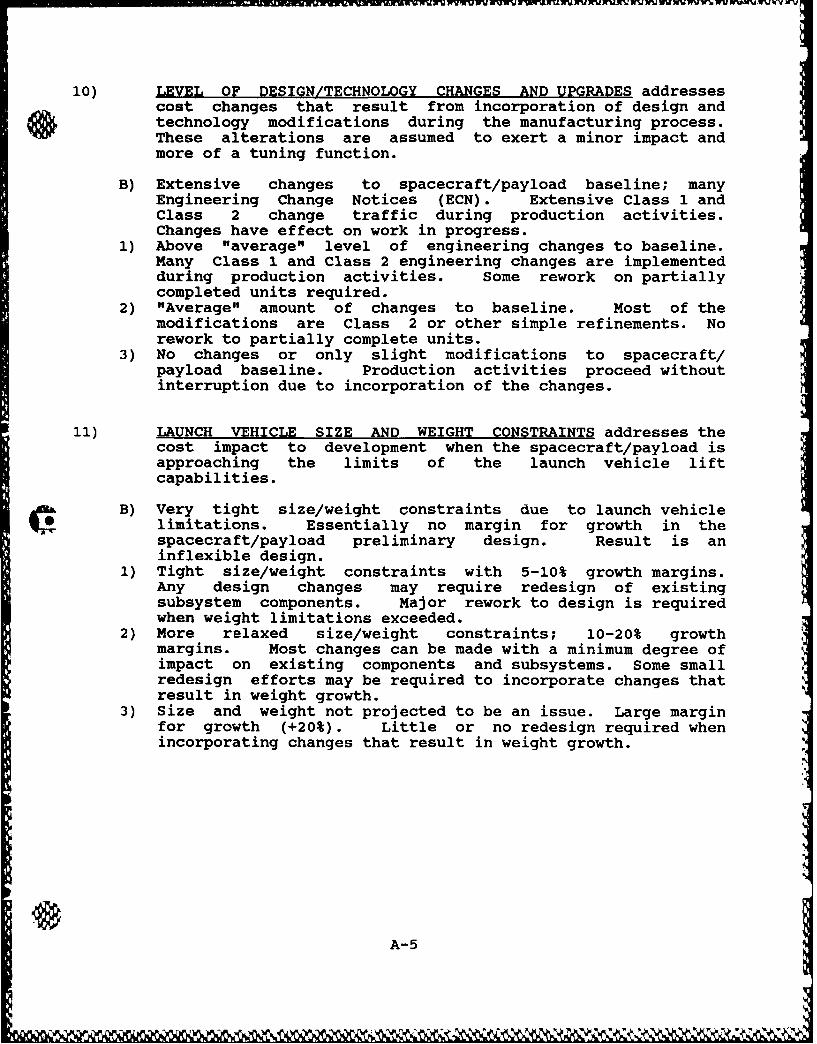
10) LEVEL OF DESIGN/TECHNOLOGY CHANGES AND UPGRADES addressescost changes that result from incorporation of design andtechnology modifications during the manufacturing process.These alterations are assumed to exert a minor impact andmore of a tuning function.
B) Extensive changes to spacecraft/payload baseline; manyEngineering Change Notices (ECN). Extensive Class 1 andClass 2 change traffic during production activities.Changes have effect on work in progress.
1) Above "average" level of engineering changes to baseline.Many Class 1 and Class 2 engineering changes are implementedduring production activities. Some rework on partiallycompleted units required.
2) "Average" amount of changes to baseline. Most of themodifications are Class 2 or other simple refinements. Norework to partially complete units.
3) No changes or only slight modifications to spacecraft/payload baseline. Production activities proceed withoutinterruption due to incorporation of the changes.
11) LAUNCH VEHICLE SIZE AND WEIGHT CONSTRAINTS addresses thecost impact to development when the spacecraft/payload isapproaching the limits of the launch vehicle liftcapabilities.
m B) Very tight size/weight constraints due to launch vehiclelimitations. Essentially no margin for growth in thespacecraft/payload preliminary design. Result is aninflexible design.
1) Tight size/weight constraints with 5-10% growth margins.Any design changes may require redesign of existingsubsystem components. Major rework to design is requiredwhen weight limitations exceeded.
2) More relaxed size/weight constraints; 10-20% growthmargins. Most changes can be made with a minimum degree ofimpact on existing components and subsystems. Some smallredesign efforts may be required to incorporate changes thatresult in weight growth.
3) Size and weight not projected to be an issue. Large marginfor growth (+20%). Little or no redesign required whenincorporating changes that result in weight growth.
A-5
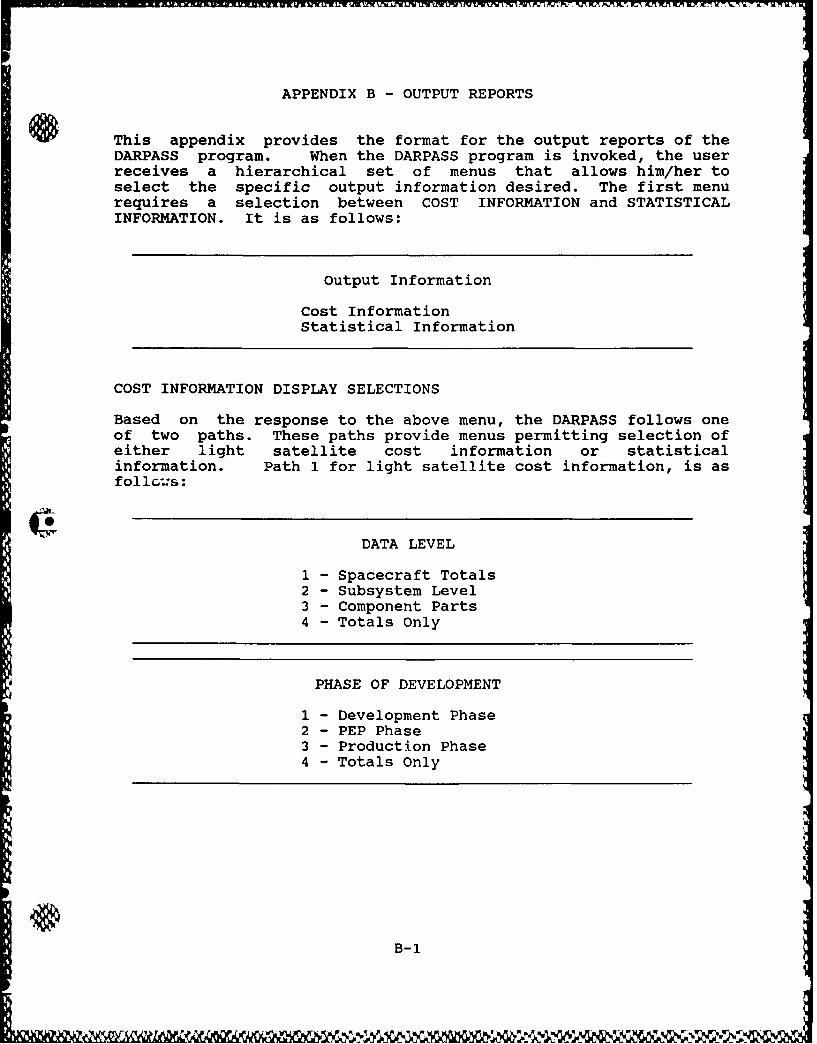
APPENDIX B - OUTPUT REPORTS
S This appendix provides the format for the output reports of theDARPASS program. When the DARPASS program is invoked, the userreceives a hierarchical set of menus that allows him/her toselect the specific output information desired. The first menurequires a selection between COST INFORMATION and STATISTICALINFORMATION. It is as follows:
Output Information
Cost InformationStatistical Information
COST INFORMATION DISPLAY SELECTIONS
Based on the response to the above menu, the DARPASS follows oneof two paths. These paths provide menus permitting selection ofeither light satellite cost information or statisticalinformation. Path 1 for light satellite cost information, is asfollc :s:
DATA LEVEL
1 - Spacecraft Totals2 - Subsystem Level3 - Component Parts4 - Totals Only
PHASE OF DEVELOPMENT
1 - Development Phase2 - PEP Phase3 - Production Phase4 - Totals Only
B-1

COST VALUE
Total CostUnit CostCost Savings
DISPLAY FORMAT
TablesLine GraphBar Chart
DISPLAY MODE
ScreenPrinter
VARIABLE STATISTICS DISPLAY SELECTIONS
The second set of menus for statistical information, Path 2, isshown below. The two sets of menus operate in the same mannerwith the only noticeable difference being the options provided.
DATA LEVEL
1 - Spacecraft Totals2 - Subsystem Level3 - Component Parts4 - Totals Only
PHASE OF DEVELOPMENT
1 - Development Phase2 - PEP Phase3 - Production Phase4 - Totals Only
B-2
VN 'X

*LEVEL OF STATISTICS
Individual StatisticsComposite Statistics
DISPLAY FORMAT
TablesLine GraphBar Chart
DISPLAY MODE
ScreenPrinter
The output displays associated with different combinations of theabove selections are discussed below and are segregated into fourprinciple categories that are discussed individually:
A) Cost Information Display Tables - Path 1B) Statistical Information Display Tables - Path 2C) Cost Information Graphical Displays - Path 1D) Statistical Information Graphical Displays - Path 2
B-3
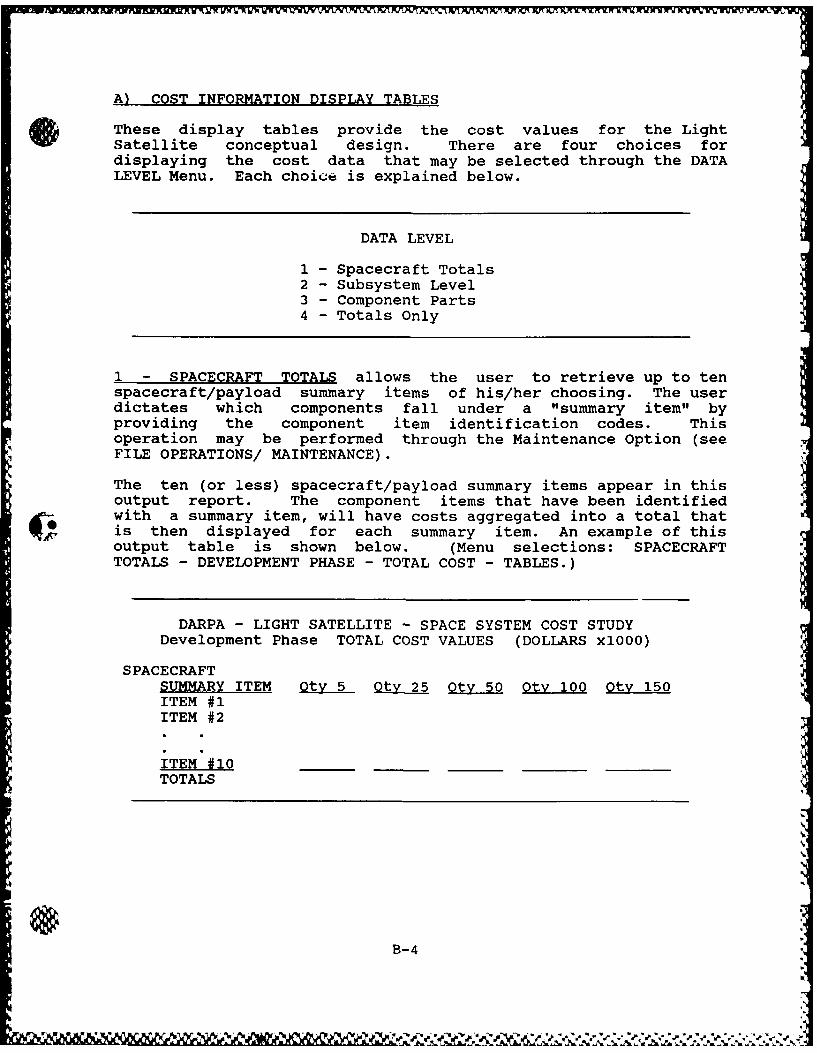
A) COST INFORMATION DISPLAY TABLES
These display tables provide the cost values for the LightSatellite conceptual design. There are four choices fordisplaying the cost data that may be selected through the DATALEVEL Menu. Each choi.e is explained below.
DATA LEVEL
1 - Spacecraft Totals2 - Subsystem Level3 - Component Parts4 - Totals Only
1 - SPACECRAFT TOTALS allows the user to retrieve up to tenspacecraft/payload summary items of his/her choosing. The userdictates which components fall under a "summary item" byproviding the component item identification codes. Thisoperation may be performed through the Maintenance Option (seeFILE OPERATIONS/ MAINTENANCE).
The ten (or less) spacecraft/payload summary items appear in thisoutput report. The component items that have been identifiedwith a summary item, will have costs aggregated into a total thatis then displayed for each summary item. An example of thisoutput table is shown below. (Menu selections: SPACECRAFTTOTALS - DEVELOPMENT PHASE - TOTAL COST - TABLES.)
DARPA - LIGHT SATELLITE - SPACE SYSTEM COST STUDYDevelopment Phase TOTAL COST VALUES (DOLLARS xl000)
SPACECRAFTSUMMARY ITEM Oty 5 Oty 25 Otv 50 Otv 100 Oty 150ITEM #1ITEM #2
ITEM #10TOTALS
B-4
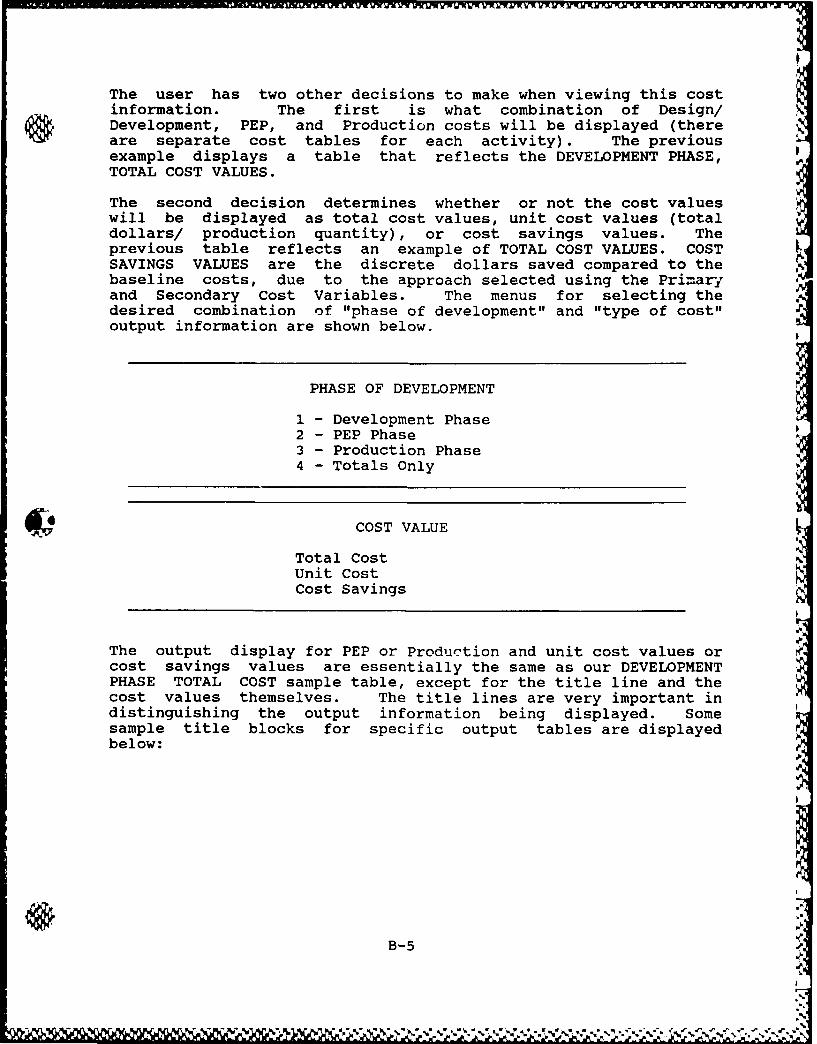
The user has two other decisions to make when viewing this costinformation. The first is what combination of Design/Development, PEP, and Production costs will be displayed (thereare separate cost tables for each activity). The previousexample displays a table that reflects the DEVELOPMENT PHASE,TOTAL COST VALUES.
The second decision determines whether or not the cost valueswill be displayed as total cost values, unit cost values (totaldollars/ production quantity), or cost savings values. Theprevious table reflects an example of TOTAL COST VALUES. COSTSAVINGS VALUES are the discrete dollars saved compared to thebaseline costs, due to the approach selected using the Primaryand Secondary Cost Variables. The menus for selecting thedesired combination of "phase of development" and "type of cost"output information are shown below.
PHASE OF DEVELOPMENT
1 - Development Phase2 - PEP Phase3 - Production Phase4 - Totals Only
COST VALUE
Total CostUnit CostCost Savings
The output display for PEP or Production and unit cost values orcost savings values are essentially the same as our DEVELOPMENTPHASE TOTAL COST sample table, except for the title line and thecost values themselves. The title lines are very important indistinguishing the output information being displayed. Somesample title blocks for specific output tables are displayedbelow:
B-5
S-% -. ."
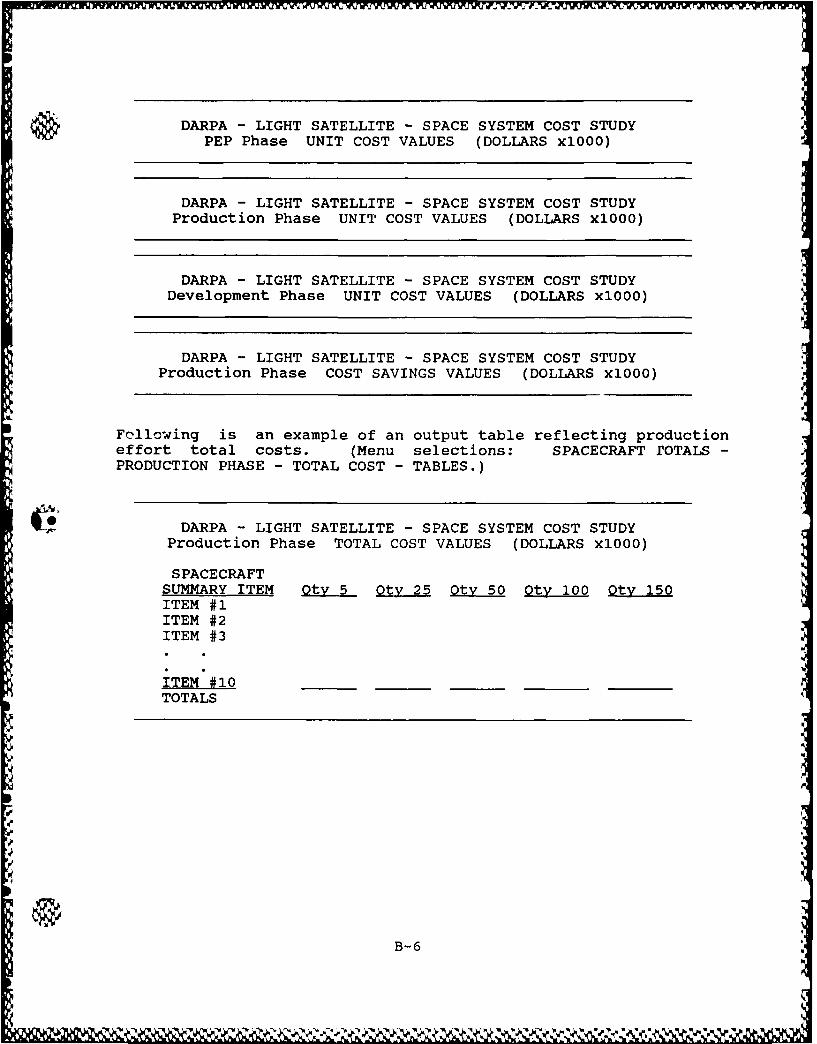
DARPA - LIGHT SATELLITE - SPACE SYSTEM COST STUDYPEP Phase UNIT COST VALUES (DOLLARS x1OOO)
DARPA - LIGHT SATELLITE - SPACE SYSTEM COST STUDYProduction Phase UNIT COST VALUES (DOLLARS xl00)
DARPA - LIGHT SATELLITE - SPACE SYSTEM COST STUDYDevelopment Phase UNIT COST VALUES (DOLLARS xl000)
DARPA - LIGHT SATELLITE - SPACE SYSTEM COST STUDYProduction Phase COST SAVINGS VALUES (DOLLARS xl000)
Following is an example of an output table reflecting productioneffort total costs. (Menu selections: SPACECRAFT rOTALS -PRODUCTION PHASE - TOTAL COST - TABLES.)
DARPA - LIGHT SATELLITE - SPACE SYSTEM COST STUDYProduction Phase TOTAL COST VALUES (DOLLARS xl000)
SPACECRAFTSUMMARY ITEM Oty 5 Oty 25 Oty 50 Otv 100 Qtv 150ITEM #1ITEM #2ITEM #3
ITEM #10TOTALS
B-
B-6
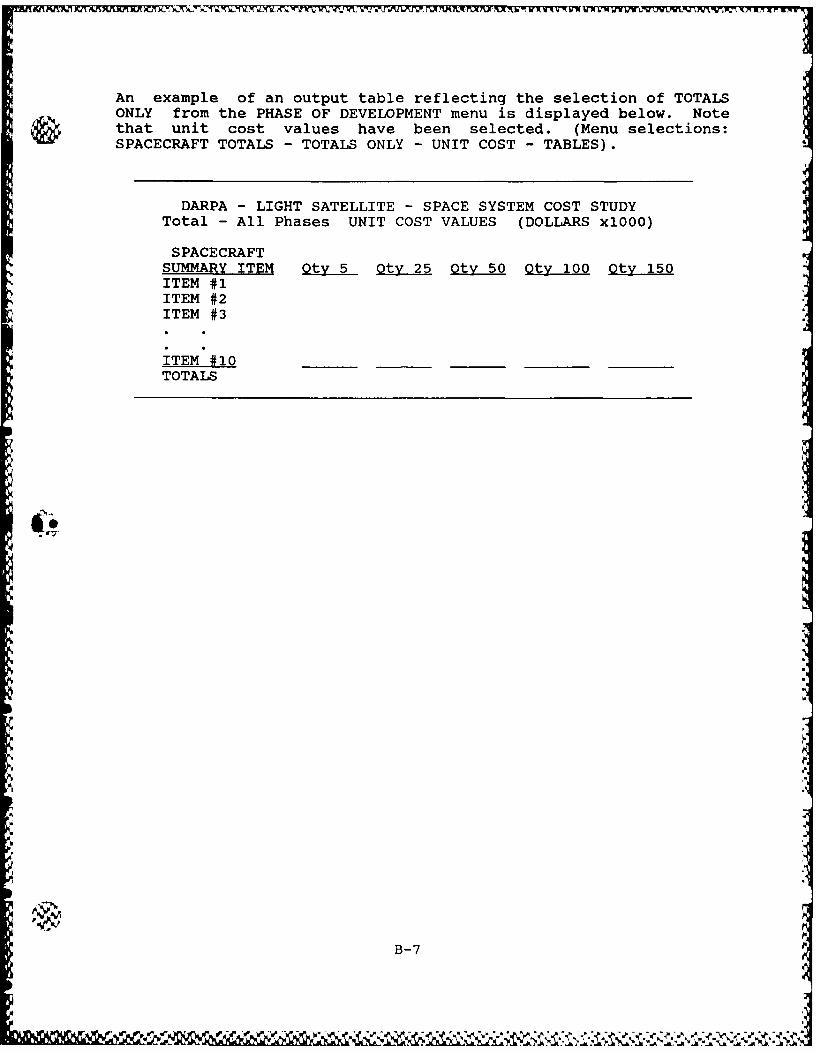
An example of an output table reflecting the selection of TOTALSONLY from the PHASE OF DEVELOPMENT menu is displayed below. Notethat unit cost values have been selected. (Menu selections:SPACECRAFT TOTALS - TOTALS ONLY - UNIT COST - TABLES).
DARPA - LIGHT SATELLITE - SPACE SYSTEM COST STUDYTotal - All Phases UNIT COST VALUES (DOLLARS xl000)
SPACECRAFTSUMMARY ITEM Qty 5 Otv 25 Oty 50 Otv 100 Otv 150ITEM #1ITEM #2ITEM #3
ITEM #10TOTALS
B-7
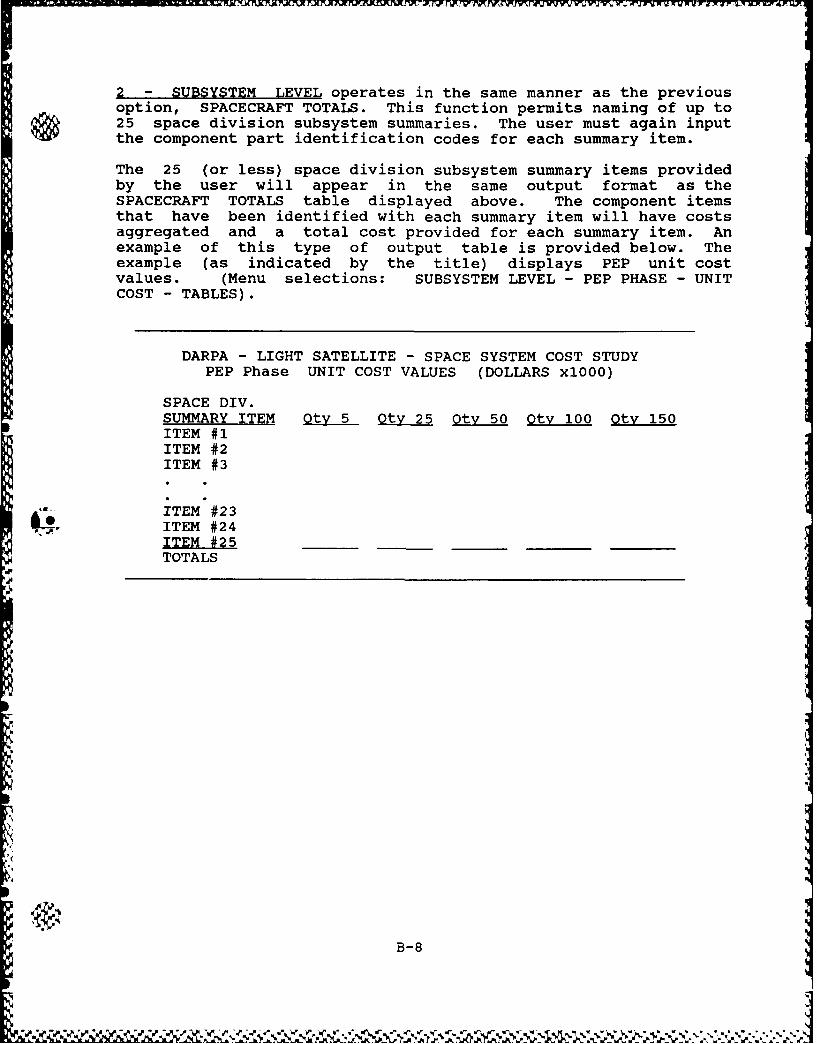
,- k fVK ) r7U w -- -7-- , r - .W U, W
2 - SUBSYSTEM LEVEL operates in the same manner as the previousoption, SPACECRAFT TOTALS. This function permits naming of up to25 space division subsystem summaries. The user must again inputthe component part identification codes for each summary item.
The 25 (or less) space division subsystem summary items providedby the user will appear in the same output format as theSPACECRAFT TOTALS table displayed above. The component itemsthat have been identified with each summary item will have costsaggregated and a total cost provided for each summary item. Anexample of this type of output table is provided below. Theexample (as indicated by the title) displays PEP unit costvalues. (Menu selections: SUBSYSTEM LEVEL - PEP PHASE - UNITCOST - TABLES).
DARPA - LIGHT SATELLITE - SPACE SYSTEM COST STUDYPEP Phase UNIT COST VALUES (DOLLARS xl000)
SPACE DIV.SUMMARY ITEM Otv 5 O tv 25 Oty 50 Otv 100 Otv 150ITEM #1ITEM #2ITEM #3
ITEM #23ITEM #24ITEM #25TOTALS
B-8
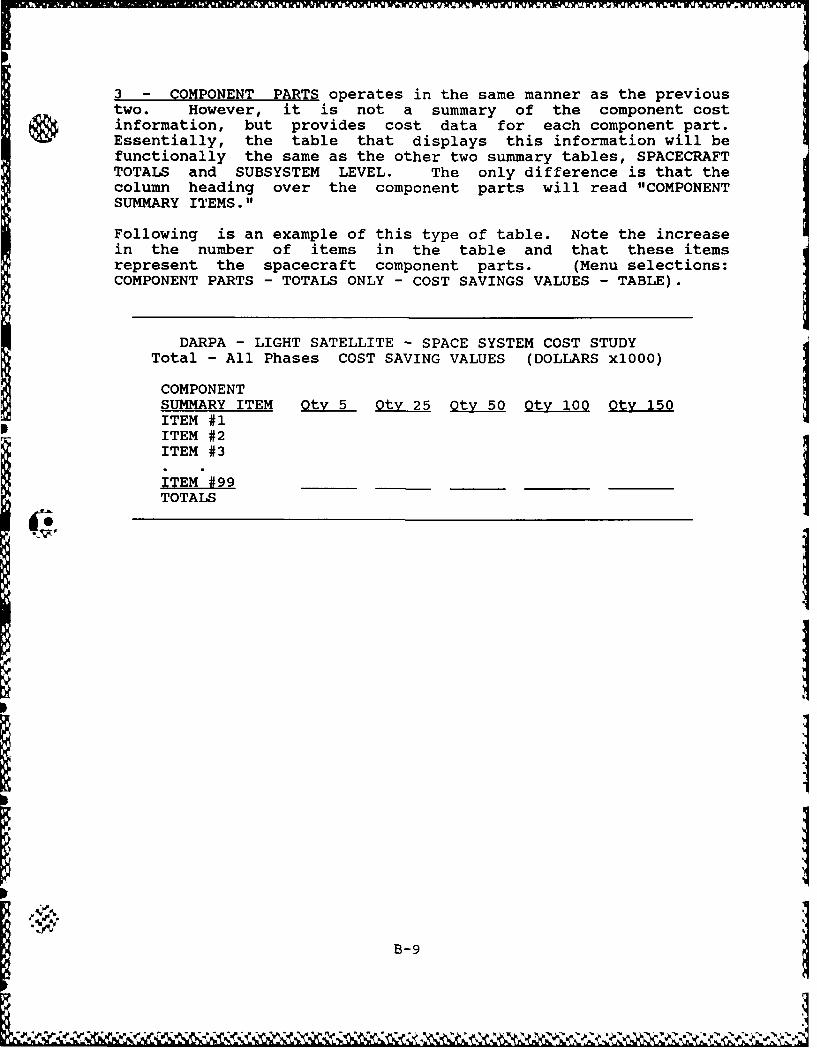
3 - COMPONENT PARTS operates in the same manner as the previoustwo. However, it is not a summary of the component costinformation, but provides cost data for each component part.Essentially, the table that displays this information will befunctionally the same as the other two summary tables, SPACECRAFTTOTALS and SUBSYSTEM LEVEL. The only difference is that thecolumn heading over the component parts will read "COMPONENTSUMMARY ITEMS."
Following is an example of this type of table. Note the increasein the number of items in the table and that these itemsrepresent the spacecraft component parts. (Menu selections:COMPONENT PARTS - TOTALS ONLY - COST SAVINGS VALUES - TABLE).
DARPA - LIGHT SATELLITE - SPACE SYSTEM COST STUDYTotal - All Phases COST SAVING VALUES (DOLLARS xl000)
COMPONENTSUMMARY ITEM Qt 5. Otv 25 Otv 50 Otv 100 Otv 150
ITEM #2ITEM #2ITEM #3
ITEM #99 _ _ _ _ _ _ _ _ _ _ _ _ _ _ _
TOTALS
BI
B-9j
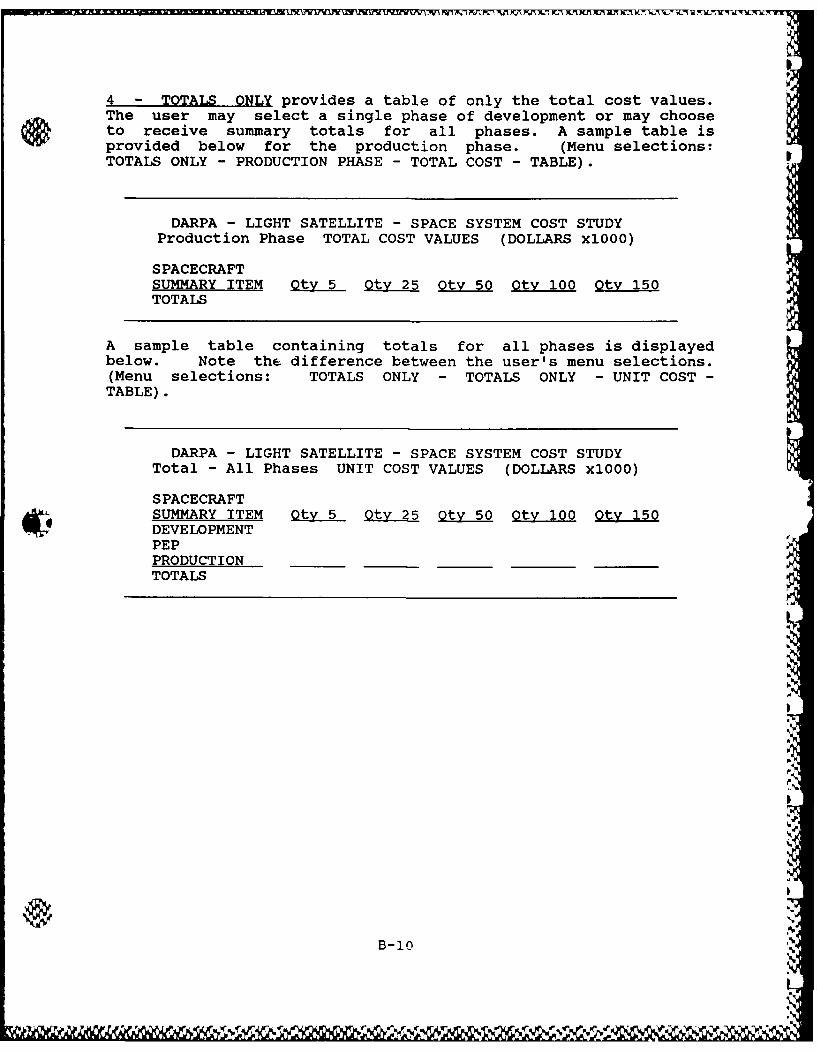
IL MAJV ILA WI2 -1-,1 LM A
4 - TOTALS ONLY provides a table of only the total cost values.The user may select a single phase of development or may chooseto receive summary totals for all phases. A sample table isprovided below for the production phase. (Menu selections:TOTALS ONLY - PRODUCTION PHASE - TOTAL COST - TABLE).
DARPA - LIGHT SATELLITE - SPACE SYSTEM COST STUDYProduction Phase TOTAL COST VALUES (DOLLARS xl000)
SPACECRAFTSUMMARY ITEM Otv 5 Otv 25 Otv 50 Otv 100 Otv 150TOTALS
A sample table containing totals for all phases is displayedbelow. Note the difference between the user's menu selections.(Menu selections: TOTALS ONLY - TOTALS ONLY - UNIT COST -
TABLE).
DARPA - LIGHT SATELLITE - SPACE SYSTEM COST STUDYTotal - All Phases UNIT COST VALUES (DOLLARS xl000)
SPACECRAFTSUMMARY ITEM Oty 5 Ot 25 Otv 50 Otv 100 Otv 150EPDEVELOPMENTPEPPRODUCTIONTOTALS
B1
I
B-I 10
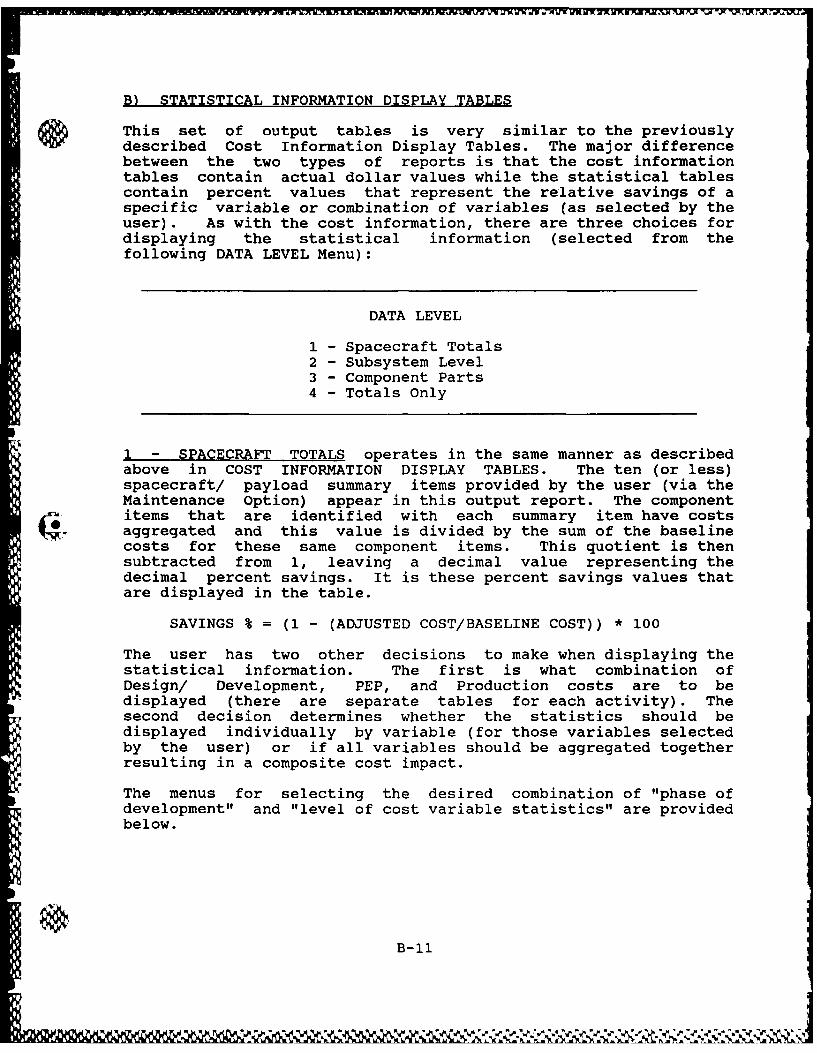
B) STATISTICAL INFORMATION DISPLAY TABLES
S This set of output tables is very similar to the previouslydescribed Cost Information Display Tables. The major differencebetween the two types of reports is that the cost informationtables contain actual dollar values while the statistical tablescontain percent values that represent the relative savings of aspecific variable or combination of variables (as selected by theuser). As with the cost information, there are three choices fordisplaying the statistical information (selected from thefollowing DATA LEVEL Menu):
DATA LEVEL
1 - Spacecraft Totals2 - Subsystem Level3 - Component Parts4 - Totals Only
1 - SPACECRAFT TOTALS operates in the same manner as describedabove in COST INFORMATION DISPLAY TABLES. The ten (or less)spacecraft/ payload summary items provided by the user (via theMaintenance Option) appear in this output report. The componentitems that are identified with each summary item have costsaggregated and this value is divided by the sum of the baselinecosts for these same component items. This quotient is thensubtracted from 1, leaving a decimal value representing thedecimal percent savings. It is these percent savings values thatare displayed in the table.
SAVINGS % = (1 - (ADJUSTED COST/BASELINE COST)) * 100
The user has two other decisions to make when displaying thestatistical information. The first is what combination ofDesign/ Development, PEP, and Production costs are to bedisplayed (there are separate tables for each activity). Thesecond decision determines whether the statistics should bedisplayed individually by variable (for those variables selectedby the user) or if all variables should be aggregated togetherresulting in a composite cost impact.
The menus for selecting the desired combination of "phase ofdevelopment" and "level of cost variable statistics" are providedbelow.
B-11
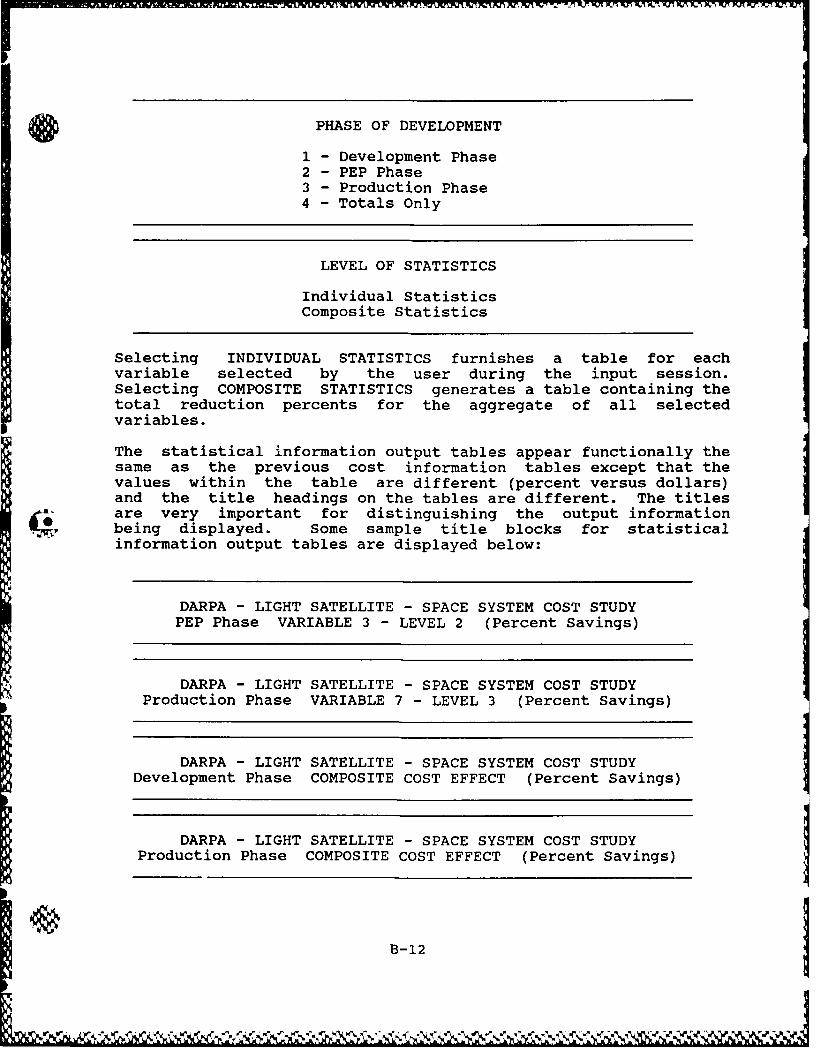
PHASE OF DEVELOPMENT
1 - Development Phase2 - PEP Phase3 - Production Phase4 - Totals Only
LEVEL OF STATISTICS
Individual StatisticsComposite Statistics
Selecting INDIVIDUAL STATISTICS furnishes a table for eachvariable selected by the user during the input session.Selecting COMPOSITE STATISTICS generates a table containing thetotal reduction percents for the aggregate of all selectedvariables.
The statistical information output tables appear functionally thesame as the previous cost information tables except that thevalues within the table are different (percent versus dollars)and the title headings on the tables are different. The titlesare very important for distinguishing the output informationbeing displayed. Some sample title blocks for statistical
information output tables are displayed below:
DARPA - LIGHT SATELLITE - SPACE SYSTEM COST STUDYPEP Phase VARIABLE 3 - LEVEL 2 (Percent Savings)
DARPA - LIGHT SATELLITE - SPACE SYSTEM COST STUDYProduction Phase VARIABLE 7 - LEVEL 3 (Percent Savings)
DARPA - LIGHT SATELLITE - SPACE SYSTEM COST STUDYDevelopment Phase COMPOSITE COST EFFECT (Percent Savings)
DARPA - LIGHT SATELLITE - SPACE SYSTEM COST STUDYProduction Phase COMPOSITE COST EFFECT (Percent Savings)
B-12
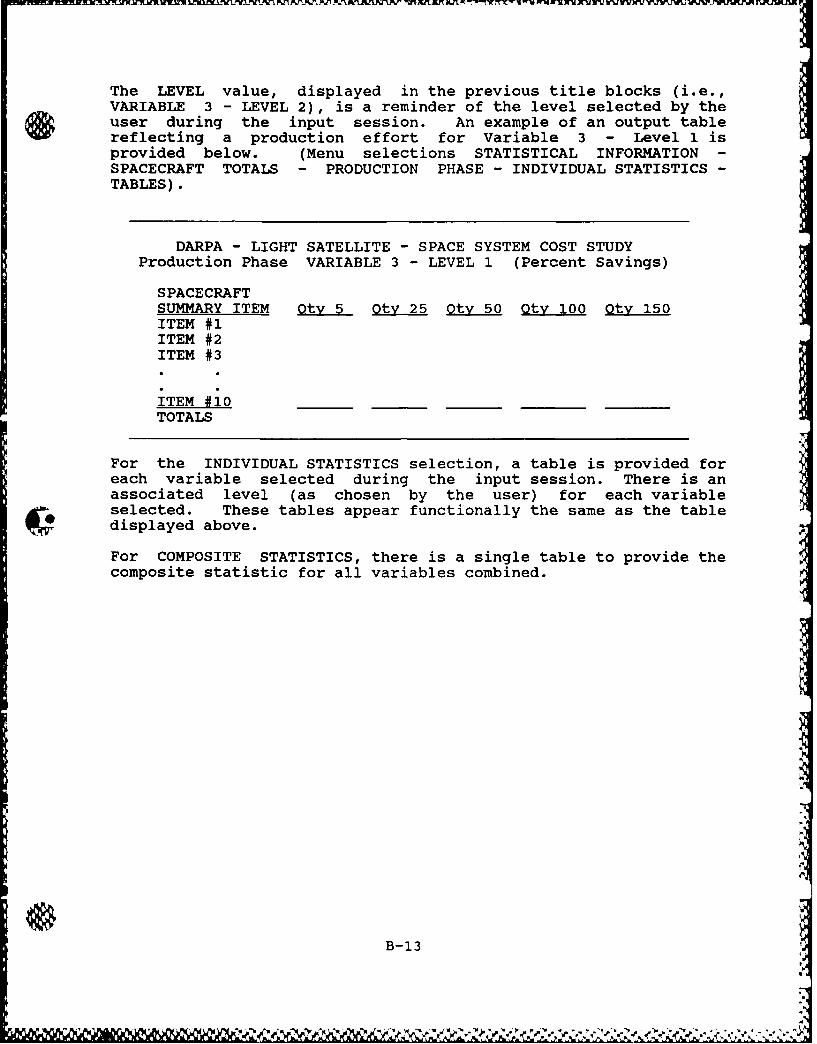
The LEVEL value, displayed in the previous title blocks (i.e.,VARIABLE 3 - LEVEL 2), is a reminder of the level selected by theuser during the input session. An example of an output tablereflecting a production effort for Variable 3 - Level 1 isprovided below. (Menu selections STATISTICAL INFORMATION -SPACECRAFT TOTALS - PRODUCTION PHASE - INDIVIDUAL STATISTICS -TABLES).
DARPA - LIGHT SATELLITE - SPACE SYSTEM COST STUDYProduction Phase VARIABLE 3 - LEVEL 1 (Percent Savings)
SPACECRAFTSUMMARY ITEM Oty 5 Oty 25 Otv 50 Otv 100 Oty 150ITEM #1ITEM #2ITEM #3
ITEM #10TOTALS
For the INDIVIDUAL STATISTICS selection, a table is provided foreach variable selected during the input session. There is anassociated level (as chosen by the user) for each variableselected. These tables appear functionally the same as the tabledisplayed above.
For COMPOSITE STATISTICS, there is a single table to provide thecomposite statistic for all variables combined.
B-13

2 - SUBSYSTEM LEVEL operates in the same manner as described inthe previous option, SPACECRAFT TOTALS. It allows the user toretrieve up to 25 subsystem summary items of his/her choice. Theuser dictates which components fall under the summary item byproviding the component item identification codes. Thisoperation may be performed via the Maintenance function (see FILEOPERATIONS/ MAINTENANCE).
The 25 (or less) subsystem summary items provided by the userappear in this output report. The format for this statisticalinformation is similar to that of the cost report. The componentitems that have been identified under each summary item will havecosts aggregated and a percent savings value (as compared to thebaseline) is provided for each summary item.
SAVINGS % = (1 - (ADJUSTED COST/BASELINE COST)) * 100
An example of this type of output table is provided below. Theexample (as indicated by the title) is PEP, Composite Cost Effectvalues. Thus, the table contains values representing the totalcost savings of all variables combined (as selected by the user)for the PEP Phase. (Menu selections: STATISTICAL INFORMATION -SUBSYSTEM LEVEL - PEP PHASE - COMPOSITE STATISTICS - TABLE).
DARPA - LIGHT SATELLITE - SPACE SYSTEM COST STUDYPEP Phase COMPOSITE COST EFFECT (Percent Savings)
SPACE DIV.SUMMARY ITEM Oty 5 Otv 25 Otv 50 Qty 100 Otv 150ITEM #1ITEM #2ITEM #3
ITEM if2 3ITEM #24
ITEM #25TOTALS
B-14
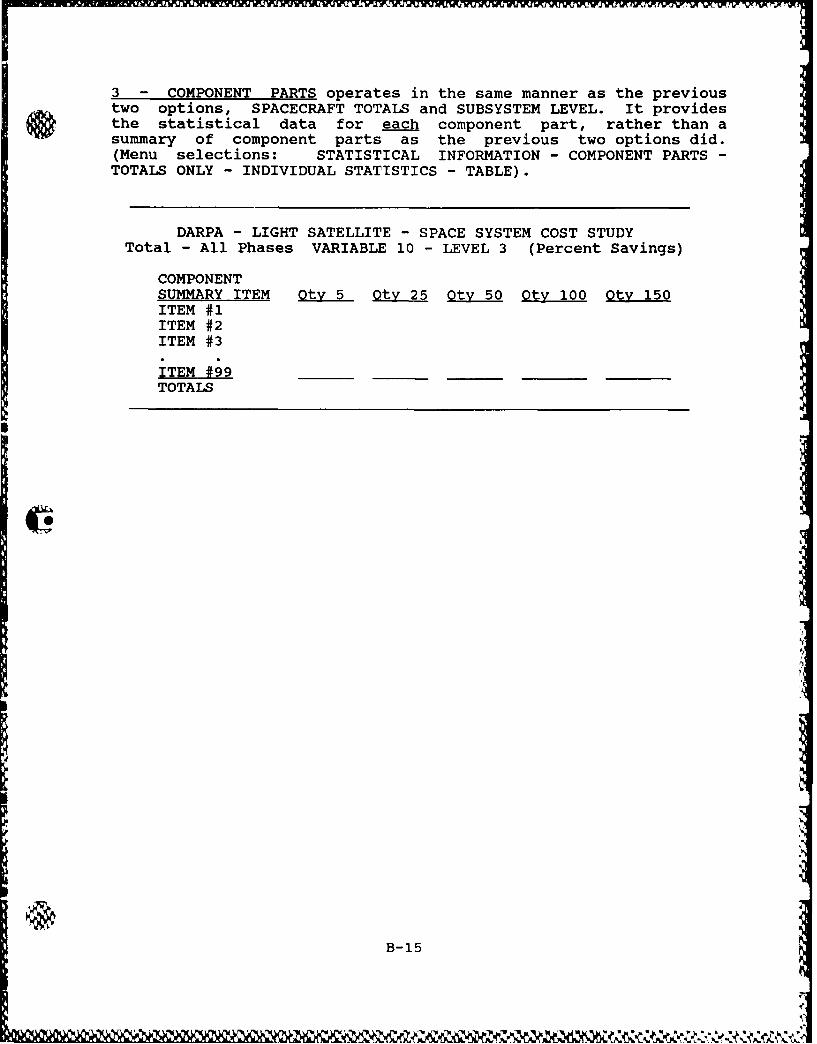
"K . -,J
3 - COMPONENT PARTS operates in the same manner as the previoustwo options, SPACECRAFT TOTALS and SUBSYSTEM LEVEL. It providesthe statistical data for each component part, rather than asummary of component parts as the previous two options did.(Menu selections: STATISTICAL INFORMATION - COMPONENT PARTS -
TOTALS ONLY - INDIVIDUAL STATISTICS - TABLE).
DARPA - LIGHT SATELLITE - SPACE SYSTEM COST STUDYTotal - All Phases VARIABLE 10 - LEVEL 3 (Percent Savings)
COMPONENTSUMMARY ITEM Ot 5. Otv 25 Otv 50 Oty 100 Oty 150ITEM #1ITEM #2ITEM #3
ITEM #99TOTALS
B-15
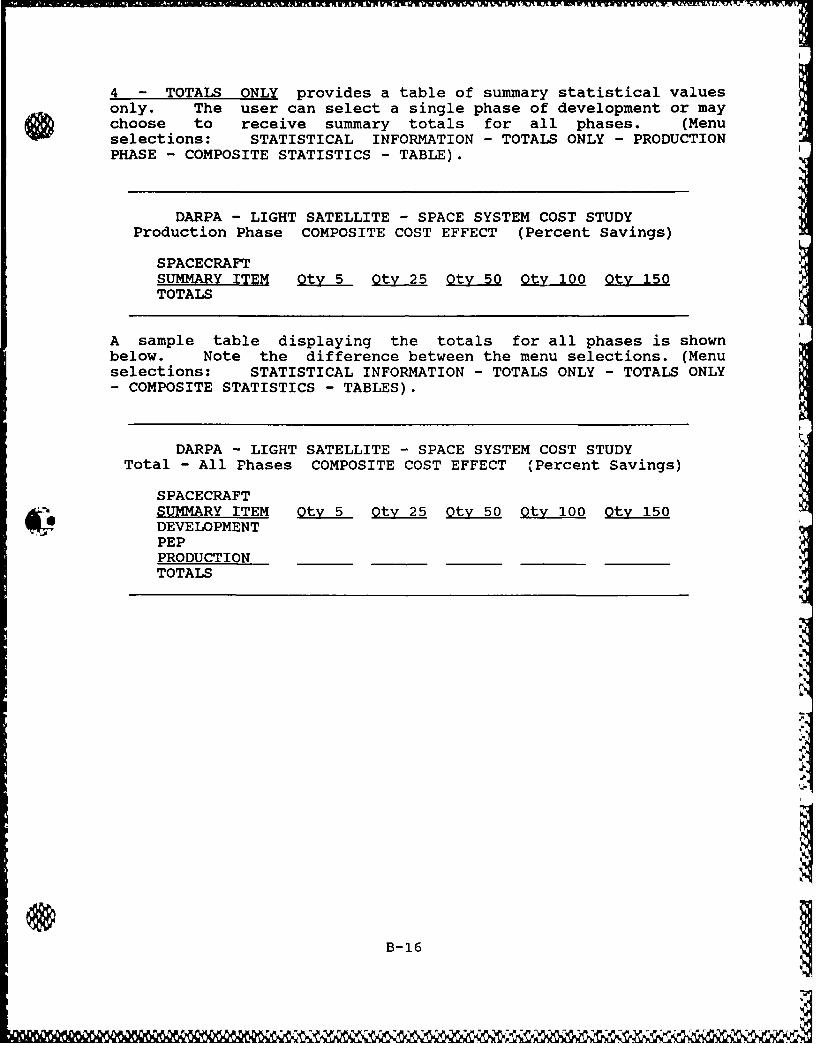
4 - TOTALS ONLY provides a table of summary statistical valuesonly. The user can select a single phase of development or maychoose to receive summary totals for all phases. (Menuselections: STATISTICAL INFORMATION - TOTALS ONLY - PRODUCTIONPHASE - COMPOSITE STATISTICS - TABLE).
DARPA - LIGHT SATELLITE - SPACE SYSTEM COST STUDYProduction Phase COMPOSITE COST EFFECT (Percent Savings)
SPACECRAFTSUMMARY ITEM Otv 5 Otv 25 Otv 50 Otv 100 Oty 150TOTALS
A sample table displaying the totals for all phases is shownbelow. Note the difference between the menu selections. (Menuselections: STATISTICAL INFORMATION - TOTALS ONLY - TOTALS ONLY- COMPOSITE STATISTICS - TABLES).
DARPA - LIGHT SATELLITE - SPACE SYSTEM COST STUDYTotal - All Phases COMPOSITE COST EFFECT (Percent Savings)
SPACECRAFTSUMMARY ITEM Otv 5 Otv 25 Otv 50 Otv 100 Oty 150DEVELOPMENT
PEPPRODUCTIONTOTALS
b,
I
B-16

C) COST INFORMATION GRAPHICAL DISPLAYS
This section describes how the cost values for the LightSatellite conceptual design are provided in graphical format.This capability gives all combinations of cost data except forCOMPONENT PARTS. The discrete selections provided by the outputmenus are as follows:
DATA LEVEL
1 - Spacecraft Totals2 - Subsystem Level3 - Component Parts (not provided)4 - Totals Only
PHASE OF DEVELOPMENT
1 - Development Phase2 - PEP Phase3 - Production Phase4 - All Phases
TYPE OF COST VALUES
Total CostUnit CostCost Savings
DISPLAY FORMAT
Line GraphBar Chart
f the user selects either SPACECRAFT TOTALS or SUBSYSTEM LEVELfrom the DATA LEVEL menu, he/she receives one of two additionalmenus. These menus allow the user to narrow the scope of outputinformation to specific spacecraft items or subsystems. Themenus contain a list of summary items and the user can choose thespecific items he/she wishes to view. The summary items areconfigured in the MAINTENANCE function (see FILE OPERATIONS/MAINTENANCE). The user specifies which component part costsshould be contained in each summary item. A sample DATA SUBLEVELmenu follows.
B-17

DATA SUBLEVEL
1 - Comm Payload2 - Electronics3 - Structures4 - Assembly/Integration5 - Test6 - Totals Only
The user has the additional option of specifying the format forthe graph. He/she can choose a line graph or a bar graph forviewing cost information. Specifying the format of the graph ispossible in the menu called DISPLAY FORMAT. Sample graphicaldisplays are provided on the following pages. The format of thegraphical displays is representative of how all similar cost dataare displayed.
The cost information graphical displays use almost the sameheadings as the table displays, space permitting. Two samplegraphical display title blocks are:
Production PhaseComm PayloadTotal Cost Values (Dollars xl000)
Development PhaseAll SubsystemsUnit Cost Values (Dollars xl000)
B1

COST INFORMATION - LINE GRAPH DISPLAYS
1 - SPACECRAFT TOTALS - The user receives from one to tengraphical displays depending on the number of Spacecraft/Payloadsummary items that have been configured in the maintenance phaseand the number of summary items that were selected from the DATASUBLEVEL Menu. The total cost, unit cost, or cost savings forDevelopment, PEP, Production, or total of all phases (dependingon the user's selections) for each summary item (one to ten) isgraphed against production quantity. The cost scale is they-axis, and the production quantity (five to 150) is the x-axis.The function represents the total cost curve, unit cost curve, orcost savings curve for different production quantities.
2 - SUBSYSTEM LEVEL - The user receives from one to 25 graphicaldisplays depending on the number of Space Division Subsystemsummary items that were configured in the maintenance phase andthe number of those summary items selected from the DATA SUBLEVELmenu. The total cost, unit cost, or cost savings values forDevelopment, PEP, Production, or total of all phases (dependingon the user's selections) for each summary item (one to 25) isgraphed against production quantity. The cost scale is they-axis, and the production quantity (five to 150) is the x-axis.The function represents the total cost curve, unit cost curve, orcost savings curve for different production quantities.
3 - COMPONENT PARTS - The DARPASS does not provide graphicaldisplays to the component part level.
4 - TOTALS ONLY - The user receives one (1) graphical display.The total cost, unit cost, or cost savings values forDevelopment, PEP, Production or total of all phases (depending onthe user's selections) is graphed against production quantity.The cost scale is the y-axis and the production quantity (five to150) is the x-axis. The function represents the total costcurve, unit cost curve, or cost savings curve for differentproduction quantities.
SEE FOLLOWING PAGES FOR COST INFORMATIONLINE GRAPH DISPLAY EXAMPLES.
B-19
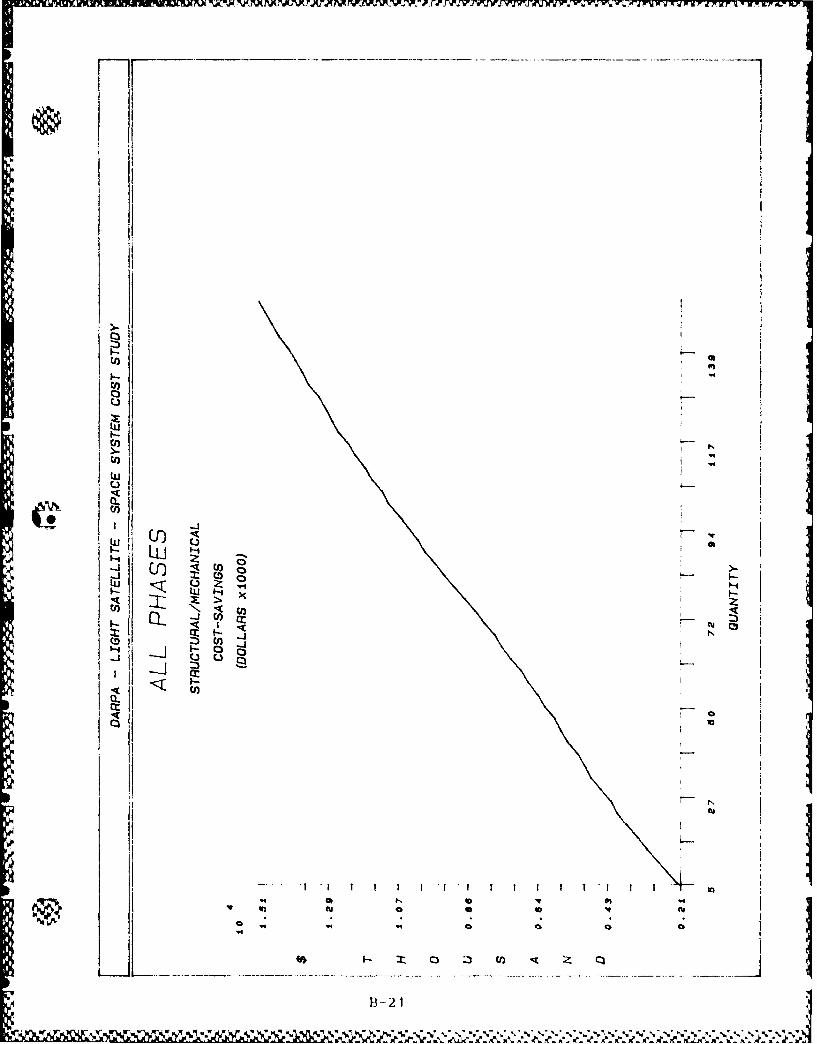
-x
z C)~c
I.-n
B-21
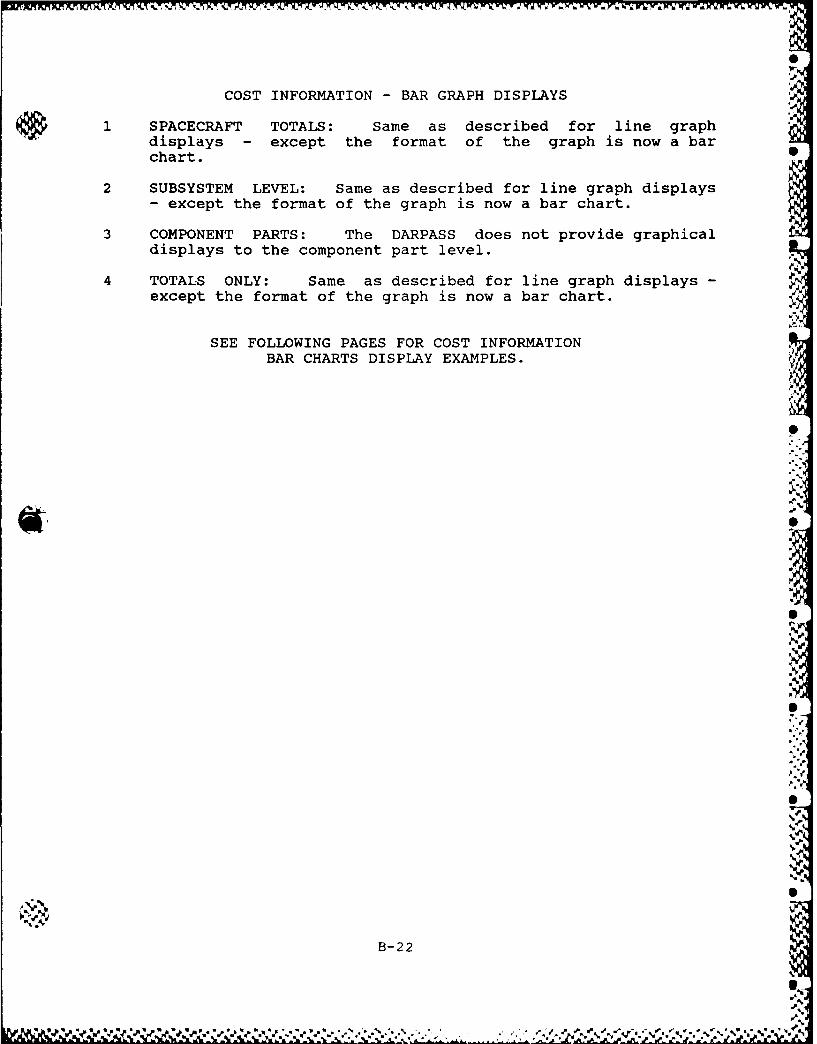
'-i
COST INFORMATION - BAR GRAPH DISPLAYS
1 SPACECRAFT TOTALS: Same as described for line graphdisplays - except the format of the graph is now a barchart.
2 SUBSYSTEM LEVEL: Same as described for line graph displays- except the format of the graph is now a bar chart.
3 COMPONENT PARTS: The DARPASS does not provide graphicaldisplays to the component part level.
4 TOTALS ONLY: Same as described for line graph displays -except the format of the graph is now a bar chart.
SEE FOLLOWING PAGES FOR COST INFORMATIONBAR CHARTS DISPLAY EXAMPLES.
B2S
U",S
B-22
".'
;%' : ;;,;; : ,: ' ,: ,2 .' ,,.'-'.:..?<'. ,...'' •. .' :-' '.' S~v..' ..9..'. '- "" "" .V ', %,

'C
CD.
4-
'C I
4J E
OIL
%-j
B-2
0Z :.-
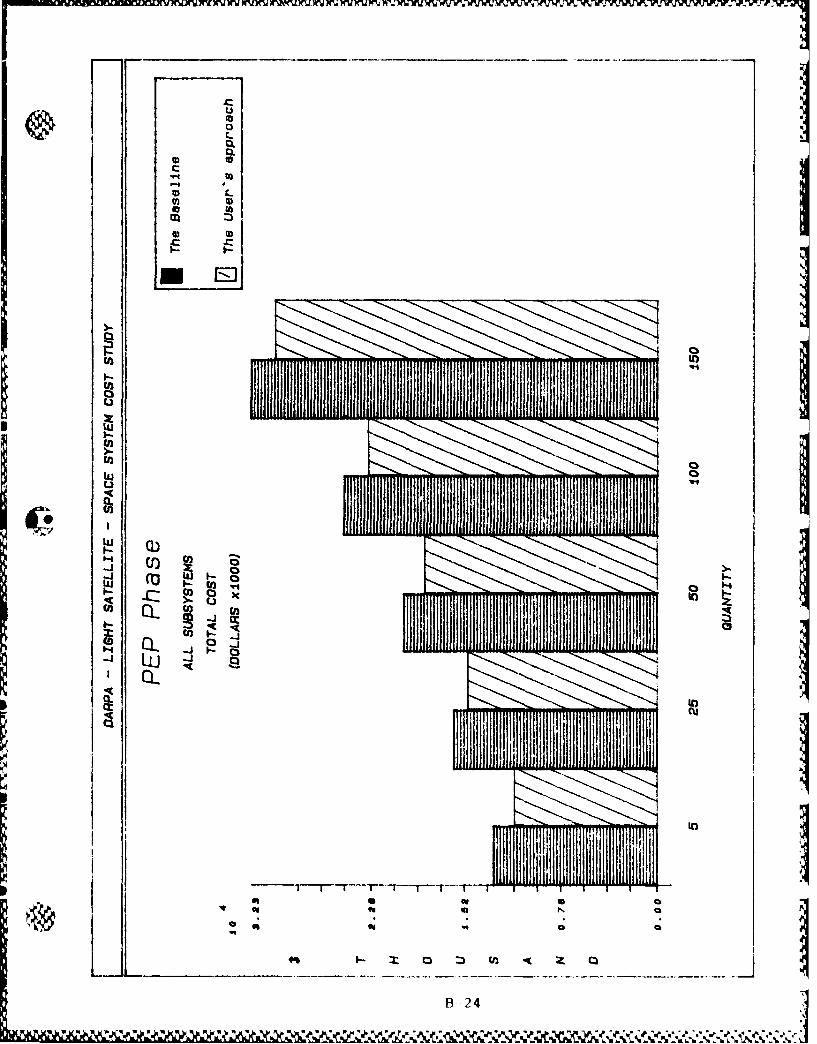
- -
L
0.
IIn
to t
.I-.to
LUIQ
cc 0
(33
N N--
In
B -24]
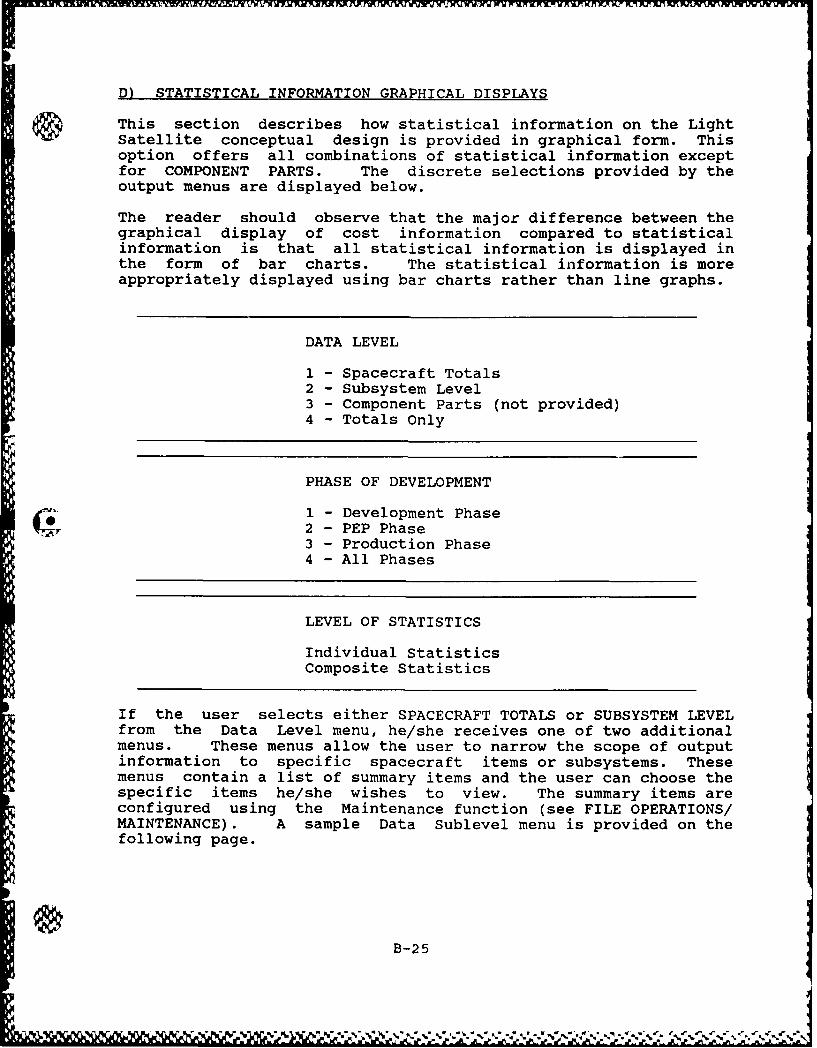
D) STATISTICAL INFORMATION GRAPHICAL DISPLAYS
S This section describes how statistical information on the LightSatellite conceptual design is provided in graphical form. Thisoption offers all combinations of statistical information exceptfor COMPONENT PARTS. The discrete selections provided by theoutput menus are displayed below.
The reader should observe that the major difference between thegraphical display of cost information compared to statisticalinformation is that all statistical information is displayed inthe form of bar charts. The statistical information is moreappropriately displayed using bar charts rather than line graphs.
DATA LEVEL
1 - Spacecraft Totals2 - Subsystem Level3 - Component Parts (not provided)4 - Totals Only
PHASE OF DEVELOPMENT
1 - Development Phase2 - PEP Phase3-Production Phase4 - All Phases
LEVEL OF STATISTICS
Individual StatisticsComposite Statistics
If the user selects either SPACECRAFT TOTALS or SUBSYSTEM LEVELfrom the Data Level menu, he/she receives one of two additionalmenus. These menus allow the user to narrow the scope of outputinformation to specific spacecraft items or subsystems. Thesemenus contain a list of summary items and the user can choose thespecific items he/she wishes to view. The summary items areconfigured using the Maintenance function (see FILE OPERATIONS/MAINTENANCE). A sample Data Sublevel menu is provided on thefollowing page.
B-25
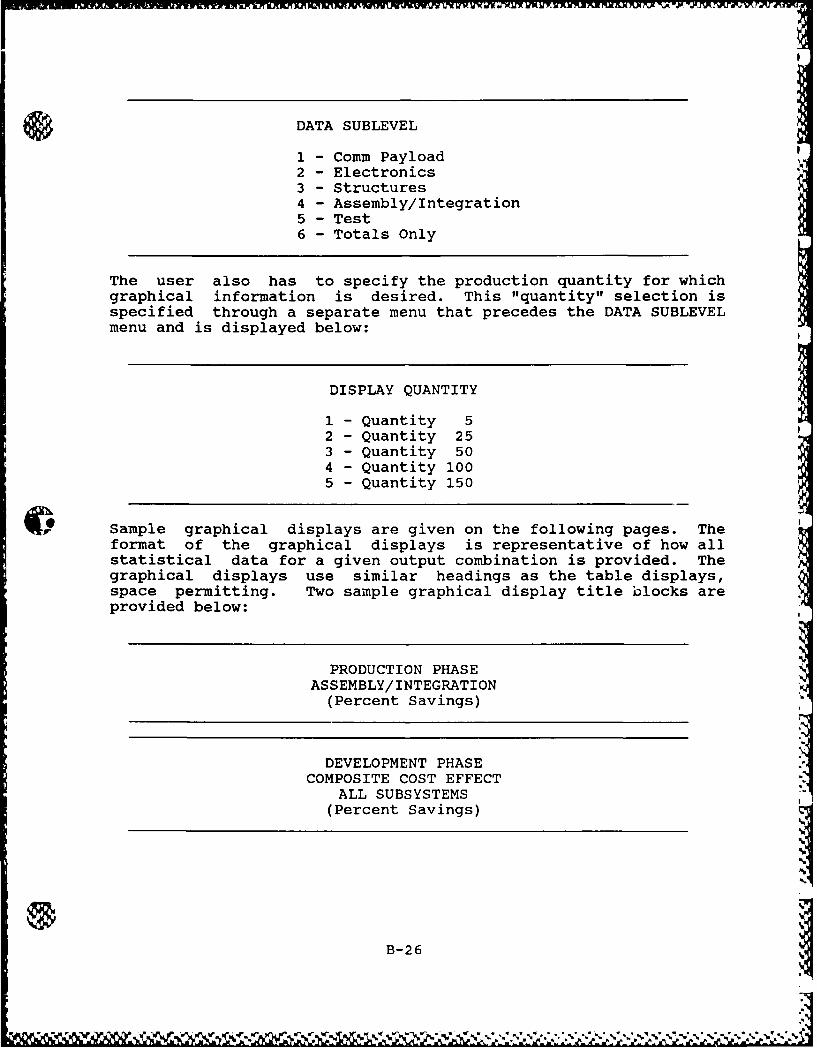
DATA SUBLEVEL
1 - Comm Payload2 - Electronics3 - Structures4 - Assembly/Integration5 - Test6 - Totals Only
The user also has to specify the production quantity for whichgraphical information is desired. This "quantity" selection isspecified through a separate menu that precedes the DATA SUBLEVELmenu and is displayed below:
DISPLAY QUANTITY
1 - Quantity 52 - Quantity 253 - Quantity 504 - Quantity 1005 - Quantity 150
Sample graphical displays are given on the following pages. Theformat of the graphical displays is representative of how allstatistical data for a given output combination is provided. Thegraphical displays use similar headings as the table displays,space permitting. Two sample graphical display title blocks areprovided below:
PRODUCTION PHASEASSEMBLY/INTEGRATION(Percent Savings)
DEVELOPMENT PHASECOMPOSITE COST EFFECT
ALL SUBSYSTEMS(Percent Savings)
B-26
INDIVIDUAL STATISTICS
1 - SPACECRAFT TOTALS - The user receives from one to tengraphical displays depending on the number of Spacecraft/Payloadsummary items that have been selected by the user. Each of thegraphs represent a specific production quantity as selected inteh DISPLAY QUANTITY menu below.
DISPLAY QUANTITY
1 - Quantity 52 - Quantity 253 - Quantity 504 - Quantity 1005 - Quantity 150
The total percent cost savings values for Development, PEP,Production or total of all phases (depending on the user'sselections) for each summary item (one to ten) is graphed againstthe Primary and Secondary Cost Variables. These cost savingsvalues represent the relative savings of each summary item to itsown baseline cost value.
The cost savings percents are the y-axis and the cost variables(one to 11) are the x-axis. The histograms represent the totalcost savings percents for the Primary and Secondary CostVariables. The x-axis is scaled for 11 variables. The onlyhistograms that are present are those representing the costvariables that were selected by the user. Thus, there may bebetween one and 11 histograms. The height of the histogramsrepresents the relative cost savings percents for the Primary orSecondary Cost Variables for the summary item when compared toits own baseline cost value.
There are occasions when there are fewer histograms than thenumber of Primary or Secondary Cost Variables selected. This isbecause some variables may have no impact on a particular summaryitem.
B-27
I

2 - SUBSYSTEM LEVEL - The user receives from one to 25 graphicaldisplays for the Space Division Subsystem summary items. Eachgraph depicts a specific production quantity as selected in theDISPLAY QUANTITY menu. The total percent cost savings values forDevelopment, PEP, Production or total of all phases (depending onthe user's selections) for each summary item (one to 25) isgraphed against the cost variables. These cost savings valuesrepresent the relative savings of each summary item to thatsummary item's baseline cost value.
The cost savings percents are the y-axis and the cost variables(one to 11) are the x-axis. The histograms represent the totalcost savings percents for the Primary and Secondary CostVariables. The x-axis is scaled for 11 variables. The onlyhistograms that are present are those that represent the costvariables selected by the user. Thus, there may be between oneand 11 histograms. The height of the histograms represents the 0relative cost savings percents for the Primary or Secondary CostVariables for the item compared to its own baseline cost.
There are times when there are fewer histograms than the numberof Primary or Secondary Cost Variables selected. This is becausesome variables may have no cost impact on a particular item.
3 - COMPONENT PARTS - The DARPASS will not provide graphicaldisplays to the component part level.
4 - TOTALS ONLY - The user receives one (1) graphical display.The total cost savings percents for Development, PEP, Productionor total of all phases (depending on the user's selections) isgraphed against the Primary and Secondary Cost Variables. Thegraph represents a specific production quantity as selectedthrough the DISPLAY QUANTITY menu.
The cost savings scale is the y-axis and the cost variables (oneto 11) is the x-axis. The histograms represent the total costsavings percents for the different cost variables versus thetotal baseline cost. The total percent cost savings values forDevelopment, PEP, Production or total of all phases (depending onthe user's selections) are graphed against cost variables. Thesecost savings values represent the absolute savings of eachvariable with respect to the total baseline cost.
SEE FOLLOWING PAGE FOR INDIVIDUAL STATISTICSBAR CHART DISPLAY EXAMPLE.
B-28
.. g..
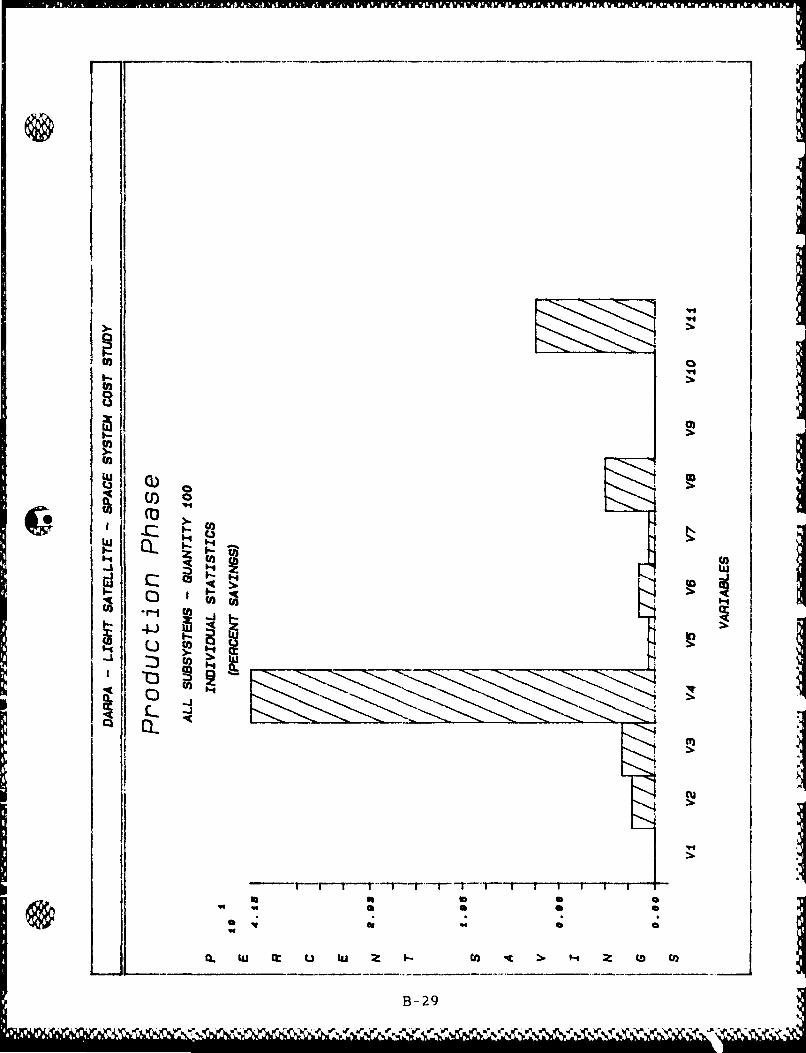
- _ _ __ _ __ _
zI'Il
U :C .4 '
a
1(11

COMPOSITE STATISTICS
- SPACECRAFT TOTALS - This output option, graphical compositestatistics, operates in a similar manner to the previouslydetailed individual statistics. The user receives from one toten graphical displays with each of the graphs representing aspecific production quantity.
The total percent cost savings values for Development, PEP,Production, or total of all phases for each summary item aregraphed against the Cost Variables. These cost savings valuesrepresent the absolute savings of each summary item to the totalbaseline cost value. This absolute cost value for CompositeStatistics should be distinguished from the relative cost valueof the Individual Statistics. "Relative" represents the costsavings percent of a summary item with respect to itself(baseline cost). "Absolute" represents the cost savings percentsof a summary item with respect to the baseline cost of allsummary items combined (total cost of the spacecraft).
The cost savings percents are the y-axis, and the cost variables(one to 11) are the x-axis. The histograms represent the totalcost savings percents for different cost variables. The x-axisis scaled for 11 variables. The only histograms that are presentare those that represent Cost Variables that have been selected.Thus, there may be between one and 11 histograms. The height ofthe histograms represents the absolute cost savings percents forthe Primary or Secondary Cost Variable for the summary itemcompared to the total baseline cost.
There are occasions when there are fewer histograms than thenumber of Primary or Secondary Cost Variables selected. This isbecause some variables may have no impact on a particular item.
S
2 - SUBSYSTEM LEVEL operates in much the same way as individualstatistics detailed above. The user receives from one to 25graphical displays. Each graph is for a specific productionquantity as selected by the user through the DISPLAY SAVINGSmenu.
The total percent cost savings values for Development, PEP,Production, or total of all phases for each summary item isgraphed against the Cost Variables. These cost savings valuesrepresent the absolute savings of each summary item to the totalbaseline cost value. This absolute cost value for CompositeStatistics should be distinguished from the relative value of theIndividual Statistics. "Relative" represents the cost savingspercent of a summary item with respect to itself (baselinecost). "Absolute" represents the cost savings percents of asummary item with respect to the baseline cost of the totalspacecraft.
B-30
The cost savings percents are the y-axis, and the cost variables(one to 11) are the x-axis. The histograms represent the totalcost savings percents for different cost variables. The onlyhistograms that are present are those selected by the user.Thus, there may be between one and 11 histograms. The height ofthe histograms represents the absolute cost savings percents forthe Primary or Secondary Cost Variables for the summary item,compared to the total baseline cost.
There are instances where there will be fewer histograms than thenumber of Primary or Secondary Cost Variables selected. This isbecause some variables may have no impact on a particular item.
3 - COMPONENT PARTS - The DARPASS does not provide graphicaldisplays to the component part level.
4 - TOTALS ONLY - The user receives one (1) graphical display.The total cost savings percents for Development, PEP, Productionor total of all phases (depending on the user's selections) isgraphed against the 11 cost variables. The graph is for aspecific production quantity as selected by the user in theDISPLAY SAVINGS menu.
The cost savings scale is the y-axis and the cost variables (oneto 11) are the x-axis. The histograms represent the total cost
,T savings percents for the different cost variables. These costsavings values represent the absolute savings of each variable(and selected quantity) to the total baseline cost value.
SEE FOLLOWING PAGE FOR COMPOSITE STATISTICSBAR CHART DISPLAY EXAMPLE.
B-31
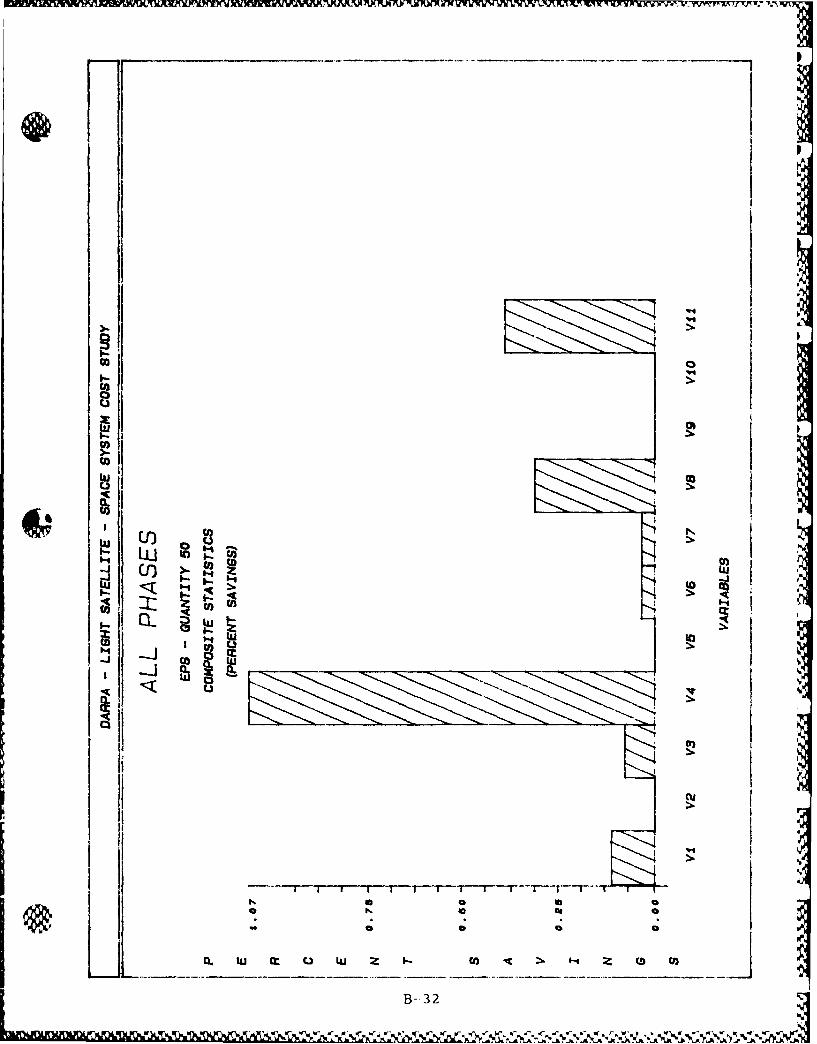
-~~~~~rrj ________T_______ T p
00
lu1
U)-
1-4
CL
m Uwz -
HI -J CO.'-
or5
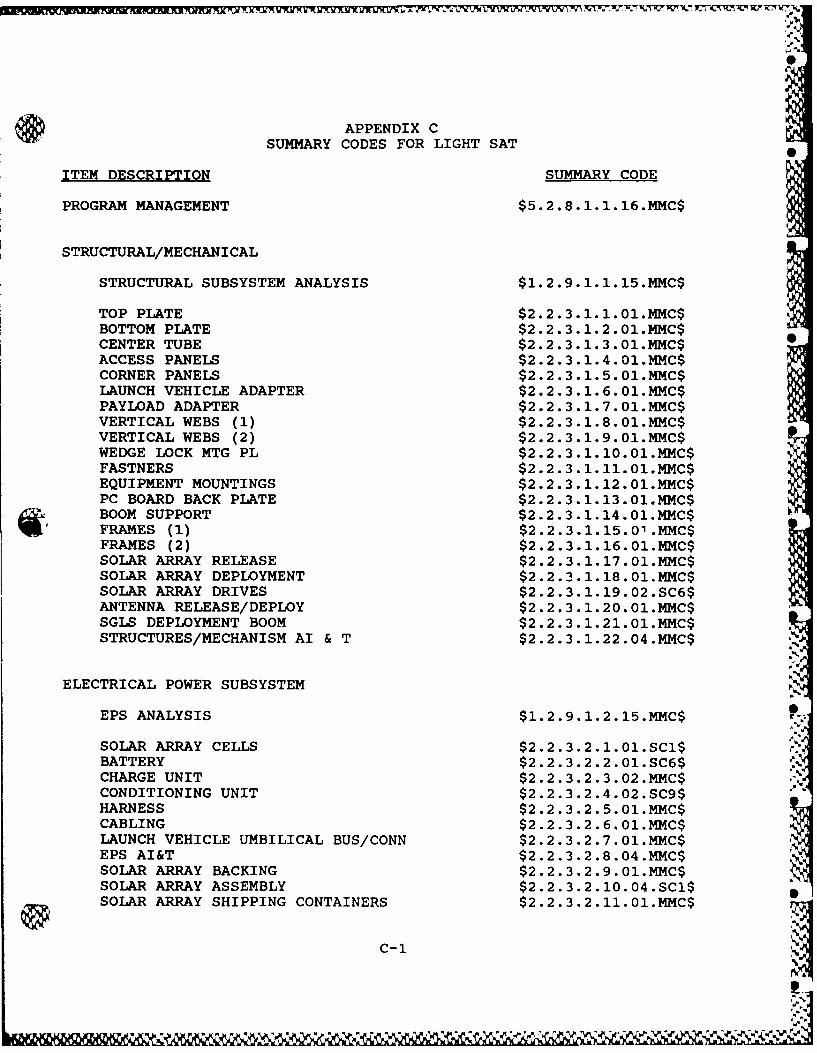
APPENDIX CSUMMARY CODES FOR LIGHT SAT
ITEM DESCRIPTION SUMMARY CODE
PROGRAM MANAGEMENT $5.2.8.1.1.16.MMC$
STRUCTURAL/MECHANI CAL
STRUCTURAL SUBSYSTEM ANALYSIS $1.2.9.1.1.15.MMC$
TOP PLATE $2.2.3.1.1.01.MMC$BOTTOM PLATE $2.2.3.1.2.01.MMC$CENTER TUBE $2.2.3.1.3.01.MMC$ACCESS PANELS $2.2.3.1.4.01.MMC$CORNER PANELS $2.2.3.1.5.01.MMC$LAUNCH VEHICLE ADAPTER $2.2.3. 1.6.01.MMC$PAYLOAD ADAPTER $2.2.3.1.7.01 .MMC$VERTICAL WEBS (1) $2.2.3.1.8.01.MMC$VERTICAL WEBS (2) $2.2.3.1.9.01.MMC$WEDGE LOCK MTG PL $2.2.3.1.10.01.MMC$FASTNERS $2.2.3.1. 11.01.MMC$EQUIPMENT MOUNTINGS $2.2.3.1. 12.01.MMC$PC BOARD BACK PLATE $2.2.3.1. 13.01.MMC$BOOM SUPPORT $2.2.3.1.14.01.MMC$FRAMES (1) $2.2.3.1.15.0 .MMC$FRAMES (2) $2.2.3.1.16.01.MMC$SOLAR ARRAY RELEASE $2.2.3.1.17.01.MMC$SOLAR ARRAY DEPLOYMENT $2.2.3.1.18.01.MMC$SOLAR ARRAY DRIVES $2.2.3.1.19.02.SC6$ANTENNA RELEASE/DEPLOY $2.2.3.1.20.01.MMC$SGLS DEPLOYMENT BOOM $2.2.3.1.21.01.MMC$STRUCTURES/MECHANISM AI & T $2.2.3.1.22.04.MMC$
ELECTRICAL POWER SUBSYSTEM
EPS ANALYSIS $1.2.9.1.2.15.MMC$
SOLAR ARRAY CELLS $2.2.3.2.1.01.SC1$BATTERY $2.2.3.2.2.01.SC6$CHARGE UNIT $2.2.3.2.3.02.MMC$CONDITIONING UNIT $2.2.3.2.4.02.SC9$HARNESS $2.2.3.2.5.01.MMC$CABLING $2.2.3.2.6.01.MMC$LAUNCH VEHICLE UMBILICAL BUS/CONN $2.2.3.2.7.01.MMC$EPS AI&T $2.2.3.2.8.04.MMC$SOLAR ARRAY BACKING $2.2.3.2.9.01.MMC$SOLAR ARRAY ASSEMBLY $2.2.3.2.10.04.SC1$SOLAR ARRAY SHIPPING CONTAINERS $2.2.3.2.11.01.MMC$
C-1
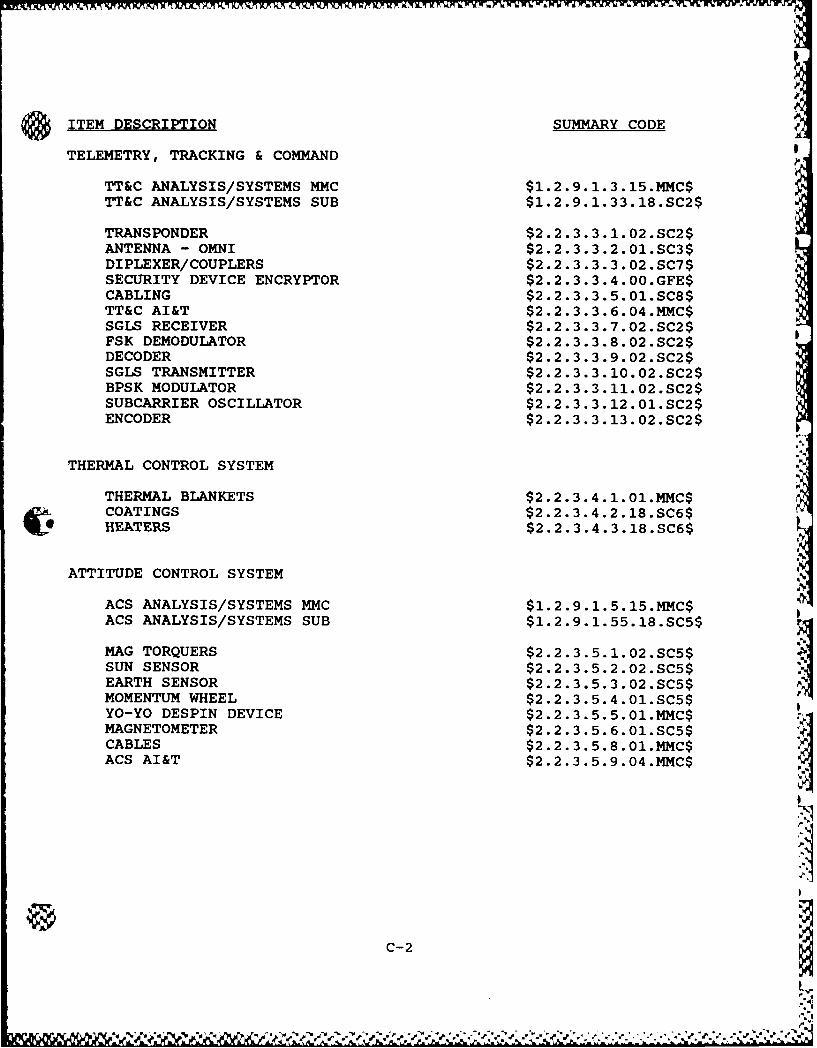
ITEM DESCRIPTION SUMMARY CODEoi
TELEMETRY, TRACKING & COMMAND
TT&C ANALYSIS/SYSTEMS MMC $1.2.9.1.3.15.MMC$TT&C ANALYSIS/SYSTEMS SUB S1.2.9.1.33.18.SC2$
TRANSPONDER $2.2.3.3.1.02.SC2$ANTENNA - OMNI S2.2.3.3.2.0l.SC3$DIPLEXER/COUPLERS $2 .2.3.3.3.02. 5C7$SECURITY DEVICE ENCRYPTOR $2.2.3.3.4.0o.GFE$CABLING $2.2.3. 3.5.01.SCB$TT&C AI&T $2.2.3.3.6.04.MMc$SGLS RECEIVER $2.2.3.3.7.02.SC2$FSK DEMODULATOR $2.2.3.3.8.02.SC2$DECODER $2.2.3.3.9.o2.SC2$SGLS TRANSMITTER $2.2.3.3.1o.02.5C2$BPSK MODULATOR $2.2.3 .3. 11.02.SC2$SUBCARRIER OSCILLATOR $2.2.3.3.12.ol.SC2$ENCODER $2.2.3.3.13.02.SC2$
THERMAL CONTROL SYSTEM
THERMAL BLANKETS $2 .2.3.4.1. 01.MMC$S COATINGS $2.2.3.4.2.18.SC6$
* HEATERS $2.2.3.4.3.18.SC6$
ATTITUDE CONTROL SYSTEM
ACS ANALYSIS/SYSTEMS MMC $1.2.9.1.5.15.MMC$ACS ANALYSIS/SYSTEMS SUB S1.2.9. 1.55.18.SC5$
MAG TORQUERS $2.2.3.5.1.02.SC5$SUN SENSOR $2 .2.3 .5. 2 .02 . C5$IEARTH SENSOR $2.2.3.5.3.02.SC5$MOMENTUM WHEEL $2.2.3.5.4.0l.SC5$YO-YO DESPIN DEVICE $2 .2.3.5.5. 01.MMC$MAGNETOMETER $2.2.3.5.6.ol.SC5$CABLES $2 .2.3.5.8. 01.MMC$ACS AI&T $2.2.3.5.9.04.MMC$I
C-2
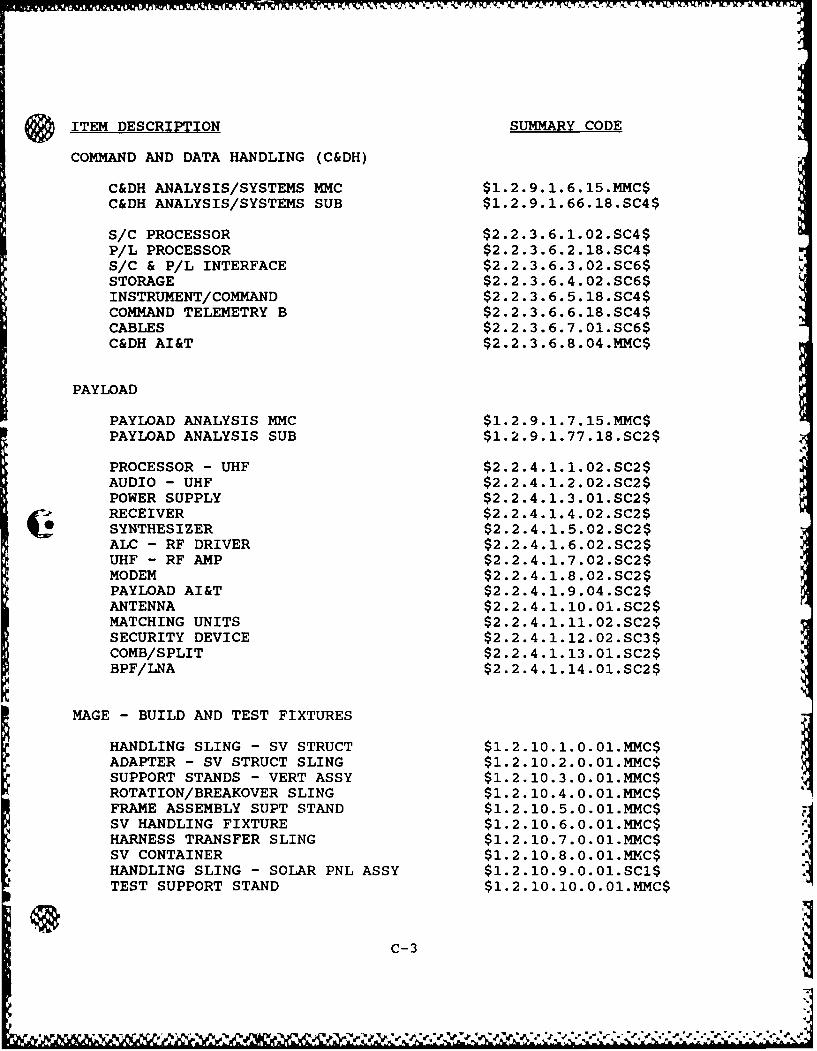
ITEM DESCRIPTION SUMMARY CODE
COMMAND AND DATA HANDLING (C&DH)
C&DH ANALYSIS/SYSTEMS MMC $1.2.9.1.6.15.MMC$C&DH ANALYSIS/SYSTEMS SUB $1.2.9.1.66.18.SC4$
S/C PROCESSOR $2.2.3.6.1.02.SC4$P/L PROCESSOR $2.2.3.6.2.18.SC4$S/C & P/L INTERFACE $2.2.3.6.3.02.SC6$STORAGE S2.2.3.6.4.02.SC6$INSTRUMENT/COMMAND $2.2.3.6.5.18.SC4$COMMAND TELEMETRY B $2.2.3.6.6.18.SC4$CABLES $2.2 .3.6.7.O1.SC6$C&DH AI&T $2.2.3.6.8.04.MMC$
PAYLOAD
PAYLOAD ANALYSIS MMC S1.2.9.1.7.15.MMC$PAYLOAD ANALYSIS SUB $1.2.9.1.77.18.SC2$
PROCESSOR - UHF $2 .2.4.1.1.02.SC2$AUDIO - UHF $2.2.4.1.2.02.SC2$POWER SUPPLY $2.2.4.1.3.01.SC2$RECEIVER $2.2.4. 1.4.02.SC2$4Z* SYNTHESIZER $2.2.4. 1.5.02.SC2$ALC - RF DRIVER $2.2.4.1.6.02.SC2$UHF - RF AMP $2.2.4.1.7.02.SC2$MODEM $2.2.4.1.8.02.SC2$PAYLOAD AI&T $2.2.4.1.9.04.SC2$ANTENNA $2.2.4.1.1o.01.SC2$MATCHING UNITS $2.2.4.1.11.02.SC2$SECURITY DEVICE $2.2.4.1.12.02.SC3$COMB/SPLIT $2.2.4.1.13.O1.SC2$BPF/LNA $2.2.4.1.14.O1.SC2$
MAGE - BUILD AND TEST FIXTURES
HANDLING SLING - SV STRUCT $1.2.1O.1.0.O1.MMC$ADAPTER - SV STRUCT SLING $1.2.1o.2.o.01.M4C$SUPPORT STANDS - VERT ASSY $1.2.10.3.O.01.MMC$ROTATION/BREAKOVER SLING $1.2.10.4.0.01.MMC$FRAME ASSEMBLY SUPT STAND $1.2.10.5.o.01.MMC$
4 SV HANDLING FIXTURE $1.2. 10.6.0. 01.MMC$
HARNESS TRANSFER SLING S1.2.10.7.0.01.MMC$SV CONTAINER $1.2. 10. 8.0.01.MYC$ IHANDLING SLING - SOLAR PNL ASSY $1.2.10.9.0.01.SC1$TEST SUPPORT STAND $1.2. 10. 10.0.01.MMC$
C-3
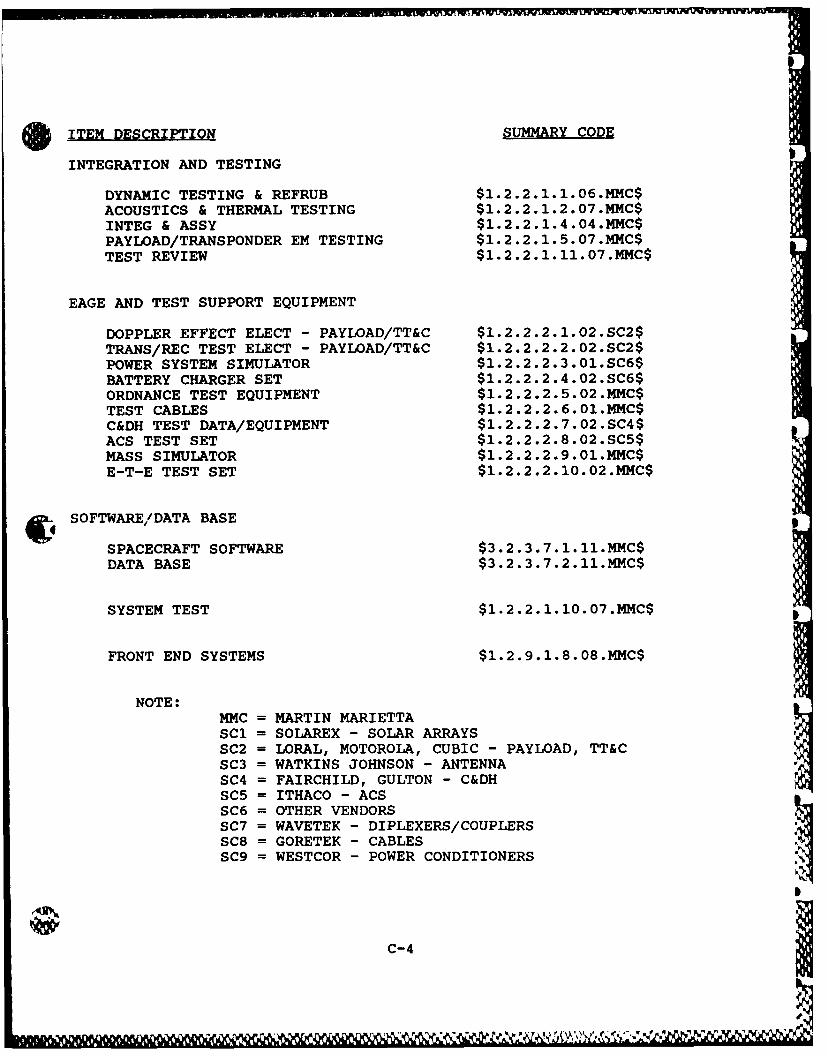
ITEM DESCRIPTION SUMMARY CODE
INTEGRATION AND TESTING
DYNAMIC TESTING & REFRUB $1.2.2.1.1.06.MMC$ACOUSTICS & THERMAL TESTING $1.2.2.1.2.07.MMC$INTEG & ASSY $1.2.2.1.4.04.MMC$PAYLOAD/TRANSPONDER EM TESTING $1.2.2.1.5.07 .MMC$TEST REVIEW $1.2.2. 1.11.07.MMC$
EAGE AND TEST SUPPORT EQUIPMENT
DOPPLER EFFECT ELECT - PAYLOAD/TT&C $1.2.2.2.1.02.SC2$TRANS/REC TEST ELECT - PAYLOAD/TT&C $1.2.2.2.2.02.SC2$POWER SYSTEM SIMULATOR $1.2.2.2.3.01.SC6$BATTERY CHARGER SET $1.2.2.2.4.02.SC6$ORDNANCE TEST EQUIPMENT $1.2.2.2.5.02.MMC$TEST CABLES $1.2.2.2.6.01.MMC$C&DH TEST DATA/EQUIPMENT $1.2.2.2.7.02.SC4$ACS TEST SET $1.2.2.2.8.02.SC5$MASS SIMULATOR $1.2.2.2.9.01.MMC$E-T-E TEST SET $1.2.2.2.10.02.MMC$
SOFTWARE/DATA BASE
SPACECRAFT SOFTWARE $3.2.3.7.1.1.MMC$DATA BASE $3.2.3.7.2.11.MMC$
SYSTEM TEST $1.2.2.1.10.07.MMC$
FRONT END SYSTEMS $1.2.9.1.8.08 .MMC$
NOTE:MMC = MARTIN MARIETTASCI = SOLAREX - SOLAR ARRAYSSC2 = LORAL, MOTOROLA, CUBIC - PAYLOAD, TT&CSC3 = WATKINS JOHNSON - ANTENNASC4 = FAIRCHILD, GULTON - C&DHSC5 = ITHACO - ACSSC6 = OTHER VENDORSSC7 = WAVETEK - DIPLEXERS/COUPLERSSC8 = GORETEK - CABLESSC9 = WESTCOR - POWER CONDITIONERS
C-4

DARPASS INSTALLATION/EXECUTION
GETTING STARTED - OPERATING DARPASS a
This page contains important inFormation and directions thatmust be Followed beFore using the DARPAS5 program.
ONE- OR TWO-DISKETTE SYSTEM
I. Turn on computer and allow it to "boot" with standard DOS3.0 or equivalent System disk.
2. Assign diskette Drive A as the deFault drive by enteringthe Following DOS command:A: +J
3. Insert the DARPASS Program disk into Drive A and close thedrive door.
L4. To begin program execution, type
DARPASS
5. Enter a usernome and password at the appropriateprompts.
6. Replace the Program disk with the Database disk whenprompted by the program.
HARD-DISK OR CARTRIDGE SYSTEM
I. Turn on computer and allow computer to "boot."
2. Make the hard disk or cartridge wher2 the DARPASS programis to be stored the deFault drive. For instance, iF the harddisk is Drive C, enter the Following DOS command:
C: _1
3. Create a subdirectory on the hard disk DARPASS using theFollowing DOS command:
MD DARPASS 4 _,
H. Make the DARPASS subdirectory the deFault directory.
S. Insert the DARPASS Program disk into Drive A and close thedoor.
6. Issue the Following DOS command:
COPY A:.* 4-J
7. Repeat steps 5 and B For the Database disk.
B. To begin program execution, type
DARPASS 4-I 0
NOTE: Steps S through 7 need to be done only once.