spacecraft charging analysis of large geospacecraft charging analysis of large … ·...
TRANSCRIPT

Spacecraft Charging Analysis of Large GEOSpacecraft Charging Analysis of Large GEO Satellites Using MUSCAT
Mengu Cho, Takahiro Sumida, Hirokazu Masui, Kazuhiro ToyodaKyushu Institute of Technology, Kitakyushu, Japan
Jeongho Kim, Shinji HattaMUSCAT Space Engineering Co. Ltd.
Frankie Wong, Bao Hoang Space Systems/Loral
1
Space Systems/Loral
September 20, 201011th Spacecraft Charging Technology Conference, Albuquerque, NM, USA

Introduction• Laboratory ESD test on SS/L solar panel based on ISO-11221
– Secondary arc – Power degradation due to primary arcs
• Number of ESDs expected in orbit needed– How many ESDs in the test– Derivation of overall power degradation at EOL
2

How to derive1 Li ll h ibl bi i f GEO l1. List-up all the possible combinations of GEO plasma
environment parameters– LANL data
2. Spacecraft charging analysis for each case– MUSCAT
3. Identify the environment cases exceeding the ESD threshold, Vth.
4 For each case identified above calculate the charging time4. For each case identified above, calculate the charging time, tchrg, necessary to reach Vth.
5. Derive the probability of occurrence of each case identified in step 3 and the expected total duration in orbit, tenv
6. Get the number of ESDs for each case from tenv/tchrg.7 Sum the number of ESD events to derive the total number7. Sum the number of ESD events to derive the total number.
3

Previous works• Similar work was done for WINDS (Kizuna) in 2003• Combination of LANL data and NASCAP/GEO
45,000 arcs in 15 years with Vth=400V
4Launched to GEO in 2008 NASCAP/GEO model
Cho, M., et al, Journal of Spacecraft and Rockets, vol.42, 2005.

Charging Analysis• For the present work, we used MUSCAT(Multi-Utility Spacecraft Charging Analysis Tool)
5NASCAP/GEO model MUSCAT model

Satellites studiedTo earth
Black Kapton Sun lightBlack Kapton Sun light
Uncoated coverglass
Silver
CMG
6
CMG coverglass
Baseline model (1A)

Satellite configurationsModelname
Solar Panels /wing
Sidereflector
Meshreflector
Towerreflector
Coverglassconductivity(1/m)(1/m)
1A 5 4 N/A 2 2x10-12
1B 6 4 N/A 2 2x10-12
1C 6 4 N/A 2 2x10-121C 6 4 N/A 2 2x10
XB 6 N/A 1 3 2x10-12
2B 6 2 N/A 2 2x10-12
1A’ 5 4 N/A 2 1x10-16
7

Satellite configurations
1A 1B 2B8
1A 1B(longer paddle)
2B(two antenna)
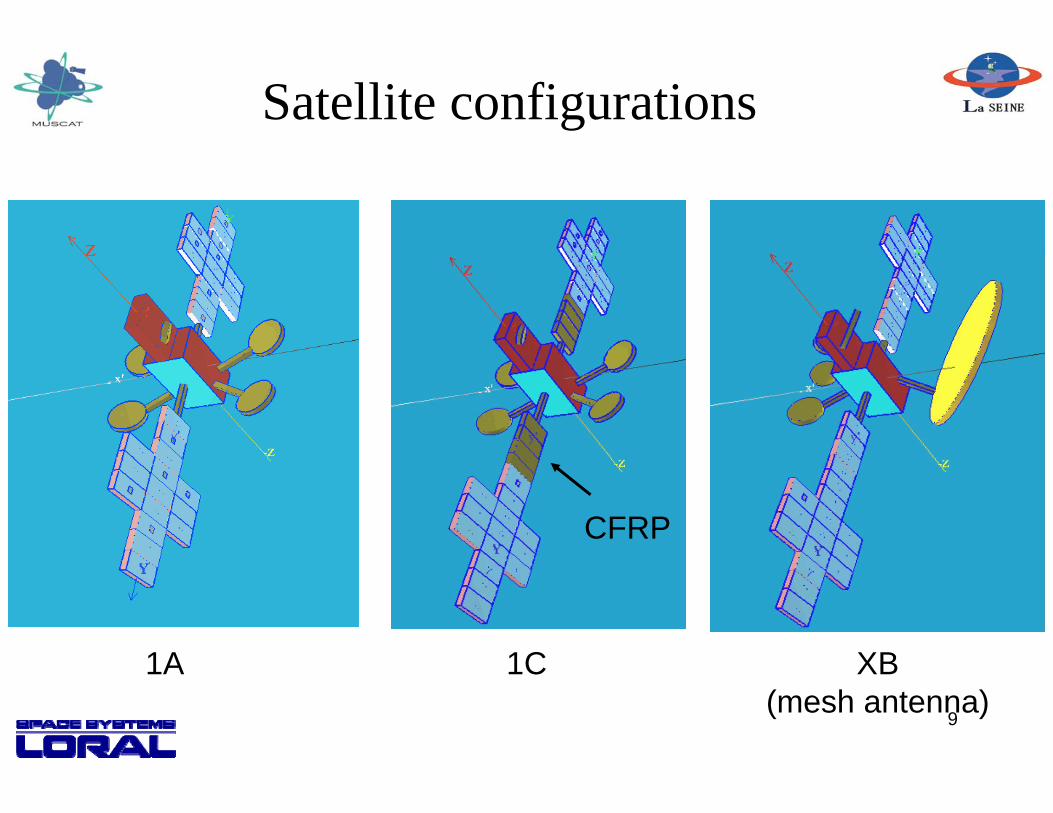
Satellite configurations
CFRP
1A 1C XB9
1A 1C XB(mesh antenna)

Charging environment• Database of GEO plasma environment database
– Based on LANL Magnetospheric Plasma AnalyzerBased on LANL Magnetospheric Plasma Analyzer data
– Electron density and temperaturey p– Proton density and temperature– Identify all the possible combinations of theIdentify all the possible combinations of the
parameters with probability higher than 0.0001%• To save the time, consider only the combinations with , y
probability larger than 0.01% in the present work
10

SimulationGrid size : 0 3m Computational domain: 64x128x64Grid size : 0.3m, Computational domain: 64x128x64Satellite chassis potential starts from -125V
Example:11
Example:Potential distribution

Local times
SunSun light
Sun
Sun light
light
light
Run simulations for 8 local time zones
12

Result• Majority of the cases
show no chargingCoverglass show no chargingCoverglass
Chassis
13Because of initial condition assuming -125V of chassis potential

Result
Te=8000eVTe=8000eVTi=1.6keVNe=107m-3
Ni=107m-3
Example of sever charging
14

Result• Simulation stops when V
exceeds 400V anywhere on th t llitthe satellite
• tchrg=3.7 seconds • N =10cm-3 N =0 25cm-3
Coverglass• Ne=10cm , Ni=0.25cm ,
Te=7.5keV, Ti=5keV• Probability of occurrence V
=0.01%• tenv=3600×24×365.25×(1/8) ×(0 01/100)=395 seconds inChassis ×(0.01/100)=395 seconds in one year
• Number of ESD in one year– NESD=395/3.7=107
15

Number of ESD events• We divide the time into 8 local time zones• For LT3 to LT21• For LT3 to LT21,
NESD (Probability(%)/100) 3600 24 365.23
(ti t h V 400)
18
• LT0 (non-eclipse)
ESD (time to reach V = 400) 8
NESD (Probability(%)/100) 3600 24 365.23
(time to reach V = 400)
18 0.925
• LT0 (eclipse)(Probability(%)/100) 3600 24 365 23 1
16
NESD (Probability(%)/100) 3600 24 365.23
(time to reach V = 400)
18 0.075

Number of ESD eventsLT0 LT3 LT6 LT9 LT12 LT15 LT18 LT21 Eclips
eTotal
1A 70 484 645 1053 483 132 5 8 597 3476
1B 69 452 461 857 574 120 15 5 584 3138
1C 99 551 907 1681 631 631 16 15 1158 5688
XB 66 305 946 1227 530 54 23 33 427 3611
2B 67 464 405 775 468 102 5 3 480 27682B 67 464 405 775 468 102 5 3 480 2768
1A' 78 519 1054 1186 525 151 16 10 597 4137
WINDS(NASCAP)
152 320.5 478 482.5 487 291 95 129 556 2990
17
Number of ESD events in 1 year assuming Vth=400V

Discussion
Probability of ne>10cm-3 Probability of Te>3keV
18ESD occurs mostly between LT3~LT12 except eclipse

DiscussionPlasma parameters Charging time (s)as a pa a e e s C a g g e (s)
kTe(keV) ne (106m-3) kTi (keV) ni(106m-3)SS/L 1A’
(MUSCAT)WINDS
(NASCAP)7 5 5 5 0 25 13 48 20 007.5 5 5 0.25 13.48 20.00 7.5 5 10 0.25 12.49 20.00 7.5 10 5 0.25 5.74 8.00 7.5 10 10 0.25 5.91 8.00
10.5 5 5 0.25 4.64 12.00 10.5 5 10 0.25 4.61 12.00 10.5 10 10 0.25 4.50 6.00
•Material properties data for SS/L and WINDS are the samep p•Whether a satellite charges or not depends on the environment•How quickly it charges depends on the capacitance•WINDS coverglass capacitance 1 8X SS/L
19
•WINDS coverglass capacitance 1.8X SS/L

Discussion
Rapid charging
1B1B 1C
CFRP
20Because of more conductive area, 1C charges more rapidly

DiscussionLT0 LT3 LT6 LT9 LT12 LT15 LT18 LT21 Eclips
eTotal
1A 70 484 645 1053 483 132 5 8 597 34761A2x10-12
(1/m)
70 484 645 1053 483 132 5 8 597 3476
1A’ 78 519 1054 1186 525 151 16 10 597 41371A1x10-16
(1/m)
78 519 1054 1186 525 151 16 10 597 4137
• Difference of coverglass conductivity affects little
21

Conclusion (1/2)• Number of ESD events have been estimated using
– MUSCAT simulation– LANL GEO plasma environment data
• Total number of ESD events in 15 years– 45,000 to 90,000 assuming ESD threshold voltage of Vth= 400VVth= 1800V from ESD test on GaAs/InGaP/Ge triple junction solar cell couponssolar cell coupons
– The total number of ESD events for 15 years is 10,000 to 20,000 • Typical high power GEO satellite has 300 to 500 stringsyp g p g
– 20 to 70 ESDs per string in 15 years• These numbers assume Vth does not change over 15 years
22

Conclusion (1/2)• Results similar to the previous work on a different satellite with
NASCAP/GEO– As long as the satellite is charged, the charging time is determined
by coverglass capacitanceAs long as the plasma environment and the spacecraft material are– As long as the plasma environment and the spacecraft material are similar, the result becomes similar.
– The difference due to the satellite geometry resulted in difference only by a factor of two.
23