spacings for subsurface drains in heavy soils
TRANSCRIPT

RESEARCH BULLETIN 1141 FEBRUARY 1982
Spacings for Subsurface Drains in Heavy Soils
G. 0. SCHWAB
D. W. MICHENER
D. E. KOPCAK
Oh'io Agricultural Research and Development Center Wooster, Ohio
CONTENTS
*** ***
Introduction------------------------------------------------------ 3 Objectives ______________________ ·-- _______________________________ 3
Equipment and Instrumentation-------------------------------------- 3
Procedure-------------------------------------------------------- 3 Field Studies ________________ --------------------------------- 3 Data Processing _______________________________________________ 5
Fie! d Sites___ _ _ _ _ _ _ _ _ _ _ _ _ _ _ _ _ _ _ _ _ _ _ _ _ _ _ _ _ _ _ _ _ _ _ _ _ _ _ _ _ _ _ _ _ _ _ _ _ _ _ _ _ 6
Toledo Silty Clay (Mollie Haplaqueptl------------------------------ 6 Paulding Clay (1) (Typic Haplaquept) and
Roselms Clay Loam (Aerie Ochraqualfl--------------------------- 7 Latty Clay (Typic Haplaqueptl------------------------------------ 7 Clermont Silt Loam (Ohio) (Typic Ochraqualf)
and Avonburg Silt Loam (Aerie Fragiaqualfl---------------------- 7 Hoytville Silty Clay Loam (Mollie Ochraqualfl------------------------ 7 Clermont Silt Loam (Indiana) (Typic Ochraqualfl---------------------- 8
Paulding Clay (2) (Typic Haplaqueptl------------------------------ 8 Nappanee Silty Clay Loam (Aerie Ochraqualf) _______________________ lO
Drainable Porosity _________________________________________________ 10
Tile Spacing ______________________________________________________ ]]
Discussion _______________________________________________________ ]4
Summary ________________________________________________________ 15
Literature Cited ___________________________________________________ 16
Appendix A-Equipment and Instrumentation __________________________ 17
Appendix B-Giossary of Symbols, Glossary of Computer Variables _________ 18
Appendix C-Computer Operations and Assumptions ____________________ 19
Appendix D-Soil Characteristics by Soil Series __ • ______________________ .20
ACKNOWLEDGMENTS Appreciation for assistance and cooperation in conducting this research is
expressed to the following: W. J. Ochs, R. J. Patronsky, K. L. Moran, and many Ohio and Indiana field personnel of the Soil Conservation Service, U. S. Dept. of Agriculture; M. L. Palmer of the Ohio Cooperative Extension Service; J. D. Gordos, technical assistant, and C. J. Olosky, graduate associate, Ohio Agricultural Research and Development Center; and the several farmers on whose land the field tests were conducted. Financial support was provided by the Soil Conservation Service, U. S. Dept. of Agriculture, Contract No. AG-31 SCS-0 1771.
All publications of the Ohio Agricultural Research and Development Center are available to all on a nondiscriminatory basis Without regard to race, color, national origin, sex, or religious affiliation.
AGDEX 550-553-554-752 2-82-2.5M

Spacings for Subsurface Drains in Heavy Soils1
G. 0. SCHWAB, D. W. MICHENER, and D. E. KOPCAK2
INTRODUCTION The design of subsurface drainage systems for a
given rate of water table drawdown requires a knowledge of the hydraulic conductivity and drainage porosity of the soil. Field in situ methods and soil cores which involve point measurements to determine soil properties have not been practical because of the large variability between samples, requiring a large number of measurements. Even so, these methods have merit and are more theoretically sound than trial and error estimates based on field experience from which present spacing recommendations were developed.
Hoffman and Schwab ( 2) developed a procedure for measuring soil properties by measuring the water table drawdown and flow rate from an existing drain system following a wet condition. Skaggs ( 9) modified the procedure so that only drawdown rates were needed when evapotranspiration was minimal. His method is also applicable for a single drain and for either a rising or falling water table. Both methods require an installed drainage system several years old and high initial water table conditions. Field effective values of hydraulic conductivity and porosity are obtained. These are not the same as point values. Once known, hydraulic conductivity and porosity are then substituted into an appropriate equation to obtain spacings for boundary conditions other than those for the system from which measurements were made.
Skaggs' procedure and a computer model were used in this study. Outflow and drawdown were measured so that effective porosity and corrections for evapotranspiration could be computed. The major advantage of his method is that measurements are obtained from a large undisturbed area (volume of soil) compared to core or auger hole measurements. The data are applicable only for the measured site, but hopefully the results are representative of all soils of the same type.
Soils were selected because they were slowly permeable and were borderline with regard to subsurface drainage suitability. The soil type and acreage of these soils in Ohio are: Toledo-263,000 acres, Paulding-194,000, Hoytville-175,000 Clermont-
' 149,000, Avonburg-133,000, Nappanee-100,000,
1Final report of OARDC Project State Special 266. 'Professor of Agricultural Engineering, former Research Engineer,
and Technical Assistant, Dept. of Agricultural Engineering, The Ohio State University and Ohio Agricultural Research and Development Center.
3
Latty-69,000, and Roselms-61,000. Paulding, Roselms, Clermont, and Latty soils are also found in small areas of Indiana and Michigan. At least 50 soils in the U.S. are similarly poorly drained and need to be evaluated.
OBJECTIVES The general objective was to determine pipe
drain spacing recommendations for selected heavy soils. Specific objectives were:
• To determine if pipe drains function adequately in selected slowly permeable soil types.
• To recommend pipe drain depth and spacings from field measurements for selected rates of water table drop and depth of water table.
• To evaluate soil layering and other soil properties, such as drainable porosity, that influence water table drawdown and thus spacing.
EQUIPMENT AND INSTRUMENTATION A list of the equipment required for the field tests
is given in Appendix A.
PROCEDURE Field Studies
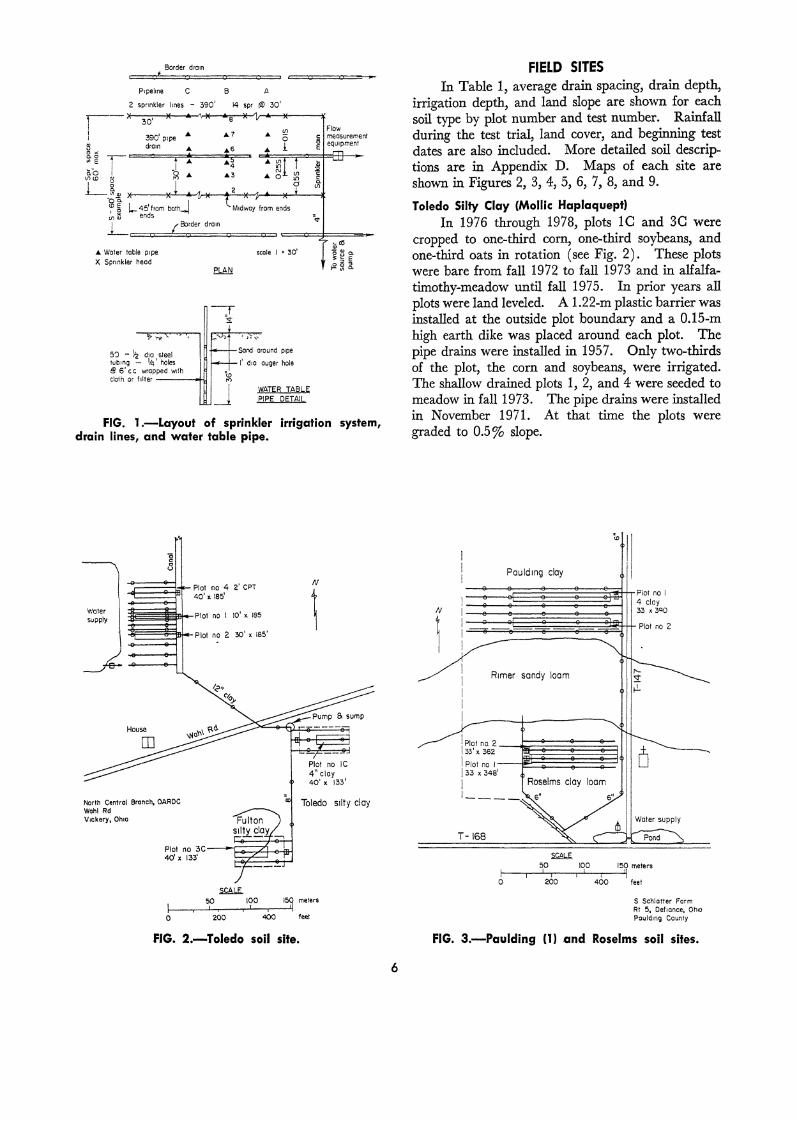
Field sites were selected to be representative of the soil series and to be within a few hundred meters of a local water supply for irrigation. Normal layout of sprinklers, drain lines, and water table pipe are shown in Figure 1. A pit was dug 0.75 m deeper than the test drain and about 10 m from the first sprinklers. Irrigation water was kept from the pit and the walls were braced to prevent cave-ins. A V-weir with chart recorder and a pump were installed in a plywood box set in the pit. Discharge from the pump was returned to the drain downstream from the test plot.
Three lines of water table pipe A, B, C were installed with a power auger to the depth of the drain. Pipes 2 and 8 on each line were at midspacings between the drains, 3 and 7 at the 0.25 spacing, and 4 and 6 at the 0.1 spacing from the test drain. Pipe 5 was directly over the drain. Pipes 1 and 9 (not shown in Fig. 1) were located 1.5 times the spacing from the test drain. Each pipe was packed in filter sand up to 15 em from the surface and then with soil to 3 em above the surface to prevent inflow of surface water. The pipes were flushed out and then filled with water near the end of the sprinkling time in or-
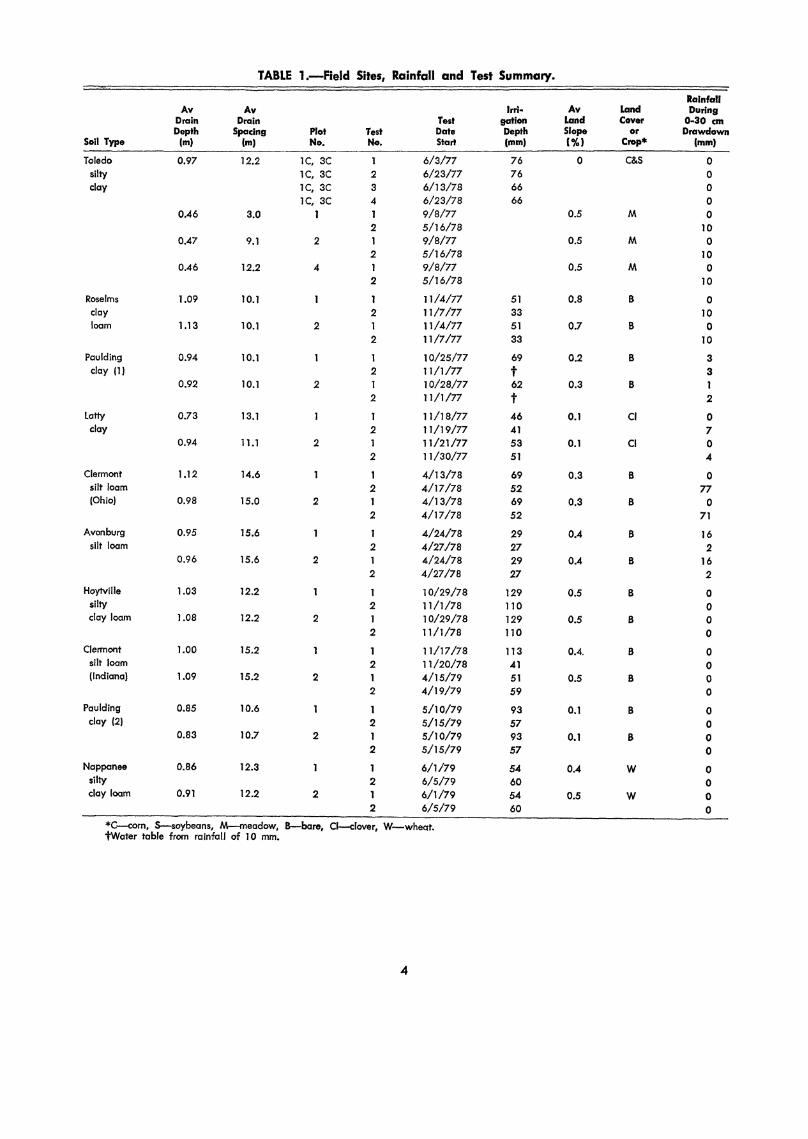
TABLE 1.-Field Sites, Rainfall and Test Summary.
Rainfall Av Av lrri· Av Land During
Drain Drain Test gat! on Land Cover 0..30 em Depth Spacing Plot Test Date Depth Slope or Drawdown
Soil Type (m) (m) No. No. Start (mm) (%) Crop* (mm)
Toledo 0.97 12.2 1C, 3C 1 6/3/77 76 0 C&S 0 silty lC, 3C 2 6/23/77 76 0 day lC, 3C 3 6/13/78 66 0
1C, 3C 4 6/23/78 66 0 0.46 3.0 1 1 9/8/77 0.5 M 0
2 5/16/78 10 0.47 9.1 2 9/8/77 0.5 M 0
2 5/16/78 10 0.46 12.2 4 9/8/77 0.5 M 0
2 5/16/78 10
Roselms 1.09 10.1 11/4/77 51 0.8 8 0 clay 2 11/7/77 33 10 loam 1.13 10.1 2 1 11/4/77 51 0.7 8 0
2 11/7/77 33 10
Paulding 0.94 10.1 10/25/77 69 0.2 8 3 clay (1) 2 11/1/77 t 3
0.92 10.1 2 1 10/28/77 62 0.3 8 2 11/1/77 t 2
latty 0.73 13.1 11/18/77 46 0.1 Cl 0 clay 2 11/19/77 41 7
0.94 11.1 2 1 11/21/77 53 0.1 Cl 0 2 11/30/77 51 4
Clennont 1.12 14.6 1 4/13/78 69 0.3 8 0 silt loam 2 4/17/78 52 77 (Ohio) 0.98 15.0 2 1 4/13/78 69 0.3 8 0
2 4/17/78 52 71
Avonburg 0.95 15.6 4/24/78 29 0.4 8 16 silt loam 2 4/27/78 27 2
0.96 15.6 2 1 4/24/78 29 0.4 B 16 2 4/27/78 27 2
Hoytville 1.03 12.2 10/29/78 129 0.5 B 0 silty 2 11/1/78 110 0 clay loam 1.08 12.2 2 1 10/29/78 129 0.5 B 0
2 11/1/78 110 0
Clennont 1.00 15.2 11/17/78 113 0.4. B 0 silt loam 2 11/20/78 41 0 (Indiana) 1.09 15.2 2 4/15/79 51 0.5 B 0
2 4/19/79 59 0
Paulding 0.85 10.6 5/10/79 93 0.1 B 0 day (2) 2 5/15/79 57 0
0.83 10.7 2 1 5/10/79 93 0.1 B 0 2 5/15/79 57 0
Nappanee 0.86 12.3 6/1/79 54 0.4 w 0 silty 2 6/5/79 60 0 cloy loam 0.91 12.2 2 6/1/79 54 0.5 w 0
2 6/5/79 60 0
*C-com, 5--soybeans, M--meadow, 8--bare, Cl--dover, W-wheQt. tWater table from rainfall of 10 mm.
4
der to equalize the water level in the pipe with that in the soil.
Each plot was irrigated about 7 to 13 hours with an application rate of about 7.5 mm/hr until the drain flow was nearly constant and the water table was close to the surface. The number of tests and plots are shown in Table 1 for each soil. Depth of water application was measured using an array of cans within a four-sprinkler area. Recording gages were installed for drain flow and rainfall. Point in time readings were taken for water table, pan evaporation, and water temperature. Water table read-
ings were taken hourly or more frequently for the first few hours after drawdown and then less frequently for 48 hours or longer. Specific times are shown on computer printout sheets.
Data Processing The field data were placed on punch cards and
processed on The Ohio State University computer. The general procedure is outlined in Table 2. Values for tau ( T) and mu ( P-) presented by Skaggs ( 9) were utilized in the computations. The drainage porosity for each soil was computed from field data for the tile spacing program.
TABLE 2.-General Procedure for the Computer Program.
1. Read survey data: top of well, ground surface at well, probe length, top of probe, instrument elevation, tile diameter.
2. Calculate elevations: ground surface above tile line, top of well above tile line.
3. Read water table readings, evapotranspiration (ET), time, date, and tile flow.
4. Check for improper readings: blanks, dry wells, rising water table with rainfall.
5. Compute elapsed time, total and incremental ET, and tile flow.
6. Read values of depth to impermeable layer (d) and correction factors of ET for porosity calculations.
POROSITY PROGRAM
1. Calculate initial weighted drawdowl'l of water table from soil surface.
2. At each time calculate incremental and total weighted drawdown of water table from initial level.
3. Compute total porosity (f) and incremental f for various ET correction factors.
4. Print total porosity and incremental fat each time for all ET correction factors.
5
TILE SPACING PROGRAM
1. Enter loop for design drawdown rates of 10, 20, 30 em/day to 10, 20, 30 em depths.
2. Compute variables for K/f calculations: y, y0 ,
h0 (all measured from initial water table readings), D, t, and X/L.
3. For each well, determine T based on P- (ETL Y, X/L, and D. Calculate K/f from T, h0 , Landt.
4. Calculate average K/f for X/L = 0.1, 0.25 and 0.50.
5. Determine the spacing based on average K/f using p. = 0 (no ET), and X/L = 0.50 for all three cases.
6. Calculate the 'average drop at midpoint for each time.
7. Continue for all times and design drawdowns.
8. Print time, average drop at midpoint, and the average spacings and K/f for X/L = 0.1, 0.25, and 0.50.
Border dro1n
Ptpelme c B A
2 spr~nkler l~nes - 390' 14 spr (ii) 30'
,-i
30'
.A. Water table p1pe X Spnnkler heed
5') - ~2 dto steel lubtng - 1~' holes @ 6' c c wrapped wtth cloth or f1lter ----->o!-1.
scole I = 30'
f--1-- Send around ptpe
1---1-- I' d1a auger hole
'w "' _j WATER TABLE
PIPE DETAIL
Flow s measurement f equ1pment
FIG. 1.-Layout of sprinkler irrigation system, drain lines, and water table pipe.
Woter supply
Hause
g 8
North Central 6ranch, OAROC Wahl Rd Vickery, Oh10
Plot no 4 2' CPT 40' X 185'
Plot no 1 10' x 185
Plot no 2 30' x 185'
~
N
1
Toledo stlty clay
~~ -~....J5;''-r-, _ __.,.~I?_O--r-1 _15-4~ meters
0 200 400 feet
FIG. 2.-Toledo soil site.
6
FIELD SITES In Table 1, average drain spacing, drain depth,
irrigation depth, and land slope are shown for each soil type by plot number and test number. Rainfall during the test trial, land cover, and beginning test dates are also included. More detailed soil descriptions are in Appendix D. Maps of each site are shown in Figures 2, 3, 4, 5, 6, 7, 8, and 9.
Toledo Silty Clay (Mollie Haplaquept) In 1976 through 1978, plots 10 and 30 were
cropped to one-third corn, one-third soybeans, and one-third oats in rotation (see Fig. 2). These plots were bare from fall 1972 to fall 1973 and in alfalfatimothy-meadow until fall 1975. In prior years all plots were land leveled. A 1.22-m plastic barrier was installed at the outside plot boundary and a 0.15-m high earth dike was placed around each plot. The pipe drains were installed in 1957. Only two-thirds of the plot, the corn and soybeans, were irrigated. The shallow drained plots 1, 2, and 4 were seeded to meadow in fall1973. The pipe drains were installed in November 1971. At that time the plots were graded to 0.5% slope.
T-168
Pauldtng clay
R1mer sandy loam
SCALE
' <D
--
50 100 150 meters f----,--L-.----,_L_-,----Ij 0 200 400 feet
S Schlatter Form Rt 5, Oef1once, Oh10 Pauldtng County
FIG. 3.-Paulding (1) and Roselms soil sites.

Paulding Clay {1) (Typic Haplaquept) and Roselms Clay Loam (Aerie Ochraqualf)
The Paulding ( 1) and Roselms plots (Fig. 3) were cropped in a 4-year rotation of corn, wheat, soybeans, and meadow with meadow in 1977. When planted to row crops, land leveling and ridging were performed. Pipe drains were installed in 1963. When cropping, fall plowing was practiced, weather permitting. In August 1977 these plots were plowed and leveled prior to the test trials.
Latty Clay (Typic Haplaquept) Plots 1 and 2 (Fig. 4) were in clover for more
than 5 years and were previously land leveled. The drains on plot 1 were installed about 1947. In 1957 drains were installed in plot 2. All the drains outlet into an open ditch. The ditch was temporarily dammed for a source of irrigation water.
Clermont Silt Loam (Ohio) (Typic Ochraqualf) and Avonburg Silt Loam (Aerie Fragiaqualf)
These plots (Fig. 5) were cropped to soybeans in 1977, wheat and soybeans in 1976, and soybeans 1972-75. During drain installation in August 1976, the trench was backfilled by augering topsoil into the trench and spreading the subsoil over the surface. Tillage in most years was chisel plow-disc-plant. Drain tests were made prior to tillage in 1978, at which time soybean residue remained and the soil surface was nearly smooth.
Hoytville Silty Clay Loam (Mollie Ochraqualf) Pipe drains were installed in August 1960. Re
cent crop history includes soybeans in 1978, sugar beets in 1977, soybeans in 1976 and 1975, and corn in 1974. The field (Fig. 6) was fall plowed each
---- --~::s:=s- ;;r:::::;:::o:.
Flat na 2 4' clay -> 37' )( 390'
1: I I 'r !--PI<?~ no I 4" ciOf I 43 , 39o
I II
T-72
D tch water supr--lt
I : I tlw lu
Latty clay N
t I
SCALE
50 100 150 rneters 1------,---'-,.----r--L-,----'1
0 200 400 feet
FIG. 4.-Latty soil site.
M Stoller Form Rt 2 Pouldmg, Oh10 Pouldmg County
7
year when possible, followed by secondary tillage in the spring with a field cultivator as needed. The field was leveled in the fall of 1977. At the time of testing the soil surface was soybean stubble.
Avonburg s1lt loam
\
0
-----SCALE ~,,
'~, m '" '~.,"\'
N
l
Clermont s1lt loam
/ /
H Wt~H Form Pleasant Plc1n, Oh10 Warren County
FIG. 5.-Ciermont (Ohio) and Avonburg soil sites.
N
'
"C
" e
Hoytville s1lty clay loam
/ punop S sump
a"
r·~~-:::-=-==-=-=-=L='0=~=~1~~· -~-~-~~-~-~-~--B. plot no 1 I ~~k II I --
-· -··~ plot no 2 L------
bu1ld1ng
E3
50 100 !50 meters
0 200 400 feet
Northwestern Branch OAR DC C1.1stor, Oh1o Wood County
FIG. 6.-Hoytville soil site.

Casco loom Rossmoyne s1lty clay loam I
~er supp1y =:r-- from pond ---------,
Avonburg I silt loam I
N
1 Clermont s11t loam
50 100 150 meters r-~~~--~-,--~ 0 200 400 feet
&'
Avon burg Sill loam
D Wilson Form Greensburg, lnd Decatur County
water supply f'i1 from pond T
-- ----------- --;;tno 2 4'clay
35' < 330
plot no I
N
I Pauldmg Clay t
--~------J I
House
CD
50 100 150 meters ~~~-.--~-,-~ 0 200
T-138
400 feet
R Beckmon Farm !'Widing, Ohlo Pau ld1ng County
t
I I I I I I I
8
FIG. 7.-Ciermont (Indiana) soil site.
Clermont Silt Loam (Indiana) (Typic Ochraqualf) Pipe drains were installed in 1968. Old hay
was placed in the backfill of the trench during construction. The field (Fig. 7) was in corn each of the last 4 years (1975-1978) and in soybeans in 1974. The field was fall plowed in 2 out of the last 4 years prior to 1978, followed each spring by discing several times as needed before planting. Prior to testing in 1978, the field had been chisel-plowed and disked; however, the surface remained in a fairly rough condition.
Paulding Clay (2) (Typic Haplaquept) This field (Fig. 8) was cleared of trees in 1967
and pipe drains were installed in 1969. Soybeans were grown in 1978, corn in 1977, and wheat in 1976. Normal tillage operations included fall plowing, with the use of a field cultivator and spiked harrow in the
T- H
rn House
Nappanee silty clay loom
I I l I L
6'
H Fruth Form Hol~ote, Oh10 Henry County
FIG. 9.-Nappanee soil site.
FIG. 8.-Paulding (2) soil site.
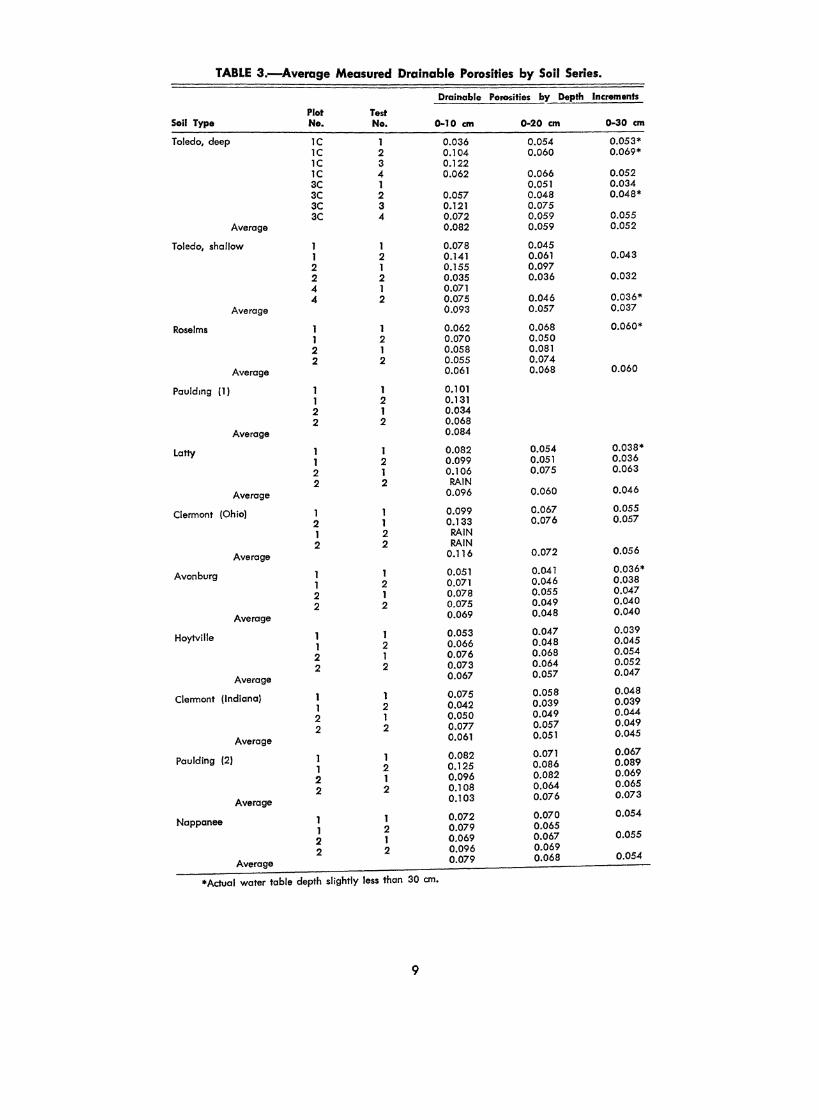
TABLE 3.-Average Measured Drainable Porosities by Soil Series.
Drainable Po110Sitles by Depth Increments
Plot Test Soli Type No. No. C)-10 em 0.20 em o-30em
Toledo, deep IC I 0.036 0.054 0.053* IC 2 0.104 0.060 0.069* IC 3 0.122 IC 4 0.062 0.066 0.052 3C 1 0.051 0.034 3C 2 0.057 0.048 0.048* 3C 3 0.121 0.075 3C 4 0.072 0.059 0.055
Average 0.082 0.059 0.052
Toledo, shallow 1 1 0.078 0.045 1 2 0.141 0.061 0.043 2 1 0.155 0.097 2 2 0.035 0.036 0.032 4 I 0.071 4 2 0.075 0.046 0.036*
Average 0.093 0.057 0.037
Roselms 1 1 0.062 0.068 0.060* 1 2 0.070 0.050 2 1 0.058 0.081 2 2 0.055 0.074
Average 0.061 0.068 0.060
Pauldmg (1) 1 1 0.101 1 2 0.131 2 1 0.034 2 2 0.068
Average 0.084
Latty 1 1 0.082 0.054 0.038* 1 2 0.099 0.051 0.036 2 1 0.106 0.075 0.063 2 2 RAIN
Average 0.096 0.060 0.046
Clermont (Ohio) 1 1 0.099 0.067 0.055
2 1 0.133 0.076 0.057
1 2 RAIN 2 2 RAIN
Average 0.116 0.072 0.056
Avon burg 1 1 0.051 0.041 0.036*
1 2 0.071 0.046 0.038
2 1 0.078 0.055 0.047
2 2 0.075 0.049 0.040
Average 0.069 0.048 0.040
Hoytville 1 1 0.053 0.047 0.039
1 2 0.066 0.048 0.045
2 1 0.076 0.068 0.054
2 2 0.073 0.064 0.052
Average 0.067 0.057 0.047
Clermont (Indiana) 1 1 0.075 0.058 0.048
1 2 0.042 0.039 0.039
2 1 0.050 0.049 0.044
2 2 0.077 0.057 0.049
Average 0.061 0.051 0.045
Paulding (2) 1 1 0.082 0.071 0.067
1 2 0.125 0.086 0.089
2 1 0.096 0.082 0.069
2 2 0.108 0.064 0.065
Average 0.103 0.076 0.073
Nappanee 1 1 0.072 0.070 0.054
1 2 0.079 0.065
2 1 0.069 0.067 0.055
2 2 0.096 0.069
Average 0.079 0.068 0.054
*Actual water table depth slightly less than 30 em.
9

TABLE 4.-Average Measured Drainage Coefficients by Soil Series.
Drainage Coefficient by Depth Increments*
0-10 em 0-20 em 0-30 em ----Soil Type mm/d in/d mm/d in/d mm/d in/d
Toledo, deep 8 0.32 12 0.46 16 0.61 Toledo, shallow 9 0.37 11 0.45 II 0.44 Roselms 6 0.24 14 0.54 18 0.71 Paulding (1) 8 0.33 Latty 10 0.38 12 0.47 14 0.54 Clermont (Ohio) 12 0.46 14 0.57 17 0.66 Avon burg 7 0.27 10 0.38 12 0.47 Hoytville 7 0.26 11 0.45 14 0.56 Clermont [Indiana) 6 0.24 10 0.40 14 0.53 Paulding (2) 10 0.40 15 0.60 22 0.86 Nappanee 8 0.31 14 0.53 16 0.64
*Drainage coefftcienr-=water table depth X overage porosity (Table 3). This depth is the flow during drawdown to the drained depth indicated following shut-off of sprinkling.
spring. The field was in soybean stubble and very flat at the time of testing.
Nappanee Silty Clay Loam (Aerie Ochraqualf) Pipe drains were installed in 1976 (Fig. 9). Re
cent crop history included corn 1977, soybeans 1978, and a growing wheat crop with clover seedlings at the time of testing in 1979.
105
~ 095 ~ ~
0 < 0
·$! tl\'lli\if/1''' , plol 3C
i~' ~ plot IC
y (m) c o o X 0 X X
085 ' IS
075
0
0 0
X X
5
Oo 0
0 g
~ 0 1977
\0
X plot 2
065 ooo
0
0
055
0 5 10
Toledo s1lly cloy o plot IC ' plol 3C
:(1978
olx I ~ 0 J 1977
15 20 25 30
T•me (hrsl
Lotty ctoy
0
0 plot I
0
0
15 20 25 ;;o T1me (hrs)
FIG. 1 0.-Water table drawdown at midspaoing for Toledo and Latty soils.
10
DRAINABLE POROSITY The average measured drainable porosities by
soil series for three water table depths from the surface are shown in Table 3. The highest values were in the top 10 and 20 em depths as these depths are within the plow layer. The porosities to 10 em depth would tend to be high due to flow contributions by downward seepage from isolated spots of surface water and to be decreased by low initial water tables. The relationship between initial water tables and porosity at 10 em depth was inconsistent. Evaporation losses from the water table were computed by multiplying pan evaporation by 0. 7 for the 10 em depth, 0.6 for the 20 em depth, and 0.5 for the 30 em depth. The average porosities for each soil were taken to compute the spacings for that soil for their respective drawdown depths.
Using- the average drainable porosities in Table 3 for each soil, the drainage coefficients were computed as shown in Table 4. The measured coefficients for 0 to 10 em depths are about 13% less than the present recommendation of 9.5 mm/d (%in/d). For the 0 to 20 em drawdown depth, the average drainage coefficient increased to about 12.7 mm/d ( 0.5 in/d), 34% more than present recommendations. The 20-cm depth is a practical drawdown depth for most field crops. However, it may not be necessary to design for more than 9.5 mm/ d as the return period for rainfall equal to the irrigation depth is about once in 4 years. Studies by Hoover and Schwab ( 3) on Nappanee silt loam near Tiffin, Ohio, showed that the 9.5 mm/ d coefficient would occur on the average only 0.7 day each year. The Roselms and Paulding soils usually had higher drainable porosities at 20 em depth than at 10 em. Such results are not consistent with the other soils. The data in Table 4 by them-

selves do not justify changing the percent design drainage coefficient.
Average water table drawdowns at the midspacing for four selected soil types are shown in Figures 10, 11, and 12. These depths were not corrected for evapotranspiration as was done when computing drainable porosities. The drawdowns for the other soils ( drawdowns not shown) were similar to the ones shown.
The variability between the two plots for the Latty soil and between test runs in 1977 and 1978 for the Toledo soil are shown in Fig. 10. Since the tests were run as uniformly as possible, the differences are due to drain depth, the soil hydraulic conductivity, or inherent characteristics due to time. In the Toledo tests, corrections were not made for temperature, but these are believed to be small. Additional comparisons for tests made in 1963 on the Toledo soil will be discussed later. For the Latty soil the rate of drop of the water table is much greater for the deep tile than for the shallow tile. Similar results were obtained for the Toledo soil.
The water table levels for the Clermont soil sites in Ohio and Indiana are shown in Fig. 11. For the first 10 to 15 hours the levels dropped faster at the Ohio site, but after that time they were slower than at the Indiana site. In contrast to the Clermont soil, the two Paulding sites were drastically different as shown in Fig. 12. At site (2) the farmer was careful not to till the soil when wet; otherwise the two sites have been cropped much the same. The preceding crop was soybeans at site ( 2) and meadow at site ( 1). Other than variation in soil properties, the reasons for such a wide difference in drawdown are not known.
TILE SPACING Field effective values of K/f were computed for
each water table pipe at (X/L) locations 1/10, 1/4, and 1/2 the drain spacing. Average values are given in Table 5 for only the 20-cm water table depth. Consistently, the K/f values decreased as the water table measurements were taken closer to the drain. The major reason appears to be that for the pipe closer to the drain, the water table dropped more slowly than in an homogeneous soil, for which the theoretical curves were developed. This slower rate of drop is probably due to soil stratification. The low permeability of the subsoil causes the water to flow more horizontally near the surface rather than downward to the drains. Such flow would cause high water tables near the drain.
The average computed drain spacings by soil series for three rates of water table drawdown are shown in Table 6. For most field crops the 20-cm
11
depth should be adequate. These spacings are reasonably close to present recommendations. The Paulding ( 1) and the Toledo (shallow) soil spacings
110
a a plot 1
0
Clermont s11t loom (Oh>al
0 0
y (m) X X
090 plot 2
080 X
O?~L---~5----~10----~,5~--~270--~2~5--~3~0----
115
X X X
105
ylm) oo o~
095 plot 1 °
085
0 5
Ttme (hrs)
~plol2
0
10 15
Clermont ( lnd ) slit loam
0
20
X
0
Ttme (hrs)
25 30
FIG. 11.-Water table drawdown at midspacing for Clermont {Ohio} and Clermont (Indiana} soils.
100
y(m)
0
085
075
y(m)
oe~
0
0
0
1 = , plot I '"l!"";@"r plot 2
o o ox o o o oxo 2 o
0 0 0
5 10 15 20 25
Ttme (hrs)
~ploti(O) ~plot2 (xl
0
0 Pouldmg cloy (2)
0
0
0
5 10 15 20 25 Ttme (hrs)
Pouldtn~ cloy (I)
o plot I x plat 2
30
0
30
FIG. 12.-Water table drawdown at midspacing for two Paulding soil sites.

TABLE 5.-Field Effective K/f at 20-cm Water Table Depth.
Kif Plot Test X/L=1/2 X!L=1/4 X/L= 1/10
Soil Type No. No. m/h m/h m/h
Toledo, deep 1C 1.251 0.583 0.124 1C 2 1.430 0.796 0.116 1C 4 0.362 0.215 0.045 3C 1 1.503 0.767 0.186 3C 2 1.727 0.899 0.195 3C 4 0.343 0.138
Average 1.103 0.566 0.133
Toledo, shallow 0.133 0.073 0.022 2 0.340 0.248 0.096
2 2 0.491 0.424 0.618 Average 0.321 0.248 0.245
Roselms 0.143 0.084 0.019 2 0.152 0.077 0.014
Average 0.148 0.080 0.017
Paulding (1} All tests had midspacing water table depths less than 20 em.
Latty 1.148 0.597 0.439 2 2 0.647 0.713 0.600
Average 0.898 0.655 0.519
Clermont (Ohio) 0.210 0.100 0.035 2 0.341 0.217 0.049
Average 0.276 0.159 0.042
Avon burg 0.571 0.232 0.060 1 2 0.597 0.235 0.077 2 0.586 0.244 0.050 2 2 0.769 0.241 0.059
Average 0.631 0.238 0.061
Hoytville 1 1.417 0.684 0.282 1 2 0.659 0.447 0.193 2 1.138 1.064 0.355 2 2 0.439 0.665 0.274
Average 0.913 0.715 0.276
Clermont [Indiana) 1 0.379 0.501 0.535 1 2 0.458 0.502 0.518 2 0.409 0.571 0.339 2 2 0.465 0.469 0.264
Average 0.428 0.511 0.414
Pauldmg (2) 0.679 0.375 0.071 1 2 0.476 0.243 0.041 2 1 0.986 0.576 0.071 2 2 0.627 0.362 0.048
Average 0.692 0.389 0.058
Nappanee 0.878 0.468 0.078 1 2 0.691 0.380 0.065 2 1 0.812 0.385 0.066 2 2 0.645 0.315 0.052
Average 0.757 0.387 0.065
12
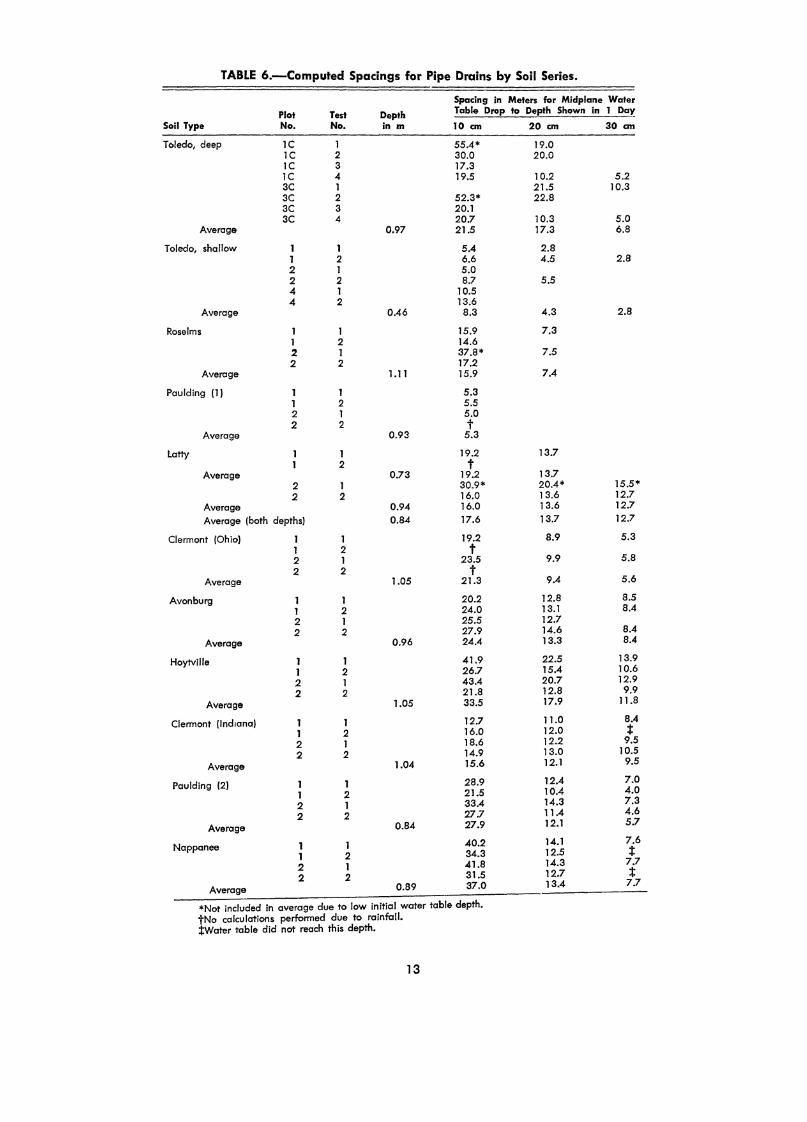
TABLE 6.-Computed Spacings for Pipe Drains by Soil Series.
Spacing in Meters for Midplane Water
Plot Test Depth Table Drop to Depth Shown In 1 Day
Soil Type No. No. in m 10 em 20 ern 30 em
Toledo, deep 1C 1 55.4* 19.0 IC 2 30.0 20.0 IC 3 17.3 IC 4 19.5 10.2 5.2 3C I 21.5 10.3 3C 2 52.3* 22.8 3C 3 20.1 3C 4 20.7 10.3 5.0
Average 0.97 21.5 17.3 6.8
Toledo, shallow 1 1 5.4 2.8 1 2 6.6 4.5 2.8 2 1 5.0 2 2 8.7 5.5 4 1 10.5 4 2 13.6
Average 0.46 8.3 4.3 2.8
Roselms 1 1 15.9 7.3 1 2 14.6 2 1 37.8* 7.5 2 2 17.2
Average 1.11 15.9 7.4
Paulding [1 I 1 1 5.3 1 2 5.5 2 1 5.0 2 2 t
Average 0.93 5.3
latty 1 19.2 13.7 2 t
Average 0.73 19.2 13.7 2 1 30.9* 20.4* 15.5* 2 2 16.0 13.6 12.7
Average 0.94 16.0 13.6 12.7
Average [both depths) 0.84 17.6 13.7 12.7
Clermont [Ohio) 1 I 19.2 8.9 5.3 1 2 t 2 1 23.5 9.9 5.8 2 2 t
Average 1.05 21.3 9.4 5.6
Avon burg 1 1 20.2 12.8 8.5 l 2 24.0 13.1 8.4 2 1 25.5 12.7 2 2 27.9 14.6 8.4
Average 0.96 24.4 13.3 8.4
Hoytville 1 1 41.9 22.5 13.9
1 2 26.7 15.4 10.6
2 I 43.4 20.7 12.9
2 2 21.8 12.8 9.9
Average 1.05 33.5 17.9 11.8
Clermont [lnd1ana) 1 1 12.7 11.0 8.4
1 2 16.0 12.0 :t 2 1 18.6 12.2 9.5
2 2 14.9 13.0 10.5
Average 1.04 15.6 12.1 9.5
Paulding (2) 1 1 28.9 12.4 7.0
1 2 21.5 10.4 4.0
2 1 33.4 14.3 7.3
2 2 27.7 11.4 4.6
Average 0.84 27.9 12.1 5.7
Nappanee 1 1 40.2 14.1 7.6
1 2 34.3 12.5 :t 2 1 41.8 14.3 7.7
2 2 31.5 12.7 :t Average 0.89 37.0 13.4 7.7
*Not included in average due to low initial water table depth. tNo calculations performed due to rainfall. :!:Water table did not reach this depth.
13
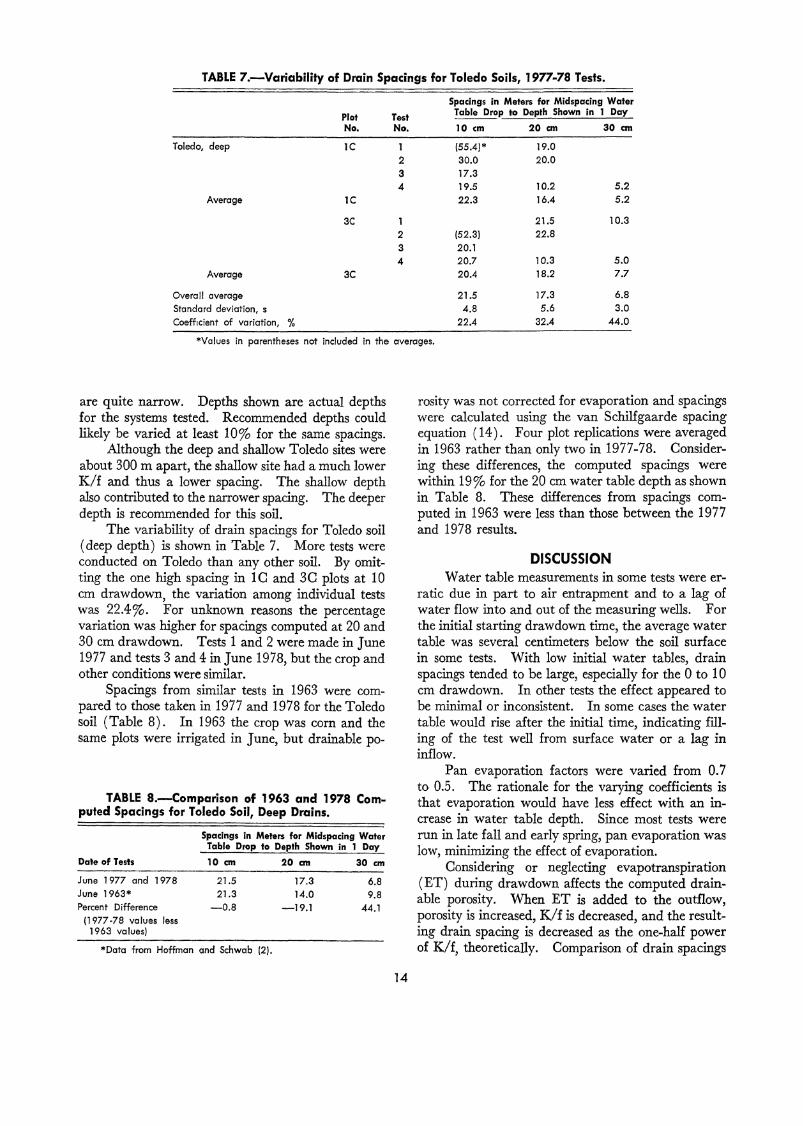
TABLE 7.-Variability of Drain Spacings for Toledo Soils, 1977-78 Tests.
Spacings in Meters for Midspacing Water
Plot Test Table Drop 110 Depth Shown in I Day
No. No. 10 em 20 em 30 em
Toledo, deep lC 1 (55.4)* 19.0
2 30.0 20.0 3 17.3 4 19.5 10.2 5.2
Average IC 22.3 16.4 5.2
3C 21.5 10.3 2 (52.3) 22.8 3 20.1 4 20.7 10.3 5.0
Average 3C 20.4 18.2 7.7
Overa II average 21.5 17.3 6.8 Standard deviation, s 4.8 5.6 3.0
Coeff1cient of variation, % 22.4 32.4 44.0
*Values in parentheses not included in the averages.
are quite narrow. Depths shown are actual depths for the systems tested. Recommended depths could likely be varied at least 10% for the same spacings.
Although the deep and shallow Toledo sites were about 300 m apart, the shallow site had a much lower K/f and thus a lower spacing. The shallow depth also contributed to the narrower spacing. The deeper depth is recommended for this soil.
The variability of drain spacings for Toledo soil (deep depth) is shown in Table 7. More tests were conducted on Toledo than any other soil. By omitting the one high spacing in lC and 3C plots at 10 em drawdown, the variation among individual tests was 22.4%. For unknown reasons the percentage variation was higher for spacings computed at 20 and 30 em drawdown. Tests 1 and 2 were made in June 1977 and tests 3 and 4 in June 1978, but the crop and other conditions were similar.
Spacings from similar tests in 1963 were compared to those taken in 1977 and 1978 for the Toledo soil (Table 8) . In 1963 the crop was corn and the same plots were irrigated in June, but drainable po-
TABLE a.-Comparison of 1963 and 1978 Computed Spacings for Toledo Soil, Deep Drains.
June 1977 and 1978 June 1963* Percent Difference
(1977 -78 values less 1963 values)
Spacings in Meters for Midspaclng Water Table Drop to Depth Shown in 1 Day
I 0 em 20 em 30 em
21.5 21.3
-0.8
17.3 14.0
-19.1
6.8 9.8
44.1
*Dota from Hoffman and Schwab (2).
14
rosity was not corrected for evaporation and spacings were calculated using the van Schilfgaarde spacing equation ( 14) . Four plot replications were averaged in 1963 rather than only two in 1977-78. Considering these differences, the computed spacings were within 19% for the 20 em water table depth as shown in Table 8. These differences from spacings computed in 1963 were less than those between the 1977 and 1978 results.
DISCUSSION Water table measurements in some tests were er
ratic due in part to air entrapment and to a lag of water flow into and out of the measuring wells. For the initial starting drawdown time, the average water table was several centimeters below the soil surface in some tests. With low initial water tables, drain spacings tended to be large, especially for the 0 to 10 em drawdown. In other tests the effect appeared to be minimal or inconsistent. In some cases the water table would rise after the initial time, indicating filling of the test well from surface water or a lag in inflow.
Pan evaporation factors were varied from 0. 7 to 0.5. The rationale for the varying coefficients is that evaporation would have less effect with an increase in water table depth. Since most tests were run in late fall and early spring, pan evaporation was low, minimizing the effect of evaporation.
Considering or neglecting evapotranspiration ( ET) during drawdown affects the computed drainable porosity. When ET is added to the outflow, porosity is increased, K/f is decreased, and the resulting drain spacing is decreased as the one-half power of K/f, theoretically. Comparison of drain spacings

using K/f based on zero evapotranspiration and those based on measured pan evaporation is shown in Table 9. Clermont (Ohio) soil tests were selected because the differences in ET were higher than for the other soils. With ET assumed as 0.7 of pan evaporation, drain spacings for the 20-cm drawdown depth were 16.1% less than when ET was zero. For this reason measured ET was considered in computing K/f values for all soils. Further research is needed to delineate more specifically the relationship of pan evaporation and loss of water from the water table.
Paulding ( 2) site data showed much higher drawdown rates than Paulding ( 1). For the 0 to 10 em drawdown rates, the drain spacings were S.3 and 27.9 m for Paulding ( 1) and ( 2) sites, respectively. At the Paulding ( 1) site the water table reached the 20-cm depth during only one of the four tests, so a comparison at this depth was not made. The two sites were only about S miles apart. The farmer at site ( 2) was conscientious about not working the soil when wet. Other soil management practices included a corn, soybean, and wheat crop rotation and the use of smaller equipment than most other farmers in the area to reduce soil compaction. Such widely different spacings as mentioned above should raise serious questions about using soil type as the only basis for drain spacing.
Some characteristics unique to the Clermont (Indiana) site are of interest. Although the soil surface was in a rough condition at the beginning of the tests, repeated rains and irrigations resulted in some surface sealing. This sealing together with the gentle slope at the site resulted in more surface runoff than was experienced at the other sites. These studies showed that surface drainage along with tile drainage is important for this soil.
The Nappanee site had good natural surface drainage which prevented much ponded water. This condition accounted for the low initial water table compared to other sites.
For the last four soils in Table 6, hydraulic conductivities were corrected to a standard temperature of 10° C ( S0° F). Although the effect of temperature on drain spacing is likely to be small, such a correction does remove this variable when comparing spacings for the various soils. When soil temperatures are higher than 10° C ( S0° F), spacings given in this report could be increased slightly.
The depth from the drain to the impermeable layer was assumed to be zero for all computations. Increasing the depth of the impermeable layer in one soil from zero to d/ho = O.S gave less than a S% difference in drain spacing. Skaggs (9) found a similar effect. He indicated that this factor tends to cancel out when the K/f obtained from drawdown is used to
15
TABLE 9.-Comparison of Drain Spacings Calculated with Zero and Measured ET for Clermont (Ohio) Soils.*
Midplane Water Table Depth
10 em 20 em 30 em
Spacing in meters 22.2 11.2 8.3 ET=O
Spacing in meters 21.3 9.4 5.6 ET, mm/hr (0.7 pan (0.34) (0.20) (0.18)
evaporation)
Percent Difference in Spacing with ET 4.1 16.1 32.5
*For test 1 only.
predict drain spacings. The greatest opportunity for improving drain
spacing recommendations by the procedure outlined here is to improve the accuracy of water table measurements. Two possible ways are to increase the number of pipes, especially at the midspacing locations, and to develop a more responsive sensor. Three pipes at each midspacing were installed during tests on the last four soils in Table 6.
SUMMARY Hydraulic conductivity (K) and drainable poro
sity (f) were evaluated for eight slowly permeable soil types by saturating the soil to the surface at each field site by sprinkler irrigation. Water table measurements were taken at three distances from parallel drains and corrections were made for evaporation to compute drainable porosity and K/f.
For the existing boundary conditions, Kif values were determined for each soil according to procedures developed by Skaggs (9). From these K/f values, drain spacings were computed for drawdown rates from the soil surface of 10, 20, and 30 em/day. For the 20 em/ day rate, drain spacing for Toledo silty clay was 17m (57ft); Roselms clay loam 7 m (24 ft) ; Latty clay 14 m ( 45 ft) ; Clermont (Ohio) silt loam 9 m (31ft); Avonburg silt loam 13m (44ft); Hoytville silty clay loam 18m (59ft); Clermont (Indiana) silt loam 12m (40ft); Paulding (2) clay 12 m (40ft); and Nappanee silty clay loam 13m (44 ft). The depth of these drains was about 0.8 to 1.0 m (2.6 to 3.3 ft). For another Toledo site having a drain depth of O.S m ( 1.S ft), the spacing was 4 m ( 14 ft) . In the Paulding ( 1) clay soil the water table did not drop to 20 em depth even after 5 days. For eight test runs on Toledo soil in 1977 and 1978, the coefficient of variation of the computed spacings was 32.4% at the 20 em/ day rate. Compared to tests in 1963 on the same plots, but using another spacing equation, the spacings were about 19% more than the 1963 values.
Evapotranspiration had an important effect on K/f and spacing. For Clermont (Ohio) soil at the 20 em/day rate of drawdown, spacings were 16.1% less when evapotranspiration ( ET) was considered compared to assuming zero ET. Depth from drain to the impermeable layer was taken as zero, but it was found to have a small effect on spacing. Water table levels were not always consistent and more precise measurement techniques need to be developed.
LITERATURE CITED 1. Blevins, R. L. and L. P. Wilding. 1968. Hoyt
ville Soils: Their Properties, Distribution, Management and Use. Ohio Agri. Res. and Dev. Center, Res. Bull. 1006.
2. Hoffman, G. J. and G. 0. Schwab. 1964. Tile Spacing Prediction Based on Drain Outflow. Trans. of the ASAE, 7 ( 4) :444-44 7.
3. Hoover, J. R. and G. 0. Schwab. 1969. Effect of Tile Depth, Spacing, and Cropping Practices on Drain Discharge. Trans. of the ASAE, 12: 150-152.
4. International Institute for Land Reclamation and Improvement (ILRI). 1972. Veldboek Voor Land-en Waterdeskundigen. The Institute, Wageningen, The Netherlands.
5. Luthin, James N. (ed). 1957. Drainage of Agricultural Lands. Amer. Soc. of Agron., Chap. IV, Madison, Wis.
6. Schwab, G. 0., .et al. 1978. Phase I. Research Report on Field Evaluation of Subsurface Drainage. OARDC Project SS-266, Agri. Eng. Dept., Columbus, Ohio ( Mimeo) .
16
7. Schwab, G. 0., .et al. 1979. Phase II. Research Report on Field Evaluation of Subsurface Drainage. OARDC Project SS-266, Agri. Eng. Dept., Columbus, Ohio. (Mimeo).
8. Schwab, G. 0., et al. 1963. Tile and Surface Drainage of Clay Soils. I. Hydrologic Performance with Grass Cover. Ohio Agri. Exp. Sta. (now Ohio Agri. Res. and Dev. Center), Res. Bull. 935.
9. Skaggs, R. W. 1976. Determination of the Hydraulic Conductivity-Drainable Porosity Ratio from Water Table Measurements. Trans. of the ASAE, 19( 1) :73-80.
10. Skaggs, R. W. 1975. Drawdown Solutions for Simultaneous Drainage and ET. Proc., Amer. Soc. Civil Eng., J. Irrig. and Drainage, 101 (IR4) :279-291.
11. Taylor, G. S., T. Goins, and N. Holowaychuk. 1961. Drainage Characteristics of Toledo and Hoytville Soils. Ohio Agri. Exp. Sta., Res. Bull. 876.
12. U.S. Soil Conservation Service. 1972. Soil Survey Laboratory Methods and Procedures for Collecting Soil Samples. U.S. Govt. Printing Office, Washington, D. C.
13. Van Schilfgaarde, Jan (ed.) 1974. Drainage for Agriculture. Amer. Soc. of Agron., Madison, Wis.
14. Van Schilfgaarde, Jan.1963. Tile Drainage Design Procedure for Falling Water Tables. Amer. Soc. Civil Eng., Proc. 89, No. IR2, J. Irrig. and Drainage Div.

APPENDIX A
EQUIPMENT AND INSTRUMENTATION
The following equipment was required in the field:
Quantity 1
Description ITT Marlow Model 4085 portable centrifugal pump, 200 gpm at 230 ft head
36 30' x 4" diameter aluminum irrigation pipe 30 30' x 2" diameter aluminum irrigation pipe 36 3' x 1" diameter aluminum risers with 1fs" nozzles and full circle
heads assorted couplings, tees, reducers, elbows and end plugs
1 30' pipe trailer, 2-wheel 1 3/ 4 ton pickup with winch and tool boxes 1 backhoe (rented) 1 Little Beaver Earth Drill, snapon 3%' x 1 %" dia. auger
100 5' x 1/ 2 " dia. steel conduit perforated at 4" intervals and wrapped with muslin
2 3' x 4' x 6' plywood boxes for weir and pump 2 sump pumps with automatic on/off, Little Giant Model 6CIA 1 1500-watt McCullough generator with 4 hp Briggs & Stratton engine 2 low pressure two-direction valves with 4" fittings 2 30° V-notch weirs 2 water level recorders, Friez Model FW- 1
weather shelter hygrothermograph recording rain gage nonrecording rain gage thermometer anemometer, Science Associates Model 403 U. S. Weather Bureau Class A evaporation pan, hook gage and wooden pallet 4" diameter totalizing flow meter, Sparling Model S/N 1 08535 assorted tools
6 3' x 1" diameter aluminum risers with 9/64" nozzles and part circle heads
1 4' x 1j;," diameter plastic blowtube graduated in centimeters
17
APPENDIX B
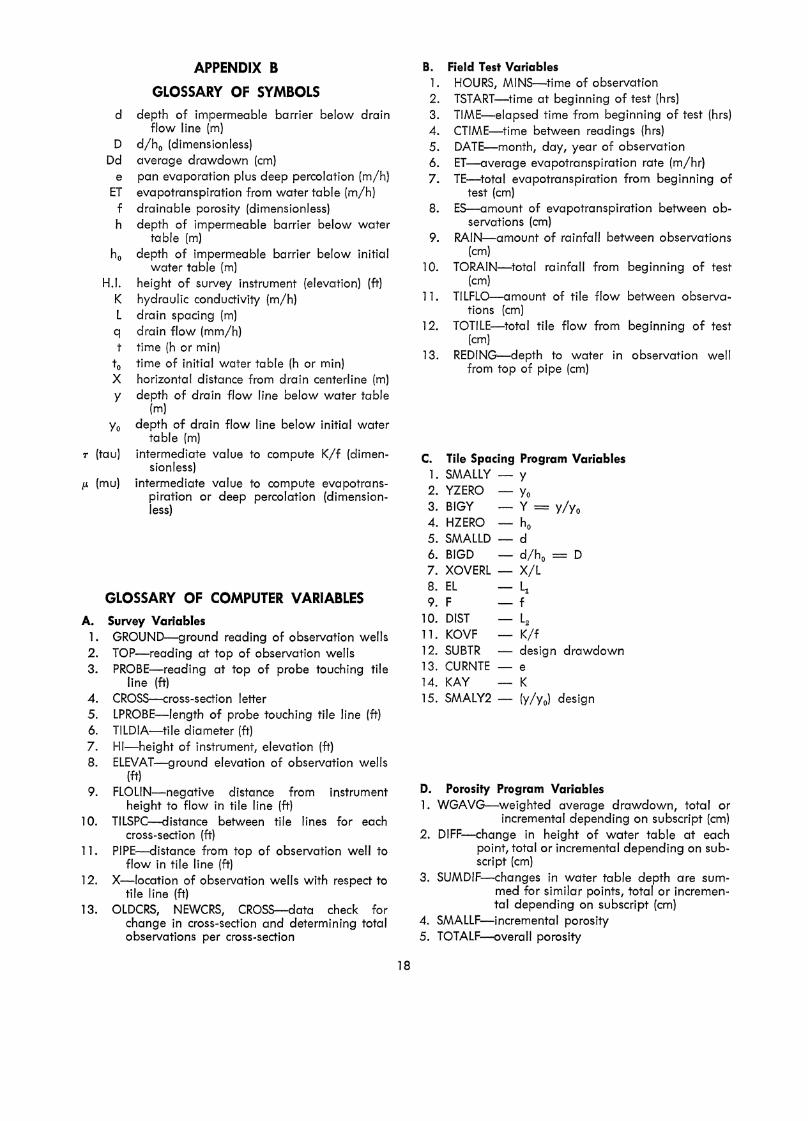
GLOSSARY OF SYMBOLS
d depth of impermeable barrier below drain flow line (m)
D d/h0 (dimensionless) Dd average drawdown (em)
e pan evaporation plus deep percolation (m/h) ET evapotranspiration from water table (m/h)
f drainable porosity (dimensionless) h depth of impermeable barrier below water
table (m) h0 depth of impermeable barrier below initial
water table (m) H.l. height of survey instrument (elevation) (ft)
K hydraulic conductivity (m/h) l drain spacing (m) q drain flow (mm/hl t time (h or min)
t0 time of initial water table (h or min) X horizontal distance from drain centerline (m) y depth of drain flow line below water table
(m)
Yo depth of drain flow line below initial water table (m)
r (tau) intermediate value to compute K/f (dimensionless)
p. (mu) intermediate value to compute evapotranspiration or deep percolation (dimensionless)
GLOSSARY OF COMPUTER VARIABLES
A. Survey Variables 1. GROUND-ground reading of observation wells 2. TOP-reading at top of observation wells 3. PROBE-reading at top of probe touching tile
line (ft) 4. CROSS-cross-section letter 5. LPROBE-Iength of probe touching tile line (ft) 6. TILDIA-tile diameter (ft) 7. HI-height of instrument, elevation (ft) 8. ELEVAT-ground elevation of observation wells
{ft) 9. FLOLIN-negative distance from instrument
height to flow in tile line (ft) 10. TILSPC-distance between tile lines for each
cross-section {ft) 11. PIPE-distance from top of observation well to
flow in tile line (ft) 12. X-location of observation wells with respect to
tile line (ft) 13. OLDCRS, NEWCRS, CROSS-data check for
change in cross-section and determining total observations per cross-section
18
B. Field Test Variables 1. HOURS, MINS-time of observation 2. TSTART-time at beginning of test (hrs) 3. TIME-elapsed time from beginning of test (hrs) 4. CTIME-time between readings (hrs) 5. DATE-month, day, year of observation 6. ET-average evapotranspiration rate (m/hr} 7. TE-total evapotranspiration from beginning of
test (em) 8. ES-amount of evapotranspiration between ob
servations (em) 9. RAIN-amount of rainfall between observations
(em) 10. TORAIN-total rainfall from beginning of test
(em) 11. TILFLO-amount of tile flow between observa
tions (em) 12. TOTILE-total tile flow from beginning of test
(em) 13. REDING-depth to water in observation well
from top of pipe (em)
C. Tile Spacing Program Variables 1. SMALLY- y 2. YZERO -Yo 3. BIGY - Y = YIYo 4. HZERO - h0
5. SMALLD- d 6. BIGD - d/h0 = D 7. XOVERL - X/l 8. El - l1
9. F --- f 10. DIST --- L2 11. KOVF - K/f 12. SUBTR - design drawdown 13. CURNTE - e 14. KAY K 15. SMALY2 - (y/y0) design
D. Porosity Program Variables 1. WGAVG-weighted average drawdown, total or
incremen~al depending on subscript (em) 2. DIFF-change in height of water table at each
point, total or incremental depending on subscript (em)
3. SUMDIF-changes in water table depth are summed for similar points, total or incremental depending on subscript (em)
4. SMALLF-incremental porosity 5. TOTALF-overall porosity

APPENDIX C
COMPUTER OPERATIONS AND ASSUMPTIONS A. Porosity Calculation (F-VALUE program)
Q-ET f=---
WGAVG f = porosity
Q =tile flow
(STATEMENT 241, 242)
ET = water loss from pan (-), and rainfa II !+l- For 10 em drawdown use ET = 0.7 pan, for 20 em ET = 0.6 pan, and for 30 em ET = 0.5 pan.
WGAVG = weighted grand average of drawdown and
WGAVG = 0.35 Dd (X/L = 1/10), +0.40 Dd (X/L = 1/4), +0.25 Dd (X/L = 1/2) (STATEMENT 235) Dd = average drawdown at various distances between tile lines
B. Tile Spacing Calculation (TILSPAC program)
1. GETTAU interpolation based on obtaining a K compatible with two equations: TL2
K/f = -- (1) (SUBROUTINE DSTNCE, STATEMENT 18) hotl
where T is selected from the chart for a proper p.: -e L2
p. = --- (2) (SUBROUTINE DSTNCE, STATEMENT 22) K ho2
2. DIST (spacing) calculated by:
(SUBROUTINE DSTNCE, STATEMENT 35)
C. Inaccurate Data Treatment 1. All readings are limited to the soil surface. If a reading is read above the surface, it is set equal to
a reading on the soil surface. 2. A test will be terminated when rainfall (ET> 0) is accompanied by a rise in the water table levels at
any of the test wells. 3. Any zero readings or dry wells (9999) are flagged by a -999, and are ignored in the calculation. 4. Program must have three cross-sections per test. False cross-sections must be supplied when there are
only one or two valid cross-sections. A false deck should be blank with a cross-section character where necessary. False observation well data require only one card per cross-section.
5. If a zero appears as the initial reading for a given well, an extrapolation is attempted. Extrapolation depends on: a. Number of consecutive zero readings. If greater than two, data for the given well are invalid. b. Water table movement: if depth does not increase from second to third, first reading is set equal to
second. If depth does increase, first reading is determined by a time based extrapolation using the second and third readings.
c. If the value of the third reading is nonzero and the second reading zero, the second reading is calculated based on the third and fourth reading. Then the first reading is calculated based on the second and third reading as before. Extrapolation statements: DEL= REDING (1, J, K+ 1)- REDING (1, J, K) CTIME (I, K) = TIME (K, K) - TIME (I, K -1)
CTIME (1, K) REDING (I, J, K- 1) =REDING (1, J, K) -DEL*----where K = 2 or 3 only. CTIME (I, K + 1) (Refer to SUBROUTINE FIXUP of both programs}
19
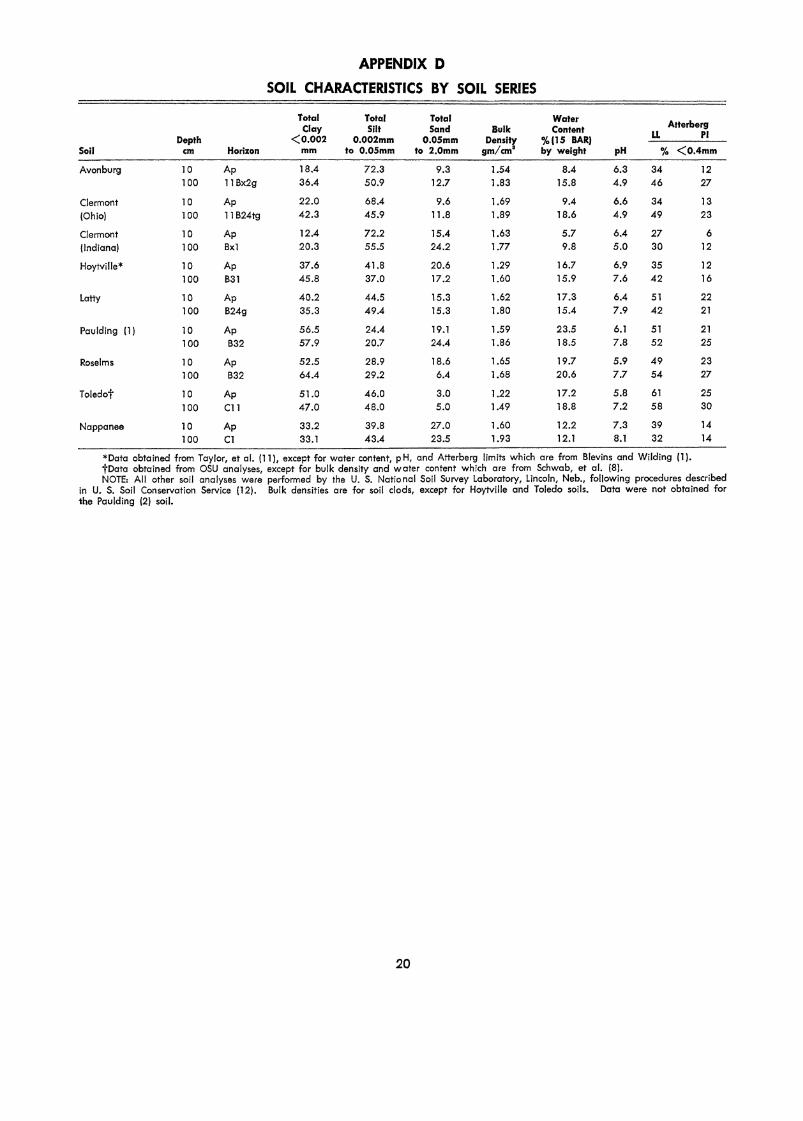
APPENDIX D
SOIL CHARACTERISTICS BY SOIL SERIES
1otal Total Total Water Atterberg Clay Slit Sand Bulk Content Depth <o.oo2 0.002mm O.OSmm Density %(15 BAR) LL PI
Soil em Horizon mm to 0.05mm to 2.0mm gm/cm" by weight pH % <o.4mm
Avon burg 10 Ap 18.4 72.3 9.3 1.54 8.4 6.3 34 12 100 118x2g 36.4 50.9 12.7 1.83 15.8 4.9 46 27
Clermont 10 Ap 22.0 68.4 9.6 1.69 9.4 6.6 34 13 (Ohio) 100 11 824tg 42.3 45.9 11.8 1.89 18.6 4.9 49 23
Clermont 10 Ap 12.4 72.2 15.4 1.63 5.7 6.4 27 6 {Indiana) 100 8xl 20.3 55.5 24.2 1.77 9.8 5.0 30 12
Hoytville* 10 Ap 37.6 41.8 20.6 1.29 16.7 6.9 35 12 100 831 45.8 37.0 17.2 1.60 15.9 7.6 42 16
Latty 10 Ap 40.2 44.5 15.3 1.62 17.3 6.4 51 22 100 824g 35.3 49.4 15.3 1.80 15.4 7.9 42 21
Paulding Ill 10 Ap 56.5 24.4 19.1 1.59 23.5 6.1 51 21 100 832 57.9 20.7 24.4 1.86 18.5 7.8 52 25
Roselms 10 Ap 52.5 28.9 18.6 1.65 19.7 5.9 49 23 100 832 64.4 29.2 6.4 1.68 20.6 7:7 54 27
Toledot 10 Ap 51.0 46.0 3.0 1.22 17.2 5.8 61 25
100 Cll 47.0 48.0 5.0 1.49 18.8 7.2 58 30
Nappanee 10 Ap 33.2 39.8 27.0 1.60 12.2 7.3 39 14
100 C1 33.1 43.4 23.5 1.93 12.1 8.1 32 14
*Data obtained from Taylor, et al. (11), except for water content, pH, and Atterberg limits which are from Blevins and Wilding (1). tData obtained from OSU analyses, except for bulk density and water content which are from Schwab, et al. (8). NOTE: All other soil analyses were performed by the U. S. National Soil Survey Laboratory, Lincoln, Neb., following procedures described
in U. S. Soil Conservation Service (12). Bulk densities are for soil clods, except for Hoytville and Toledo soils. Data were not obtained for the Paulding (2) soil.
20

BETTER LIVING IS THE PRODUCT of research at the Ohio Agricultural Research and Development Center. All Ohioans benefit from this product.
Ohio's farm families benefit from the results of agricultural research translated into increased earnings and improved living conditions. So do the families of the thousands of workers employed in the firms making up the state's agribusiness complex.
But the greatest benefits of agricultural research flow to the millions of Ohio consumers. They enjoy the end products of agricultural science-the world's most wholesome and nutritious food, attractive lawns, beautiful ornamental plants, and hundreds of consumer products containing· ingredients originating on the farm, in the greenhouse and nursery, or in the forest.
The Ohio Agricultural Experiment Station, as the Center was called for 83 years, was established at The Ohio State University, Columbus, in 1882. Ten years later, the Station was moved to its present location in Wayne County. In 1965, the Ohio General Assembly passed legislation changing the name to Ohio Agricultural Research and Development Center-a name which more accurately reflects the nature and scope of the Center's research program today.
Research at OARDC deals with the improvement of all agricultural production and marketing practices. It is concerned with the development of an agricultural product from germination of a seed or development of an embryo through to the consumer's dinner table. Jt is directed at improved human nutrition, family and child development, home management, and all other aspects of family life. It is geared to enhancing and preserving the quality of our environment.
Individuals and groups are welcome to visit the OARDC, to enjoy the attractive buildings, grounds, and arboretum, and to observe first hand research aimed at the goal of Better Living for All Ohioans!

7~ seaee '74 ~ ea~ /o~t /l~~~adZJ~
__ J __ _
1 SOUTHERN 1 BRANCH , •r
I
Ohio's major soil types and climatic conditions are represented at the Research Center's 12 locations.
Research is conducted by 15 departments on more than 7000 acres at Center headquarters in Wooster, eight branches, Pomerene Forest Laboratory, North Appalachian Experimental Watershed, and The Ohio State University. Center Headquarters, Wooster, Wayne
County: 1953 acres Eastern Ohio Resource Development Cen
ter, Caldwell, Noble County: 2053 acres
Jackson Branch, Jackson, Jackson County: 502 acres
Mahoning County Farm, Canfield: 275 acres
Muck Crops Branch, Willard, Huron County: 15 acres
North Appalachian Experimental Watershed, Coshocton, Coshocton County: 1047 acres (Cooperative with Agricultural Research Service, U. S. Dept. of Agriculture)
Northwestern Branch, Hoytville, Wood County: 247 acres
Pomerene Forest Laboratory, Coshocton County: 227 acres
Southern Branch, Ripley, Brown County: 275 acres
Vegetable Crops Branch, Fremont, Sandusky County: 105 acres
Western Branch, South Charleston, Clark County: 428 acres