spalding university fact book 2012-2013 documents/factbooks...quality undergraduate and graduate...
TRANSCRIPT

Spalding University Fact Book 2012-2013
Prepared by the
Office of Institutional Effectiveness
November 2013
Confidential for
Internal Use Only


i Spalding University Fact Book 2012-2013
Table of Contents Forward ................................................................................................. 1
University Profile ................................................................................... 2
Carnegie Classification ........................................................................... 2
History and Characteristics .................................................................... 3
Location ................................................................................................. 3
Mission Statement ................................................................................. 4
Academic Calendars ............................................................................... 4
Undergraduate Academic Calendar 2012-2013 ..................................... 4
Adult Accelerated Program Academic Calendar 2012-2013 .................. 4
Graduate Academic Calendar 2012-2013 ............................................... 4
University Accreditation ........................................................................ 5
Professional Accreditation ..................................................................... 5
List of Degrees ....................................................................................... 7
Administration and Leadership Team .................................................... 9
Board of Trustees ................................................................................. 10
Deans and Chairs ................................................................................. 11
Codes ................................................................................................... 12
Library ................................................................................................. 13
Technology .......................................................................................... 14
Admissions 2011-2012 ......................................................................... 15
Undergraduate Admission Requirements ............................................ 16
Graduate Admission Requirements ..................................................... 16
Completion Rates reported in IPEDS .................................................... 17
Professional Exam Pass Rates .............................................................. 19
Graduation Rates as Reported to IPEDS ............................................... 20
Tuition and Cost – 2012-2013 ............................................................... 21
Tuition and Fees – 2012-2013 .............................................................. 21
Housing Costs– 2012-2013 ................................................................... 22
Tuition and Cost as reported in IPEDS Institutional Characteristics ..... 23
Financial Aid ........................................................................................ 25
Financial Aid 2012: Full-time, First-Time, Degree-Seeking Cohort (as reported in IPEDS) ................................................................................ 25
College Affordability ............................................................................ 25
Student Enrollment .............................................................................. 26
Student Ethnicity ................................................................................. 28
Undergraduate Student Diversity (CPE Fall Enrollment 2012) ............. 29
Graduate Student Diversity (CPE Fall Enrollment 2012) ...................... 29
Enrollment ........................................................................................... 30
ii Spalding University Fact Book 2012-2013
Age of Students .................................................................................... 31
ETS Proficiency Profile .......................................................................... 32
Full Time Faculty Profile 2012-13 .......................................................... 33
1 Spalding University Fact Book 2012-2013
Spalding University Fact Book 2012-2013
Forward You are reading the fifth edition of the Spalding University Fact Book. The Office of Institutional Effectiveness produced the 2012-2013 Fact Book in order to provide useful information to the Spalding University community. It serves as a reference for members of the university community providing data on students, programs, finances, and assessment activities. The data contained in this edition is based mostly on data reported for the 2011-12 academic year and compiled from various resources for comparative purposes. Information was obtained from Datatel student information system, the Integrated Postsecondary Education Data System (IPEDS), the Institute of Education Sciences, the U.S. Department of Education’s National Center for Education Statistics, and the Kentucky Council on Postsecondary Education. The Office of Institutional Effectiveness would like to extend its sincere thanks to everyone who has contributed to the production of this Fact Book. Comments, questions and feedback on this publication may be addressed to: Kay Vetter Director of Institutional Effectiveness Spalding University 845 S. Third Street Louisville, KY 40203 Email: [email protected] Phone: 502-873-4363 Fax: 502-992-2404
2 Spalding University Fact Book 2012-2013
University Profile Fall 2011 Fall 2012
Undergraduate Headcount 1371 1429
Graduate Headcount 1061 1086
Total Headcount 2432 2515
Undergraduate FTE 1180 1178
Graduate FTE 956 975
Total FTE (SACS Calculation) 2136 2153
Average Class Size = 13 students
Student Profile Undergraduate Graduate 74% Female 77% Female 26% Male 23% Male
Over 84% of our students are from KY Approximately 68% are from Jefferson County. 15% Out-of-state 1% International 31% Minority Faculty to Student ratio = 1:12
Carnegie Classification Level: 4-year or above
Control: Private not-for-profit
Classification Category
Undergraduate Instructional Program:
Prof+A&S/SGC: Professions plus arts & sciences, some graduate coexistence
Graduate Instructional Program:
Doc/Prof: Doctoral, professions dominant
Enrollment Profile: MU: Majority undergraduate
Undergraduate Profile: MFT4/I: Medium full-time four-year, inclusive
Size and Setting: S4/NR: Small four-year, primarily nonresidential
Basic: DRU: Doctoral/Research Universities
3 History and Characteristics
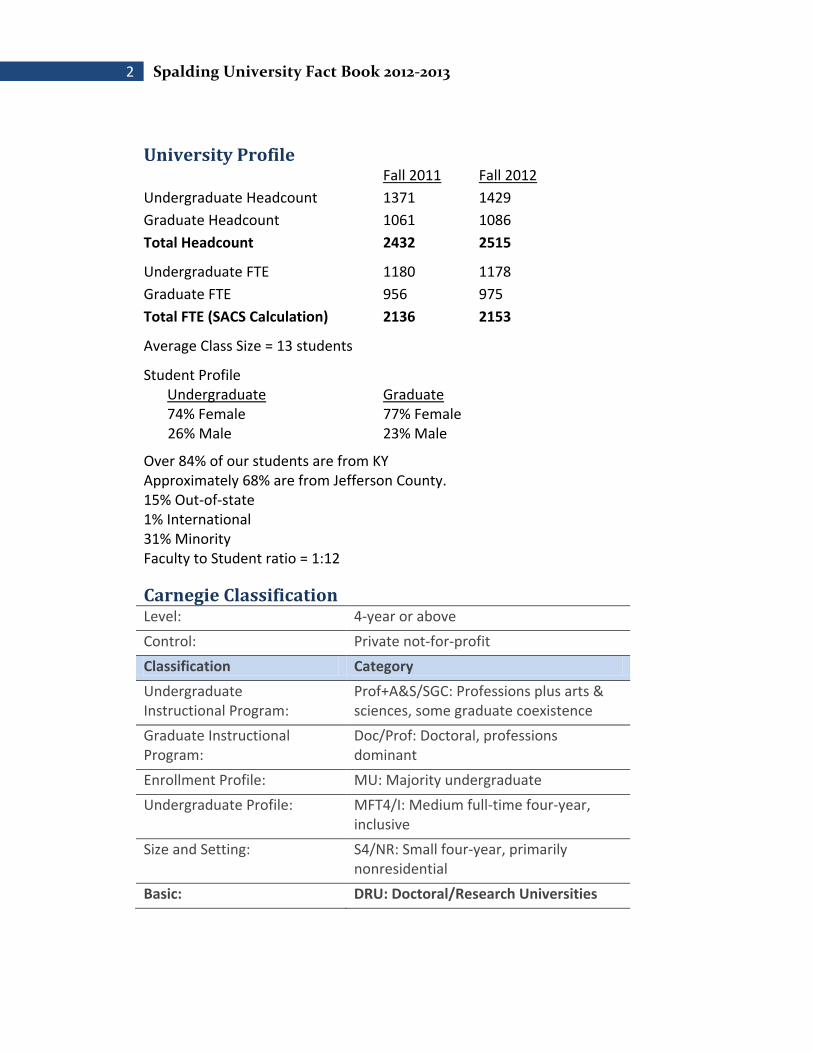
History and Characteristics Spalding University celebrates almost two centuries of academic tradition and service, extending back to 1814 when the Sisters of Charity of Nazareth established Nazareth Academy at Nazareth, near Bardstown, Kentucky. Since 1920, the private, Catholic institution has been located on an urban campus in downtown Louisville.
In 1973, the College was incorporated as an independent, urban, coeducational institution in the Catholic tradition for students of all traditions. In 1984, based on the wide range of programs offered, the institution was designated Spalding University; the 2005 Carnegie Classification recognized Spalding University as a Doctoral/Research University.
In 2003, Spalding began an innovative six-week session format for its daytime undergraduate programs. Students take one or two courses each session, and each academic year has seven sessions with a minimum one-week break between each session. Spalding also offers some undergraduate degree programs in an accelerated format, where students meet a minimum four hours per week for five weeks with a final two-hour sixth week. In addition, Spalding offers graduate degree programs in multiple formats: accelerated, traditional semester, and low- or brief-residency. Spalding continues its history of service to the Louisville area by providing programs that include components of the liberal arts and sciences and professional education for men and women of all ages and from all sectors of society.
Location Located in downtown Louisville, Spalding University's urban campus is located between the main business/government district of the city and Old Louisville, a neighborhood of elegant Victorian mansions, which in the latter half of the 19th century was the center of gracious living. Only blocks from Fourth Street Live!, the campus is also adjacent to the Louisville Free Public Library and is conveniently accessible to public transportation. Spalding offers hands-on, pre-professional internship and practicum experiences at renowned businesses, medical facilities, schools and corporate headquarters, which are in close proximity. Louisville Population (2010 census) 597,337 http://ksdc.louisville.edu
Kentucky Postsecondary Education County Profile
http://www.cpe.ky.gov/info/county/
4 Spalding University Fact Book 2012-2013
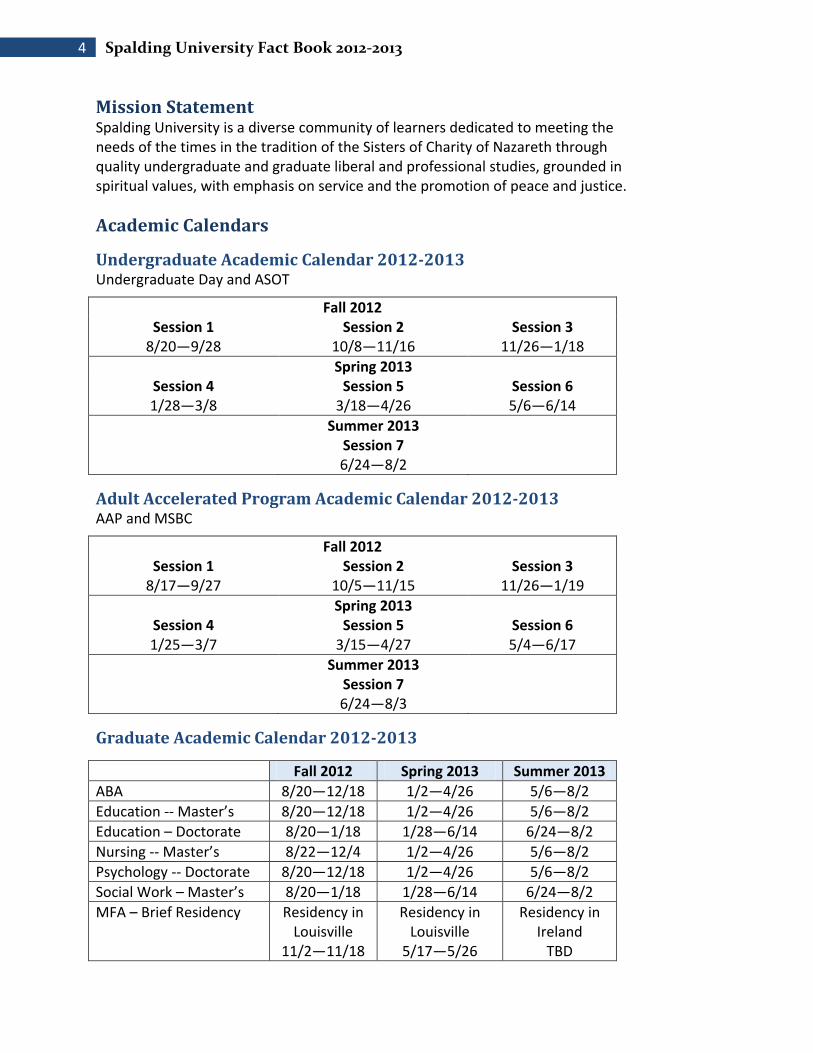
Mission Statement Spalding University is a diverse community of learners dedicated to meeting the needs of the times in the tradition of the Sisters of Charity of Nazareth through quality undergraduate and graduate liberal and professional studies, grounded in spiritual values, with emphasis on service and the promotion of peace and justice.
Academic Calendars
Undergraduate Academic Calendar 2012-2013 Undergraduate Day and ASOT
Fall 2012 Session 1
8/20—9/28 Session 2
10/8—11/16 Session 3
11/26—1/18
Spring 2013 Session 4 1/28—3/8
Session 5 3/18—4/26
Session 6 5/6—6/14
Summer 2013 Session 7 6/24—8/2
Adult Accelerated Program Academic Calendar 2012-2013 AAP and MSBC
Fall 2012 Session 1
8/17—9/27 Session 2
10/5—11/15 Session 3
11/26—1/19
Spring 2013 Session 4 1/25—3/7
Session 5 3/15—4/27
Session 6 5/4—6/17
Summer 2013 Session 7 6/24—8/3
Graduate Academic Calendar 2012-2013
Fall 2012 Spring 2013 Summer 2013
ABA 8/20—12/18 1/2—4/26 5/6—8/2
Education -- Master’s 8/20—12/18 1/2—4/26 5/6—8/2
Education – Doctorate 8/20—1/18 1/28—6/14 6/24—8/2
Nursing -- Master’s 8/22—12/4 1/2—4/26 5/6—8/2
Psychology -- Doctorate 8/20—12/18 1/2—4/26 5/6—8/2
Social Work – Master’s 8/20—1/18 1/28—6/14 6/24—8/2
MFA – Brief Residency Residency in Louisville
11/2—11/18
Residency in Louisville
5/17—5/26
Residency in Ireland
TBD
5 University Accreditation
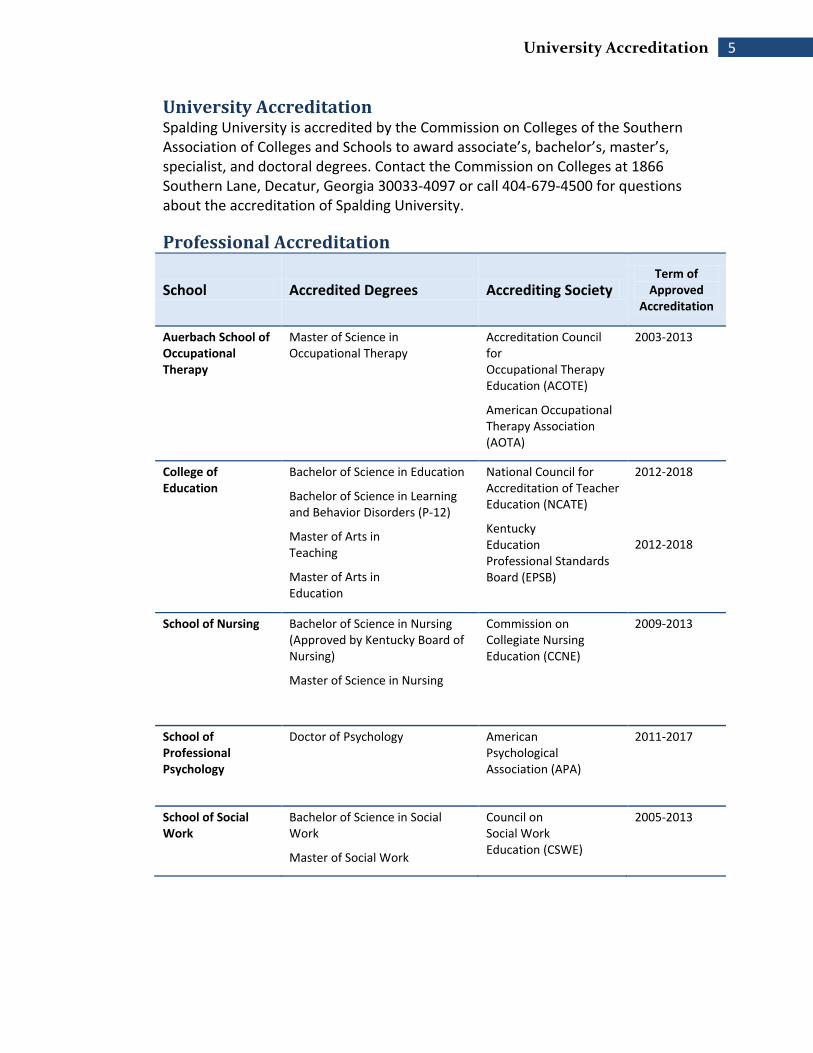
University Accreditation Spalding University is accredited by the Commission on Colleges of the Southern Association of Colleges and Schools to award associate’s, bachelor’s, master’s, specialist, and doctoral degrees. Contact the Commission on Colleges at 1866 Southern Lane, Decatur, Georgia 30033-4097 or call 404-679-4500 for questions about the accreditation of Spalding University.
Professional Accreditation
School Accredited Degrees Accrediting Society Term of
Approved
Accreditation
Auerbach School of Occupational Therapy
Master of Science in Occupational Therapy
Accreditation Council for Occupational Therapy Education (ACOTE)
American Occupational Therapy Association (AOTA)
2003-2013
College of Education
Bachelor of Science in Education
Bachelor of Science in Learning and Behavior Disorders (P-12)
Master of Arts in Teaching
Master of Arts in Education
National Council for Accreditation of Teacher Education (NCATE)
Kentucky Education Professional Standards Board (EPSB)
2012-2018
2012-2018
School of Nursing Bachelor of Science in Nursing (Approved by Kentucky Board of Nursing)
Master of Science in Nursing
Commission on Collegiate Nursing Education (CCNE)
2009-2013
School of Professional Psychology
Doctor of Psychology American Psychological Association (APA)
2011-2017
School of Social Work
Bachelor of Science in Social Work
Master of Social Work
Council on Social Work Education (CSWE)
2005-2013
6 Spalding University Fact Book 2012-2013
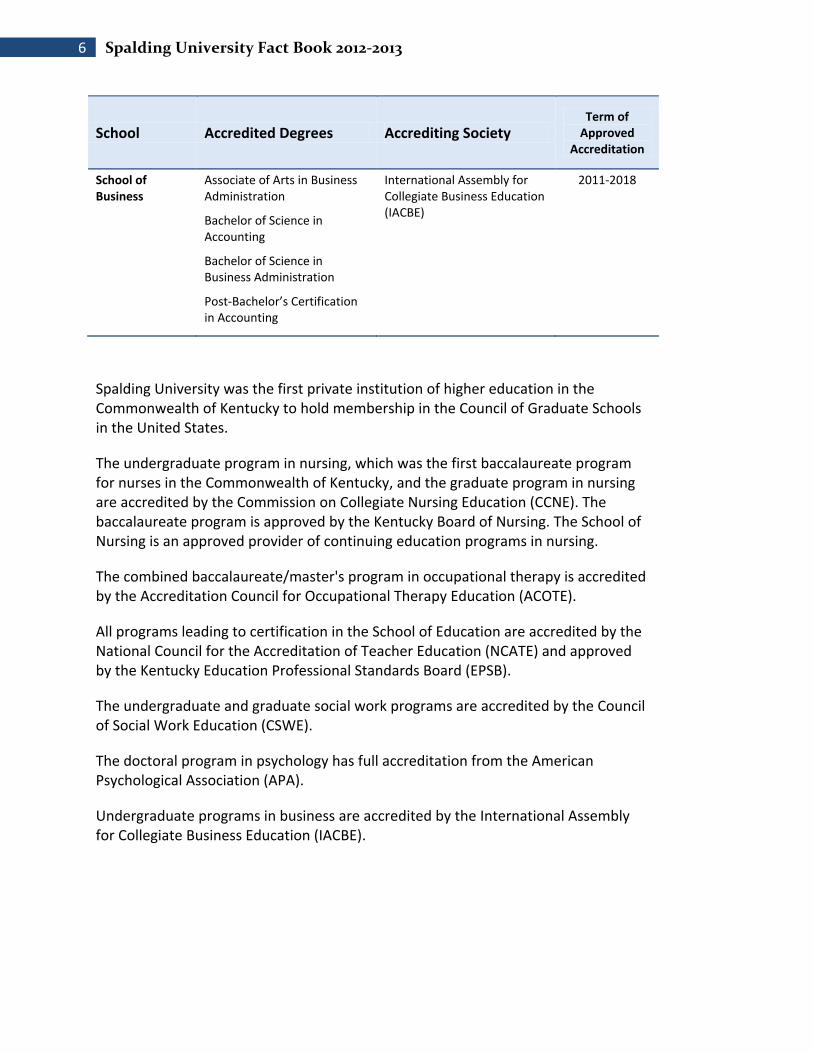
School Accredited Degrees Accrediting Society Term of
Approved
Accreditation
School of Business
Associate of Arts in Business Administration
Bachelor of Science in Accounting
Bachelor of Science in Business Administration
Post-Bachelor’s Certification in Accounting
International Assembly for Collegiate Business Education (IACBE)
2011-2018
Spalding University was the first private institution of higher education in the Commonwealth of Kentucky to hold membership in the Council of Graduate Schools in the United States.
The undergraduate program in nursing, which was the first baccalaureate program for nurses in the Commonwealth of Kentucky, and the graduate program in nursing are accredited by the Commission on Collegiate Nursing Education (CCNE). The baccalaureate program is approved by the Kentucky Board of Nursing. The School of Nursing is an approved provider of continuing education programs in nursing.
The combined baccalaureate/master's program in occupational therapy is accredited by the Accreditation Council for Occupational Therapy Education (ACOTE).
All programs leading to certification in the School of Education are accredited by the National Council for the Accreditation of Teacher Education (NCATE) and approved by the Kentucky Education Professional Standards Board (EPSB).
The undergraduate and graduate social work programs are accredited by the Council of Social Work Education (CSWE).
The doctoral program in psychology has full accreditation from the American Psychological Association (APA).
Undergraduate programs in business are accredited by the International Assembly for Collegiate Business Education (IACBE).
7 List of Degrees
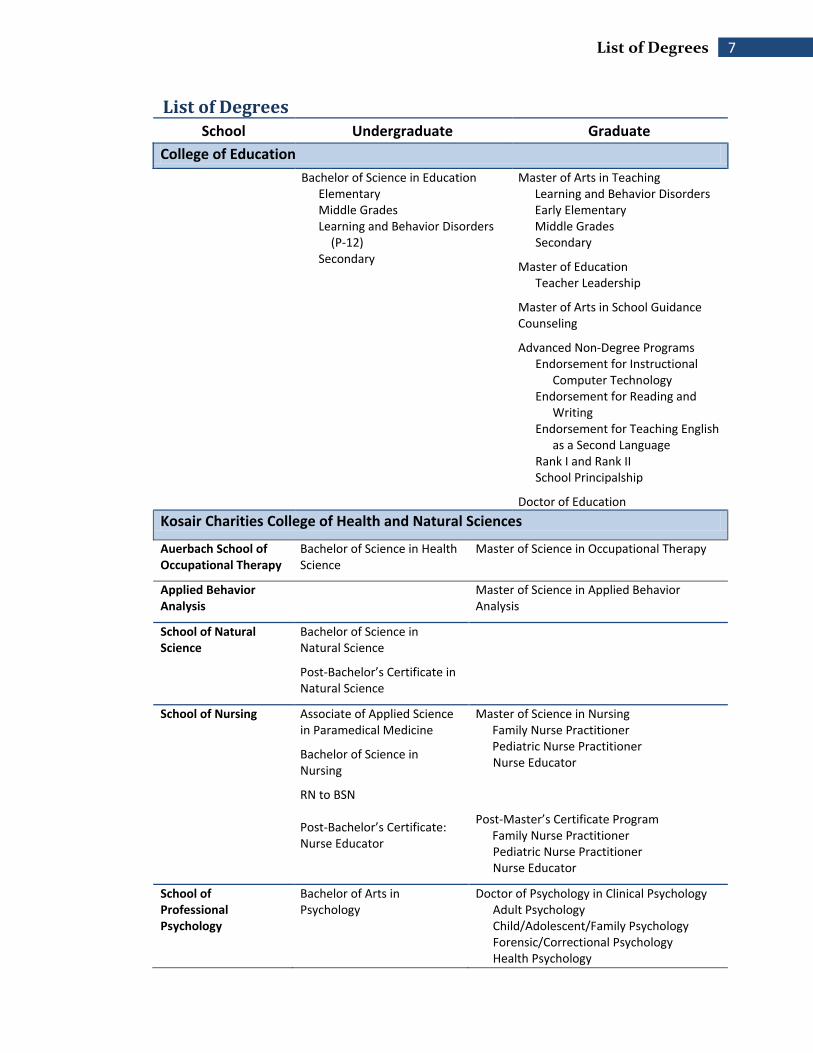
List of Degrees School Undergraduate Graduate
College of Education
Bachelor of Science in Education Elementary Middle Grades Learning and Behavior Disorders
(P-12) Secondary
Master of Arts in Teaching Learning and Behavior Disorders Early Elementary Middle Grades Secondary
Master of Education Teacher Leadership
Master of Arts in School Guidance Counseling
Advanced Non-Degree Programs Endorsement for Instructional
Computer Technology Endorsement for Reading and
Writing Endorsement for Teaching English
as a Second Language Rank I and Rank II School Principalship
Doctor of Education
Kosair Charities College of Health and Natural Sciences
Auerbach School of Occupational Therapy
Bachelor of Science in Health Science
Master of Science in Occupational Therapy
Applied Behavior Analysis
Master of Science in Applied Behavior Analysis
School of Natural Science
Bachelor of Science in Natural Science
Post-Bachelor’s Certificate in Natural Science
School of Nursing Associate of Applied Science in Paramedical Medicine
Bachelor of Science in Nursing
RN to BSN Post-Bachelor’s Certificate: Nurse Educator
Master of Science in Nursing Family Nurse Practitioner Pediatric Nurse Practitioner Nurse Educator
Post-Master’s Certificate Program
Family Nurse Practitioner Pediatric Nurse Practitioner Nurse Educator
School of Professional Psychology
Bachelor of Arts in Psychology
Doctor of Psychology in Clinical Psychology Adult Psychology Child/Adolescent/Family Psychology Forensic/Correctional Psychology Health Psychology

8 Spalding University Fact Book 2012-2013
College of Social Sciences and Humanities
School of Business Associate of Arts in Business Administration
Bachelor of Science in Accounting
Bachelor of Science in Business Administration Business Management Marketing Human Resource Management
Post-Bachelor’s Certificate in Accounting
Master of Science in Business Communication
Organizational Leadership Project Management Healthcare Management
Nonprofit Administration
School of Communication
Bachelor of Science in Communication
Communication Studies Business Communication
Emerging Media
School of Liberal Studies
Bachelor of Arts in Interdisciplinary Social Sciences
Bachelor of Arts in Interdisciplinary Humanities
Bachelor of Fine Arts in Creative Writing
School of Social Work Bachelor of Science in Social Work
Master of Social Work
Master of Fine Arts in Writing

9 Administration and Leadership Team
Administration and Leadership Team Name and Title
Tori Murden McClure, J.D., M. Div., MFA
President
L. Randy Strickland, Ed.D., OTR/L, FAOTA
Provost
Joanne Berryman, Ed.D. Dean, Kosair Charities College of Health and Natural Sciences
John James, Ph.D. Dean, College of Social Sciences and Humanities
Beverly Keepers, Ph.D. Dean, College of Education
Rick Hudson, Ph.D. Dean of Students
Chris Hart, M.Ed. Dean of Enrollment Management
Mark Hohmann, MBA
Chief Financial Officer
Ezra Krumhansl, MBA
Chief Information Officer
Rick Barney
Chief Marketing Officer
Bobbie Rafferty
Director of Advancement and Philanthropy
Roger Burkman Athletic Director
Kay Vetter, MSBC Director of Institutional Effectiveness
Ron Jackson, MSSW Director of Student Leadership and Development
Jennifer Brockhoff Manager of Human Resources
Beth Newberry, MFA Strategic Storyteller Administration Suite Fax: 502-992-2404 Address: 845 South Third Street Louisville, KY 40203

10 Spalding University Fact Book 2012-2013
Board of Trustees Chair: Jon A. Meyer First Vice Chair: Brian B. Reynolds, Ed.D. ‘99 Second Vice Chair: Paul M. Ratterman Board Secretary: Beth Niblock President: Tori Murden McClure Andrew G. Beshear Wiliam A. Blodgett, Jr. Jeff Bringardner Paul Chrisco Christie Coe ‘08 Al Cornish Helen Donaldson ’59 ‘88 M. Serra Goethals, SCN ‘70 DeVone Holt Rose Howard, SCN Dana Jackson ‘99 David Karem Cordell Lawrence ‘94 Angela Leet James A. Morris Janet Geurin Muller ‘73 Neal Richmond, M.D. James Rissler Perry E. Sangalli, Ed.D ‘98 William E. Summers V Nancy L. Warfield ’86 ’06 Mary C. Osbourn Wolford ‘59 Faculty Representative: John Burden Trustees Emeriti Jean W. Frazier ‘56 Joseph E. Kutz, M.D. Harry B. Troutman
11 Deans and Chairs
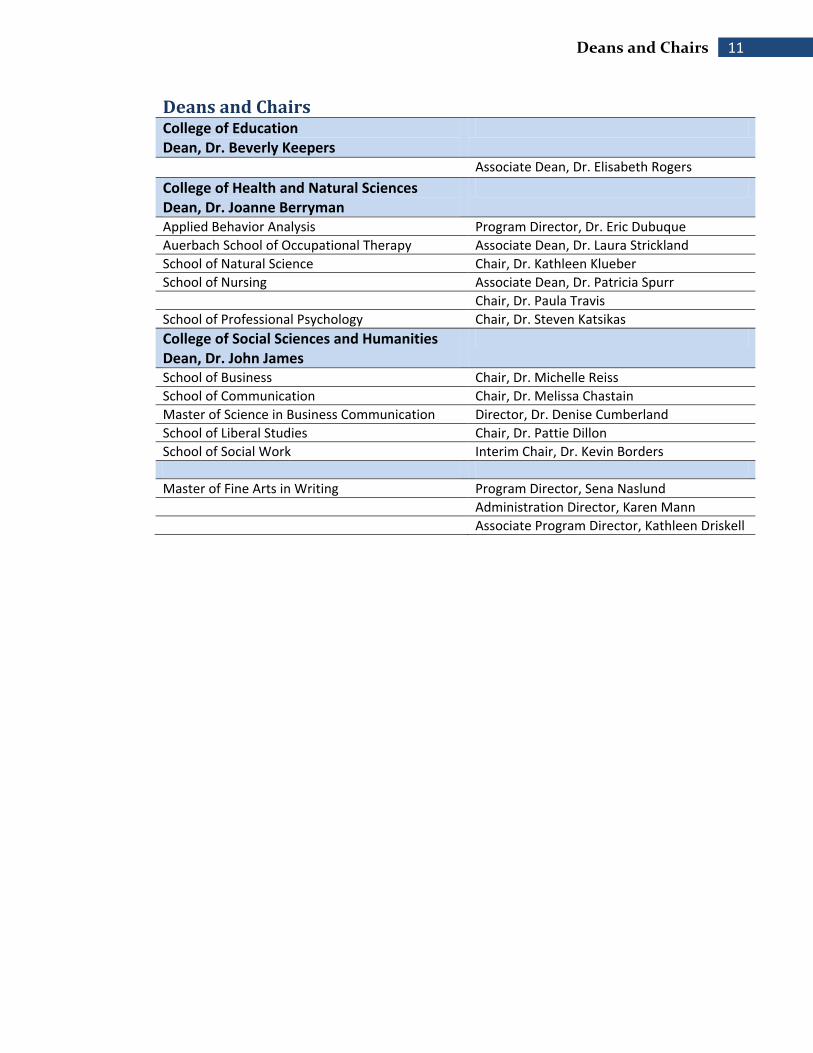
Deans and Chairs College of Education Dean, Dr. Beverly Keepers
Associate Dean, Dr. Elisabeth Rogers
College of Health and Natural Sciences Dean, Dr. Joanne Berryman
Applied Behavior Analysis Program Director, Dr. Eric Dubuque
Auerbach School of Occupational Therapy Associate Dean, Dr. Laura Strickland
School of Natural Science Chair, Dr. Kathleen Klueber
School of Nursing Associate Dean, Dr. Patricia Spurr Chair, Dr. Paula Travis
School of Professional Psychology Chair, Dr. Steven Katsikas
College of Social Sciences and Humanities Dean, Dr. John James
School of Business Chair, Dr. Michelle Reiss
School of Communication Chair, Dr. Melissa Chastain
Master of Science in Business Communication Director, Dr. Denise Cumberland
School of Liberal Studies Chair, Dr. Pattie Dillon
School of Social Work Interim Chair, Dr. Kevin Borders
Master of Fine Arts in Writing Program Director, Sena Naslund
Administration Director, Karen Mann
Associate Program Director, Kathleen Driskell

12 Spalding University Fact Book 2012-2013
Codes ACT Code = 1534 ATP Code – American Testing Program Code – See CEEB CEEB Code = 1552 (College Entrance Examination Board) [aka ATP Code] - 4-digit code used by standardized tests, such as SAT. College Board Code – See CEEB Federal Unit ID = 157757 - 6-digit identification number assigned to institutions that are in the Postsecondary Education Participants System (PEPS). This system is maintained by the Office of Postsecondary Education (OPE) which tracks the eligibility status of postsecondary institutions. This number is a unique identification assigned to postsecondary institutions surveyed throughout the Integrated Postsecondary Education Data Systems (IPEDS). FICE = 001960 - 6-digit code originally created by the Federal Interagency Committee on Education. OPEID = 001960 - Identification number used by the U.S. Department of Education's
Office of Postsecondary Education (OPE) to identify schools that have Program
Participation Agreements (PPA) so that its students are eligible to participate in
Federal Student Financial Assistance programs under Title IV regulations.

13 Library
Library
Spalding University Through Ownership
The Kentuckiana Metroversity, Inc.
By Formal Agreement
Association of Independent Kentucky Colleges and
Universities By Formal Agreement
101,266 Print Materials
102 Print Serial Titles
2,330 Audio-Visual Units
45 Online Databases & Encyclopedias
575 Online Reference Books
At least 2,489,002 Print Materials
At least 18,097 Serials
At least 286 Databases
Abstracting and Full-Text for 2,742 Periodical Titles
Through Kentucky Virtual Network:
49 Databases
Kentucky Statistics
Kentuckiana Digital Library
The library offers many electronic resources with password access to more than 40 online databases and approximately 17,600 full-text online periodicals. Spalding University is a member of the LYRASIS the largest regional library network in the United States. In addition, the nationwide standard Online Computer Library Center (OCLC) cataloging utility is the library’s backbone for the creation of Voyager, the online catalog, interlibrary loan activities, technical services support, and staff training opportunities as well as additional discounted electronic resource licenses. The Spalding University Library also incorporates six special collections:
The Kentucky Collection contains works about the Commonwealth of Kentucky or by Kentucky authors.
The Juvenile Collection contains exemplars of children's literature across generations of writers, age groups of readers and genre.
The University Archives contain 1000 linear feet of documents about the history of the college, administrative and official files, photographs, publications, and memorabilia.
Housed by the Humanities Department, the Edith Stein Collection houses “one of a few worldwide centers that gather and maintain original manuscripts and first and special editions of the works and thoughts of this renowned phenomenologist.”
Housed in the Masters of Fine Arts (MFA) office, the MFA Library provides resources on the craft of writing as well as publications of Spalding University faculty and students as well as residency guest authors.

14 Spalding University Fact Book 2012-2013
Technology Spalding is committed to offering students the latest technology to support learning. The average age of computers on campus is 18 months. In our 8 computer labs we offer students access to a variety of software including: Microsoft Office, SPSS, the Adobe Suite, Google Docs, and SMART Notebook. We have 38 “smart” classrooms equipped with instructor computers, data projectors, SMART Boards, document cameras. High speed WI-FI is available throughout campus and is supported with a 200Mbps Internet connection. Each student is provided with a portal account to access email, Moodle, registration information, cloud based document creation and storage, and subscription based research tools.
The following chart details on campus and online resources:
Building Spalding University Campus Informational Resources
Library Main Floor has 60 Student Computer Stations IT “Smart” Staff Training Lab has 10 Computer Stations & Presenter
Station Connected to a Projector Mathematics (Carnegie Learning) Classroom Lab Complete wireless access throughout the Library Lecture Room now wired as “Smart” Classroom Room 111 has 20 student stations and 1 instructor station The 3rd Floor has a WI-FI student lounge, 3 “Smart” classrooms and a 24
seat computer lab
Teilhard Hall Computer Lab Classrooms (2), one has 20 Student Computer Stations and the other has 30 Student Computer Stations
7 “Smart” Classrooms have Instructor Stations connected to a Projector Complete wireless throughout
Mansion, East and West 6 “Smart” Classrooms have Instructor Stations connected to a Projector Complete wireless throughout 1 Education Lab- has 20 Student Stations plus a teacher station
connected to a projector
Third Street Academic Center
10 “Smart” Classrooms have Instructor Stations connected to a Projector 1 “Smart” Boardroom has Instructor Station connected to a Projector Complete wireless access throughout
University Center Complete wireless access throughout the University Center including the cafeteria
3 Student general use computers
College of Health and Natural Science Building
enTECH Computer Lab has 41 Student Computer Stations with Adaptive Technology
8 “Smart” classrooms connected to a projector Lab with 24 Student Computer Stations and one instructor station
connected to a projector Lab with 30 Student Computer Stations and one instructor station
connected to a projector

15 Admissions 2011-2012
Building Spalding University Campus Informational Resources
Home and Office Computers with Online Service
Access to Moodle, Google Docs, email, Web Advisor and to Library Electronic Resources
Residence Hall 6 Student general use computers and a printing kiosk
Admissions 2011-2012 (This data was updated February 7, 2012)
Admission Report 2011-2012 Day Undergrads-First Time Traditional
Term Student
Enrollment % Enrolled
11-12 Goals % of Goals
10-11 Totals % of 09-10
S11112 152 97% 129 118% 129 93%
S21112 2 100% 4 50% 4 80%
S31112 0 0% 0 0% 0 0%
S41112 8 89% 4 200% 4 80%
S51112 0 0% 1 0% 1 100%
S61112 0 0% 0 0% 0 0%
S71112 0 0% 0 0% 0 0%
Totals 162 97% 138 117% 138 93%
Admission Report 2011-2012 Day Undergrads-Transfer and Non Trad
Term Student
Enrollment % Enrolled
11-12 Goals % of Goals
10-11 Totals % of 09-10
S11112 99 95% 90 110%
90 95%
S21112 12 92% 14 86%
14 100%
S31112 6 75% 7 86%
7 88%
S41112 41 100% 55 75%
54 93%
S51112 6 86% 15 40%
15 94%
S61112 10 100% 8 125%
8 89%
S71112 9 100% 15 60%
16 94%
Totals 183 95% 204 90%
222 93%
Admission Report 2011-2012 Adult Accelerated Program
Term Student
Enrollment % Enrolled
11-12 Goals % of Goals
10-11 Totals % of 09-10
S11112 85 99% 67 127% 66 96%
S21112 23 100% 46 50% 46 88%
S31112 11 100% 12 92% 12 92%
S41112 56 100% 49 114% 49 89%
S51112 22 100% 34 65% 34 94%
S61112 18 100% 13 138% 13 93%
S71112 17 94% 25 68% 26 100%
Totals 232 99% 246 94% 246 93%
16 Spalding University Fact Book 2012-2013
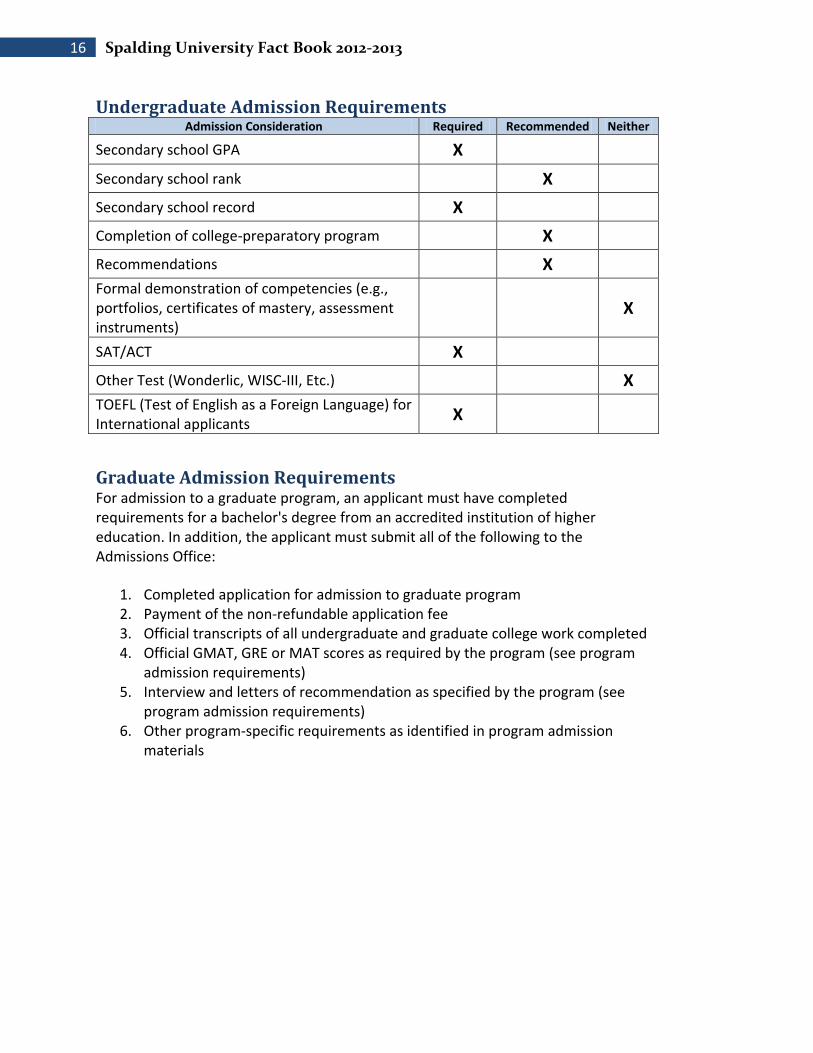
Undergraduate Admission Requirements Admission Consideration Required Recommended Neither
Secondary school GPA X
Secondary school rank
X
Secondary school record X
Completion of college-preparatory program
X
Recommendations
X
Formal demonstration of competencies (e.g., portfolios, certificates of mastery, assessment instruments)
X
SAT/ACT X
Other Test (Wonderlic, WISC-III, Etc.)
X
TOEFL (Test of English as a Foreign Language) for International applicants
X
Graduate Admission Requirements For admission to a graduate program, an applicant must have completed requirements for a bachelor's degree from an accredited institution of higher education. In addition, the applicant must submit all of the following to the Admissions Office:
1. Completed application for admission to graduate program 2. Payment of the non-refundable application fee 3. Official transcripts of all undergraduate and graduate college work completed 4. Official GMAT, GRE or MAT scores as required by the program (see program
admission requirements) 5. Interview and letters of recommendation as specified by the program (see
program admission requirements) 6. Other program-specific requirements as identified in program admission
materials

17 Completion Rates reported in IPEDS
Completion Rates reported in IPEDS This reflects the number of first-major degrees that were conferred that year.* *Column headings were updated for 2011-2012 to reflect new IPEDS regulations.
Nonresident Alien
Black or African
American
American Indian or Alaskan native
Asian Hispanic Latino
White Race / Ethnicity Unknown
Two or
More Races
Native Hawaiian or Other Pacific
Islander
TOTAL
2008
Men 4 11 0 2 1 54 19 N/A N/A 91
Women 1 58 4 12 2 187 83 N/A N/A 347
TOTAL 5 69 4 14 3 241 102 N/A N/A 438
2009
Men 6 8 0 1 2 49 16 N/A N/A 82
Women 7 51 1 5 3 177 86 N/A N/A 330
TOTAL 13 59 1 6 5 226 102 N/A N/A 412
2010
Men 6 15 0 1 3 51 20 N/A N/A 96
Women 9 88 3 7 2 208 66 N/A N/A 383
TOTAL 15 103 3 8 5 259 86 N/A N/A 479
2011
Men 4 14 0 2 1 67 11 1 0 100
Women 2 88 1 6 7 222 35 9 0 370
TOTAL 6 102 1 8 8 289 46 10 0 470
2012
Men 1 12 0 1 1 88 8 4 0 115
Women 3 102 3 6 11 292 35 12 0 464
TOTAL 4 114 3 7 12 380 43 16 0 579
18 Spalding University Fact Book 2012-2013
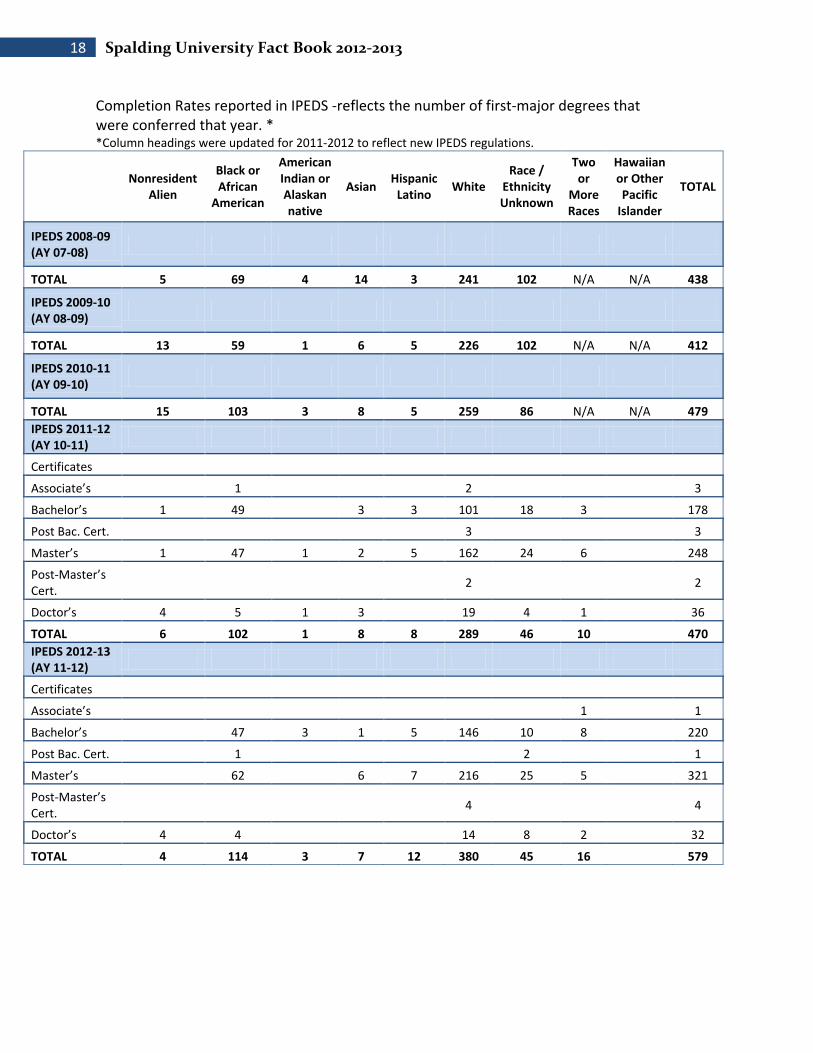
Completion Rates reported in IPEDS -reflects the number of first-major degrees that were conferred that year. * *Column headings were updated for 2011-2012 to reflect new IPEDS regulations.
Nonresident
Alien
Black or African
American
American Indian or Alaskan native
Asian Hispanic
Latino White
Race / Ethnicity Unknown
Two or
More Races
Hawaiian or Other Pacific
Islander
TOTAL
IPEDS 2008-09 (AY 07-08)
TOTAL 5 69 4 14 3 241 102 N/A N/A 438
IPEDS 2009-10 (AY 08-09)
TOTAL 13 59 1 6 5 226 102 N/A N/A 412
IPEDS 2010-11 (AY 09-10)
TOTAL 15 103 3 8 5 259 86 N/A N/A 479
IPEDS 2011-12 (AY 10-11)
Certificates
Associate’s 1 2 3
Bachelor’s 1 49 3 3 101 18 3 178
Post Bac. Cert. 3 3
Master’s 1 47 1 2 5 162 24 6 248
Post-Master’s Cert.
2 2
Doctor’s 4 5 1 3 19 4 1 36
TOTAL 6 102 1 8 8 289 46 10 470
IPEDS 2012-13 (AY 11-12)
Certificates
Associate’s 1 1
Bachelor’s 47 3 1 5 146 10 8 220
Post Bac. Cert. 1 2 1
Master’s 62 6 7 216 25 5 321
Post-Master’s Cert.
4 4
Doctor’s 4 4 14 8 2 32
TOTAL 4 114 3 7 12 380 45 16 579

19 Professional Exam Pass Rates
Professional Exam Pass Rates Even though this data is an important benchmark, results of exam pass rate timelines are not consistent among associations which report the data. Below is a list of our most current pass rate data available: Auerbach School of Occupational Therapy-According to NBCOT data, graduate students who passed their exam within 12 months of graduation in the Auerbach School of Occupational Therapy had a 97% pass rate in 2011. The three year average pass rate for this program is 98%. College of Education-For the 2011-12 academic year, 55 College of Education Initial Certification students (graduate and undergraduate) completed 141 individual Praxis tests, representing 18 different content areas with a 98% pass rate. School of Nursing-According to data released by the Kentucky Board of Nursing the pass rate for Spalding nursing students follows: An 93% pass rate for 68 students who took the NCLEX in 2012. School of Professional Psychology-2011 data from students sitting for the EPPP indicates a 78% pass rate for students who successfully completed the exam on their first attempt and 92% pass rate for those students who attempted the EPPP a second time. School of Social Work-In 2011 we had one BSSW student sit for their state licensure, she passed on a subsequent sitting making the pass rate 50%. There were a total of 21 MSW students who sat for the board exam and 14 passed on the initial test, and one additional student passed on another attempt making the overall pass rate 68%.

20 Spalding University Fact Book 2012-2013
Graduation Rates as Reported to IPEDS A recent review of retention data indicates that students are taking longer to complete their studies, again impacting four and six year graduation rates. When calculating these rates IPEDS only looks at traditional first-time, full-time, degree seeking students, which has been about 10% of Spalding undergraduates each year and consists of about 100 students. Because of small cohorts, a handful of students can greatly influence the graduation rate calculation. We need to continue to follow up with students who are no longer enrolled to see if they fall into any of the IPEDS exemption categories which can also help with more positive calculations going forward. Recent IPEDS Graduation Rate for First-Time, Full-Time, Degree-Seeking Cohorts
2004-05
2005-06
2006-07
2007-08
2008-09
2009-10
2010-11
2011-12
Spalding University
48.8% 29.0% 23.9% 35.0% 34.0% 49.0% 42% 44%
University of
Louisville
36.8% 40.7% 43.7% 46.0% 48.0% 48.6% 50.8 52.1%

21 Tuition and Cost – 2012-2013
Tuition and Cost – 2012-2013
Tuition and Fees – 2012-2013 Tuition per
credit hour
Undergraduate- Daytime Courses #100-400, except Health Sciences, Nursing, and OT
$685.00
Health Sciences, Nursing, and OT Undergraduate DAY courses #300-700
$ 745.00
Adult Accelerated Program (AAP) Undergrad evening/weekend courses, #100-400
$ 390.00
Applied Behavioral Analysis (ABA) $850.00
Social Work, Master (MSW) Graduate courses, #500-700
$ 665.00
Master of Science in Business Communication (MSBC) Graduate courses #500-700
$ 580.00
Psychology-Doctorate (Psy.D.) Graduate courses #500-800
$850.00
Education, Master Graduate courses #500-600
$ 670.00*
Education, Doctorate – Ed.D. Graduate courses #700-800
$ 735.00
Master of Fine Arts in Writing (MFA) $7,900
(semester)
*55,000 Degree Scholarship Program For all master’s education courses, reduces tuition to $350 per credit hour.
** NOTE ** If an AAP student crosses over and enrolls in an Undergraduate DAY course, the student will pay the higher rate as outlined above along with the course fee. If a regular Undergraduate DAY student crosses over and enrolls in an AAP course, the student continues to pay the Undergraduate DAY rate along with the course fee.

22 Spalding University Fact Book 2012-2013
Housing Costs– 2012-2013 For Financial Aid purposes, all room and meal charges are posted to students’ tuition accounts at the beginning of the term.
For example, the charges for Sessions 1, 2, & 3 will be charged at the beginning of the fall term in August.
Room Charge per Term (Fall and Spring) - 3 Sessions
Private Room
Double Room
$ 3050.00/semester
$ 2800.00/semester
Meal Charge per Term (Fall and Spring) - 3 Sessions
Full (17 meals/week) $2400.00/semester
Standard (10 meals/week) $1400.00/semester
Flex Plan (5 meals/week) $1200.00/semester
$250.00 application/housing deposit includes $100.00 refundable damage deposit, $100.00 application fee, and $50.00 key fee.
23 Tuition and Cost – 2012-2013
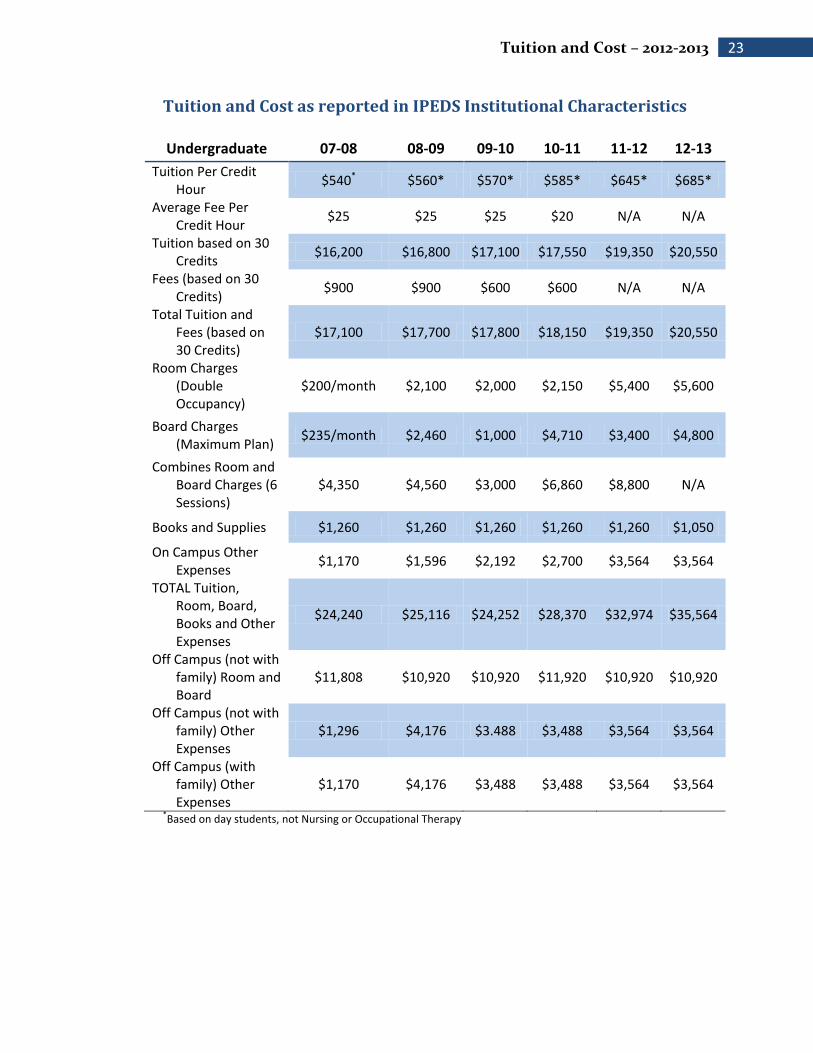
Tuition and Cost as reported in IPEDS Institutional Characteristics
Undergraduate 07-08 08-09 09-10 10-11 11-12 12-13
Tuition Per Credit Hour
$540* $560* $570* $585* $645* $685*
Average Fee Per Credit Hour
$25 $25 $25 $20 N/A N/A
Tuition based on 30 Credits
$16,200 $16,800 $17,100 $17,550 $19,350 $20,550
Fees (based on 30 Credits)
$900 $900 $600 $600 N/A N/A
Total Tuition and Fees (based on 30 Credits)
$17,100 $17,700 $17,800 $18,150 $19,350 $20,550
Room Charges (Double Occupancy)
$200/month $2,100 $2,000 $2,150 $5,400 $5,600
Board Charges (Maximum Plan)
$235/month $2,460 $1,000 $4,710 $3,400 $4,800
Combines Room and Board Charges (6 Sessions)
$4,350 $4,560 $3,000 $6,860 $8,800 N/A
Books and Supplies $1,260 $1,260 $1,260 $1,260 $1,260 $1,050
On Campus Other Expenses
$1,170 $1,596 $2,192 $2,700 $3,564 $3,564
TOTAL Tuition, Room, Board, Books and Other Expenses
$24,240 $25,116 $24,252 $28,370 $32,974 $35,564
Off Campus (not with family) Room and Board
$11,808 $10,920 $10,920 $11,920 $10,920 $10,920
Off Campus (not with family) Other Expenses
$1,296 $4,176 $3.488 $3,488 $3,564 $3,564
Off Campus (with family) Other Expenses
$1,170 $4,176 $3,488 $3,488 $3,564 $3,564
*Based on day students, not Nursing or Occupational Therapy
24 Spalding University Fact Book 2012-2013
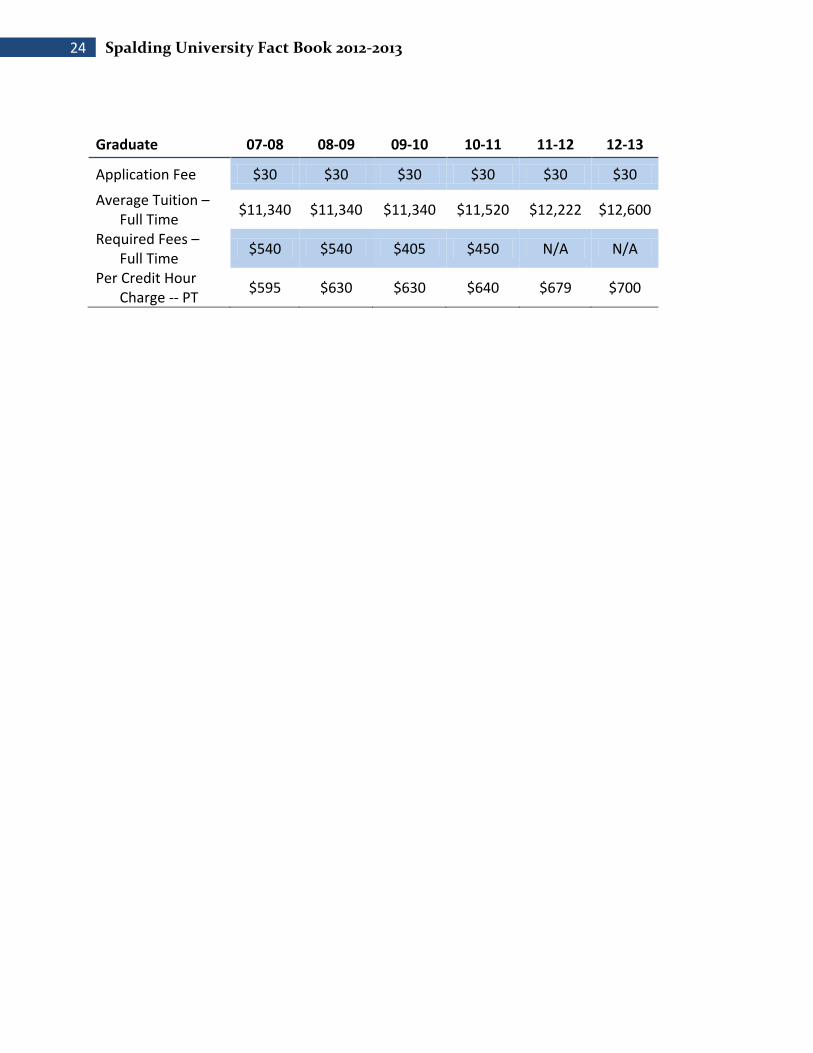
Graduate 07-08 08-09 09-10 10-11 11-12 12-13
Application Fee $30 $30 $30 $30 $30 $30
Average Tuition – Full Time
$11,340 $11,340 $11,340 $11,520 $12,222 $12,600
Required Fees – Full Time
$540 $540 $405 $450 N/A N/A
Per Credit Hour Charge -- PT
$595 $630 $630 $640 $679 $700
25 Financial Aid
Financial Aid
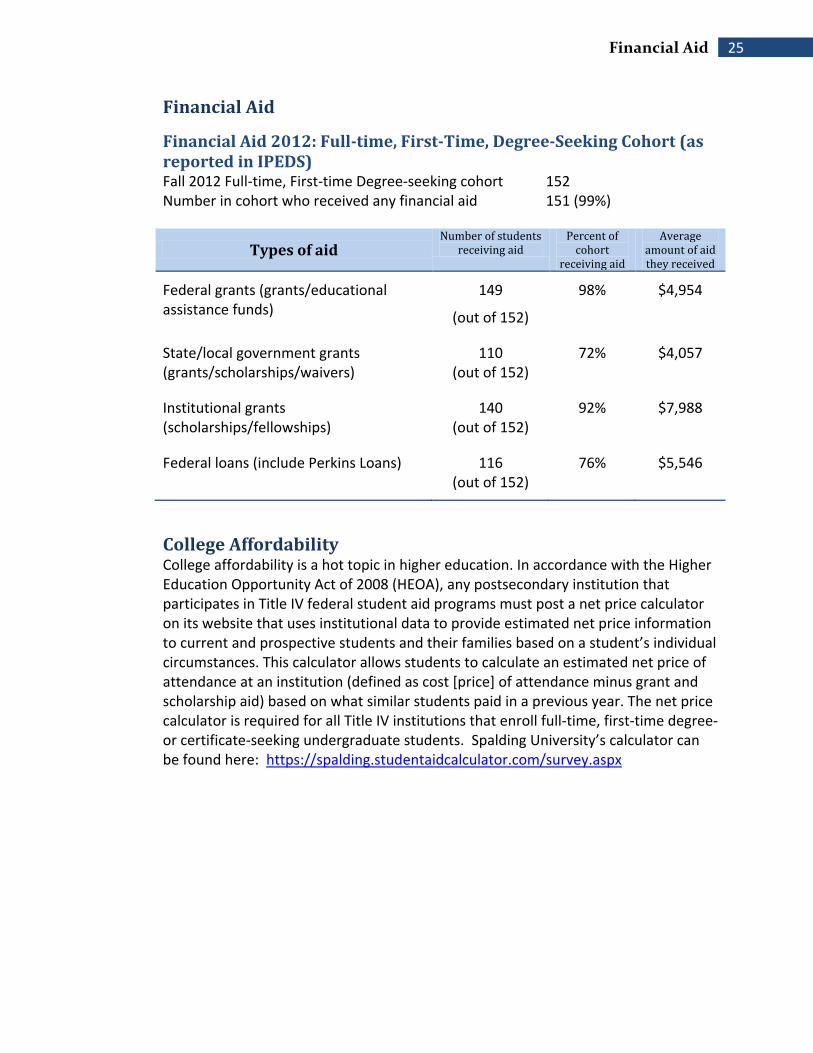
Financial Aid 2012: Full-time, First-Time, Degree-Seeking Cohort (as reported in IPEDS) Fall 2012 Full-time, First-time Degree-seeking cohort 152 Number in cohort who received any financial aid 151 (99%)
Types of aid Number of students
receiving aid
Percent of cohort
receiving aid
Average amount of aid they received
Federal grants (grants/educational assistance funds)
149
(out of 152)
98% $4,954
State/local government grants (grants/scholarships/waivers)
110 (out of 152)
72% $4,057
Institutional grants (scholarships/fellowships)
140 (out of 152)
92% $7,988
Federal loans (include Perkins Loans) 116 (out of 152)
76% $5,546
College Affordability College affordability is a hot topic in higher education. In accordance with the Higher Education Opportunity Act of 2008 (HEOA), any postsecondary institution that participates in Title IV federal student aid programs must post a net price calculator on its website that uses institutional data to provide estimated net price information to current and prospective students and their families based on a student’s individual circumstances. This calculator allows students to calculate an estimated net price of attendance at an institution (defined as cost [price] of attendance minus grant and scholarship aid) based on what similar students paid in a previous year. The net price calculator is required for all Title IV institutions that enroll full-time, first-time degree- or certificate-seeking undergraduate students. Spalding University’s calculator can be found here: https://spalding.studentaidcalculator.com/survey.aspx

26 Spalding University Fact Book 2012-2013
Student Enrollment FTE Fall
06-07 Fall
07-08 Fall
08-09 Fall
09-10 Fall
10-11 Fall
11-12 Fall
12-13
Total number of full-time undergraduate students (those taking 12 or more credit hours)
686 710 718 841 961 983 985
Total number of full-time post-baccalaureate (master’s or doctoral programs, or other for-credit program) students (those taking 9 or more credit hours)
414 403 368 590 718 765 823
Total FTE of part-time undergraduate student enrollment**
158 166 179 183 176 197 193
Total FTE of part-time post baccalaureate student enrollment***
150 137 138 156 171 191 152
Total number of student FTE’s enrolled in Spalding University
1408 1416 1403 1771 2026 2136 2153
**Calculated by using the SACS formula for reporting enrollment information (total hours of all undergraduate students carrying fewer than 12 credit hours divided by 12) ***Calculated by using the SACS formula for reporting enrollment information (total hours of all post-
baccalaureate students carrying fewer than 9 credit hours divided by 9)
2006-07 2007-08 2008-09 2009-10 2010-11 2011-12 2012-13
Undergraduate 844 876 897 1024 1137 1180 1178
Graduate 564 540 506 746 889 956 975
0
200
400
600
800
1000
1200
1400

27 Student Enrollment
Head Count Fall 06-07
Fall 07-08
Fall 08-09
Fall 09-10
Fall 10-11
Fall 11-12
Fall 12-13
Total number of full-time undergraduate students (those taking 12 or more credit hours)
686 710 718 841 961 983 985
Total number of full-time post-baccalaureate (master’s or doctoral programs, or other for-credit program) students (those taking 9 or more credit hours)
414 403 368 590 718 765 823
Total headcount of part-time undergraduate student enrollment**
304 305 345 339 345 388 444
Total headcount of part-time post-baccalaureate student enrollment***
302 275 281 299 322 296 263
Total number of students enrolled in Spalding University (Headcount)
1706 1693 1712 2069 2346 2432 2515
06-07 07-08 08-09 09-10 10-11 11-12 12-13
Undergraduate 990 1015 1063 1180 1306 1371 1429
Graduate 716 678 649 889 1040 1061 1086
0
200
400
600
800
1000
1200
1400
1600
28 Spalding University Fact Book 2012-2013
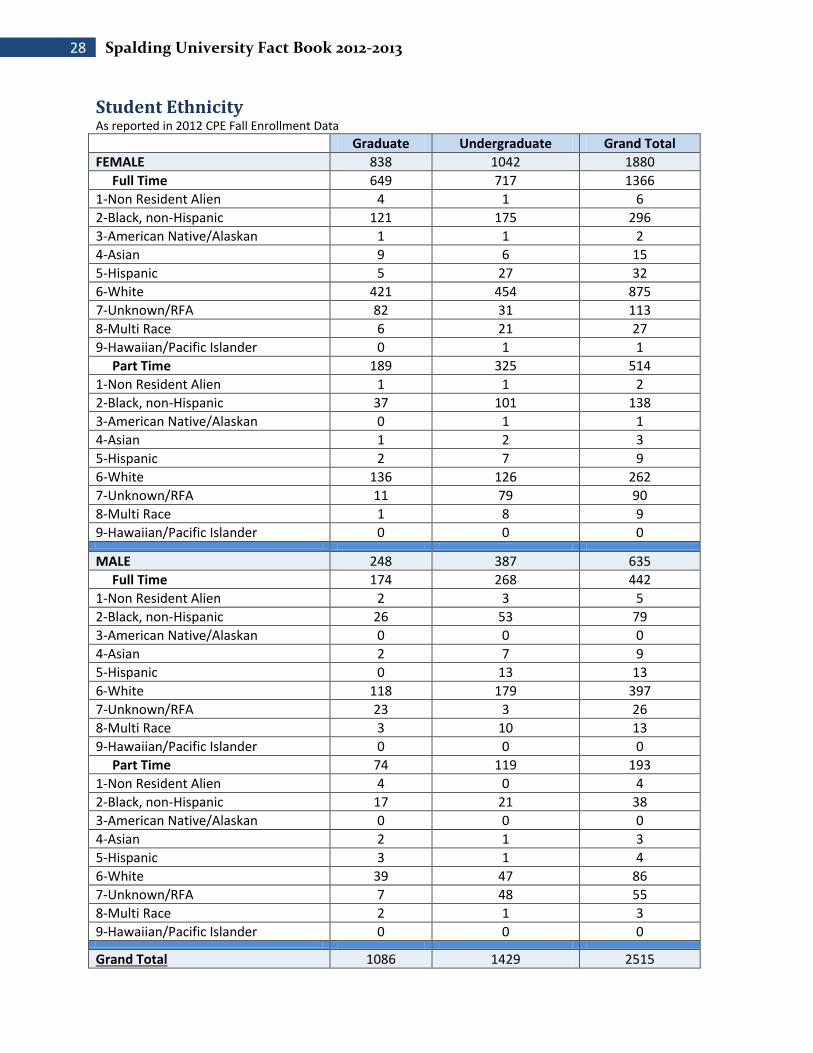
Student Ethnicity As reported in 2012 CPE Fall Enrollment Data
Graduate Undergraduate Grand Total
FEMALE 838 1042 1880
Full Time 649 717 1366
1-Non Resident Alien 4 1 6
2-Black, non-Hispanic 121 175 296
3-American Native/Alaskan 1 1 2
4-Asian 9 6 15
5-Hispanic 5 27 32
6-White 421 454 875
7-Unknown/RFA 82 31 113
8-Multi Race 6 21 27
9-Hawaiian/Pacific Islander 0 1 1
Part Time 189 325 514
1-Non Resident Alien 1 1 2
2-Black, non-Hispanic 37 101 138
3-American Native/Alaskan 0 1 1
4-Asian 1 2 3
5-Hispanic 2 7 9
6-White 136 126 262
7-Unknown/RFA 11 79 90
8-Multi Race 1 8 9
9-Hawaiian/Pacific Islander 0 0 0
MALE 248 387 635
Full Time 174 268 442
1-Non Resident Alien 2 3 5
2-Black, non-Hispanic 26 53 79
3-American Native/Alaskan 0 0 0
4-Asian 2 7 9
5-Hispanic 0 13 13
6-White 118 179 397
7-Unknown/RFA 23 3 26
8-Multi Race 3 10 13
9-Hawaiian/Pacific Islander 0 0 0
Part Time 74 119 193
1-Non Resident Alien 4 0 4
2-Black, non-Hispanic 17 21 38
3-American Native/Alaskan 0 0 0
4-Asian 2 1 3
5-Hispanic 3 1 4
6-White 39 47 86
7-Unknown/RFA 7 48 55
8-Multi Race 2 1 3
9-Hawaiian/Pacific Islander 0 0 0
Grand Total 1086 1429 2515

29
Undergraduate Student Diversity (CPE Fall Enrollment 2012)
Graduate Student Diversity (CPE Fall Enrollment 2012)
Haw/Pac Is 0%
Amer Nat 0%
Non Res Alien 0%
Asian 1% Multi Race
3% Hispanic
4%
Blk/Afr Amer 28%
White 64%
UG Race/Ethnic
Amer Nat 0%
Hispanic 1%
Non Res Alien 1%
Multi Race 1%
Asian 2%
Blk/Afr Amer 21% White
74%
GR Race/Ethnic
30 Spalding University Fact Book 2012-2013
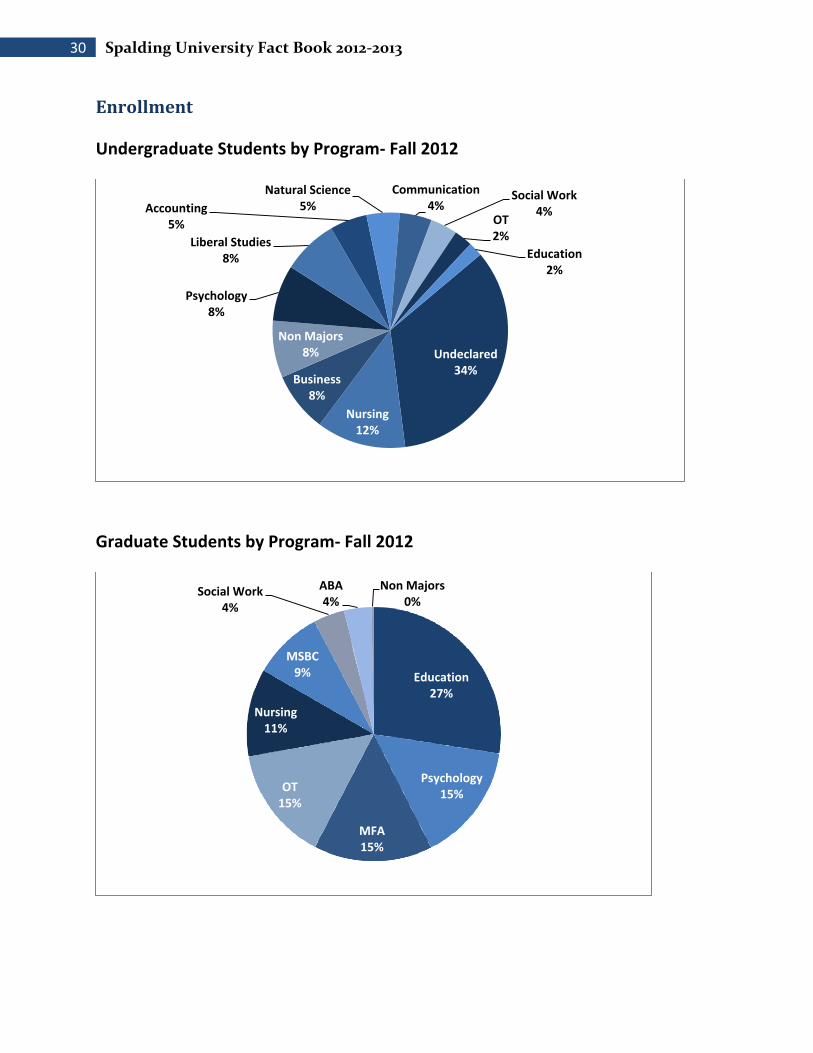
Enrollment
Undergraduate Students by Program- Fall 2012
Graduate Students by Program- Fall 2012
Undeclared 34%
Nursing 12%
Business 8%
Non Majors 8%
Psychology 8%
Liberal Studies 8%
Accounting 5%
Natural Science 5%
Communication 4%
Social Work 4%
OT 2%
Education 2%
Education 27%
Psychology 15%
MFA 15%
OT 15%
Nursing 11%
MSBC 9%
Social Work 4%
ABA 4%
Non Majors 0%

31 Age of Students
Under 25 53%
25-29 15%
30-34 10% 35-39
8%
40-49 9%
50-64 5%
65+ 0%
Undergraduates by Age Range
Under 25 7%
25-29 29%
30-34 21%
35-39 13%
40-49 17%
50-64 12%
65+ 1%
Graduates by Age Ranges
Age of Students UNDERGRADUATES Average Age = 28 years old
GRADUATES Average Age = 36 years old
32 Spalding University Fact Book 2012-2013
ETS Proficiency Profile (Previously the Academic Profile [AP] and the Measure of Academic Proficiency and Progress [MAPP])
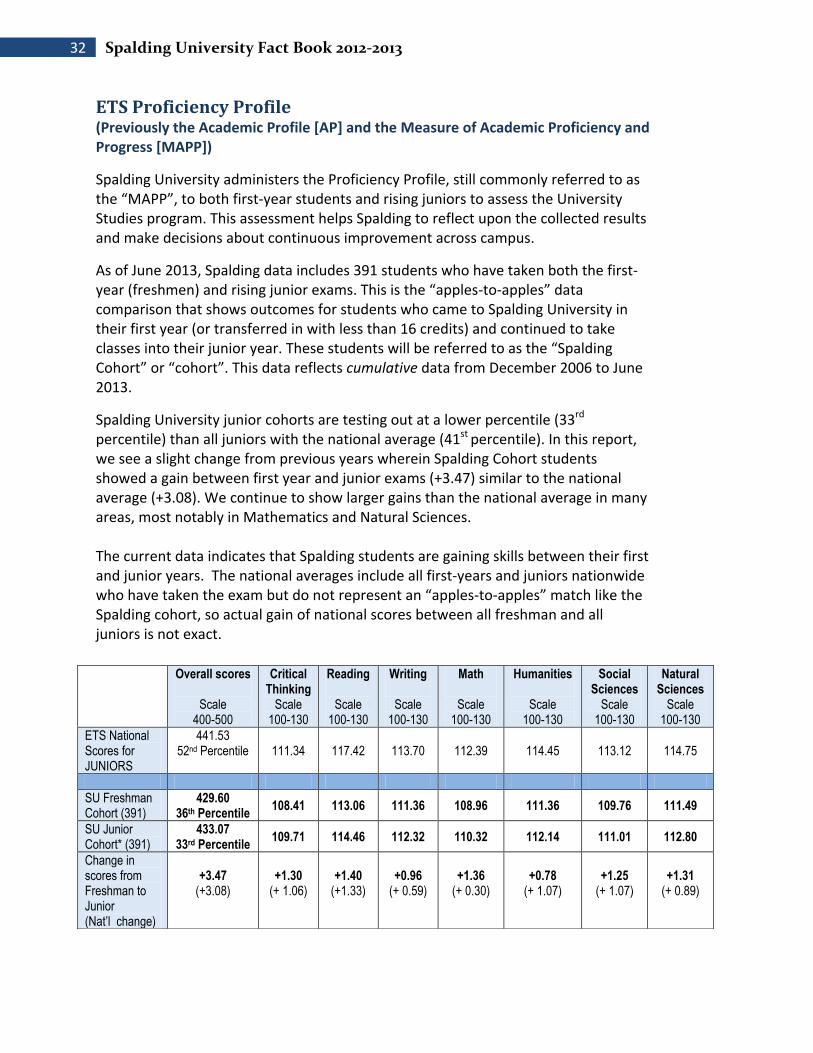
Spalding University administers the Proficiency Profile, still commonly referred to as the “MAPP”, to both first-year students and rising juniors to assess the University Studies program. This assessment helps Spalding to reflect upon the collected results and make decisions about continuous improvement across campus.
As of June 2013, Spalding data includes 391 students who have taken both the first-year (freshmen) and rising junior exams. This is the “apples-to-apples” data comparison that shows outcomes for students who came to Spalding University in their first year (or transferred in with less than 16 credits) and continued to take classes into their junior year. These students will be referred to as the “Spalding Cohort” or “cohort”. This data reflects cumulative data from December 2006 to June 2013.
Spalding University junior cohorts are testing out at a lower percentile (33rd percentile) than all juniors with the national average (41st percentile). In this report, we see a slight change from previous years wherein Spalding Cohort students showed a gain between first year and junior exams (+3.47) similar to the national average (+3.08). We continue to show larger gains than the national average in many areas, most notably in Mathematics and Natural Sciences. The current data indicates that Spalding students are gaining skills between their first and junior years. The national averages include all first-years and juniors nationwide who have taken the exam but do not represent an “apples-to-apples” match like the Spalding cohort, so actual gain of national scores between all freshman and all juniors is not exact.
Overall scores
Scale 400-500
Critical Thinking
Scale 100-130
Reading
Scale 100-130
Writing
Scale 100-130
Math
Scale 100-130
Humanities
Scale 100-130
Social Sciences
Scale 100-130
Natural Sciences
Scale 100-130
ETS National Scores for JUNIORS
441.53 52nd Percentile 111.34 117.42 113.70 112.39 114.45 113.12 114.75
SU Freshman Cohort (391)
429.60 36th Percentile
108.41 113.06 111.36 108.96 111.36 109.76 111.49
SU Junior Cohort* (391)
433.07 33rd Percentile
109.71 114.46 112.32 110.32 112.14 111.01 112.80
Change in scores from Freshman to Junior (Nat’l change)
+3.47
(+3.08)
+1.30
(+ 1.06)
+1.40
(+1.33)
+0.96
(+ 0.59)
+1.36
(+ 0.30)
+0.78
(+ 1.07)
+1.25
(+ 1.07)
+1.31
(+ 0.89)
33 Full Time Faculty Profile 2012-13
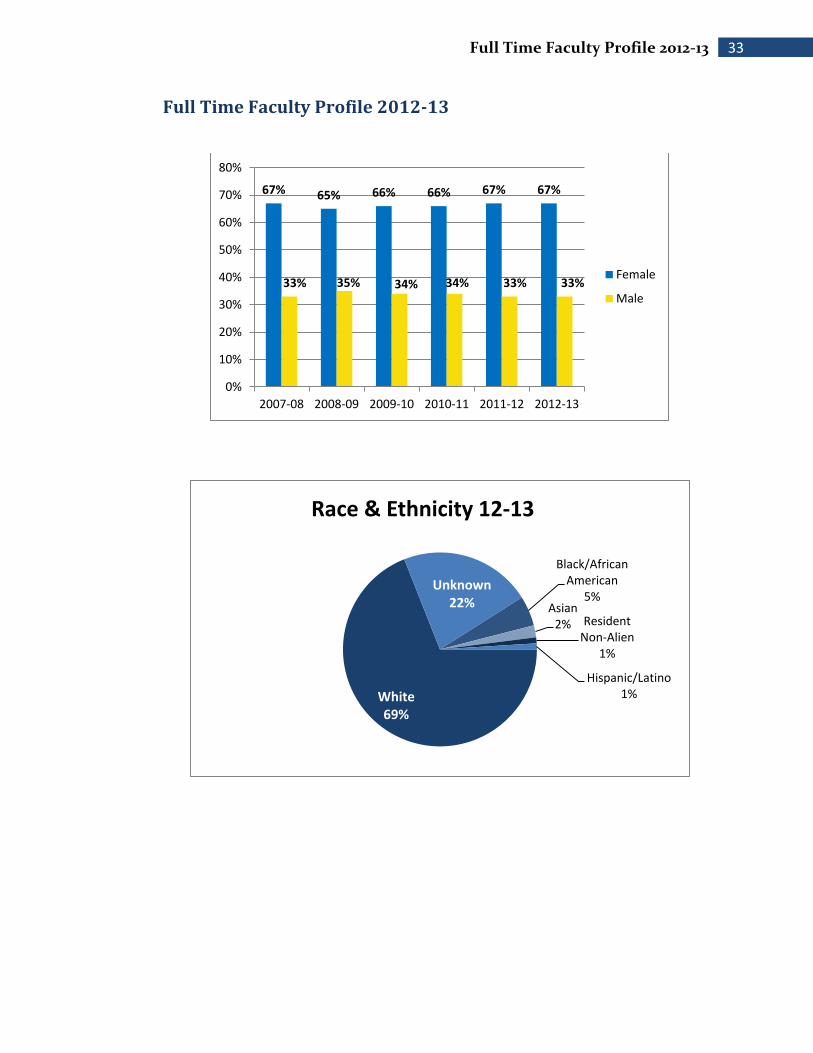
Full Time Faculty Profile 2012-13
67% 65% 66% 66% 67% 67%
33% 35% 34% 34% 33% 33%
0%
10%
20%
30%
40%
50%
60%
70%
80%
2007-08 2008-09 2009-10 2010-11 2011-12 2012-13
Female
Male
White 69%
Unknown 22%
Black/African American
5% Asian
2% Resident Non-Alien
1%
Hispanic/Latino 1%
Race & Ethnicity 12-13

34 Spalding University Fact Book 2012-2013
Faculty Compensation 2012-13
Percentage of Full Time Faculty with Terminal Degree/Tenure Status
2006-07 2007-08 2008-09 2009-10 2010-11 2011-12 2012-13
Terminal Degree 83% 76% 74% 68% 68% 71% 72%
Tenure 39% 33% 27% 29% 34% 35% 44%
Faculty salaries typically meet the University standard of the 90% average level for the individual disciplines at private universities, as published in the 2010 College and University Personnel
Association's (CUPA) Faculty Salary Survey.