sparsity, scalability and distribution in recommender systems doctoral thesis proposal badrul m....
Post on 21-Dec-2015
214 views
TRANSCRIPT

Sparsity, Scalability and Sparsity, Scalability and Distribution in Recommender Distribution in Recommender
SystemsSystems
Doctoral Thesis ProposalDoctoral Thesis Proposal
Badrul M. SarwarBadrul M. SarwarComputer Science & Engineering Dept.Computer Science & Engineering Dept.
University of MinnesotaUniversity of Minnesota
Advisor: Professor John RiedlAdvisor: Professor John Riedl

Talk OutlineTalk Outline
Introduction to Recommender SystemsIntroduction to Recommender Systems Research ChallengesResearch Challenges Previous WorkPrevious Work Future Work and Completion PlanFuture Work and Completion Plan Contributions and ConclusionsContributions and Conclusions

Information Information OverloadOverload
News items,Books, Journals,
Research
papers
TV programs,
Music CDs,
Movie titles
Consumer
products, e-
commerce
items,
Web pages,
Usenet articles,e-mails

Computerized Computerized Solution Solution
techniquestechniques Information RetrievalInformation Retrieval
– Immediate information needsImmediate information needs Information FilteringInformation Filtering
– Content based filteringContent based filtering– Information filtering agentsInformation filtering agents
Collaborative Filtering (CF)Collaborative Filtering (CF)– Recommender systems (RS) - interface Recommender systems (RS) - interface
We’ll use the term CF and RS interchangeablyWe’ll use the term CF and RS interchangeably

Collaborative Collaborative FilteringFiltering
Why another filtering technique?Why another filtering technique?– Problems with content-based filteringProblems with content-based filtering
Limitations due to computer processingLimitations due to computer processing Lack of aesthetic senseLack of aesthetic sense Different techniques for different mediaDifferent techniques for different media
CF adds the missing piece into the CF adds the missing piece into the picture picture – Human judgementsHuman judgements

Collaborative Collaborative Filtering ProcessFiltering Process

CF used CF used successfully in e-successfully in e-
commerce commerce
Talk OutlineTalk Outline
Introduction to Recommender SystemsIntroduction to Recommender Systems Research ChallengesResearch Challenges Previous WorkPrevious Work Future Work and Completion PlanFuture Work and Completion Plan Contributions and conclusionsContributions and conclusions

Research Research Challenges Challenges
RC1: How can we improve RS quality and RC1: How can we improve RS quality and performance by using dimensionality performance by using dimensionality reduction techniques?reduction techniques?
RC2: How can we design better interface for RC2: How can we design better interface for RS?RS?
RC3: How can we design distributed RS to RC3: How can we design distributed RS to make them widely available? make them widely available?
RC4: How can utilize clustering algorithms RC4: How can utilize clustering algorithms to improve scalability in RS?to improve scalability in RS?

RC1: Motivation RC1: Motivation and Importance and Importance
RS Performance challenge RS Performance challenge – Meet two important goals Meet two important goals – QualityQuality
Best CF is 77% accurateBest CF is 77% accurate
– ScalabilityScalability Response timeResponse time Storage spaceStorage space

RC1: Motivation RC1: Motivation and Importance and Importance
(contd.)(contd.) Stumbling blocks Stumbling blocks
– High-dimensional dataHigh-dimensional data Computational complexityComputational complexity Noise and data over-fittingNoise and data over-fitting
– SparsitySparsity Reduced number of predictionsReduced number of predictions Inferior qualityInferior quality

RC1: Specific RC1: Specific AimsAims
Select a dimensionality reduction Select a dimensionality reduction techniquetechnique
Apply the techniqueApply the technique Evaluate qualityEvaluate quality Study performance implicationsStudy performance implications

Research Research Challenges Challenges
RC1: How can we improve RS quality and RC1: How can we improve RS quality and performance by using dimensionality performance by using dimensionality reduction techniques?reduction techniques?
RC2: How can we design better interface for RC2: How can we design better interface for RS?RS?
RC3: How can we design distributed RS to RC3: How can we design distributed RS to make them widely available? make them widely available?
RC4: How can utilize clustering algorithms RC4: How can utilize clustering algorithms to improve scalability in RS?to improve scalability in RS?

RC 2: Motivation RC 2: Motivation and Importanceand Importance
Need for explanation interfaceNeed for explanation interface– End-user point of viewEnd-user point of view
Explanation of recommendationsExplanation of recommendations– Algorithmic explanation Algorithmic explanation – Visual explanationVisual explanation
Visual explanationVisual explanation– Visualization amplifies cognitionVisualization amplifies cognition
BenefitsBenefits– Increases usability and confidenceIncreases usability and confidence

RC 2: Specific RC 2: Specific aimsaims
Identify techniquesIdentify techniques– Use of dimension reduction resultsUse of dimension reduction results
ImplementationImplementation EvaluationEvaluation
– Usability studyUsability study– Comparison with text-based systemComparison with text-based system

Research Research Challenge 3 Challenge 3
How can we improve RS quality and How can we improve RS quality and performance by using dimensionality performance by using dimensionality reduction techniques?reduction techniques?
How can we design better interface for RS? How can we design better interface for RS? How can we design distributed RSs to make How can we design distributed RSs to make
them widely available?them widely available? How can utilize clustering algorithms to How can utilize clustering algorithms to
improve scalability in RS?improve scalability in RS?

RC3: Motivation RC3: Motivation and Importanceand Importance
Increasing needs for RS servicesIncreasing needs for RS services– Availability challengeAvailability challenge
Travelling usersTravelling users Centralized RS problemsCentralized RS problems
– Problems of scale and robustnessProblems of scale and robustness– Privacy concernsPrivacy concerns

RC3: Specific RC3: Specific aimsaims
Taxonomy of RS application spaceTaxonomy of RS application space Design frameworkDesign framework
– Key design issuesKey design issues– Implementation modelsImplementation models
Evaluation criteriaEvaluation criteria Analysis of different modelsAnalysis of different models

Research Research Challenge 4 Challenge 4
How can we improve RS quality and How can we improve RS quality and performance by using dimensionality performance by using dimensionality reduction techniques?reduction techniques?
How can we design better interface for RS? How can we design better interface for RS? How can we design distributed RS to make How can we design distributed RS to make
them widely available?them widely available? How can we utilize clustering algorithms to How can we utilize clustering algorithms to
improve scalability in RSs?improve scalability in RSs?

RC4: Motivation RC4: Motivation and Importanceand Importance
ScalabilityScalability Sparsity Sparsity Benefits of ClusteringBenefits of Clustering
– Usenet (newsgroup)Usenet (newsgroup) Recent studiesRecent studies Performance implicationsPerformance implications

RC4: Specific RC4: Specific aimsaims
Identify clustering algorithmsIdentify clustering algorithms– Soft clusterSoft cluster– Hard clusterHard cluster
Partition the data setPartition the data set Apply Galaxy algorithmApply Galaxy algorithm Evaluate resultsEvaluate results

Talk OutlineTalk Outline
Introduction to Recommender SystemsIntroduction to Recommender Systems Research ChallengesResearch Challenges Previous WorkPrevious Work Future Work and Completion PlanFuture Work and Completion Plan Contributions and conclusionsContributions and conclusions

Research Research ApproachApproach
Create Dataset
Separate trainingand test data
Identify Problem
Develop Hypotheses
DiscoverAlgorithm and
solutiontechniques
Validatesolution
techniques
CreateExperimentframework
Apply solutiontechniques onexperimental
data

Dimension Dimension Reduction Reduction
ExperimentsExperiments Singular Value DecompositionSingular Value Decomposition
– Matrix factorizationMatrix factorization– Dimension reductionDimension reduction– Prediction generation by re-constructing Prediction generation by re-constructing
matrixmatrix Result highlightsResult highlights
– Quality of prediction improvedQuality of prediction improved– We expect to see improved performance We expect to see improved performance

Applying Applying dimension dimension
reduction in RSreduction in RS We applied LSI/SVD based techniqueWe applied LSI/SVD based technique SVD decomposes a matrix into three factorsSVD decomposes a matrix into three factors
The reconstructed matrix Rk = Uk.Sk.Vk’ is the closest rank-k matrix to the original matrix R.
=R
m X n
U
m X r
S
r X r
V’
r X n
Sk
k X k
Uk
m X k
Vk’
k X n
Rk

SVD as prediction SVD as prediction generatorgenerator
Sk
k X k
Uk
m X k
Vk’
k X n
Uk S’k
SkV’k
ith row
jth col
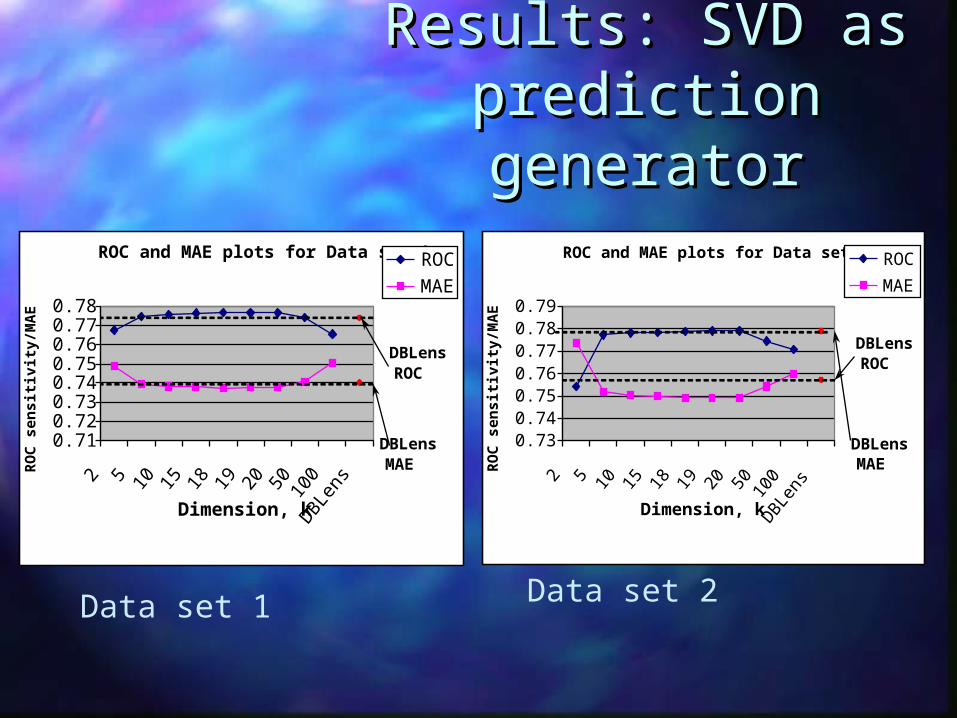
Results: SVD as Results: SVD as prediction prediction generatorgenerator
ROC and MAE plots for Data set 1
0.710.720.730.740.750.760.770.78
2 5 10 15 18 19 20 50 100
DBLens
Dimension, k
RO
C s
ensi
tivi
ty/M
AE
ROC
MAE
DBLensROC
DBLensMAE
Data set 1
ROC and MAE plots for Data set 2
0.730.740.750.760.770.780.79
2 5 10 15 18 19 20 50 100
DBLens
Dimension, kR
OC
sen
siti
vity
/MA
E
ROC
MAE
DBLensROC
DBLensMAE
Data set 2

Visual Interface: Visual Interface: Initial PrototypeInitial Prototype
Used SVD resultsUsed SVD results Plotted user and items in 2-D feature Plotted user and items in 2-D feature
spacespace Prototype tested in Prototype tested in SpotfireSpotfire Problems:Problems:
– Distance is non-EuclideanDistance is non-Euclidean

Design of Visual Design of Visual InterfaceInterface
Use of LSI/SVD for user-item Use of LSI/SVD for user-item visualizationvisualization

Distributed RS: Distributed RS: Work doneWork done
Taxonomy of the application spaceTaxonomy of the application space– Based on <Neighborhood and prediction>Based on <Neighborhood and prediction>
Identification of key design issuesIdentification of key design issues Three implementation models proposedThree implementation models proposed
– Local profile modelLocal profile model– Central profile modelCentral profile model– Geographically distributed profile modelGeographically distributed profile model
Talk OutlineTalk Outline
Introduction to Recommender SystemsIntroduction to Recommender Systems Research ChallengesResearch Challenges Previous WorkPrevious Work Future Work and Completion PlanFuture Work and Completion Plan Contributions and conclusionsContributions and conclusions

Future Work:Future Work:Dimension Dimension ReductionReduction
Study performance implicationsStudy performance implications SVD based predictionSVD based prediction
– Offline (model building)Offline (model building)– Online Online
Offline part is time-consumingOffline part is time-consuming– Incremental SVDIncremental SVD– Fold-inFold-in
Online is very promising Online is very promising

Future Work:Future Work:Distributed RSDistributed RS
EvaluationEvaluation– Possible approachesPossible approaches
Identify suitable evaluation criteriaIdentify suitable evaluation criteria Select applications from taxonomySelect applications from taxonomy Analyze using each model (hypothetical)Analyze using each model (hypothetical) Analyze each implementation in terms of the Analyze each implementation in terms of the
evaluation criteriaevaluation criteria

Future Work:Future Work:Visual InterfaceVisual Interface
Implement Visual interfaceImplement Visual interface Perform usability studiesPerform usability studies
– Setup live user experimentSetup live user experiment– Identify usability questionnairesIdentify usability questionnaires– Conduct the usability surveyConduct the usability survey– Analyze resultsAnalyze results– Revise/redesign interfaceRevise/redesign interface

Future Work:Future Work:Clustering in RSClustering in RS
Identify effective clustering algorithmsIdentify effective clustering algorithms– For soft and hard cluster (For soft and hard cluster (K-means and E-M)K-means and E-M)
Partition the dataset Partition the dataset Apply galaxy algorithm Apply galaxy algorithm Test for qualityTest for quality
– Accuracy and coverageAccuracy and coverage Test for performanceTest for performance
– Response timeResponse time
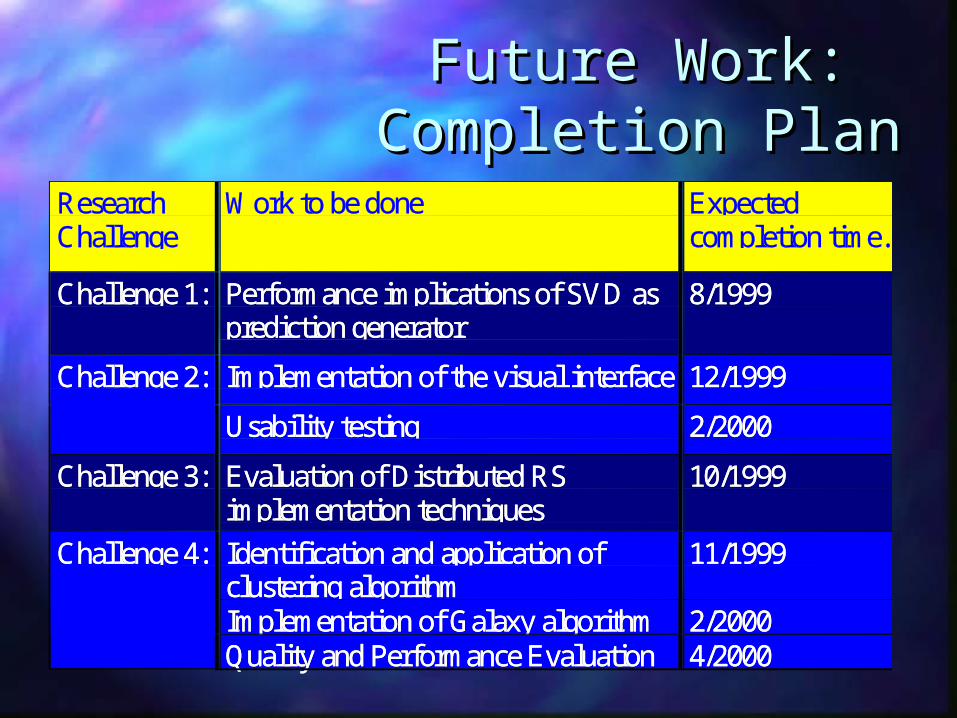
Future Work:Future Work:Completion PlanCompletion Plan
RRReeessseeeaaarrrccchhhCCChhhaaalllllleeennngggeee
WWWooorrrkkk tttooo bbbeee dddooonnneee EEExxxpppeeecccttteeedddcccooommmpppllleeetttiiiooonnn tttiiimmmeee...
CCChhhaaalllllleeennngggeee 111::: PPPeeerrrfffooorrrmmmaaannnccceee iiimmmpppllliiicccaaatttiiiooonnnsss ooofff SSSVVVDDD aaasssppprrreeedddiiiccctttiiiooonnn gggeeennneeerrraaatttooorrr
888///111999999999
IIImmmpppllleeemmmeeennntttaaatttiiiooonnn ooofff ttthhheee vvviiisssuuuaaalll iiinnnttteeerrrfffaaaccceee 111222///111999999999CCChhhaaalllllleeennngggeee 222:::
UUUsssaaabbbiiillliiitttyyy ttteeessstttiiinnnggg 222///222000000000
CCChhhaaalllllleeennngggeee 333::: EEEvvvaaallluuuaaatttiiiooonnn ooofff DDDiiissstttrrriiibbbuuuttteeeddd RRRSSSiiimmmpppllleeemmmeeennntttaaatttiiiooonnn ttteeeccchhhnnniiiqqquuueeesss
111000///111999999999
IIIdddeeennntttiiifffiiicccaaatttiiiooonnn aaannnddd aaappppppllliiicccaaatttiiiooonnn ooofffcccllluuusssttteeerrriiinnnggg aaalllgggooorrriiittthhhmmm
111111///111999999999
IIImmmpppllleeemmmeeennntttaaatttiiiooonnn ooofff GGGaaalllaaaxxxyyy aaalllgggooorrriiittthhhmmm 222///222000000000
CCChhhaaalllllleeennngggeee 444:::
QQQuuuaaallliiitttyyy aaannnddd PPPeeerrrfffooorrrmmmaaannnccceee EEEvvvaaallluuuaaatttiiiooonnn 444///222000000000
ContributionsContributions
Use of dimension reduction technique (SVD) Use of dimension reduction technique (SVD) to be a high-quality prediction generatorto be a high-quality prediction generator– Submitted to ICDE 2000Submitted to ICDE 2000
Framework design for distributed RS.Framework design for distributed RS.– Submitted to CIKM’99Submitted to CIKM’99
Visual interfacesVisual interfaces Clustering to improve scalability Clustering to improve scalability

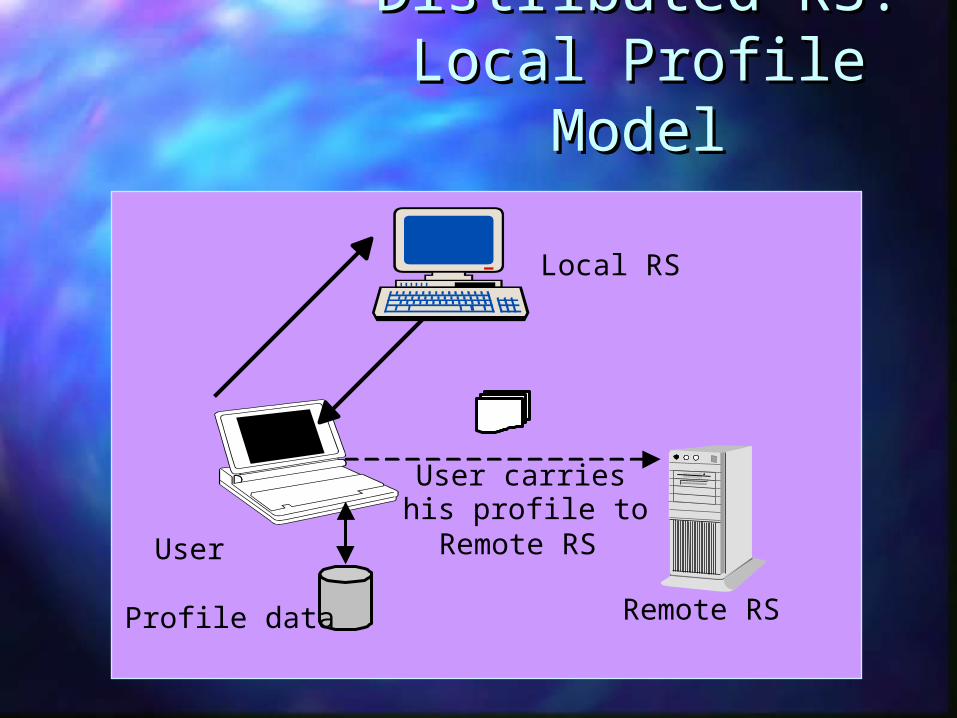
Distributed RS: Distributed RS: Local Profile Local Profile
ModelModel
Local RS
User
Profile data Remote RS
User carrieshis profile toRemote RS

Distributed RS: Distributed RS: Central Profile Central Profile
ModelModel
Remote RS
Remote RS
User
RS
Profile
storage
CPS

Geographically Geographically Distributed RSDistributed RS
Remote RS
User
User
Remote RS
GDPS 3
GDPS 1
GDPS 2
Profile database
User RS
User

Problems of high Problems of high dimensional datadimensional data
2 3 1 3 2 - 4 5B:
3 4 - 4 - 5 - 5A:
- 2 2 - 1 - 3 5 C:
A is highly correlated with B
B is highly correlated with C
We can’t say that C is also highly correlated with A.3 4 - 4 - 5 - 5A: