spatial and kinematic segregation in star-cluster merger ...vpd/publications/mnras466.pdf ·...
TRANSCRIPT

MNRAS 466, 2895–2909 (2017) doi:10.1093/mnras/stw3325Advance Access publication 2016 December 22
Spatial and kinematic segregation in star-cluster merger remnants
David R. Cole,1,2‹ Victor P. Debattista,2 Anna-Lisa Varri,3 Markus Adam4
and Anil C. Seth51Rudolf Peierls Centre for Theoretical Physics, Keble Road, Oxford OX1 3NP, UK2Jeremiah Horrocks Institute, University of Central Lancashire, Preston PR1 2HE, UK3School of Mathematics and Maxwell Institute for Mathematical Sciences, University of Edinburgh, Edinburgh EH9 3JZ, UK4SAP SE, Dietmar-Hopp-Allee 16, D-69190 Walldorf, Germany5Department of Physics and Astronomy, University of Utah, Salt Lake City, UT 84112, USA
Accepted 2016 December 9. Received 2016 December 9; in original form 2016 May 3
ABSTRACTGlobular clusters that exhibit chemical and dynamical complexity have been suggested to bethe stripped nuclei of dwarf galaxies(e.g. M54, ω Cen). We use N-body simulations of nuclearstar clusters forming via the mergers of star clusters to explore the persistence of substructurein the phase space. We find that the observed level of differentiation is difficult to reconcilewith the observed if nuclear clusters form wholly out of the mergers of star clusters. Only thestar clusters that merged most recently retain sufficiently distinct density and kinematics tobe distinguishable from the rest of the nuclear cluster. In situ star formation must therefore beincluded to explain the observed properties of nuclear star clusters, in good agreement withprevious results.
Key words: galaxies: bulges – galaxies: evolution – galaxies: kinematics and dynamics –galaxies: nuclei – galaxies: structure.
1 IN T RO D U C T I O N
High-resolution Hubble Space Telescope (HST) observations haveshown that many low-to-intermediate-mass galaxies across theHubble sequence contain a dense star cluster (SC) at their centre,a nuclear star cluster (NSC; Carollo et al. 1997; Boker et al. 2002;Cote et al. 2006; Turner et al. 2012).
NSCs in late-type galaxies are found to have complex star for-mation histories with mean luminosity-weighted ages ranging from10 Myr to 10 Gyr (Rossa et al. 2006). Observations frequentlyshow that the star formation is bursty, recurring on a time-scaleof the order of 100 Myr with the most recent episodes in the last100 Myr (Walcher et al. 2005, 2006). One example is the NSC inM33 that had periods of star formation 40 Myr and 1 Gyr ago (Longet al. 2002). Georgiev & Boker (2014) studied 228 late-type galax-ies and found that recent star formation is common and their stellarpopulations had a range of ages. Carson et al. (2015) found increas-ing roundness at longer wavelengths in HST Wide Field Cameraimages of the 10 brightest and nearest NSCs. They inferred that theNSCs contained discs with younger stellar populations. Colour–colour diagrams for most of these NSCs also show evidence for twopopulations, a younger one of the order of a few hundred Myr oldand an older one more than a Gyr old. Pfuhl et al. (2011) studied theMilky Way’s NSC and found that ∼80 per cent of its stars are more
⋆ E-mail: [email protected]
than 5 Gyr old but there was a deep minimum in star formation1–2 Gyr ago followed by an increase in star formation in the lastfew hundred Myr. NSCs in late-type galaxies are often made of anolder spheroidal component with a younger, bluer disc embeddedin it, with the disc approximately aligned with the plane of the maingalactic disc (Seth et al. 2006, 2008). The NSC in NGC 4244 hassuch a structure and the stars in the disc are less than 100 Myrold. Integral field spectroscopy indicates that the disc is rotatingin the same sense as the main galactic disc and is misaligned byonly ∼15◦. The NSC in the elliptical galaxy FCC 277 also has thespheroid+disc structure with stars overall younger than those in themain galaxy (Lyubenova et al. 2013).
Two principal formation mechanisms have been proposed toexplain the formation of NSCs: the merging of globular clusters(GCs), and in situ star formation. In the GC merger scenario, theGC orbits decay due to dynamical friction and then they mergeat the centre of galaxies (Tremaine, Ostriker & Spitzer 1975;Capuzzo-Dolcetta 1993; Miocchi et al. 2006; Capuzzo-Dolcetta &Miocchi 2008a,b; Antonini et al. 2012; Antonini 2013, 2014;Arca-Sedda & Capuzzo-Dolcetta 2014; Gnedin, Ostriker &Tremaine 2014; Arca-Sedda et al. 2015). In situ star formationcould occur due to a variety of mechanisms but would requirea process whereby gas is driven to the nuclear regions of galaxies(Milosavljevic 2004; Bekki 2007; Antonini, Barausse & Silk 2015).These include the action of re-ionization epoch radiation fields(Cen 2001) and compressive tidal fields (Emsellem & van deVen 2008). Georgiev & Boker (2014) found that the half-light
C⃝ 2016 The AuthorsPublished by Oxford University Press on behalf of the Royal Astronomical Society

2896 D. R. Cole et al.
radius, reff, of their sample of NSCs increases with wavelengthand argue that this could be explained if NSCs form from gas thatfalls to the centre and forms stars, meaning that younger popula-tions will be more centrally concentrated than older ones. The mostdirect evidence for the need of in situ star formation comes frommodelling the kinematic data for the NSC in NGC 4244. Simula-tions by Hartmann et al. (2011, see also De Lorenzi et al. 2013)find that though the GC merger scenario can reproduce many ofthe density and kinematic properties of NSCs, mergers give riseto a central peak in vrms =
!σ 2
los + v2los, which is not observed in
the data. Here, vlos is the observed mean stellar velocity and σ los isthe mean stellar velocity dispersion. Based on this, they concludethat less than 50 per cent of the mass of the NSC could have beenassembled from the mergers of GCs, with the majority due to in situstar formation.
Turning our attention to GCs, the interpretative paradigm for theirformation and dynamical evolution is also puzzling. At one time,the Milky Way’s GCs were thought to consist of a single stellarpopulation, but the availability, over the past decade or so, of high-quality and homogeneous photometric and spectroscopic data setshas revealed a much more complex picture of the star formationhistory of this class of stellar systems. In particular, there is nowclear evidence that most Galactic GCs exhibit light element abun-dance patterns and colour–magnitude diagram morphology indica-tive of the existence of multiple stellar populations (see e.g. Gratton,Carretta & Bragaglia 2012; Piotto et al. 2015). A number of pos-sible scenarios have been proposed to provide an interpretation ofsuch a ubiquitous and puzzling phenomenon, often invoking thepresence of two (or more) generations of stellar populations, withseveral different possible sources for the gas out of which secondpopulation stars form. These sources include rapidly rotating mas-sive stars, massive binary stars, and intermediate-mass asymptoticgiant branch (AGB) stars (see e.g. Ventura et al. 2001; Prantzos &Charbonnel 2006; D’Ercole et al. 2008, 2010, 2012; de Minket al. 2009). Alternative scenarios further elaborate on the roleof the ejecta from massive interacting binaries, in the contextof the formation of circumstellar discs of young, low-mass stars(Bastian et al. 2013), as a possible origin for the observed abun-dance anomalies.
One crucial insight into this problem may arise from the inves-tigation of the structural (see e.g. Vesperini et al. 2013) and kine-matical properties (see e.g. Mastrobuono-Battisti & Perets 2013;Henault-Brunet et al. 2015) of multiple stellar populations. Lardoet al. (2011) have studied nine Galactic GCs with Sloan DigitalSky Survey (SDSS) data, and found that there is a statistically sig-nificant spread in u − g colour, corresponding to variations in theabundances of light elements, with the redder stars being more cen-trally concentrated than the bluer ones. They concluded that thereare distinct populations that have different radial distributions. Fromthe kinematic perspective, Richer et al. (2013) analysed the propermotions of main-sequence stars in 47 Tuc by dividing them intofour colour bands, assuming that the colour bands represent starswith different chemical composition. They found that the main-sequence stars in 47 Tuc have anisotropic proper motions, and thatsuch a feature is correlated with their colours. They also found thatthe bluest stars are also the most centrally concentrated, confirm-ing that, also in the case of 47 Tuc, different stellar populationscan be distinguished by their spatial distribution. More recently,Bellini et al. (2015) have studied the kinematic properties of mul-tiple populations in NGC 2808 on the basis of high-precision HSTproper-motion measurements, and found that the helium-enrichedpopulations are more radially anisotropic. Generally these stud-
ies identify stellar populations photometrically or spectroscopi-cally and then analyse either their spatial or kinematic distribution.Sometimes, this includes examining population kinematics in agiven radial range, but, in general, observational studies have notyet examined the joint stellar distribution in both space and velocity.All aspects of the formation, chemistry, and dynamical evolution ofGCs are currently intensely debated (see e.g. Bastian 2015; Renziniet al. 2015; D’Antona et al. 2016), and only the synergy betweenstate-of-the-art photometric (especially the HST UV Legacy Surveyof Galactic GCs, presented by Piotto et al. 2015), spectroscopic(see Carretta 2015; Lardo et al. 2015), and proper motion (fromHST and Gaia, e.g. see Watkins et al. 2015; Pancino, Bellazzini &Marinoni 2013, respectively) information will allow us to addressmany of these open questions.
One additional (and older) puzzle is the existence of GCs withsignificant variations in their heavy elements abundances. In thisrespect, evolutionary scenarios that include one or more mergerevents often have been formulated as a possible formation channelof these ‘multimetallic clusters’ (van den Bergh 1996; Catelan 1997;Lee et al. 1999; Carretta et al. 2010a, 2011; Bekki & Yong 2012;Amaro-Seoane et al. 2013). The scenarios in this class have oftenbeen considered rather unlikely in the Galactic environment, butnot unrealistic in other settings, such as in interacting galaxies (e.g.the Antennae) or in the core of a dwarf galaxy (e.g. Sagittarius).In particular, it has been envisaged that GCs may come close andmerge due to galaxy interactions or where GCs have fallen to thecentre of the host system due to dynamical friction. Amaro-Seoaneet al. (2013) investigated this process using N-body simulations andfound that the radial distribution of different populations are similarto those in multimetallic GCs. In particular, they found that thedistribution of stellar populations in their dynamical models hadsome resemblance to the observed distribution in ω Cen. However,Catelan (1997) found that a merger of two GCs would produce ared giant branch with bimodal colours and no such bimodality hadbeen seen in Galactic GCs, which led to the conclusion that theyare unlikely to be formed by mergers. Ferraro et al. (2009) havefound that Terzan 5 shows bimodality in the red clump and redgiant branch.
Interestingly, Galactic GCs that are characterized by anomalousmetallicity distributions tend to be also particularly massive. Thesetwo aspects, coupled with additional signatures of dynamical com-plexity, have often been interpreted as possible indications that thesestellar systems may be remnants of dwarf galaxies, which have beentidally stripped by the potential of the Milky Way (e.g. van denBergh 1996; Bekki & Norris 2006). In this context, it has also beenspeculated that these objects are actually able to retain fast super-novae ejecta (hence the spread in heavy elements), as they weremuch more massive at their birth, further supporting the possibilityof identifying them as nuclei of disrupted dwarf galaxies. Notablecases, as characterized by a very wide or even multimodal metal-licity distribution, include ω Cen (Lee et al. 1999; Bekki & Nor-ris 2006; Carretta et al. 2010b), M54 (Sarajedini & Layden 1995;Siegel et al. 2007; Carretta et al. 2010a), and Terzan 5 (Ferraroet al. 2009; Origlia et al. 2011; Massari et al. 2014).
Significant intrinsic iron spreads have been measured also inM22 (Da Costa et al. 2009; Marino et al. 2009, 2011), M2 (Yonget al. 2014), NGC 1851 (Carretta et al. 2010a, 2011; Bekki &Yong 2012), and NGC 5286 (Marino et al. 2015, see their table 10).In this context, it should also be emphasized that the analysis of GCsidentified as having an intrinsic Fe spread deserves particular care,especially with respect to non-local thermodynamical equilibriumeffects driven by overionization mechanisms in the atmosphere of
MNRAS 466, 2895–2909 (2017)

Spatial and kinematic segregation in star-cluster merger remnants 2897
Table 1. Properties of ω Cen, 47 Tuc, NGC 1851, M54, M22, and Terzan5 from Harris (1996). Although 47 Tuc does not show any evidence ofenhancement or spread in its iron abundance (see Marino et al. 2016),we include it in this list in light of the estimated total mass, its complexlight elements abundance patterns (e.g. see Cordero et al. 2014; Kucinskas,Dobrovolskas & Bonifacio 2014), and its rich internal dynamics (e.g. seeBianchini et al. 2013; Richer et al. 2013).
Cluster Mass Absolute Half-mass [Fe/H]× (106 M⊙) visual mag. radius
(pc)
ω Cen 2–5a −10.24 6.20 −1.6247 Tuc 0.7–1.45b, c −9.37 3.49 −0.76NGC 1851 0.561c −8.35 1.85 −1.26M54 1.45c −9.96 3.76 −1.59M22 0.536c −8.45 3.03 −1.64Terzan 5 ∼2d −7.86 1.93 −0.28aMeylan et al. (1995); van de Ven et al. (2006); D’Souza & Rix (2013).bMarks & Kroupa (2010).cGnedin & Ostriker (1997).dLanzoni et al. (2010).
AGB stars, which may lead to spurious metallicity assessments (e.g.see Lapenna et al. 2014; Mucciarelli et al. 2015).
The half-mass radii and masses of many clusters listed aboveare consistent with those of NSCs (see Table 1, and also fig. 3 ofWalcher et al. 2005). In particular, ω Cen has been often identi-fied as a very peculiar SC, not just in consideration of its chemicalcomplexity, but also for a number of interesting kinematical anddynamical features (such as the strong internal rotation; Sollimaet al. 2009; Bianchini et al. 2013), especially the possibility of thepresence of a central, dynamically decoupled substructure, as re-vealed by the Schwarzschild model of van de Ven et al. (2006).M54 is thought to be the NSC of the Sagittarius dSph and, as such,to be in the process of being stripped by the Galactic potential(but Siegel et al. 2011, find that M54 may be 2 kpc in the fore-ground of the centre of the Sagittarius dSph; although, this wouldrequire an unusual alignment). There is also evidence for the pres-ence of an intermediate-mass black hole in both M54 and ω Cen,which also favours them being stripped NSCs (Noyola, Gebhardt &Bergmann 2008; Ibata et al. 2009; Miocchi 2010; Wrobel, Greene &Ho 2011); although, especially in the case of ω Cen, this issue isstill highly debated (Anderson & van der Marel 2010; van der Marel& Anderson 2010).
Inspired by the new recognition of chemical and dynamical com-plexity that seems to characterize these stellar systems, possibly atthe interface between GCs and NSCs, we wish to perform an in-vestigation of a number of structural, kinematical, and phase-spaceproperties of the products of numerical experiments of GCs merg-ers, as a possible formation scenario of NSCs. In particular, we wishto assess the persistence of any structural and kinematical distinc-tion between the different components, associated with the originalGCs, within the stellar system resulting from the merger process. Ananalysis, devoted to the exploration of the spatial and age differencesamong different mass components, has recently been presented byPerets & Mastrobuono-Battisti (2014); in the present investigation,we wish to devote our attention in particular to the kinematical anddynamical properties.
To test whether different components can be distinguished spa-tially and kinematically in the case of GC merging, we have studiedtwo simulations of this process. In simulation S1, a number of GCsmerge to form a larger object, while in simulation S2 we start with
a pre-existing SC, and then add several GCs, one at a time, to mergeto the central object. We then study the spatial distributions andthe kinematics of the stars originating in different GCs, and inves-tigate how well mixed they are. The article is organized as follows:Section 2 describes the simulation methods, Section 3 describes theresultant SCs for both simulations, and finally Section 4 presents adiscussion of our conclusions.
2 TH E S I M U L AT I O N S
Our N-body simulations were run using the efficient parallel treecode PKDGRAV (Stadel 2001) suitable for studying collisionless dy-namics. Collisional dynamics will become important over periodscomparable with the relaxation time that is ∼10 Gyr for our mergerremnants, significantly longer than the time-scales of our simula-tions. The effect of collisional dynamics would be to erase furtherany differences in spatial and kinematic properties of stellar popu-lations implying that it would become harder to distinguish stellarpopulations as time went on. In this sense, our results represent theoptimum chance of identifying stellar populations by their spatialand velocity distributions. Simulation S1 has not been describedpreviously and we provide a description here. Simulation S2 wasdescribed by Hartmann et al. (2011) and we only provide a briefdescription of it here. We have rescaled each simulation a posteri-ori, which we are at liberty to do as they are collisionless, so thatthe final merger remnant has similar mass and size to $ Cen. SeeTable 1 for the observed values of the mass and half-mass radius of$ Cen and Tables 2 and 3 for the mass and half-mass radii for oursimulations. All the data and figures are shown in units that reflectthis rescaling.
Both simulations S1 and S2 evolve within a bulge. The bulgemodel has a Hernquist (1990) profile:
ρ(r) = aMb
2πr(r + a)3, (1)
where the mass is 1.25 × 10⁸mmin, where mmin is the minimumparticle mass and the scale radius is a (for the actual mass andscale radius in our simulations see below). The density is truncatedsmoothly in energy space at r > 15a (Sellwood & Debattista 2009).The bulge is made up of 3.5 × 10⁶ particles with masses ranging
Table 2. Properties of the merger remnant in simulation S1at several times. NGC is the number of GCs that have mergedto that point.
Time Mass Half-mass radius NGC(Myr) × (106 M⊙) (pc)
140 1.83 2.42 3280 3.03 4.26 5420 3.05 4.36 5560 3.05 4.36 51090 3.6 6.2 6
Table 3. Properties of the merger remnant in simulation S2at three stages of its evolution.
Time Mass Half-mass radius NGC
(Myr) × (105 M⊙) (pc)
115 16.22 2.9 10220 28.39 6.2 20300 36.89 6.95 27
MNRAS 466, 2895–2909 (2017)

2898 D. R. Cole et al.
from mmin at the centre to 104mmin further out giving increasedmass resolution within 0.1a (Sellwood 2008). The bulge has nostrong instabilities meaning that the distribution of particles remainsunchanged on time-scales up to a Gyr, more than adequate to modelmultiple accretions of GCs. It should be emphasized that the massresolution in the inner 0.02a of the bulge model is very high andvery stable as shown by fig. 8 of Hartmann et al. (2011), as requiredfor proper dynamical modelling of the accretion of our SCs. Atleast 60 per cent of the mass of the bulge in the inner 0.02a ismade up of particles with mass ≤2mmin throughout the simulationand there is no substantial change in the distribution of particlemasses.
In simulation S1, there was no initial structure at the centre of thebulge; SCs were placed on orbits close to the centre, which decayeddue to dynamical friction, falling to the centre, where 6 of initially10 SCs merged to form a nuclear remnant. In order to approximate$ Cen, the bulge model has mmin = 120 M⊙ and a = 1.0 kpc.The SC models then have particles of equal mass (15 M⊙) andsoftening (ϵ = 0.08 pc). Their concentration c = 0.12 is definedas c = log(Reff/Rc), where Reff = 0.65 pc is the half-mass radius(effective radius) and Rc is the core radius, where the surface densitydrops to half of the central. The orbits of the 10 SCs were foundby selecting particles of the bulge with high angular momentumwithin a radius of 60 pc. We placed the SCs at the same positionand with the same velocities as these bulge particles. Afterwardswe rotated the SC system by 180◦ around the centre to avoid theSCs being coincident with the chosen particles. The orbits of ourSCs had random initial orientations and so were not coplanar. Theorientation of the angular momentum that the SCs contribute to themerger remnant is therefore not aligned. The initial distances ofthe SCs from the centre range from 30 to 60 pc, with velocitiesin the range of 40–270 km s−1. The model SCs have a mass of6 × 105 M⊙, comparable to GCs found in the Milky Way andthe Local Group (Figer, McLean & Morris 1999; Figer et al. 2002;Mackey & Gilmore 2003; McLaughlin & van der Marel 2005).The SC model is an isotropic distribution function of a loweredpolytrope with index n = 2:
f (x, v) ∝ [−2E(x, v)]1/2 − [−2Emax]1/2. (2)
An iterative process is used to produce equilibrium models(Debattista & Sellwood 2000).
Simulation S2 is the same as run A1 of Hartmann et al. (2011),which was also studied by Portaluri et al. (2013, and was alsorescaled). $ Cen is approximated when the SC models have parti-cles of equal mass (3 M⊙) and equal softening (ϵ = 0.04 pc). Theconcentration c = 0.16 and Reff =0.34 pc. This model is also compa-rable to massive young SCs in the Milky Way and the Local Group(Figer et al. 1999, 2002; Mackey & Gilmore 2003; McLaughlin &van der Marel 2005). We create an NSC for the SCs to accrete on toby letting a massive SC of similar profile and mass = 4 × 10⁵ M⊙,c = 0.12, and Reff = 0.66 pc, fall to the centre of the bulge. ThisSC was allowed to settle to the centre from a circular orbit at38 pc, which takes 25 Myr, before we started the accretion of 27GCs, starting them on circular orbits at a distance of 10 pc fromthe centre. In total, the mass accreted corresponds to ∼8.1 timesthe NSCs’ initial mass. Each accreted GC is allowed to reach thecentre of the cluster before a new GC is inserted. A single accre-tion on average requires ∼8 Myr and the 27 GCs are accreted in300 Myr.
3 R ESULTS
3.1 Properties of the merger remnant in simulation S1
3.1.1 Final properties
In this section, we examine the properties of the merger remnantformed in simulation S1 in terms of the stars that originated in eachprogenitor GC. The aim will be to see if we can distinguish thestars that originated in individual GCs as populations with distinctdistributions and kinematics within the merger remnant.
Table 2 shows the mass and the half-mass radius, Re, of thenuclear merger remnant at five times during the simulation. It shouldbe noted that there have been mergers within the previous 70 Myrat t = 140, 280, and 1090 Myr but not at 420 and 560 Myr, whichexplains why there is very little change in Re between the lattertimes. Fig. 1 shows a map of the merger remnant’s surface densitywithin 4Re after 1.09 Gyr. It has a mass of ∼3.6 × 10⁶ M⊙ and ahalf-mass radius Re ∼ 6.2 pc with a mildly oblate shape.
Fig. 2 shows the density profiles and Fig. 3 shows the velocitydispersion profiles in cylindrical coordinates for the merger remnant
Figure 1. Surface-density map of the final merger remnant from simulationS1 showing three orthogonal projections. The system has been oriented sothat the resulting angular momentum is about the z-axis.
Figure 2. Cylindrical density profiles for the final merger remnant forsimulation S1 showing the overall density and the densities contributed bystars originating in each progenitor GC. For comparison, the dashed (blue)line shows a power law with an exponent of −2.
MNRAS 466, 2895–2909 (2017)
Spatial and kinematic segregation in star-cluster merger remnants 2899
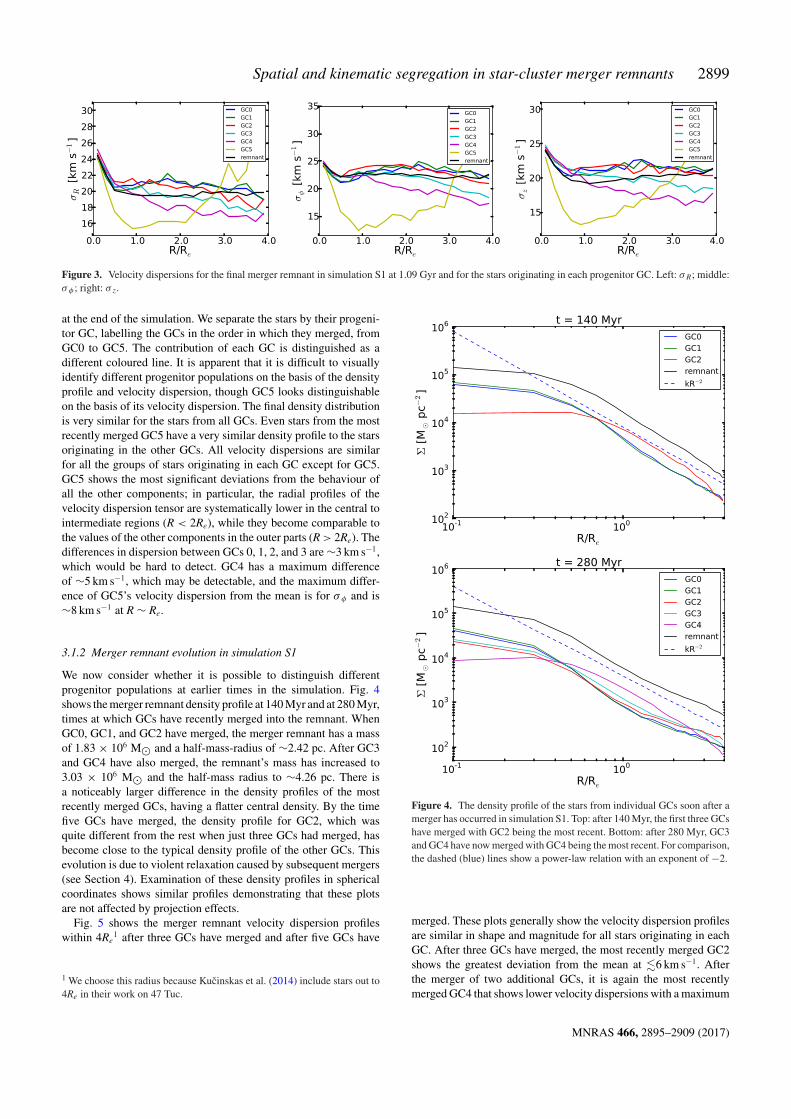
Figure 3. Velocity dispersions for the final merger remnant in simulation S1 at 1.09 Gyr and for the stars originating in each progenitor GC. Left: σR; middle:σφ ; right: σ z.
at the end of the simulation. We separate the stars by their progeni-tor GC, labelling the GCs in the order in which they merged, fromGC0 to GC5. The contribution of each GC is distinguished as adifferent coloured line. It is apparent that it is difficult to visuallyidentify different progenitor populations on the basis of the densityprofile and velocity dispersion, though GC5 looks distinguishableon the basis of its velocity dispersion. The final density distributionis very similar for the stars from all GCs. Even stars from the mostrecently merged GC5 have a very similar density profile to the starsoriginating in the other GCs. All velocity dispersions are similarfor all the groups of stars originating in each GC except for GC5.GC5 shows the most significant deviations from the behaviour ofall the other components; in particular, the radial profiles of thevelocity dispersion tensor are systematically lower in the central tointermediate regions (R < 2Re), while they become comparable tothe values of the other components in the outer parts (R > 2Re). Thedifferences in dispersion between GCs 0, 1, 2, and 3 are ∼3 km s−1,which would be hard to detect. GC4 has a maximum differenceof ∼5 km s−1, which may be detectable, and the maximum differ-ence of GC5’s velocity dispersion from the mean is for σφ and is∼8 km s−1 at R ∼ Re.
3.1.2 Merger remnant evolution in simulation S1
We now consider whether it is possible to distinguish differentprogenitor populations at earlier times in the simulation. Fig. 4shows the merger remnant density profile at 140 Myr and at 280 Myr,times at which GCs have recently merged into the remnant. WhenGC0, GC1, and GC2 have merged, the merger remnant has a massof 1.83 × 10⁶ M⊙ and a half-mass-radius of ∼2.42 pc. After GC3and GC4 have also merged, the remnant’s mass has increased to3.03 × 106 M⊙ and the half-mass radius to ∼4.26 pc. There isa noticeably larger difference in the density profiles of the mostrecently merged GCs, having a flatter central density. By the timefive GCs have merged, the density profile for GC2, which wasquite different from the rest when just three GCs had merged, hasbecome close to the typical density profile of the other GCs. Thisevolution is due to violent relaxation caused by subsequent mergers(see Section 4). Examination of these density profiles in sphericalcoordinates shows similar profiles demonstrating that these plotsare not affected by projection effects.
Fig. 5 shows the merger remnant velocity dispersion profileswithin 4Re
1 after three GCs have merged and after five GCs have
1 We choose this radius because Kucinskas et al. (2014) include stars out to4Re in their work on 47 Tuc.
Figure 4. The density profile of the stars from individual GCs soon after amerger has occurred in simulation S1. Top: after 140 Myr, the first three GCshave merged with GC2 being the most recent. Bottom: after 280 Myr, GC3and GC4 have now merged with GC4 being the most recent. For comparison,the dashed (blue) lines show a power-law relation with an exponent of −2.
merged. These plots generally show the velocity dispersion profilesare similar in shape and magnitude for all stars originating in eachGC. After three GCs have merged, the most recently merged GC2shows the greatest deviation from the mean at !6 km s−1. Afterthe merger of two additional GCs, it is again the most recentlymerged GC4 that shows lower velocity dispersions with a maximum
MNRAS 466, 2895–2909 (2017)

2900 D. R. Cole et al.
Figure 5. The velocity dispersion profile of the stars originating from individual GCs after three GCs have merged (top) and after five GCs have merged(bottom) in simulation S1. σR is shown on the left, σφ in the middle, and σ z on the right.
Figure 6. Briggs figure for the stars from different GCs in model 1. Thedirection of the angular momentum vector for each GC is indicated by theposition of the symbol on the plot. Circles are values after three GCs havemerged, squares after five GCs have merged, and triangles after six GCshave merged. The plot shows the values for stars inside of 4Re. We use thesame colour code as in other figures: GC0 – blue; GC1 – green; GC2 – red;GC3 – cyan; GC4 – magenta; and GC5 – yellow.
difference of ∼ 5 km s−1 from the mean. GC3 and GC4 are quitedistinguishable here, indicating that mixing is less complete.
Fig. 6 shows the evolution of the angular momentum of themerger remnant. We use Briggs figures (Briggs 1990) which are 2Dpolar coordinate representations of vector directions where the twospherical angle coordinates relative to a fixed reference frame, θ
and φ, are plotted as the radial and angle coordinates, respectively,on a 2D polar plot. The plot shows a Briggs figure for the stars fromdifferent GCs. It can be seen that the angular momentum vectors
are well aligned to better than 10◦ for stars inside of 4Re. The oneexception is GC2 after three GCs have merged, which is misalignedby ∼20◦ from GC0 and GC1 probably due to its recent merger.We repeated this analysis for stars inside of 3Re and found a verysimilar alignment indicating that the contribution of the outer starsto the total angular momentum does not bias this result.
The top row in Fig. 7 plots the angular momentum perpendicularto the plane of overall rotation, jz, versus energy for stars in threespherical radial ranges at 1.09 Gyr. jz is measured once the mergerremnant has been centred and its angular momentum vector alignedwith the z-axis, resulting in any flattening of the stars into a disclying in the x–y plane (c.f. Fig. 1). Stars in the inner radial bin havelower jz, increasing outwards. There is no evidence of groupingsof stars with distinct angular momentum signatures in these plotsthat would be indicative of separate populations. If we look at starsoriginating in different SCs, the only one that shows a significantdifference in this plot is GC5, i.e. the last one to merge. The middleand bottom rows of Fig. 7 show a comparison of jz versus energyfor GC0 and GC5 in the same three radial bins. GC5 shows sig-nificantly more stars with positive angular momentum in the innertwo radial bins; however, there is still significant overlap in stellardistribution.
We also looked for substructure in simulation S1 by examiningthe orientation of stellar angular momentum vectors. There seemsthe greatest likelihood of finding substructure at 140 Myr whenmixing is less complete. Fig. 8 plots the mass-weighted distributionof angular momentum orientation in the θ , φ plane for all stars insimulation S1 at 140 Myr in three radial ranges. The inner starswithin 4Re seem well mixed with a uniform distribution of starsover φ clustered around θ = 0◦. However, though this is also truein the range 4Re < r < 6Re, in addition two distinct small regionsof high density of angular momentum vectors can be seen in thisfigure at (θ , φ) ≈ (20◦, −115◦) and (45◦, −35◦). These representstars that are not yet well mixed into the merger remnant and may
MNRAS 466, 2895–2909 (2017)

Spatial and kinematic segregation in star-cluster merger remnants 2901
Figure 7. The vertical angular momentum jz versus energy for stars in three radial ranges at 1.09 Gyr for simulation S1. The left-hand column shows starsbetween 0 and 2Re, the middle between 2 and 4Re, and the right-hand one shows stars between 4 and 6Re. We show plots for all stars (top), for the starsoriginating in GC0 (middle), and GC5 (bottom). Stellar radii are measured in spherical coordinates. The mass of stars in each bin in the plot is colour codedwith the maximum shown in dark red decreasing through yellow to blue.
Figure 8. The orientation of angular momentum vectors for stars in three radial ranges after three clusters have merged (140 Myr) for simulation S1. Thesimulation is oriented so that the total angular momentum is oriented along the z-axis and the angular momentum spherical coordinates θ and φ are binned anda histogram of the mass is plotted. The left-hand column shows stars between 0 and 2Re, the middle between 2 and 4Re, and the right-hand one shows starsbetween 4 and 6Re. Stellar radii are measured in spherical coordinates. The mass of stars in each bin in the plot is colour coded with the maximum shown indark red decreasing through yellow to blue.
be distinguishable as stellar streams. This type of substructure isalso seen following mergers at 280 and 1090 Myr in simulation S1.
Fig. 9 shows the evolution of the stars from each GC on the (V/σ ,ϵ) diagram of Binney (2005). It has been measured as describedin Hartmann et al. (2011) within 2Re. The radial profiles of theobservables depicted in the diagram have been calculated along aline of sight (LOS) corresponding to a direction perpendicular to
the orientation of the angular momentum vector (i.e. edge-on). Theregion inside of 2Re is divided into bins of equal size and V/σ iscalculated as
"V
σ
#
e
≡ ⟨V 2⟩⟨σ 2⟩
= )Nn=1FnV
2n
)Nn=1Fnσ 2
n
, (3)
MNRAS 466, 2895–2909 (2017)

2902 D. R. Cole et al.
Figure 9. Evolution of the merger remnant of simulation S1 on the (V/σ ,ϵ) diagram of Binney (2005) measured as in Hartmann et al. (2011) within2Re. The black line shows the location of edge-on oblate isotropic rotatormodels. Each GC is indicated by a different colour. GC0 is blue, GC1 isgreen, GC2 is red, GC3 is magenta, GC4 is cyan, and GC5 is yellow. Thedifferent symbols show the values at different times. Note that GC3 andGC4 have not merged until 280 Myr and have no data for 140 Myr, and GC5has just merged at the end of the simulation and shows no evolution.
and the ellipticity ϵ is found from
(1 − ϵ)2 = q2 = ⟨y2⟩⟨x2⟩
= )Nn=1Fny
2n
)Nn=1Fnx2
n
, (4)
where Fn is the mass in the nth bin and Vn and σ n are the corre-sponding mean velocity and velocity dispersion in that bin. It canbe seen that GCs when first merged can have large differences intheir location on the diagram, for instance GC2, GC4, and GC5.However, as the remnant evolves, stars originating in different GCsmove closer together. Even though GC2 and GC4 are initially lo-cated in very different parts of the diagram compared to the othermass components, they subsequently evolve towards the same re-gion, corresponding to moderate flattening and mild rotation. Inparticular, the evolution in the diagram of GC2 (from a condition ofhigh flattening and significant rotation) seems to be associated withmerger events of GC3 and GC4. The component GC4 evolves in asimilar way, but on a longer time-scale, and it becomes comparableto the other components only after the completion of all six mergerevents.
3.1.3 Kolmogorov–Smirnov statistics
In this section, we make some quantitative measurements of theprobability that stars originating in each of the GCs could be dis-tinguished from the overall distribution by using the Kolmogorov–Smirnov (K–S) test on the fractional distribution of stars within 4Re.We shall assume that stars from each of the GCs can be chemicallyidentified and then find the probability that stars from pairs of GCscan be distinguished. We analyse the spatial and kinematic prop-erties of the stars in our simulations independently, reflecting theusual method used in observational studies cited in Section 1. Thismeans that we only use either the stellar density or the kinematicsseparately to produce Figs 10 and 15 below.
We first perform K–S tests on the spatial distribution of starsfrom each GC at the point where three, five, and six GCs make upthe merger remnant. Fig. 10 shows a graphical representation of
the probabilities, p (p-value), in log10 space, that stars originatingin pairs of merged GCs are indistinguishable. The p-values arecalculated on the cumulative fraction of a random selection of 200stars from each cluster taken 1000 times and averaged. Fig. 10 iscomposed of n2 cells where n is the number of GCs merged in theremnant up to that point. The GCs are laid out along the x andy axes in order and the number displayed in the cell where theappropriate row and column cross is the p-value for the probabilitythat the stars from those two GC populations are indistinguishable.The p-values in the upper left half of the figure (above the diagonal)are for the spatial distribution of the GCs and those in the lowerright half (below the diagonal) are for the cumulative LOS velocitydistribution. The LOS velocity is measured viewing the systemperpendicular to the total angular momentum vector. The figure iscolour coded so that high values of the p-value are darker (green)and low values are lighter (yellow).
The p-values for the LOS velocity show that there is a highprobability that stars from any pair of GCs are indistinguishable inkinematics. The lowest p-value is ∼0.32. The p-values for the spatialdistribution show a greater likelihood that two GC populations couldbe distinguished. When the merger remnant consists of three GCs,GC0 and GC1 have a high probability that their stars are indistin-guishable. However, the most recently merged GC2 has a relativelysmall probability that it is indistinguishable from GC0 or GC1, soit seems possible that it could be distinguished by this method.We see a similar situation when two more GCs have merged, atwhich point GC4 has less than 1 per cent probability that its starsare indistinguishable from those of GC0 or GC1. However, all otherp-values are >1 per cent implying that it would be difficult to dis-tinguish separate populations. When the merger remnant containssix GCs even the most recently merged GC, GC5, has a greater than2 per cent probability that its stars are spatially and kinematicallyindistinguishable from those of GC2. Other p-values are >0.1 apartfrom GC2 that remains the most distinguishable of the remainingGCs in its spatial distribution having a 4 per cent probability that itsstars are indistinguishable from those of GC1.
3.2 Properties of the merger remnant in simulation S2
We now examine the results for simulation S2 (run A1 of Hartmannet al. 2011). In this simulation, a massive SC is initially placed on anorbit close to the centre where it eventually settles. A series of lessmassive SCs are then placed on orbits at 10 pc from the centre, oneat a time. Their orbits decay to the centre where they merge withthe central structure. Each one is allowed to merge before the nextone is added to the simulation. At the end of the simulation, 27 GCshave merged. Fig. 11 shows a stellar density map for simulationS2 at the end of the simulation. The merger remnant is much moreflattened than that in simulation S1 because the GC orbits are allco-planar (compare with Fig. 2). Table 3 shows the mass and half-mass radius for the merger remnant at 115, 220, and 300 Myr when10, 20, and 27 clusters have merged. Re grows significantly between115 and 220 Myr from 2.9 to 6.2 pc.
Fig. 12 shows the evolution of the surface-density profile forthe merger remnant within 4Re showing increasing density at thecentre. Fig. 13 shows surface-density profiles for specific GCs atthe same three times. The GCs which merge first have very similardensity profiles but we see larger differences for the most recentlymerged GCs, especially at later times. The density profile for theseGCs is either flat in the middle or even dropping towards the centre,showing that their density profiles will evolve further.
MNRAS 466, 2895–2909 (2017)

Spatial and kinematic segregation in star-cluster merger remnants 2903
Figure 10. Simulation S1 log10 of p-values for 200 stars from each cluster within 4Re when the merger remnant contains three GCs (left), five GCs (middle),and six GCs (right). The grid is arranged so that the figures above the diagonal are calculated by comparing the cumulative spatial distributions of a pairof GCs and those below the diagonal are based on a comparison of the cumulative absolute velocity distribution as seen by an observer viewing the systemperpendicular to the total angular momentum vector. The p-value for any pair of GCs is found at the intersection of the appropriate row and column. The figureis colour coded so that high p-values are darker (green) and low p-values are lighter (yellow).
Figure 11. Surface-density map of the merger remnant from simulation S2(run A1 of Hartmann et al. 2011) showing three orthogonal projections. Thelower left-hand plot is face-on to the net angular momentum vector and theother two are perpendicular to it.
Fig. 14 depicts the velocity dispersion profiles for the same GCsat the three times shown in Figs 11 and 12 as well as the veloc-ity dispersion for the whole cluster. These profiles show a similarpattern to the density and kinematic profiles. The first five GCs tomerge have very similar profiles and the most recent GC to havemerged always shows the biggest difference. There are also biggerdifferences for the recently merged GCs at later times. The velocitydispersions for the whole cluster increase significantly from whenthe merger remnant contains 10 GCs to when it has 27 GCs.
At each time the five most recently merged GCs all show a greaterdifference in density profile and kinematics from the average. Frominspection of the density profiles, it appears that these componentsare still experiencing significant evolution, and therefore it is notsurprising to notice some differences in their kinematics. After thefirst 10 merger events, only the last cluster component (GC9) isstill distinguishable from the global behaviour. Similarly, after 20merger events, the behaviour of the last five clusters still retainssome differences from the overall spatial and kinematic profiles
Figure 12. Evolution of the surface density for the merger remnant insimulation S2.
(especially in the case of GC19). This applies also to the subsequentcomponents in the remnant, after it has experienced the full seriesof 27 merger events. It appears that in simulation S2, there is agreater likelihood that we would be able to distinguish individualpopulations from specific recently merged GCs but later mergersproduce a smaller fractional perturbation.
3.2.1 Kolmogorov–Smirnov statistics
We performed K–S tests for simulation S2, looking at the spatialdistribution of stars originating in individual merged GCs after 10,20, and 27 GCs have merged, drawing 200 stars from each cluster ineach sample. Fig. 15 shows a representative sample of cumulativefractions of stars originating in individual merged GCs at the sametimes considered in Fig. 15. The pairs are defined by considering aselection of components that belong to either one of the five earliestmerged GCs or from one of the five most recently merged clusters;such a prescription allowed us to perform a comparison betweenthe most similar and the most different distributions, respectively.The pair from the five earliest merged GCs were chosen to have thegreatest apparent difference in distribution. After 20 GCs and 27GCs have merged a further GC was chosen from an intermediate
MNRAS 466, 2895–2909 (2017)

2904 D. R. Cole et al.
Figure 13. The density profile at three different times for model 2. The panels show when 10 GCs (left), 20 GCs (centre), and 27 GCs (right) are in the mergerremnant.
Figure 14. Simulation S2 velocity dispersion profiles in cylindrical coordinates when the merger remnant contains 10 GCs (top), 20 GCs (middle), and 27GCs (bottom). Profiles for the first five GCs to merge and the five most recently merged GCs are shown. Radial profiles are on the left, azimuthal profiles arein the centre, and vertical profiles are on the right.
merger event to sample a different stage of the merger. The objectiveof this selection is to show the outliers of the possible comparisonsin spatial segregation.
Again the p-values in the upper left half of the figure (above thediagonal) are for the spatial distribution of the GCs and those inthe lower right half (below the diagonal) are for the LOS velocityseen by an observer viewing the system perpendicular to the to-tal angular momentum vector. The p-values for the LOS velocity
tests again show that there is a high probability that any pair ofGCs are indistinguishable using this K–S test. The lowest p-value,∼0.14, still demonstrates a high likelihood that the two GCs areindistinguishable. When the merger remnant contains 10 GCs theK–S tests based on the spatial distribution show that the earliestmerged GCs, which are GC0, GC4, and GC5, taken pairwise havep-values >1 per cent, whereas GC9 has a low probability that it isindistinguishable from the other three. Similarly, when 20 GCs have
MNRAS 466, 2895–2909 (2017)

Spatial and kinematic segregation in star-cluster merger remnants 2905
Figure 15. Simulation S2 log10 of p-values for the cumulative spatial distribution of 200 stars from each cluster within 4Re when the merger remnant contains10 GCs (left), 20 GCs (middle), and 27 GCs (right), and cumulative absolute velocity distribution as seen by an observer viewing the system perpendicular tothe total angular momentum vector. The p-value for any pair of GCs is found at the intersection of the appropriate row and column. The figure is colour codedso that high p-values are green and low p-values are yellow. See Fig. 10 for a full explanation of the layout.
Figure 16. The probability when the merger remnant is made of 27 GCsthat the earliest merged GC0 in simulation S2 is indistinguishable fromall the others based on spatial distribution with samples of 200 stars fromeach GC.
merged GC3, GC4, GC12, and GC15, which have been merged forlongest, have p-values >0.001 in tests between each other, whereasGC19 has a p-value <5 × 10⁻⁶ when tested pairwise with anyof the others. When 27 GCs have merged, GC3 and GC4 have asimilar spatial distribution and GC19, GC22, and GC26 have lowlikelihoods of being indistinguishable from GC3 and GC4.
At each time, we find that the 6–8 most recently merged GCs havea low probability that they are indistinguishable from earlier mergedGCs based on their spatial distribution. When GCs have mergedprior to this in the merger sequence, their stars have a spatial distri-bution that is similar to that of the overall merger remnant. An illus-tration of this is shown in Fig. 16. This shows the probability, basedonly on spatial distributions, that the earliest merged GC, GC0,is indistinguishable from each of the others when the merger rem-nant contains stars from 27 GCs. This p-value is generally ∼0.2–0.5but always >1 per cent for all GCs up to GC18 and then falls sharplyfrom GC19 (probability, p < 10−5) to GC26 (just merged). This im-plies that stars from a GC that has merged in the most recent eightmergers could be distinguished by their spatial distribution but starsfrom a GC that underwent a prior merger could not.
Fig. 17 shows the p-values laid out as before for all pairs of GCsat the end of the simulation in simulation S2. The lower right half
of the figure shows the p-values for the velocity distributions. Thesep-values are all >10 per cent showing we cannot use their velocitydistributions to distinguish stars from different GCs. Based on theseresults, it seems more likely for observations to find substructure dueto variations in stellar density than in stellar kinematics. The upperleft half of the figure shows p-values for the spatial distributions. Thep-values of the last six to eight GCs to merge when tested with oneof the first 18 GCs to merge are low. p-values for GC0–GC18 takenin pairs show higher likelihood that these GCs are indistinguishable.
If we look for groups of GCs that all have p-values of >10 per centwhen tested with each other, we find two large groups made up of11 and 7 GCs and three small groups of three, three, and two GCs.The two large groups are made up from the first 18 GCs to merge.If we set the p-value threshold at 1 per cent, we still find two largegroupings made up of 15 and 6 GCs (again made up from the earlierGCs to merge) and two smaller made up of three and two GCs.
3.3 Dependence of K–S results on number of stars observed
We have chosen, somewhat arbitrarily, 200 stars from each clusterto compare our distributions. Given that we have simulations with∼40 000 star particles representing each GC, we could have usedup to thousands of stars to perform our K–S tests. Though theprofiles we have examined would not have changed by using morepoints, this would result in lower p values for the same differencein spatial or velocity distribution. Observational uses of the K–Stest are limited by the number of stars observed and so for ourpurposes we should ensure that we are performing our tests with asimilar number of stars. Kucinskas et al. (2014) perform their K–Stests on 101 main-sequence turn-off stars in 47 Tuc meaning theyare comparing subsamples with tens of stars. Lardo et al. (2011)used K–S tests to distinguish different populations of stars in theu, g, r SDSS bands. They compared samples containing from tensto several hundred stars. In order to assess the effect of using largernumbers of stars, we repeated some of our K–S tests again with1000 stars from each cluster.
Fig. 18 shows the p-values as described in Section 3.1.3 but nowwith 1000 stars from each cluster. At 140 Myr, the results are similarto the results with 200 stars per cluster. As previously, GC2 is dis-tinguishable by its spatial distribution. At 280 Myr, however, mostGC pairs have a spatial p-value <10−6 and are now distinguishableby their spatial distribution. Only GC0/GC1 and GC2/GC3 have ap-value for their spatial distribution >1.5 per cent. We see a similar
MNRAS 466, 2895–2909 (2017)

2906 D. R. Cole et al.
Figure 17. p-values for the cumulative spatial and velocity distribution of 200 stars within 4Re at the end of the simulation for simulation S2, for all pairs ofGCs. The p-value for any pair of GCs is found at the intersection of the appropriate row and column. The figure is colour coded so that high p-values are greenand low p-values are yellow. See Fig. 10 for a full explanation of the layout.
Figure 18. Simulation S1 log10 of p-values for the cumulative spatial distribution of 1000 stars from each cluster within 4Re when the merger remnant containsthree GCs (left), five GCs (middle), and six GCs (right) and cumulative absolute velocity distribution as seen by an observer viewing the system perpendicularto the total angular momentum vector as in Fig. 10. The p-value for any pair of GCs is found at the intersection of the appropriate row and column. The figureis colour coded so that high p-values are green and low p-values are yellow. See Fig. 10 for a full explanation of the layout.
MNRAS 466, 2895–2909 (2017)

Spatial and kinematic segregation in star-cluster merger remnants 2907
effect at 1090 Myr though not quite as marked. However, at this timeGC2, GC4, and GC5 are distinguishable by their spatial distributionwith GC3, GC4, and GC5 having relatively high p-values that theyare drawn from the same population. Thus, unsurprisingly, increas-ing the number of stars has had a significant effect on our ability toidentify different populations by their spatial distribution. Pairs thatwere previously indistinguishable can now be distinguished fromtheir spatial distributions.
4 D ISCUSSION
We have shown that the stars originating in individual GCs thatmerge can be difficult to identify from their spatial or velocity dis-tributions with currently observable sample sizes. It is often the mostrecently merged GCs that are distinguishable by observations. Starsfrom the most recently merged few GCs have a low probability,based on their spatial distribution, so that they are indistinguish-able from earlier merged GCs. However, this probability increasesquickly as more GCs merge and soon become spatially distributedand kinematically similar to the rest of the cluster. Our analysis hastreated the spatial and kinematic stellar distributions of our simula-tions independently, reflecting the current observational approach.It is likely that examining the combined spatial and kinematic prop-erties by looking for correlations in phase space would make itpossible to detect substructure for longer.
Our simulations show examples of violent relaxation (Lynden-Bell 1967) where the final distribution of particles is the result of thestar particles being scattered by the rapidly changing gravitationalpotential produced by a merger. This is true in simulation S1 wherethe accreting GC will produce changes in the gravitational potentialcomparable to the existing merger remnant gravitational field. Insimulation S2, the accreting GCs have a smaller mass ratio withthe existing SC but still produce substantial perturbations in themerger remnant potential. Studies of violent relaxation in galaxymergers have found that radial abundance and colour gradients cansurvive the mixing of stellar populations but that they are reduced(White 1980; Barnes 1988, 1996; Mihos & Hernquist 1994).
Our merger remnants are collisionless, non-spherical systems.Merritt & Valluri (1996) found that collisionless mixing in triaxialpotentials representative of elliptical galaxies occurs with charac-teristic times of 10–30 dynamical times. For our systems, the dy-namical time at Re ∼ 5 × 10⁵ yr giving a mixing time of 5 to 15 Myr.Valluri et al. (2007) studied the mechanisms responsible for mixingin collisionless mergers (in their case dark matter haloes). Theyfound that the mixing in phase space is driven by the exchange ofenergy and angular momentum at pericentric passage due to tidalshocks and dynamical friction. They find that in the merger remnantmost particles retain a memory of their original kinetic energy andangular momentum but there are changes due to the tidal shocks.Importantly, they do not find more large-scale mixing in radiuscompared to an isolated halo and conclude that radial gradients instellar properties, such as metallicity, can survive such mergers. Inthe case of NSCs (and potentially GCs too), we would like to knowif the merging of stellar systems each composed of a single pop-ulation can produce multiple populations distinguishable by theirspatial and velocity profiles. If mono-abundance GCs merge to formNSCs, they will retain some of their kinetic energy and angular mo-mentum profiles. Stars from different merging GCs will have similarspatial and velocity distributions prior to the merger and retain theseafterwards. Our results indicate that creating a merger remnant re-sults in the stars from different GCs having a similar spatial andvelocity distribution except for recent mergers, implying that if our
clusters were made up of distinct stellar populations they would bedifficult to detect by their spatial and velocity distribution.
In contrast, observations of the most massive GCs in the Galaxyshow that different populations can be identified by their chemistryor photometry and that these populations have distinguishable spa-tial and velocity distributions. Kucinskas et al. (2014) studied 47Tuc and found a difference in [Na/O] and [Li/Na] abundance ratios.They identified three distinct groupings and found that these groupswere distinguishable in both their spatial distribution and kinematicproperties. Richer et al. (2013) also found that populations identifiedby colour in 47 Tuc could be distinguished by their radial distribu-tion as well as their proper motions. Lardo et al. (2011) in a studyof nine Galactic GCs found that populations could be identified bycolour differences and these populations could be distinguished bytheir radial distribution.
Kobayashi (2004) studied the chemodynamic evolution of ellip-tical galaxies following mergers and showed that metallicity gradi-ents have the largest change when the galaxies are of comparablemass. They find that when the mass ratio of the two galaxies ismore than 20 per cent, then the metallicity gradient change is "0.5dex. Di Matteo et al. (2009) investigated dry mergers of early-typegalaxies with a variety of properties using N-body simulations. Theyfound that such mergers flatten the metallicity gradient in the mergerremnant but that ellipticals can retain their pre-merger metallicitygradient if one of the merging galaxies has a steep pre-merger slope.Should a small metallicity gradient exist in our merger remnant, therepeated merging in our simulations would be likely to continuallyreduce any stellar population gradients making any remnant gradi-ent hard to observe. Building an NSC from GCs would require earlymergers to have mass ratios of more than 20 per cent maximizingthe reduction in the existing gradient. This is the case in our earliestmergers in simulation S1 where we find the greatest likelihood ofdistinguishing stars from different merging GCs.
From the GCs perspective, the characterization of the process ofmixing of different stellar populations plays a crucial role for the in-terpretation of the spatial and kinematical properties of present-dayGalactic SCs. The key physical driver of the mixing is represented bytwo-body collisional relaxation processes, which, during the courseof the long-term dynamical evolution of the systems, may graduallyerase any intrinsic difference in the spatial and kinematical distribu-tion of different stellar populations. Within the formation scenarioin which the AGB stars are the ‘polluters’ contributing to enrich thegas from which the second generation is formed, Vesperini et al.(2013) have explored, by means of direct N-body simulations, thetime-scales and the dynamics of the spatial mixing of two differentpopulations, and their dependence on the initial concentration ofthe ‘second generation’ stars. They found that the time-scale forcomplete mixing depends on the initial concentration of the secondgeneration, but that, in general, complete mixing is expected onlyfor clusters in the late stages of their evolution, after they have losta significant fraction of their initial mass due to relaxation-drivenprocesses. Such a theoretical investigation therefore supports theobservational evidence that, in several present-day SCs, differentpopulations are characterized by distinguishable spatial distribu-tions (with the helium-enriched population being the more centrallyconcentrated one). In particular, Kucinskas et al. (2014), in a studyof 47 Tuc, found that a K–S test of the fractional distribution of thedifferent generations of stars plotted against radius from the centreof the cluster gives a probability p = 6.0 × 10⁻⁷ that the primordialand chemically enriched distributions are indistinguishable (for atotal of 101 stars). K–S tests of the absolute LOS velocities of thedifferent stellar generations also give low probabilities that they are
MNRAS 466, 2895–2909 (2017)

2908 D. R. Cole et al.
drawn from the same population (p = 7.0× 10⁻⁷). We emphasizethat K–S tests with a greater number of stars from mass compo-nents associated with specific GCs in our simulations find muchlower likelihoods that they are drawn from the same populationboth for spatial and velocity distributions.
It should be noted that the initial density profile of our GCs wouldhave an effect on the degree of mixing in our merger remnants.Assmann et al. (2013) noted that initially flat inner density profilesfavour preservation of pre-existing structures compared to steepercuspy ones. Our initial density profile is cuspy, with the density ofthe bulge model scaling as r−1 inside 100 pc. This would lead toa lower likelihood of preserving observable populations; however,the overall density profile is flattened by the earliest mergers insidea few Re in both our simulations, favouring the preservation ofstructure. Gavagnin, Mapelli & Lake (2016) found that the keyaspects of the initial conditions for mergers of GCs are the initialmass and density ratios of the progenitors. They found that moremassive progenitor GCs dominate except where the less massiveprogenitor is denser by a similar factor to the mass ratio. The massratios in our mergers are a few to one for simulation S1 indicatingthat this would not have a significant effect on the results. The ratiosare larger for simulation S2, but as low as 3:1 for the early mergersand less than 20:1 for the majority of the mergers.
As for the GCs kinematic properties, it has been shown, viadirect N-body simulations, that different populations may be char-acterized by different kinematical properties (see section 4 in Belliniet al. 2015). In particular, the diffusion from the innermost regionsto the outer parts of the clusters of the most centrally concentratedpopulation is associated with the growth of radial anisotropy insuch a population, in agreement with recent observational studiesof selected Galactic GCs (47 Tuc, Richer et al. 2013; NGC 2808,Bellini et al. 2015). One additional question is related to the kine-matic imprints (and their survival) of different formation scenariosfor multiple stellar populations in GCs. Henault-Brunet et al. (2015)have addressed such a question by using direct N-body simulations,and found that different formation mechanisms show distinct kine-matical signatures that can persist for a Hubble time. In summary,in the context of the formation and dynamical evolution of GCs,there is convincing evidence, mostly based on N-body models, thatspatial and kinematical differences, either intrinsically associatedwith the formation scenarios or induced by collisional relaxationprocesses, may persist for several half-mass relaxation times.
Bearing in mind the fundamental differences between the for-mation scenarios (and the intrinsic nature) of GCs and NSCs, wehave performed an investigation of the structural and kinematicalproperties of the mass components associated with different clus-ters, progressively merged to form a single central stellar system.Motivated by specific cases of peculiar SCs that, in light of theirchemical and dynamical complexity, have been suggested to bestripped nuclei of dwarf galaxies (e.g. M 54, ω Cen), we assessthe existence and persistence of any spatial or dynamical signatureassociated with the merger histories considered in our two simu-lations. Our analysis shows that such a differentiation is difficultwith currently available numbers of observations if NSCs formedby merging alone, except for recent mergers, and hints towards theneed for gas and dissipational processes in observed systems.
ACKNOWLEDGEMENTS
We would like to thank Iskren Georgiev, Nadine Neumayer, andAlessandra Mastrobuono-Battisti for their useful discussions and
comments on the earlier drafts of this paper. We would also liketo thank the referee Mark Wilkinson for his very helpful com-ments and questions. Simulations in this paper were carried outon the COSMOS Shared Memory system at DAMTP, Universityof Cambridge operated on behalf of the STFC DiRAC HPC Fa-cility. This equipment is funded by BIS National E-infrastructurecapital grant ST/J005673/1 and STFC grants ST/H008586/1 andST/K00333X/1. DRC and VPD were supported by STFC Con-solidated grant no. ST/J001341/1. We made use of PYNBODY
(https://github.com/pynbody/pynbody) in our analysis for this pa-per. A-LV acknowledges support from the Royal Commission forthe Exhibition of 1851. We would like to acknowledge the LorentzCentre in Leiden that hosted the meeting ‘Nuclear Star Clusters inGalaxies, and the Role of the Environment’, 2014 June 30 to July 4,where discussions stimulated our ideas set forth in this paper.
R E F E R E N C E S
Amaro-Seoane P., Konstantinidis S., Brem P., Catelan M., 2013, MNRAS,435, 809
Anderson J., van der Marel R. P., 2010, ApJ, 710, 1032Antonini F., 2013, ApJ, 763, 62Antonini F., 2014, ApJ, 794, 106Antonini F., Capuzzo-Dolcetta R., Mastrobuono-Battisti A., Merritt D.,
2012, ApJ, 750, 111Antonini F., Barausse E., Silk J., 2015, ApJ, 812, 72Arca-Sedda M., Capuzzo-Dolcetta R., 2014, MNRAS, 444, 3738Arca-Sedda M., Capuzzo-Dolcetta R., Antonini F., Seth A., 2015, ApJ, 806,
220Assmann P., Fellhauer M., Wilkinson M. I., Smith R., Blana M., 2013,
MNRAS, 435, 2391Barnes J. E., 1988, ApJ, 331, 699Barnes J., 1996, in Bender R., Davies R. L., eds, Proc. IAU Symp. 171, New
Light on Galaxy Evolution. Kluwer, Dordrecht, p. 191Bastian N., 2015, preprint (arXiv:1510.01330)Bastian N., Lamers H. J. G. L. M., de Mink S. E., Longmore S. N., Goodwin
S. P., Gieles M., 2013, MNRAS, 436, 2398Bekki K., 2007, PASA, 24, 77Bekki K., Norris J. E., 2006, ApJ, 637, L109Bekki K., Yong D., 2012, MNRAS, 419, 2063Bellini A. et al., 2015, ApJ, 810, L13Bianchini P., Varri A. L., Bertin G., Zocchi A., 2013, ApJ, 772, 67Binney J., 2005, MNRAS, 363, 937Boker T., Laine S., van der Marel R. P., Sarzi M., Rix H.-W., Ho L. C.,
Shields J. C., 2002, AJ, 123, 1389Briggs F. H., 1990, ApJ, 352, 15Capuzzo-Dolcetta R., 1993, ApJ, 415, 616Capuzzo-Dolcetta R., Miocchi P., 2008a, MNRAS, 388, L69Capuzzo-Dolcetta R., Miocchi P., 2008b, ApJ, 681, 1136Carollo C. M., Stiavelli M., de Zeeuw P. T., Mack J., 1997, AJ, 114, 2366Carretta E., 2015, ApJ, 810, 148Carretta E. et al., 2010a, A&A, 520, A95Carretta E. et al., 2010b, ApJ, 714, L7Carretta E., Lucatello S., Gratton R. G., Bragaglia A., D’Orazi V., 2011,
A&A, 533, A69Carson D. J., Barth A. J., Seth A. C., den Brok M., Cappellari M., Greene
J. E., Ho L. C., Neumayer N., 2015, AJ, 149, 170Catelan M., 1997, ApJ, 478, L99Cen R., 2001, ApJ, 560, 592Cordero M. J., Pilachowski C. A., Johnson C. I., McDonald I., Zijlstra
A. A., Simmerer J., 2014, ApJ, 780, 94Cote P. et al., 2006, ApJS, 165, 57D’Antona F., Vesperini E., D’Ercole A., Ventura P., Milone A. P., Marino
A. F., Tailo M., 2016, MNRAS, 458, 2122D’Ercole A., Vesperini E., D’Antona F., McMillan S. L. W., Recchi S., 2008,
MNRAS, 391, 825
MNRAS 466, 2895–2909 (2017)

Spatial and kinematic segregation in star-cluster merger remnants 2909
D’Ercole A., D’Antona F., Ventura P., Vesperini E., McMillan S. L. W.,2010, MNRAS, 407, 854
D’Ercole A., D’Antona F., Carini R., Vesperini E., Ventura P., 2012,MNRAS, 423, 1521
D’Souza R., Rix H.-W., 2013, MNRAS, 429, 1887Da Costa G. S., Held E. V., Saviane I., Gullieuszik M., 2009, ApJ, 705, 1481De Lorenzi F., Hartmann M., Debattista V. P., Seth A. C., Gerhard O., 2013,
MNRAS, 429, 2974de Mink S. E., Pols O. R., Langer N., Izzard R. G., 2009, A&A, 507, L1Debattista V. P., Sellwood J. A., 2000, ApJ, 543, 704Di Matteo P., Pipino A., Lehnert M. D., Combes F., Semelin B., 2009, A&A,
499, 427Emsellem E., van de Ven G., 2008, ApJ, 674, 653Ferraro F. R. et al., 2009, Nature, 462, 483Figer D. F., McLean I. S., Morris M., 1999, ApJ, 514, 202Figer D. F. et al., 2002, ApJ, 581, 258Gavagnin E., Mapelli M., Lake G., 2016, MNRAS, 461, 1276Georgiev I. Y., Boker T., 2014, MNRAS, 441, 3570Gnedin O. Y., Ostriker J. P., 1997, ApJ, 474, 223Gnedin O. Y., Ostriker J. P., Tremaine S., 2014, ApJ, 785, 71Gratton R. G., Carretta E., Bragaglia A., 2012, A&AR, 20, 50Harris W. E., 1996, AJ, 112, 1487Hartmann M., Debattista V. P., Seth A., Cappellari M., Quinn T. R., 2011,
MNRAS, 418, 2697Henault-Brunet V., Gieles M., Agertz O., Read J. I., 2015, MNRAS, 450,
1164Hernquist L., 1990, ApJ, 356, 359Ibata R. et al., 2009, ApJ, 699, L169Kobayashi C., 2004, MNRAS, 347, 740Kucinskas A., Dobrovolskas V., Bonifacio P., 2014, A&A, 568, L4Lanzoni B. et al., 2010, ApJ, 717, 653Lapenna E., Mucciarelli A., Lanzoni B., Ferraro F. R., Dalessandro E.,
Origlia L., Massari D., 2014, ApJ, 797, 124Lardo C., Bellazzini M., Pancino E., Carretta E., Bragaglia A., Dalessandro
E., 2011, A&A, 525, A114Lardo C. et al., 2015, A&A, 573, A115Lee Y.-W., Joo J.-M., Sohn Y.-J., Rey S.-C., Lee H.-C., Walker A. R., 1999,
Nature, 402, 55Long K. S., Charles P. A., Dubus G., 2002, ApJ, 569, 204Lynden-Bell D., 1967, MNRAS, 136, 101Lyubenova M. et al., 2013, MNRAS, 431, 3364Mackey A. D., Gilmore G. F., 2003, MNRAS, 340, 175McLaughlin D. E., van der Marel R. P., 2005, ApJS, 161, 304Marino A. F., Milone A. P., Piotto G., Villanova S., Bedin L. R., Bellini A.,
Renzini A., 2009, A&A, 505, 1099Marino A. F. et al., 2011, A&A, 532, A8Marino A. F. et al., 2015, MNRAS, 450, 815Marino A. F. et al., 2016, MNRAS, 459, 610Marks M., Kroupa P., 2010, MNRAS, 406, 2000Massari D. et al., 2014, ApJ, 795, 22Mastrobuono-Battisti A., Perets H. B., 2013, ApJ, 779, 85Merritt D., Valluri M., 1996, ApJ, 471, 82Meylan G., Mayor M., Duquennoy A., Dubath P., 1995, A&A, 303, 761Mihos J. C., Hernquist L., 1994, ApJ, 427, 112Milosavljevic M., 2004, ApJ, 605, L13
Miocchi P., 2010, A&A, 514, A52Miocchi P., Capuzzo Dolcetta R., Di Matteo P., Vicari A., 2006, ApJ, 644,
940Mucciarelli A., Lapenna E., Massari D., Ferraro F. R., Lanzoni B., 2015,
ApJ, 801, 69Noyola E., Gebhardt K., Bergmann M., 2008, ApJ, 676, 1008Origlia L. et al., 2011, ApJ, 726, L20Pancino E., Bellazzini M., Marinoni S., 2013, Mem. Soc. Astron. Ital., 84,
83Perets H. B., Mastrobuono-Battisti A., 2014, ApJ, 784, L44Pfuhl O. et al., 2011, ApJ, 741, 108Piotto G. et al., 2015, AJ, 149, 91Portaluri E., Corsini E. M., Morelli L., Hartmann M., Dalla Bonta E.,
Debattista V. P., Pizzella A., 2013, MNRAS, 433, 434Prantzos N., Charbonnel C., 2006, A&A, 458, 135Renzini A. et al., 2015, MNRAS, 454, 4197Richer H. B., Heyl J., Anderson J., Kalirai J. S., Shara M. M., Dotter A.,
Fahlman G. G., Rich R. M., 2013, ApJ, 771, L15Rossa J., van der Marel R. P., Boker T., Gerssen J., Ho L. C., Rix H.-W.,
Shields J. C., Walcher C.-J., 2006, AJ, 132, 1074Sarajedini A., Layden A. C., 1995, AJ, 109, 1086Sellwood J. A., 2008, ApJ, 679, 379Sellwood J. A., Debattista V. P., 2009, MNRAS, 398, 1279Seth A. C., Dalcanton J. J., Hodge P. W., Debattista V. P., 2006, AJ, 132,
2539Seth A. C., Blum R. D., Bastian N., Caldwell N., Debattista V. P., 2008,
ApJ, 687, 997Siegel M. H. et al., 2007, ApJ, 667, L57Siegel M. H. et al., 2011, ApJ, 743, 20Sollima A., Bellazzini M., Smart R. L., Correnti M., Pancino E., Ferraro
F. R., Romano D., 2009, MNRAS, 396, 2183Stadel J. G., 2001, PhD thesis, Univ. WashingtonTremaine S. D., Ostriker J. P., Spitzer L., Jr, 1975, ApJ, 196, 407Turner M. L., Cote P., Ferrarese L., Jordan A., Blakeslee J. P., Mei S., Peng
E. W., West M. J., 2012, ApJS, 203, 5Valluri M., Vass I. M., Kazantzidis S., Kravtsov A. V., Bohn C. L., 2007,
ApJ, 658, 731van de Ven G., van den Bosch R. C. E., Verolme E. K., de Zeeuw P. T., 2006,
A&A, 445, 513van den Bergh S., 1996, ApJ, 471, L31van der Marel R. P., Anderson J., 2010, ApJ, 710, 1063Ventura P., D’Antona F., Mazzitelli I., Gratton R., 2001, ApJ, 550, L65Vesperini E., McMillan S. L. W., D’Antona F., D’Ercole A., 2013, MNRAS,
429, 1913Walcher C. J. et al., 2005, ApJ, 618, 237Walcher C. J., Boker T., Charlot S., Ho L. C., Rix H.-W., Rossa J., Shields
J. C., van der Marel R. P., 2006, ApJ, 649, 692Watkins L. L., van der Marel R. P., Bellini A., Anderson J., 2015, ApJ, 812,
149White S. D. M., 1980, MNRAS, 191, 1P
Wrobel J. M., Greene J. E., Ho L. C., 2011, AJ, 142, 113Yong D. et al., 2014, MNRAS, 441, 3396
This paper has been typeset from a TEX/LATEX file prepared by the author.
MNRAS 466, 2895–2909 (2017)