spatial and temporal sentiment analysis of twitter data · pdf filespatial and temporal...
TRANSCRIPT
How to cite this book chapter: Song, Z and Xia, J. 2016. Spatial and Temporal Sentiment Analysis of Twitter data. In:
Capineri, C, Haklay, M, Huang, H, Antoniou, V, Kettunen, J, Ostermann, F and Purves, R. (eds.) European Handbook of Crowdsourced Geographic Information, Pp. 205–221. London: Ubiquity Press. DOI: http://dx.doi.org/10.5334/bax.p. License: CC-BY 4.0.
CHAPTER 16
Spatial and Temporal Sentiment Analysis of Twitter data
Zhiwen Song and Jianhong (Cecilia) Xia*Department of Spatial Sciences, Curtin University
Abstract
The public have used Twitter world wide for expressing opinions. This study focuses on spatio-temporal variation of georeferenced Tweets’ sentiment polar-ity, with a view to understanding how opinions evolve on Twitter over space and time and across communities of users. More specifically, the question this study tested is whether sentiment polarity on Twitter exhibits specific time−location patterns. The aim of the study is to investigate the spatial and temporal distribution of georeferenced Twitter sentiment polarity within the area of 1 km buffer around the Curtin Bentley campus boundary in Perth, Western Aus-tralia. Tweets posted in campus were assigned into six spatial zones and four time zones. A sentiment analysis was then conducted for each zone using the sentiment analyser tool in the Starlight Visual Information System software. The Feature Manipulation Engine was employed to convert non-spatial files into spatial and temporal feature class. The spatial and temporal distribution of Twitter sentiment polarity patterns over space and time was mapped using Geographic Information Systems (GIS). Some interesting results were identi-fied. For example, the highest percentage of positive Tweets occurred in the social science area, while science and engineering and dormitory areas had the highest percentage of negative postings. The number of negative Tweets
206 European Handbook of Crowdsourced Geographic Information
increases in the library and science and engineering areas as the end of the semester approaches, reaching a peak around an exam period, while the per-centage of negative Tweets drops at the end of the semester in the entertain-ment and sport and dormitory area. This study will provide some insights into understanding students and staff ’s sentiment variation on Twitter, which could be useful for university teaching and learning management.
Keywords
spatial and temporal analysis; sentiment analysis; Twitter; georeference
Introduction
Twitter as one of vital platforms for people to publically express their opinions and feelings about events and their private lives, has attracted enormous atten-tion with millions of followers (Li et al. 2013). Numerous studies have been conducted on opinion mining and sentiment analysis on Twitter (Pang & Lee 2008; Poria et al. 2014; Taboada et al. 2011; Liu 2012). The sentiment classi-fication methods have been developed from simple text mining to advanced symbol and feature recognition (Liu 2012), from a pure sentiment analysis to a sentiment and subjective analysis (Pang & Lee 2004), from machine learn-ing or lexicon-based approaches to more advanced hybrid methods (Serrano-Guerrero et al. 2015) and from sentiment orientation with only two directions (e.g. positive and negative) coarse measurement scale to a fine grained classifi-cation (Fink et al. 2011). However, limited sentiment analysis research has been conducted from a spatial and temporal perspective. This study tested a research question of whether sentiment polarity on Twitter exhibits specific time−loca-tion patterns.
The aim of this paper is to investigate the spatial and temporal distribution of georeferenced Twitter sentiment polarity within Bentley campus, Cur-tin University in Perth Western Australia. The campus was divided into six zones – science and engineering buildings, social science buildings, library, lec-ture theatre, dormitory, entertainment and parking areas and four periods of time – beginning of the semester, middle of the semester, end of semester and after examination to investigate how Twitter sentiments vary across different zones and time periods. The Starlight Visual Information System1 was used to conduct a sentiment analysis. The Feature Manipulation Engine (FME2) was employed to convert non-spatial files into spatial and temporal feature class.
1 http://starlight.pnnl.gov. 2 http://www.safe.com.
Spatial and Temporal Sentiment Analysis of Twitter data 207
The sentiment polarity patterns across six spatial zones and four temporal zones were mapped using the ArcGIS3 software.
The paper is structured as follows. Section 2 presents the research context including a review of the relevant research literature associated with methods for a Twitter sentiment analysis. The research method in Section 3 describes the overall approach taken in this research. Section 4 presents the results, and the paper concludes with a discussion of key findings and implications of our observations on different Twitter topics in Section 5.
Related work
Sentiment analysis is the Natural Language Processing work, which involves opinion detection and classification of attitudes in texts (Balahur et al. 2014). Numerous studies have been conducted for automatically detecting opinions and emotions. This section summarised these studies into two categories.
Sentiment classification trends
The early studies of sentiment classification are mostly based on text mining techniques. Opinion was classified into positive/negative or positive/negative/neutral. It can be simple two, five or even eleven point scale depending on the complexity of a task (Taboada et al. 2011; Pang & Lee 2008; Pang & Lee 2004; Whitelaw et al. 2005). Human language tends to be subjective. The same sen-tence in different tones or contexts could in different emotional states. It creates a great challenge to identify the affective state or intended emotional commu-nication (Sarvabhotla et al. 2011; Pang & Lee 2004; Wilson et al. 2005). There-fore, subjectivity analysis can go beyond simple category of positive, negative or neutral (Liu 2012). Some studies focus on detecting ironic and sarcastic con-tent of texts. However, there is a huge debate of how to formally define irony and sarcasm, which add another dimension of subjectivity analysis (Reyes & Rosso 2012). Except extracting polarity of a given text, more fine-grained methods have been developed to detect emotion or opinions from symbols, such as emoticons (e.g. ‘ ’, ‘ ’) (Read 2005; Go et al. 2009) and visual features or images (Liu 2012). This progression of the studies has taken the sentiment analysis research to a new level.
Classification methods
In order to perform different sentiment classification tasks, various sentiment algorithms were developed (Medhat et al. 2014; Serrano-Guerrero et al. 2015).
3 http://www.esri.com/software/arcgis.
208 European Handbook of Crowdsourced Geographic Information
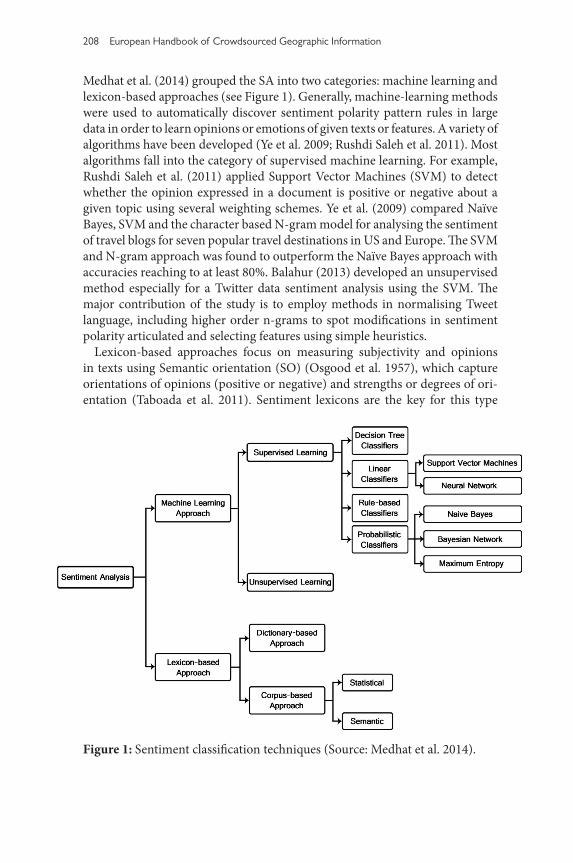
Medhat et al. (2014) grouped the SA into two categories: machine learning and lexicon-based approaches (see Figure 1). Generally, machine-learning methods were used to automatically discover sentiment polarity pattern rules in large data in order to learn opinions or emotions of given texts or features. A variety of algorithms have been developed (Ye et al. 2009; Rushdi Saleh et al. 2011). Most algorithms fall into the category of supervised machine learning. For example, Rushdi Saleh et al. (2011) applied Support Vector Machines (SVM) to detect whether the opinion expressed in a document is positive or negative about a given topic using several weighting schemes. Ye et al. (2009) compared Naïve Bayes, SVM and the character based N-gram model for analysing the sentiment of travel blogs for seven popular travel destinations in US and Europe. The SVM and N-gram approach was found to outperform the Naïve Bayes approach with accuracies reaching to at least 80%. Balahur (2013) developed an unsupervised method especially for a Twitter data sentiment analysis using the SVM. The major contribution of the study is to employ methods in normalising Tweet language, including higher order n-grams to spot modifications in sentiment polarity articulated and selecting features using simple heuristics.
Lexicon-based approaches focus on measuring subjectivity and opinions in texts using Semantic orientation (SO) (Osgood et al. 1957), which capture orientations of opinions (positive or negative) and strengths or degrees of ori-entation (Taboada et al. 2011). Sentiment lexicons are the key for this type
Figure 1: Sentiment classification techniques (Source: Medhat et al. 2014).

Spatial and Temporal Sentiment Analysis of Twitter data 209
of methods. For example, Paltoglou and Thelwall (2012) proposed a lexicon-based approach to identify whether a text conveys negative or positive attitudes and to estimate the level of emotional intensity of a text in social media and microblogging environments. They added extensive linguistically function-alities (negation/capitalization detection, intensifier/diminisher detection and emoticon/exclamation detection) to the traditional classifiers such as Support Vector Machines (SVM), Maximum Entropy classifier and Naive Bayes clas-sifiers. Khan et al. (2014) utilised a hybrid system framework, which contains unsupervised learning algorithms and a dictionary-based method named Twitter Opinion Mining Framework (TOM). This method applied a variety of techniques for Twitter analysis and classification including a hybrid scheme of Enhanced Emoticon Classifier (EEC), SentiWordNet Classifier (SWNC) and an improved polarity classifier (IPC) using a list of positive/negative words. The findings reveal that the proposed algorithm resolved previous technical issues and increased the classification accuracy, effectively reduced the number of classified neutrals. Dacres et al. (2013) conducted a topic analysis and sen-timental analysis in understanding the contents of Tweets and trends posted over a 10-day period using machine learning and natural language processing techniques. The researchers examined and compared the commenly-used Data Science Toolkit’s text2sentiment4, which is based on different methods, such as sentiment lexicon (Nielsen 2011), the lexicon-based but data-driven hybrid SentiStrength (Thelwall et al. 2012), and Charrerbox’s Sentimental API (Purver & Battersby 2012). In Dacres et al. (2013) analysis, best result was achieved by the machine learning method (Charrerbox’s Sentimental API) with 84% accu-racy. In our study, we have also adopted a machine learning method using Sub-space Transformation (TRUST) engine in Starlight for vector space modelling and supervised learning for a sentiment analysis.
Methods
Study area and data collection methods
Study Area
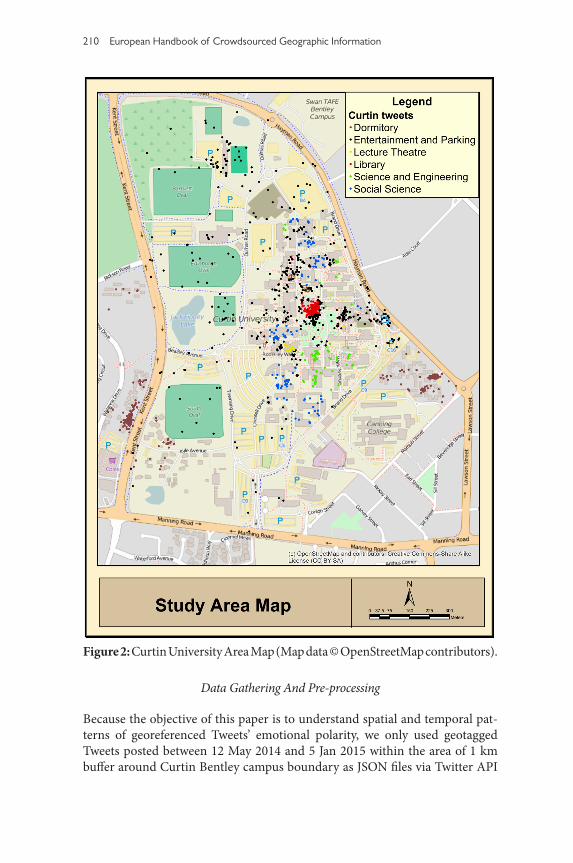
The developed content analysis methods were implemented using Tweets within the area of 1 km buffer around Curtin Bentley campus boundary (see Figure 2). Curtin University is one of the largest universities in Australia. It has more 60,000 students enrolled each year (OFFICE OF STRATEGY AND PLANNING 2014). The Bentley campus, as the main campus of Curtin University, is located about six km southeast from the Perth CBD. It covers 116 hectares with a variety of facilities, such as a library, lecture theatres, teaching rooms, cafés, dormitories and parking areas (Curtin University 2015).
210 European Handbook of Crowdsourced Geographic Information
Data Gathering And Pre-processing
Because the objective of this paper is to understand spatial and temporal pat-terns of georeferenced Tweets’ emotional polarity, we only used geotagged Tweets posted between 12 May 2014 and 5 Jan 2015 within the area of 1 km buffer around Curtin Bentley campus boundary as JSON files via Twitter API
Figure 2: Curtin University Area Map (Map data © OpenStreetMap contributors).

Spatial and Temporal Sentiment Analysis of Twitter data 211
and converted to XML format using the Ruby built-in JSON library. More than 5,000 Tweets were downloaded from Twitter API during the study period but around one third of them were located outside the Curtin University boundary. After removing the ones outside Curtin University boundary, there were a total of 3,172 Tweets gathered. These XML files of Tweets consist of both geo-location information and attribute information such as text of Tweets, time created at and geolocation, which are directly relevant to our research. Tweets of non-English languages were removed for this study in order to simplify the analysis, leaving 3,097 Tweets in the dataset. In our study, location associated with each Tweet is in the format of (x, y) coordinates, which were automatically captured using built-in Global Positioning System (GPS) receivers in mobile or tablet applica-tions, such as a smart phone. This is the exact location where a user Tweeted. The accuracy of location recorded by GPS is usually around a few meters. How-ever, if the location captured by triangulation outside a cellular network, the accuracy can range between 30-3000 m, subjecting to the cell distribution (Li et al., 2013). These geotagged Twitter data were imported into a geodatabase using GIS software, such as, FME and ArcGIS, as point features, Curtin Build-ings and boundary geography files were extracted from Open Street Map4 and converted into the same geodatabase using the ArcGIS software.
Sentiment analysis methods
There are three levels of sentimental analysis –1) document level sentiment classification; 2) sentence level sentiment classification; and 3) aspect level sen-timent analysis (Liu 2012). This research chose the sentence level sentiment classification. The sentence level sentiment classification is suitable because of its assumption that each sentence contains only one entity or one aspect of entity in many cases (Liu 2012). Each Tweet has a limitation of 140 characters in order to ensure that information posted on Twitter is straight forward to the theme. As a result, it is more suitable to perform a sentence level senti-ment analysis on Tweets. This study carried out a sentiment analysis by using the Starlight’s Sentiment Analyzer function in Starlight Data Engineer (SDE), which adopted the Boeing Text Representation using Subspace Transformation (TRUST) engine for vector space modelling and text summarisation (Simoff et al. 2008). The input for Sentiment Analyzer is XML files. Sentiment Ana-lyzer analyses individual words of a Tweet and calculates a score of sentiment orientation. It returns statistics from the sentiment analysis, such as, senti-mentTotal, sentimentDiff, sentimentScore, wordCount, sentimentNegative, sentimentPositive. In this study, sentimentDiff is the sentiment orientation of Tweets. SentimentDiff is the result of sentimentPositive subtracting sentiment-Negative (Liu 2012). If sentimentDiff is positive number, it means this text hold
4 http://www.openstreetmap.org
212 European Handbook of Crowdsourced Geographic Information
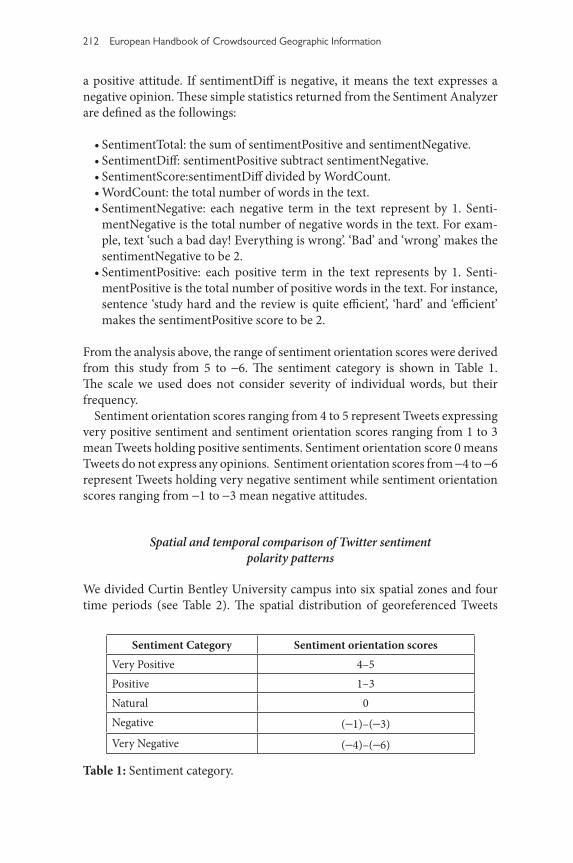
a positive attitude. If sentimentDiff is negative, it means the text expresses a negative opinion. These simple statistics returned from the Sentiment Analyzer are defined as the followings:
• SentimentTotal: the sum of sentimentPositive and sentimentNegative.• SentimentDiff: sentimentPositive subtract sentimentNegative.• SentimentScore:sentimentDiff divided by WordCount.• WordCount: the total number of words in the text.• SentimentNegative: each negative term in the text represent by 1. Senti-
mentNegative is the total number of negative words in the text. For exam-ple, text ‘such a bad day! Everything is wrong’. ‘Bad’ and ‘wrong’ makes the sentimentNegative to be 2.
• SentimentPositive: each positive term in the text represents by 1. Senti-mentPositive is the total number of positive words in the text. For instance, sentence ‘study hard and the review is quite efficient’, ‘hard’ and ‘efficient’ makes the sentimentPositive score to be 2.
From the analysis above, the range of sentiment orientation scores were derived from this study from 5 to -6. The sentiment category is shown in Table 1. The scale we used does not consider severity of individual words, but their frequency.
Sentiment orientation scores ranging from 4 to 5 represent Tweets expressing very positive sentiment and sentiment orientation scores ranging from 1 to 3 mean Tweets holding positive sentiments. Sentiment orientation score 0 means Tweets do not express any opinions. Sentiment orientation scores from -4 to -6 represent Tweets holding very negative sentiment while sentiment orientation scores ranging from -1 to -3 mean negative attitudes.
Spatial and temporal comparison of Twitter sentiment polarity patterns
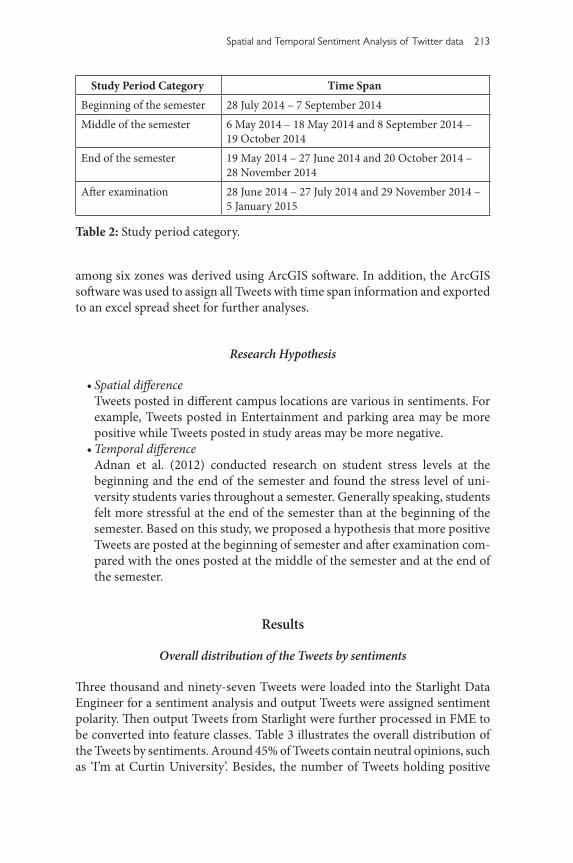
We divided Curtin Bentley University campus into six spatial zones and four time periods (see Table 2). The spatial distribution of georeferenced Tweets
Sentiment Category Sentiment orientation scoresVery Positive 4–5Positive 1–3Natural 0Negative (-1)–(-3)Very Negative (-4)–(-6)
Table 1: Sentiment category.
Spatial and Temporal Sentiment Analysis of Twitter data 213
among six zones was derived using ArcGIS software. In addition, the ArcGIS software was used to assign all Tweets with time span information and exported to an excel spread sheet for further analyses.
Research Hypothesis
• Spatial differenceTweets posted in different campus locations are various in sentiments. For example, Tweets posted in Entertainment and parking area may be more positive while Tweets posted in study areas may be more negative.
• Temporal differenceAdnan et al. (2012) conducted research on student stress levels at the beginning and the end of the semester and found the stress level of uni-versity students varies throughout a semester. Generally speaking, students felt more stressful at the end of the semester than at the beginning of the semester. Based on this study, we proposed a hypothesis that more positive Tweets are posted at the beginning of semester and after examination com-pared with the ones posted at the middle of the semester and at the end of the semester.
Results
Overall distribution of the Tweets by sentiments
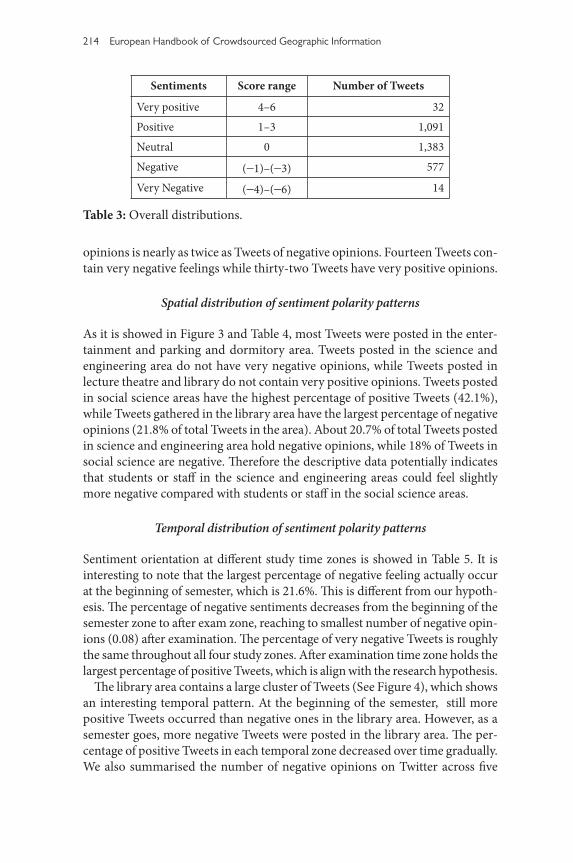
Three thousand and ninety-seven Tweets were loaded into the Starlight Data Engineer for a sentiment analysis and output Tweets were assigned sentiment polarity. Then output Tweets from Starlight were further processed in FME to be converted into feature classes. Table 3 illustrates the overall distribution of the Tweets by sentiments. Around 45% of Tweets contain neutral opinions, such as ‘I’m at Curtin University’. Besides, the number of Tweets holding positive
Study Period Category Time SpanBeginning of the semester 28 July 2014 – 7 September 2014Middle of the semester 6 May 2014 – 18 May 2014 and 8 September 2014 –
19 October 2014End of the semester 19 May 2014 – 27 June 2014 and 20 October 2014 –
28 November 2014After examination 28 June 2014 – 27 July 2014 and 29 November 2014 –
5 January 2015
Table 2: Study period category.
214 European Handbook of Crowdsourced Geographic Information
opinions is nearly as twice as Tweets of negative opinions. Fourteen Tweets con-tain very negative feelings while thirty-two Tweets have very positive opinions.
Spatial distribution of sentiment polarity patterns
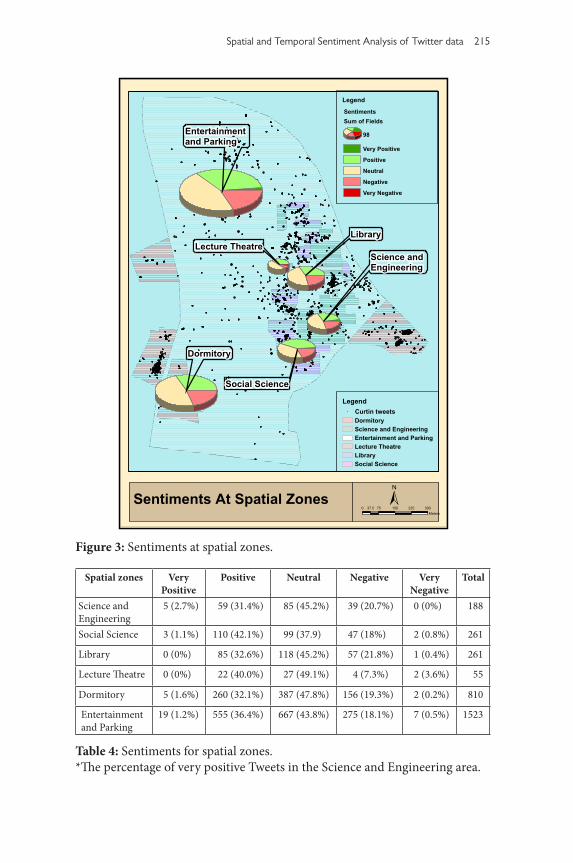
As it is showed in Figure 3 and Table 4, most Tweets were posted in the enter-tainment and parking and dormitory area. Tweets posted in the science and engineering area do not have very negative opinions, while Tweets posted in lecture theatre and library do not contain very positive opinions. Tweets posted in social science areas have the highest percentage of positive Tweets (42.1%), while Tweets gathered in the library area have the largest percentage of negative opinions (21.8% of total Tweets in the area). About 20.7% of total Tweets posted in science and engineering area hold negative opinions, while 18% of Tweets in social science are negative. Therefore the descriptive data potentially indicates that students or staff in the science and engineering areas could feel slightly more negative compared with students or staff in the social science areas.
Temporal distribution of sentiment polarity patterns
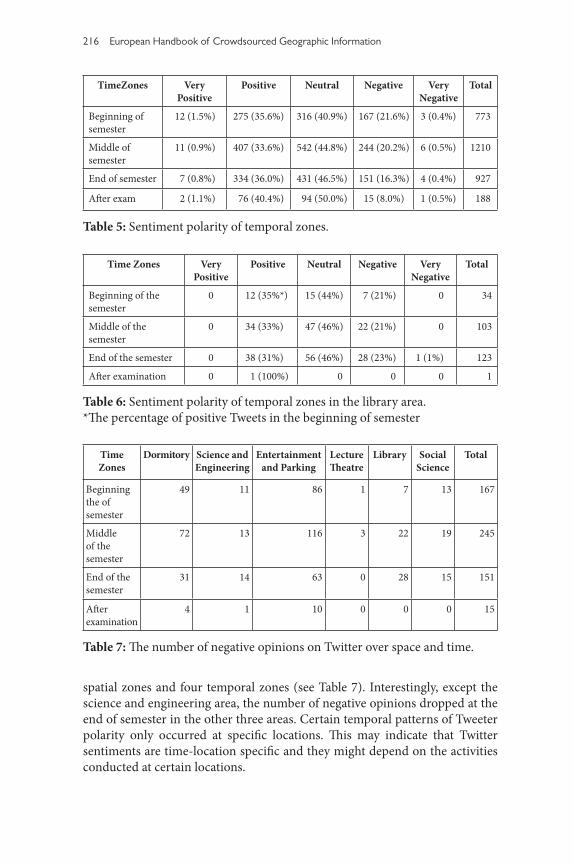
Sentiment orientation at different study time zones is showed in Table 5. It is interesting to note that the largest percentage of negative feeling actually occur at the beginning of semester, which is 21.6%. This is different from our hypoth-esis. The percentage of negative sentiments decreases from the beginning of the semester zone to after exam zone, reaching to smallest number of negative opin-ions (0.08) after examination. The percentage of very negative Tweets is roughly the same throughout all four study zones. After examination time zone holds the largest percentage of positive Tweets, which is align with the research hypothesis.
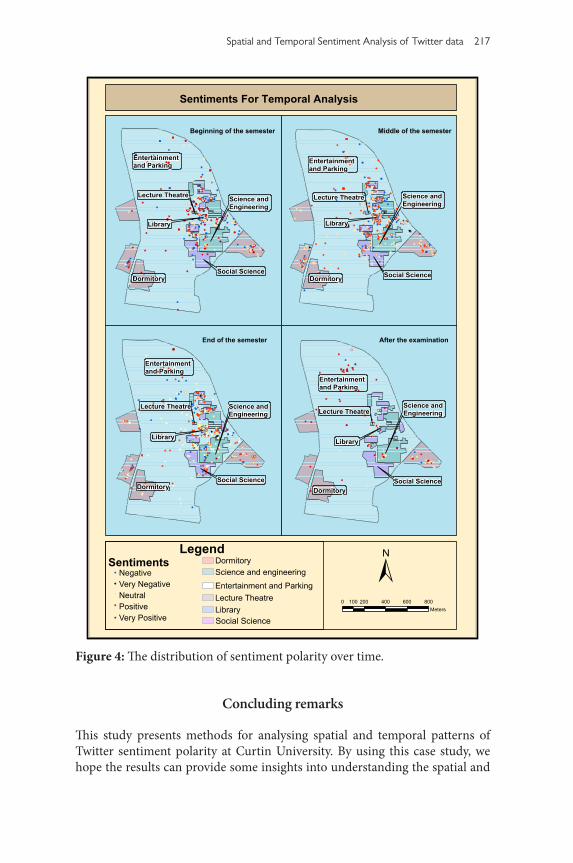
The library area contains a large cluster of Tweets (See Figure 4), which shows an interesting temporal pattern. At the beginning of the semester, still more positive Tweets occurred than negative ones in the library area. However, as a semester goes, more negative Tweets were posted in the library area. The per-centage of positive Tweets in each temporal zone decreased over time gradually. We also summarised the number of negative opinions on Twitter across five
Sentiments Score range Number of Tweets
Very positive 4–6 32
Positive 1–3 1,091
Neutral 0 1,383
Negative (-1)–(-3) 577
Very Negative (-4)–(-6) 14
Table 3: Overall distributions.
Spatial and Temporal Sentiment Analysis of Twitter data 215
Figure 3: Sentiments at spatial zones.
Sentiments At Spatial Zones0 75 150 225 30037.5
Meters
Entertainment and Parking
Social Science
Science and Engineering
Dormitory
Lecture TheatreLibrary
±
Legend
Dormitory
Entertainment and ParkingLecture TheatreLibrarySocial Science
Science and Engineering
Curtin tweets
Legend
SentimentsSum of Fields
98
Positive
Neutral
Negative
Very Negative
Very Positive
Spatial zones Very Positive
Positive Neutral Negative Very Negative
Total
Science and Engineering
5 (2.7%) 59 (31.4%) 85 (45.2%) 39 (20.7%) 0 (0%) 188
Social Science 3 (1.1%) 110 (42.1%) 99 (37.9) 47 (18%) 2 (0.8%) 261
Library 0 (0%) 85 (32.6%) 118 (45.2%) 57 (21.8%) 1 (0.4%) 261
Lecture Theatre 0 (0%) 22 (40.0%) 27 (49.1%) 4 (7.3%) 2 (3.6%) 55
Dormitory 5 (1.6%) 260 (32.1%) 387 (47.8%) 156 (19.3%) 2 (0.2%) 810
Entertainment and Parking
19 (1.2%) 555 (36.4%) 667 (43.8%) 275 (18.1%) 7 (0.5%) 1523
Table 4: Sentiments for spatial zones.*The percentage of very positive Tweets in the Science and Engineering area.
216 European Handbook of Crowdsourced Geographic Information
TimeZones Very Positive
Positive Neutral Negative Very Negative
Total
Beginning of semester
12 (1.5%) 275 (35.6%) 316 (40.9%) 167 (21.6%) 3 (0.4%) 773
Middle of semester
11 (0.9%) 407 (33.6%) 542 (44.8%) 244 (20.2%) 6 (0.5%) 1210
End of semester 7 (0.8%) 334 (36.0%) 431 (46.5%) 151 (16.3%) 4 (0.4%) 927
After exam 2 (1.1%) 76 (40.4%) 94 (50.0%) 15 (8.0%) 1 (0.5%) 188
Table 5: Sentiment polarity of temporal zones.
Time Zones
Dormitory Science and Engineering
Entertainment and Parking
Lecture Theatre
Library Social Science
Total
Beginning the of semester
49 11 86 1 7 13 167
Middle of the semester
72 13 116 3 22 19 245
End of the semester
31 14 63 0 28 15 151
After examination
4 1 10 0 0 0 15
Table 7: The number of negative opinions on Twitter over space and time.
Time Zones Very Positive
Positive Neutral Negative Very Negative
Total
Beginning of the semester
0 12 (35%*) 15 (44%) 7 (21%) 0 34
Middle of the semester
0 34 (33%) 47 (46%) 22 (21%) 0 103
End of the semester 0 38 (31%) 56 (46%) 28 (23%) 1 (1%) 123
After examination 0 1 (100%) 0 0 0 1
Table 6: Sentiment polarity of temporal zones in the library area.*The percentage of positive Tweets in the beginning of semester
spatial zones and four temporal zones (see Table 7). Interestingly, except the science and engineering area, the number of negative opinions dropped at the end of semester in the other three areas. Certain temporal patterns of Tweeter polarity only occurred at specific locations. This may indicate that Twitter sentiments are time-location specific and they might depend on the activities conducted at certain locations.
Spatial and Temporal Sentiment Analysis of Twitter data 217
Figure 4: The distribution of sentiment polarity over time.
Sentiments For Temporal Analysis
Entertainment and Parking
Social Science
Science and Engineering
Dormitory
Lecture Theatre
Library
Entertainment and Parking
Social Science
Science and Engineering
Dormitory
Lecture Theatre
Library
Entertainment and Parking
Social Science
Science and Engineering
Dormitory
Lecture Theatre
Library
Entertainment and Parking
Social Science
Science and Engineering
Dormitory
Lecture Theatre
Library
±0 200 400 600 800100
Meters
Beginning of the semester Middle of the semester
End of the semester After the examination
LegendSentiments Dormitory
Science and engineeringEntertainment and ParkingLecture TheatreLibrarySocial Science
NegativeVery NegativeNeutralPositiveVery Positive
Concluding remarks
This study presents methods for analysing spatial and temporal patterns of Twitter sentiment polarity at Curtin University. By using this case study, we hope the results can provide some insights into understanding the spatial and
218 European Handbook of Crowdsourced Geographic Information
temporal variation of students and staff ’s sentiment polarity. We separated Tweets into five different spatial zones and four time zones and tested a research question of whether sentiment polarity on Twitter exhibits specific time-loca-tion patterns.
Interestingly, although the number of positive Tweets posted in the enter-tainment and parking area were larger than the ones posted in the study areas, the highest percentage of positive Tweets were found in social science with over 40%. Besides, science and engineering and dormitory areas had the highest percentage of negative postings (both over 19%). It indicates that the sample of students in social science students tended to post twitter messages contain-ing a higher ratio of positive-to-negative words than the sample of students in science and engineering in Curtin university. In addition, a trend of increasing number of negative Tweets was identified in library and science and engineer-ing areas as a semester goes from the beginning to the end, reaching a peak around the exam period. While for the entertainment, sport and dormitory area, the percentage of negative Tweets dropped at the end of semester. This could mean that negative feelings might be associated with exam induced stress and study workload (Adnan et al. 2012).
The spatial and temporal sentiment analysis used geotagged Twitter data, which allow a sentiment polarity analysis at a fine-grained level. This method can be applied in many areas, such as polls (Wang et al. 2012a), consumer opinions concerning brands (Jansen et al. 2009), stock market performance (Bollen et al. 2011), crime prediction (Wang et al. 2012b) and tourism infor-mation (Shimada et al. 2011). However, there are a few limitations to be con-sidered when making conclusions from this study. For example, outputs from the sentiment analysis in Starlight Data engineer are not perfectly accurate. For example, emotion tokens cannot be analysed in the sentiment analysis. Some emotion tokens, such as ‘ ’ and ‘ ’, actually express very obvious attitudes. But our methods in the sentiment analysis cannot process them. Besides, our sentiment analysis methods cannot handle sarcasm properly. For example, a Tweet of ‘Well done. You have forgotten your umbrella’ expresses a negative feeling, but the sentiment analysis misclassified it as positive. Some Tweets do not have sentiment words but they imply some emotions, which the sentiment analysis could misclassify them. For instance, ‘Sleeping pattern is sooo screwed up, no more 4am’ appears to be a negative sentiment, but the sentiment analy-sis classified it as neutral. In the future, this study will adopt more advanced algorithms, such as methods developed by Liu (2012), Katz et al. (2015) and Poria et al. (2014) for the sentiment analysis. In addition, in this study, we tested our hypotheses in only one university. We will collect Twitter data of major universities in Western Australia and conduct a comparison study in the future. In addition, we will develop a better measure of sentiment polarity, which will take both severity and frequency of individual words into account in the future.
Spatial and Temporal Sentiment Analysis of Twitter data 219
Acknowledgements
The authors are very grateful to Curtin University who provides a research grant to support this study. Constructive comments from the editor and anon-ymous reviewers have significantly improved this paper. We would also like to thank Dr Wei Liu to share Twitter data with the research team, The views expressed in this article are those of the authors, and do not necessarily reflect the policies of any organisation.
References
Adnan, N., Murat, Z. H., Abdul Kadir, R. S. S., & Noradibah Hj Mohamad, Y. 2012. University students stress level and brainwave balancing index: Com-parison between early and end of study semester. Research and Develop-ment (SCOReD), 2012 IEEE Student Conference, 5–6 Dec., 2012. Pulau Pinang, pp. 42–47.
Balahur, A. 2013. Sentiment analysis in social media texts. Citeseer.Balahur, A., Mihalcea, R., & Montoyo, A. 2014. Computational approaches to
subjectivity and sentiment analysis: Present and envisaged methods and applications. Computer Speech & Language, 28: 1–6.
Bollen, J., Mao, H., & Zeng, X. 2011. Twitter mood predicts the stock market. Journal of Computational Science, 2: 1–8.
Curtin University. 2015. About [Online]. Available at: http://about.curtin.edu.au/campus-locations/directions/ [Accessed March 26 2015].
Dacres, S., Haddadi, H., & Purver, M. 2013. Topic and Sentiment Analysis on OSNs: a Case Study of Advertising Strategies on Twitter.
Fink, C. R., Chou, D. S., Kopecky, J. J., & Llorens, A. J. 2011. Coarse- and Fine-Grained Sentiment Analysis of Social Media Text. Johns Hopkins APL Tech-nical Digest, 30: 22–30.
Go, A., Bhayani, R., & Huang, L. 2009. Twitter sentiment classification using distant supervision. CS224N Project Report, Stanford: 1–12.
Jansen, B. J., Zhang, M., Sobel, K., & Chowdury, A. 2009. Twitter power: Tweets as electronic word of mouth. Journal of the American Society for Information Science and Technology, 60: 2169–2188.
Katz, G., Ofek, N., & Shapira, B. 2015. ConSent: Context-based sentiment anal-ysis. Knowledge-Based Systems.
Khan, F. H., Bashir, S., & Qamar, U. 2014. TOM: Twitter opinion mining framework using hybrid classification scheme. Decision Support Systems, 57: 245–257.
Li, L., Goodchild, M. F., & Xu, B. 2013. Spatial, temporal, and socioeconomic patterns in the use of Twitter and Flickr. cartography and geographic infor-mation science, 40: 61–77.
220 European Handbook of Crowdsourced Geographic Information
Liu, B. 2012. Sentiment Analysis and Opinion Mining. San Rafael: Morgan & Claypool Publishers.
Medhat, W., Hassan, A., & Korashy, H. 2014. Sentiment analysis algorithms and applications: A survey. Ain Shams Engineering Journal, 5: 1093–1113.
Nielsen, F. Å. 2011. A new ANEW: Evaluation of a word list for sentiment anal-ysis in microblogs.
Office of Strategy and Planning. 2014. Curtin University Student Statistics 2009–2013 [Online]. Available at: https://planning.curtin.edu.au/stats/stu-dents2009-2013.cfm [Accessed March 26 2015].
Osgood, C. E., Suci, G., & Tannenbaum, P. 1957. The measurement of meaning, 81.Paltoglou, G., & Thelwall, M. 2012. Twitter, MySpace, Digg: Unsupervised sen-
timent analysis in social media. ACM Transactions on Intelligent Systems and Technology, 3.
Pang, B., & Lee, L. 2004. A sentimental education: Sentiment analysis using subjectivity summarization based on minimum cuts. In: Proceedings of the 42nd annual meeting on Association for Computational Linguistics, 2004. Association for Computational Linguistics, p. 271.
Pang, B., & Lee, L. 2008. Opinion mining and sentiment analysis. Foundations and trends in information retrieval, 2: 1–135.
Poria, S., Gelbukh, A., Cambria, E., Hussain, A., & Huang, G.-B. 2014. EmoSen-ticSpace: A novel framework for affective common-sense reasoning. Knowl-edge-Based Systems, 69: 108–123.
Read, J. 2005. Using emoticons to reduce dependency in machine learning techniques for sentiment classification. In: Proceedings of the ACL Stu-dent Research Workshop, 2005. Association for Computational Linguistics, pp. 43–48.
Reyes, A., & Rosso, P. 2012. Making objective decisions from subjective data: Detecting irony in customer reviews. Decision Support Systems, 53: 754–760.
Rushdi Saleh, M., Martín-Valdivia, M. T., Montejo-Ráez, A., & Ureña-López, L. A. 2011. Experiments with SVM to classify opinions in different domains. Expert Systems with Applications, 38: 14799–14804.
Sarvabhotla, K., Pingali, P., & Varma, V. 2011. Sentiment classification: a lexical similarity based approach for extracting subjectivity in documents. Infor-mation Retrieval, 14: 337–353.
Serrano-Guerrero, J., Olivas, J. A., Romero, F. P., & Herrera-Viedma, E. 2015. Sentiment analysis: A review and comparative analysis of web services. Information Sciences, 311: 18–38.
Shimada, K., Inoue, S., Maeda, H., & Endo, T. 2011. Analyzing tourism informa-tion on twitter for a local city. In: Software and Network Engineering (SSNE), 2011. First ACIS International Symposium on, 2011. IEEE, pp. 61–66.
Simoff, S., Böhlen, M. H., & Mazeika, A. 2008. Visual data mining: theory, tech-niques and tools for visual analytics, Springer Science & Business Media.
Taboada, M., Brooke, J., Tofiloski, M., Voll, K., & Stede, M. 2011. Lexicon-based methods for sentiment analysis. Computational linguistics, 37: 267–307.

Spatial and Temporal Sentiment Analysis of Twitter data 221
Thelwall, M., Buckley, K., & Paltoglou, G. (2012). Sentiment strength detection for the social web. Journal of the American Society for Information Science and Technology, 63: 163–173.
Wang, H., Can, D., Kazemzadeh, A., Bar, F., & Narayanan, S. 2012a. A sys-tem for real-time twitter sentiment analysis of 2012 us presidential election cycle. In: Proceedings of the ACL 2012 System Demonstrations. Association for Computational Linguistics, pp. 115–120.
Wang, X., Gerber, M. S., & Brown, D. E. 2012b. Automatic crime prediction using events extracted from twitter posts. In: Social Computing, Behavioral-Cultural Modeling and Prediction. Springer.
Whitelaw, C., Garg, N., & Argamon, S. 2005. Using appraisal groups for senti-ment analysis. In: Proceedings of the 14th ACM international conference on Information and knowledge management, 2005. ACM, pp. 625–631.
Wilson, T., Wiebe, J., & Hoffmann, P. 2005. Recognizing contextual polarity in phrase-level sentiment analysis. In: Proceedings of the conference on human language technology and empirical methods in natural language processing, 2005. Association for Computational Linguistics, pp. 347–354.
Ye, Q., Zhang, Z., & Law, R. 2009. Sentiment classification of online reviews to travel destinations by supervised machine learning approaches. Expert Systems with Applications, 36: 6527–6535.