spatial and temporal variability of cv. tempranillo
TRANSCRIPT

OENO One 2021, 1, 349-366 349© 2021 International Viticulture and Enology Society - IVES
Received: 14 September 2020 y Accepted: 11 February 2021 y Published: 29 March 2021 DOI:10.20870/oeno-one.2021.55.1.4493
Spatial and temporal variability of cv. Tempranillo response within the Toro DO (Spain) and projected changes under climate change
María Concepción Ramos1*, Daniël T.H.C. Go1 and Santiago Castro2
1Department of Environment and Soil Sciences, University of Lleida-Agrotecnio CERCA Center, Lleida, Spain2 Consejo Regulador Toro DO, Toro, Zamora, Spain*corresponding author: [email protected]
a b s t r a c t
This work aimed to analyse the spatial and temporal variability of the response of Tempranillo variety within the Toro Designation of Origin (DO) and the potential changes under climate change scenarios. The research included the analysis of phenology (bud break, bloom, veraison and maturity) and grape composition at harvest recorded in plots located at seven locations in the DO, at elevations between 667 and 779 m above the sea level (a.s.l.). Changes in phenology and composition were projected for 2050 and 2070 under two emission scenarios (Representative Concentration Pathways RCP4.5 and RCP8.5), considering the predicted changes in climate variables using an ensemble of models. Variations in the phenological timing of up to 28 days for bud break, bloom and veraison and up to 30 days for maturity were recorded during the period analysed and titratable acidity varied between 4 and 8 gL-1. The variability in phenology and grape acidity was mainly driven by temperature and available water in different periods between phenological stages, although the effect of soil properties was also confirmed. Under warmer conditions, an advance of all phenological phases was projected (up to 6, 6, 8 and 12 days by 2050 under the RCP4.5 scenario and near double under the RCP8.5 scenario). In addition, a decrease in titratable acidity is projected (about 1.1 and 1.4 gL-1 by 2050, respectively, under the RCP4.5 and the RCP8.5 scenario and up to 2.0 gL-1 by 2070 under the warmest scenario). The results were in agreement with the variability observed in years with contrasting weather conditions.
k e y w o r d s
acidity, climate change, phenological dates, soil properties, temperature, Tempranillo, water deficit

© 2021 International Viticulture and Enology Society - IVES350 OENO One 2021, 1, 349-366
María Concepción Ramos et al.
INTRODUCTION
Within the main elements of «terroir» that condition the vine response, the climate is probably the one that has the greatest influence. Each cultivar is well adapted within a given temperature range (Jones, 2012) and under a given water status (Gómez del Campo et al., 2007). However, significant trends in increasing temperatures (IPCC, 2013) and changes in precipitation, with a more irregular distribution of the latter, have been observed during the last decades (Klein Tank and Können, 2003; Goubanova and Li, 2007; de Luis et al., 2009). Climate change will likely give rise to warmer temperatures and lower water availability during the growing cycle, which might affect the suitability of certain cultivars in a given area. Studies carried out in different viticultural areas have shown the effect of increasing temperatures on phenology and the growing cycle length (Duchêne and Schneider, 2005; Pieri et al., 2012; Webb et al., 2012; Koufos et al., 2014; Ramos and Jones, 2018; among others). The effect, however, can be different depending on the variety and for areas that have different climatic conditions. In addition, changes in grape composition have also been reported associated with changes in temperature and available water (Duchêne and Schneider, 2005; Iglesias et al., 2010; Salazar Parra et al., 2010; Bonada et al., 2015; Nistor et al., 2018; Barnuud et al., 2014; Sadras et al., 2013). Furthermore, land and crop management will be important to mitigate the effects of climate change on vines and to maintain grape quality under warmer conditions. Nevertheless, to establish the best practices, it is important to accumulate evidence of the differences in the vine response under different weather conditions that already occur.
This research focused on the Tempranillo variety. Tempranillo is the third most cultivated wine variety in the world, covering an area of about 232,000 ha and although it may be cultivated in different countries (among them, in Australia, Chile, Greece, USA and South Africa), 88 % is cultivated in Spain (OIV, 2017). This variety represents 20.8 % of the vineyard area in Spain and about 50 % of the red varieties cultivated in the country.
Within Spain, the Toro Designation of Origin (DO) is a viticultural area, with a long tradition, whose origins date back to before the settlements of the Romans, where the Tempranillo variety is the main variety (locally called “Tinta de Toro”).
The Toro area had the recognition of Designation of Origen in 1933 and the present Toro DO was approved in 1987. The Tempranillo variety in Toro DO covers about 5100 ha with an annual grape production of more than 20 million kg managed for more than 60 wineries (Consejo Regulador of Toro DO, https://www.dotoro.com). Most vineyards are cultivated under rainfed conditions and the variability of temperature and precipitation recorded in each year affects grape development and production. This variety has an early bud break and early ripening with a short growth cycle. It is sensitive to extreme drought and in warm climates can produce wines with high alcohol content and low acidity.
The objective of this research was to analyse the spatial and temporal variability of vine phenology and some grape composition parameters of the Tempranillo variety in the Toro DO related to the weather conditions recorded at present, and how could be it affected under future climate change scenarios. Predicted temperature and precipitation changes, based on an ensemble of models and under two Representative Concentration Pathways emission scenarios (RCP4.5 and RCP8.5), by 2050 and 2070, were considered in this analysis.
MATERIALS AND METHODS
1. Study area
The research was conducted in the Toro DO, which is located in Zamora province (Spain), at elevations between 620 and 790 m.a.s.l. The vineyards cover about 8000 ha, with Tempranillo being the main variety. The vines are planted on soils formed from sand sediment, clay and calcareous conglomerates from the Pliocene, and with materials that alternate loamy and large and fine grain sand with limestone and detrytic marls formed during the Miocene. The area has an extreme dry continental climate, influenced by the Atlantic, with average annual temperatures of 12–13 °C (ranging between –11 to 37 °C) and with average annual rainfall ranging between 350–400 mm.
2. Vineyard information
Seven locations distributed throughout the DO and located at elevations between 667 and 779 m.a.s.l were considered in this analysis (Figure 1). Information from plots planted with Tempranillo, related to phenology and grape composition was evaluated (three plots at each location, 21 plots in total).

OENO One 2021, 1, 349-366 351© 2021 International Viticulture and Enology Society - IVES
In addition, to analyse the response of the vine from soils with different characteristics, grape composition from 20 additional plots in the DO were analysed (information from 41 plots in total). Most of the analysed vines (> 80 percent) were old vineyards (up to 70 years old) trained in goblet and planted on ungrafted and on 110 Richter rootstocks. The rest of the vineyards (new plantations up to 15 years old) were mainly planted on 110 Richter rootstock and trained in trellis (Royat cordon or Double cordon). The planting pattern ranged between 2.5 and 3 m between rows and between 1.5 and 1.8 m between plants, with up to 2200 plants per hectare. The goblet grapevines were pruned leaving 4–5 arms with two spurs and two-three buds per spur. In the vines trained in trellis, six spurs with two buds per spur per plant were left.
The soils of the specific plots were classified as Typic Haploxeralf, Typic Xerorthent, Aquic Xerofluvent and Calcixerollic Xerochrept (Gómez and Sotés, 2002). The soils had relatively low organic matter content (between 0.66 and 1.06 %); clay content between 14.4 and 22.9 %; sand content between 58.6 and 73.2 %; and silt content between 10.9 and 18.9 %. The maximum water storage capacity of the soils (SWC) ranged between 6.8 and 9.8 %. Soil information was obtained from a database (raster 0.5 km × 0.5 km)
derived from information recorded in different soil surveys and obtained from the Instituto Tenológico Agrario de Castilla y León (ITACYL, http://suelos.itacyl.es). The location of the plots within the corresponding cartographic units (Gómez and Sotés, 2002) and the specific soil profiles for each unit were taken into account.
Phenological dates referred to bud break, bloom, veraison (stages C, I and M according to Baillod and Baggiolini, 1993) and maturity (based on the data at which a given level of total soluble solids was reached) were analysed for the period 2005–2019. The dates for bud break, bloom and veraison were based on the date at which 50 % of a sample of 20 vines in different parts of each plot had reached the phenological stage. The same criteria were applied in all plots and controlled by the same person as the Toro DO during the whole period of analysis. In addition, grape composition characteristics of total soluble solids (expressed in ºBrix) and acidity (pH, titratable acidity, malic acid and potassium) for the period 2009–2019 were evaluated in samples of 200 berries taken from the different parts of the clusters. To compare the results from the different years, the grape composition was analysed when the total soluble solids were equivalent to 24 ºBrix, which was considered as mature. The information was supplied by the Consejo Regulador of Toro DO
FIGURE 1. Location of Toro DO and plots used in this research.

© 2021 International Viticulture and Enology Society - IVES352 OENO One 2021, 1, 349-366
María Concepción Ramos et al.
and it was analysed for all plots and years according to the official OIV methods (OIV, 2004) in the Estación Enológica de Castilla y León (Rueda, Spain). The data were averaged by locations. All plots included in this research were cultivated under rainfed conditions and without soil cover. The influence of the weather conditions of phenology was analysed using a Partial Least Squares (PLS) regression analysis. The number of days with extreme temperatures [number of days with T < 0 ºC (ndT < 0)] and the accumulated temperatures (GDD) and precipitation-crop evapotranspiration (P-ETc) in different periods between phenological events were included in the analysis.
3. Weather information and climate predictions
The climatic conditions recorded during the period for which vine information was available (2005–2019) were analysed using the series recorded at the main Toro weather station (51º 21’3.53” W; 41º 30’ 36.14” N), which belongs to the network managed by the Instituto Tecnológico Agrario, Junta de Castilla y León (ITACYL). Daily temperature (maximum, minimum and mean) and precipitation recorded at the station and potential evapotranspiration (estimated according to Penman-Monteith) were analysed. Information from surrounding weather stations, located at Tordesillas (4º 59’ 50.82” W; 41º 29’19.04” N) and Villaralbo (5º 38’ 38.06” W; 41º 29’ 2.31” N), from the same meteorological network and located at a similar elevation, were used to check the homogeneity of the series and to complete the Toro series when necessary. The few gaps that existed in the Toro series were filled for precipitation using a weighted mean, taking into account the observed data in the two additional stations and the ratio between the averages in the three weather stations. For temperature, the relationship between stations was used to fill the gaps, using the data corresponding to the specific month to fill. From this information, the daily average of temperature [maximum (Tmax), minimum (Tmin) and mean (Tm)] referring to the growing season (GS: bud break to maturity) were calculated. Precipitation and evapotranspiration recorded during the growing season and in each period between phenological events were also calculated to analyse vine response to available water. The crop coefficients (Kc) with values of 0.2, 0.5 and 0.4, for Kc initial, Kc mid and Kc end, respectively, were considered in the calculation of crop evapotranspiration, with a value of
0.35 at bloom, 0.5 at veraison and 0.4 when maturity was reached. In addition, short series recorded at different weather stations located within the Toro DO belonging to Consejo Regulador of Toro were used to analyse the climate variability within the area. The relationships between the recorded temperature (maximum and minimum) and precipitation with elevation were taken into account to estimate the variability within the Toro DO and average climatic conditions at each of the considered locations.
Hourly maximum and minimum temperatures for the same period (data from the same weather station of Toro), were also analysed to evaluate the thermal requirements (chill and heat units) to reach the phenological stages. The chilling and warming periods were identified by analysing the daily chill and heat accumulations from the dormant period following the methodology described in Ramos (2017). Daily chill accumulation (in Chill Portions) was calculated according to the Dynamic Model (Fishman et al., 1987) using hourly temperature data, and heat accumulation (in Growing Degree Hours) was calculated according to Anderson et al. (1986), using a base temperature of 4 °C and an optimum temperature of 26 °C (Parker et al., 2011). The chill and heat phases were delimited taking into account the relationship between bud break dates and the means of 10 days of daily chill and heat units from 1st October (of the preceding year of recorded bud break) to 30th April, using a PLS regression. Having delimited the chill and heat phases, the thermal requirements, expressed in GDD, needed to reach each phenological stage were calculated for each year. The optimal base temperature for each period was calculated through an iterative process until reaching the temperature that minimized the standard deviation for GDD as explained in Ramos (2017).
In order to predict the vine response under future climate change scenarios, the projected changes in maximum and minimum temperature and in precipitation by 2050 and 2070, for two emission scenarios (Representative Concentration Pathways (RCP) – RCP4.5 and RCP8.5), were considered. The projections were simulated for each of the seven locations considering an ensemble of 17 models using the MarkSim™ DSSAT weather file generation for IPCC AR5 data (CMIP5) (http://gismap.ciat.cgiar.org/MarkSimGCM/docs/doc.html). The average values projected for the models were used in the analysis of the potential effects on vines. The effects of

OENO One 2021, 1, 349-366 353© 2021 International Viticulture and Enology Society - IVES
temperature and available water on grape composition were evaluated using a Partial Least Squares (PLS). Variables related to temperature (growing season Tmin and Tmax (TminGS and TmaxGS) and accumulated GDD during different periods during the growing season (bud break to bloom: BB-BL; bloom to veraison: BL-V; veraison to maturity: V-Mat; and the whole growing season: GS) as well as available water (estimated as P-ETc) during the same periods were considered in the analysis. The average values of the different variables related to acidity obtained in the three selected plots at each location were related to the climatic variables using a PLS regression. In addition, the effect of soil properties on grape composition was analysed using multivariate analysis (factor analysis, with varimax rotation to maximise the sum of the variance of the squared loadings). The statistical analysis was done using STATGRAPHICS Centurion XVI.
RESULTS
1. Weather conditions during the period under study
Figure 2 shows the average annual temperature and precipitation recorded during the period 2005–2019, for which the vine information was
available, and those related to the growing season (period between bub break and maturity, occurring on average from 20th April to 15th September). High variability was observed from year to year. However, annual maximum and minimum temperature showed an increasing trend of about 0.08 ºC year-1, with a decreasing trend in the number of frost days (T < 0 ºC) (1.7 days year-
1) and an increase in the number of days with Tmax > 30 °C (1.5 days year-1). For the growing season. TmaxGS and TminGS showed a significant increasing trend of 0.11 and 0.09 ºC year-1, respectively. According to the Winkler Index (Winkler et al., 1974) (WI = 1523 ± 129 GDD), the study area lies within Region II, although there was also a significant increasing trend in the last years (16 GDD year-1 in the period 2005–2019). The variability in maximum temperatures within the DO was relatively small (between 1.1 and 2.8 %), while for the minimum temperature the variability ranges between (6.9 and 9.1 %), depending on the years, with lower temperatures at a higher elevation.
Precipitation recorded during the hydrological year (October–September) ranged between 226 and 633 mm, indicating a high variability from year to year.
FIGURE 2. Mean annual (a) and growing season (b) maximum (TmaxGS), minimum (TminGS) and average (TavgGS) temperatures, and precipitation referring to the hydrological year (PHY - October–September) and to the growing season (PGS - bud break to maturity, on average 20th April to 15th September) (c), recorded at the Toro weather station during the period 2005–2019.
© 2021 International Viticulture and Enology Society - IVES354 OENO One 2021, 1, 349-366
María Concepción Ramos et al.
In addition, the precipitation recorded during the growing season was, on average, 30 % of that recorded in the hydrological year. The distribution of the rainfall during the growing season (PGS) was quite irregular, with more than 50 % of the rainfall, on average, recorded in the period from bud break to bloom. The ripening period (veraison to maturity) was the driest period, with less than 20 % of PGS in more than 70 % of the period analysed. Precipitation showed an increase with elevation, but due to the scarce precipitation recorded during the growing season, the differences within the area were smaller than 10 mm for precipitation recorded during the growing season. Crop evapotranspiration (ETc) during the growing season ranged between 289 and 320 mm, which gave rise to water deficits during the growing season.
2. Temporal and spatial variability of phenology in the Toro DO
During the period analysed, the dates at which the different phenological stages were reached exhibited high variability, with bud break between 10th April and 7th May; bloom over nearly the entire month of June (between 2nd and 30th), veraison between 25th July and 21st August, and maturity between 1st September and 1st October. Differences of up to one month were observed between the years. The earliest dates were observed in the driest (e.g., 2006) and the hottest years (e.g., 2017). On the other hand, the latest dates occurred in the wettest and cooler years of the analysed series (e.g., 2007, 2008, 2013 or 2018). However, there were no significant differences between the seven locations analysed over the whole period. Only, under the hottest conditions, some differences between locations were observed.
The analysis of the chill and heat units indicated that the date at which heat accumulation started was 31st March (date based on the regression analysis between bud break dates and chill units). Thus, this was the date from which temperature was accumulated to establish the base temperature to reach the bud break. That base temperature was 6.6 ºC. Then the base temperature for the following stages were estimated considering the accumulated temperatures from the previous stage, with 0, 7.5 and 7.0 °C, respectively for BB-BL, BL-V and V-Mat. The thermal requirements, expressed in GDD, needed to reach the respective stages, using these base temperatures were 109 ± 28, 782 ± 109, 1148 ± 142 and 696 ± 197 GDD, respectively.
These values were used to make projections of the phenology under climate change.
3. Influence of climate on phenology
3.1. Relationships between phenology and climate variables
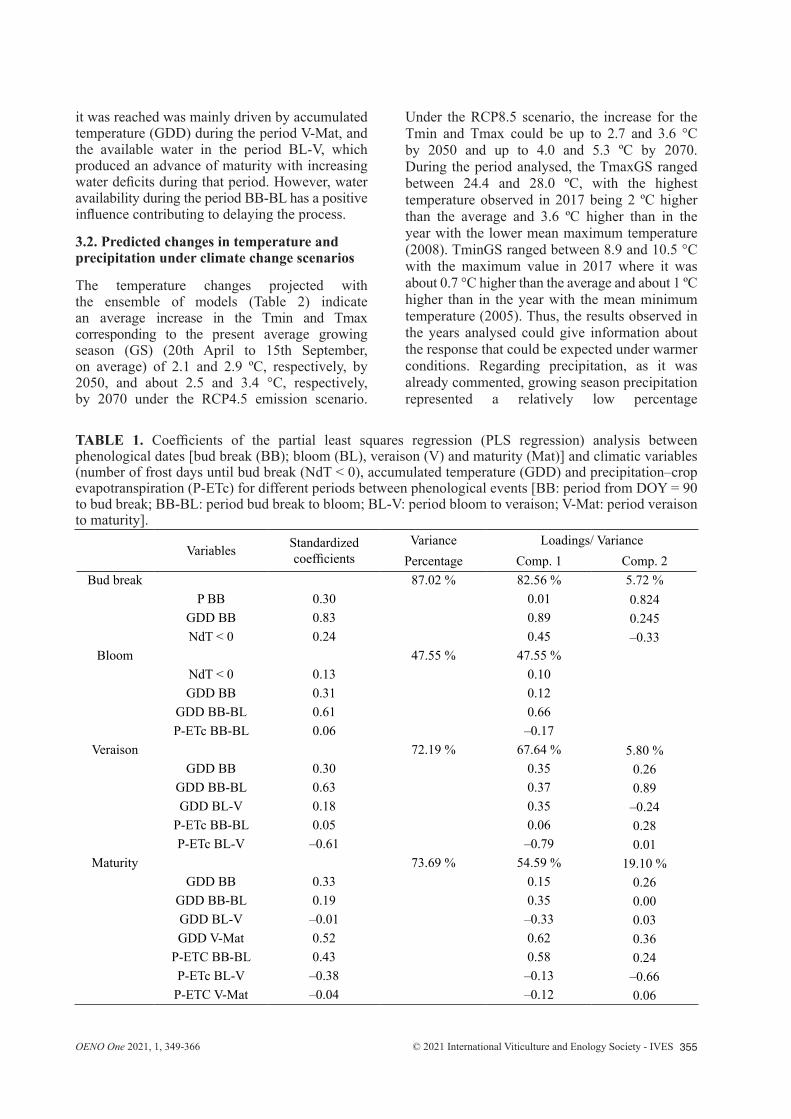
The results of the regression analysis between the phenological dates and variables related to temperature (NDT < 0 and accumulated temperatures (GDD)) and available water (accumulated P-ETc), recorded in different periods between phenological events are summarised in Table 1. Due to the low differences in phenology between plots, the analysis was done including the plots of the seven locations together. The variables shown in the table are those that were significant at 95 %.
Bud break dates were mainly driven by temperature, with the best fit with accumulated degree-days from DOY = 90, but it was also influenced by the number of frost days (days with T < 0 ºC) accumulated from DOY = 1 to bud break, which delayed bud break. The principal component that included the variables related to temperature accounted for 82.56 % of the variance. A delay of bud break under wet conditions was also observed, although the effect of water was smaller than that of the temperature (the component that included precipitation accounted for only 5.7 % of the variance).
Bloom dates were correlated with accumulated temperature (GDD) until reaching bloom. The variables that gave significant correlation were grouped in only one component, which accounted for 47.55 % of the variance. The results showed that the accumulated GDD in the period BB-BL was the variable that had a higher influence on bloom date, while the rest of the variables included in the analyses had a small effect.
Veraison was significantly correlated with the accumulated temperature (GDD) from DOY = 90 until the date at which veraison was reached, in particular with GDD during the period BB-BL. Nevertheless, the component that included these variables accounted for only about 5.8 % of the variance. On the other hand, the variable that presented a higher influence was the available water (P-ETc) during the period BL-V. This variable exhibited a higher load in the first component accounting for about 67 % of the variance. The load had a negative sign, which means an advance of veraison with increasing water deficit. Regarding maturity, the date at which
OENO One 2021, 1, 349-366 355© 2021 International Viticulture and Enology Society - IVES
it was reached was mainly driven by accumulated temperature (GDD) during the period V-Mat, and the available water in the period BL-V, which produced an advance of maturity with increasing water deficits during that period. However, water availability during the period BB-BL has a positive influence contributing to delaying the process.
3.2. Predicted changes in temperature and precipitation under climate change scenarios
The temperature changes projected with the ensemble of models (Table 2) indicate an average increase in the Tmin and Tmax corresponding to the present average growing season (GS) (20th April to 15th September, on average) of 2.1 and 2.9 ºC, respectively, by 2050, and about 2.5 and 3.4 °C, respectively, by 2070 under the RCP4.5 emission scenario.
Under the RCP8.5 scenario, the increase for the Tmin and Tmax could be up to 2.7 and 3.6 °C by 2050 and up to 4.0 and 5.3 ºC by 2070. During the period analysed, the TmaxGS ranged between 24.4 and 28.0 ºC, with the highest temperature observed in 2017 being 2 ºC higher than the average and 3.6 ºC higher than in the year with the lower mean maximum temperature (2008). TminGS ranged between 8.9 and 10.5 °C with the maximum value in 2017 where it was about 0.7 °C higher than the average and about 1 ºC higher than in the year with the mean minimum temperature (2005). Thus, the results observed in the years analysed could give information about the response that could be expected under warmer conditions. Regarding precipitation, as it was already commented, growing season precipitation represented a relatively low percentage
TABLE 1. Coefficients of the partial least squares regression (PLS regression) analysis between phenological dates [bud break (BB); bloom (BL), veraison (V) and maturity (Mat)] and climatic variables (number of frost days until bud break (NdT < 0), accumulated temperature (GDD) and precipitation–crop evapotranspiration (P-ETc) for different periods between phenological events [BB: period from DOY = 90 to bud break; BB-BL: period bud break to bloom; BL-V: period bloom to veraison; V-Mat: period veraison to maturity].
Variables Standardized coefficients
Variance Loadings/ VariancePercentage Comp. 1 Comp. 2
Bud break 87.02 % 82.56 % 5.72 %P BB 0.30 0.01 0.824
GDD BB 0.83 0.89 0.245NdT < 0 0.24 0.45 –0.33
Bloom 47.55 % 47.55 %NdT < 0 0.13 0.10GDD BB 0.31 0.12
GDD BB-BL 0.61 0.66P-ETc BB-BL 0.06 –0.17
Veraison 72.19 % 67.64 % 5.80 %GDD BB 0.30 0.35 0.26
GDD BB-BL 0.63 0.37 0.89GDD BL-V 0.18 0.35 –0.24
P-ETc BB-BL 0.05 0.06 0.28P-ETc BL-V –0.61 –0.79 0.01
Maturity 73.69 % 54.59 % 19.10 %GDD BB 0.33 0.15 0.26
GDD BB-BL 0.19 0.35 0.00GDD BL-V –0.01 –0.33 0.03GDD V-Mat 0.52 0.62 0.36
P-ETC BB-BL 0.43 0.58 0.24P-ETc BL-V –0.38 –0.13 –0.66
P-ETC V-Mat –0.04 –0.12 0.06

© 2021 International Viticulture and Enology Society - IVES356 OENO One 2021, 1, 349-366
María Concepción Ramos et al.
(about 30 %)of precipitation recorded in the hydrological year, and the predictions indicate significant reductions during the months corresponding to the growing season. Those reductions are projected to be about 30 % under the RCP4.5 scenario and higher than 50 % under the RCP8.5 scenario, which will mean an increase in the water deficit.
3.3. Projected changes in phenology under climate change scenarios
Based on the thermal requirements needed to reach each phenological stage and the predicted
maximum and minimum temperatures, an advance in all phenological dates was projected for the Tempranillo variety in the study area (Table 3). Earlier timing was projected for all phenological events but with greater advance for bloom, veraison and maturity than for bud break. Bud break is projected to undergo an advance of up to four and five days by 2050 and 2070, respectively, under the RCP4.5 scenario and up to eight days by 2070 under the warmest scenario (RCP8.5). The advance for bloom is projected to be up to six and 11 days by 2070, depending on the scenario.
TABLE 2. Predicted monthly changes in Tmax and Tmin (increase (∆) in ºC) and in precipitation (ratio Ppredicted/Ppresent (ratioP)) by 2050 and 2070 under the different analysed climate change scenarios using an ensemble of models.
TABLE 3. Average phenological dates ± standard deviation (bud break: BB; bloom: BL; veraison: V; and maturity: Mat) for Tempranillo variety in Toro DO during the period 2005–2019 (present) and average projected advance in the DO (in days; ± standard deviation) by 2050 and 2070 under the RCP4.5 and RCP8.5 emission scenarios (negative sign indicates the advance).
January February March April May June July August September October November December
2050 RCP4.5
ratio P 0.78 0.93 0.77 0.80 0.83 0.72 0.40 0.41 0.86 0.79 0.83 0.87∆Tmax 1.5 1.6 1.7 2 2.4 3 3.4 3.2 2.8 2.4 1.8 0∆Tmin 1.3 1.2 1.2 1.3 1.6 2.1 2.5 2.6 2.3 1.8 1.3 1.3
2070 RCP4.5
ratio P 0.87 0.86 0.82 0.76 0.74 0.63 0.21 0.34 0.81 0.75 0.85 0.89∆Tmax 1.8 1.9 2 2.2 2.9 3.6 4 3.8 3.4 2.8 2.1 1.8∆Tmin 1.5 1.3 1.5 1.5 1.9 2.5 3 3 2.7 2.1 1.5 1.5
2050 RCP8.5
ratio P 0.82 0.88 0.74 0.65 0.76 0.66 0.24 0.32 0.78 0.72 0.75 0.97∆Tmax 2 2.1 2.2 2.5 3 3.8 4.1 4 3.7 3.1 2.4 2∆Tmin 1.6 1.5 1.5 1.6 2 2.7 3.2 3.2 3 2.3 1.8 1.7
2070 RCP8.5
ratio P 0.72 0.91 0.65 0.48 0.61 0.46 0.15 0.07 0.69 0.58 0.67 0.84∆Tmax 2.8 2.9 3.1 3.7 4.5 5.6 6.1 5.7 5.4 4.4 3.4 2.8∆Tmin 2.3 2.3 2.2 2.4 3 4 4.7 4.7 4.5 3.4 2.7 2.4
Phenological Stages
BB BL V Matpresent 25th April ± 7 14th June ± 9 7th August ± 8 16th September ± 11
RCP 4.5 2050 –4 ± 1 –6 ± 1 –10 ± 1 –16 ± 12070 –5 ± 1 –7 ± 1 –13 ± 1 –22 ± 1
RCP 8.5 2050 –5 ± 1 –8 ± 1 –14 ± 1 –23 ± 12070 –8 ± 2 –12 ± 2 –19 ± 2 –29 ± 2

OENO One 2021, 1, 349-366 357© 2021 International Viticulture and Enology Society - IVES
Veraison is projected to be advanced by up to 13 and 19 days by 2070 while maturity could be advanced by up to 29 days, under the warmer scenario. These projections indicate not only an advance of the timing in the phenological stages, but a shortening of the growing cycle (up to 21 days between the present and the scenario corresponding to the year 2070 under the warmer conditions).
4. Variability in acidity recorded in the Toro DO within the study period.
4.1. Temporal variability: influence of the weather conditions
The variability in grape composition (titratable acidity, malic acid, pH and potassium) at maturity (24 ºBrix) during the period analysed (2009-2019) is presented in Figure 3. The titratable acidity (Figure 3a) varied between about 4 gL-1 and more than 8 gL-1. The highest acidity was recorded in the year 2013, while the lowest values were recorded in years like 2009 or 2017.
Some differences in the weather conditions recorded in those years were observed. The year 2013 was a very wet year, while 2009 and 2017 were dry and hot years. However, within those years, differences were found also between plots. For example, in 2013, there were clear differences between plots. The highest values were recorded in the plots located at higher elevations (at 745–780 m.a.s.l. compared to those located at 670–700 m.a.s.l.). Malic acid also exhibited high variability between years (Figure 3b), with values that ranged between 1 gL-1 and more than 5 gL-1 at maturity and with the highest values in the wet year (2013). Regarding pH (Figure 3c), the values varied between about 3.20 and 3.95, with the lowest values in the year 2013, accordingly with the highest acidity recorded. The differences between plots were even higher for pH than for acidity and higher under the most extreme weather conditions of very wet or very dry conditions (e.g., 2013 and 2009, respectively) or in years with high temperatures (e.g., 2017 or 2011).
FIGURE 3. Variability in the variables related to the grape composition at maturity (24 °Brix) in the study period recorded at seven locations within the Toro DO; [a) titratable acidity; b) malic acid, c) pH, d) potassium concentration].

© 2021 International Viticulture and Enology Society - IVES358 OENO One 2021, 1, 349-366
María Concepción Ramos et al.
Potassium amounts, however, did not follow similar trends compared with pH and the differences between years were higher in some plots than in other plots (Figure 3d).
The influence of temperature and available water on grape composition (titratable acidity and malic acid, pH and potassium concentration) at maturity was confirmed in the partial least squares regression analysis (Table 4). The most significant relationships with temperature variables were seen with TmaxGS. In addition, available water during different periods showed to have some influence on grape composition: available water during the period BL-V showed an influence on titratable acidity, malic acid and potassium, while water availability during the period BB-BL exhibited influence for pH and potassium. Available water during ripening, however, showed a higher
influence on pH than for the rest of the analysed variables related to composition. The percentage of the variance explained by climatic variables ranged between 35.92 and 47.44 % and two components were retained in the analysis of each variable. The first component, which accounted for the highest percentage of the variance, was mainly driven by temperature. For titratable acidity and malic acid, the variable that presented the best fit was TmaxGS with a negative value in the corresponding component, which means that increasing temperatures give rise to a decrease in titratable acidity and malic acid. The component related to temperature accounted for 39.54 % of the variance for AcT and 35.56 % for malic acid. For pH and K, the best fit was also obtained when TmaxGS was included in the analysis and this variable was included in the first component.
TABLE 4. Coefficients of the Partial least squares regression (PLS regression) analysis between the composition variables (titratable acidity (AcT); malic acid (AcM); pH and potassium (K); climatic variables (maximum growing season temperature (TmaxGS); and available water (precipitation–crop evapotranspiration: P-ETc) recorded in different periods between phenological events (bud break to bloom: BB-BL; bloom to veraison: BL-V; veraison to maturity: V-Mat).
Variables Standardized Variance Loadings
Coefficients Percentage Comp1 Comp 2
AcT 47.44 % 39.54 % 7.90 %TmaxGS –0.54 –0.85 –0.21
P-ETC BB-BL –0.05 –0.09 –0.14
P-ETc BL-V 0.27 –0.08 0.94
P-ETC V-Mat 0.30 0.52 0.23AcM 42.02 % 35.56 % 6.46 %
TmaxGS –0.44 –0.90 –0.43
P-ETC BB-BL –0.01 0.08 –0.22
P-ETc BL-V 0.14 –0.09 0.85
P-ETC V-Mat 0.21 0.42 0.19pH 38.03 % 34.56 % 3.47 %
TmaxGS 0.28 0.38 0.31
P-ETc BB_BL 0.20 0.41 0.26
P-ETc BL-V –0.08 0.06 –0.91
P-ETC V-Mat –0.31 –0.70 –0.05K 35.92 % 30.64 % 5.28 %
TmaxGS 0.37 0.73 0.58
P-ETC BB-BL –0.19 –0.52 –0.11
P-ETc BL-V –0.05 0.36 –0.77
P-ETC V-Mat –0.15 –0.28 –0.24
OENO One 2021, 1, 349-366 359© 2021 International Viticulture and Enology Society - IVES
However, for pH, that component included also the variable related to available water during the period V-Mat, which was the variable with a higher influence on pH. For both pH and K, the effect of temperature was opposite to that on acidity, with increasing pH and K with increasing temperatures. The second component grouped mainly variables related to available water, with the highest load for available water in the period BL-V. Higher water availability in than period gave rise to higher titratable acidity and malic acid and lower pH and K concentration. This second component accounted for about 7.9 % of the variance for titratable acidity and 6.5 % for malic acid, while it accounted for only about 3.5 % and 5.3 % of the variance, respectively for pH and K.
Given the predicted increase in temperature and the decrease in precipitation in the study area under future climate scenarios, as well as the relationship between those variables with grape composition, a decrease in acidity is expected for the Tempranillo cultivar in this region. The high variability in precipitation from year to year, both in total precipitation and in its distribution, makes it difficult to make predictions of changes in water availability. However, taking into account the predicted changes in precipitation, water inputs during the growing season could decrease between about 38 and 50 mm by 2050, depending on the scenario, and up to 70 mm by 2070 under the warmest scenario. Within the growing cycle, the highest decrease is projected to occur in the BL-V period (about 35% of the GS decrease). During the V-Mat period, precipitation
is already scarce at present but it could be even lower in the future with a reduction that could represent about 17 % of the total reduction that can be recorded in the growing cycle. Taking into account the projected changes in temperature and precipitation, in particular in the periods that showed to have a higher influence on composition in the Tempranillo grapes in the study area, titratable acidity could decrease by 2050 up to 1.1 and 1.4 gL-1, respectively, under the RCP4.5 and the RCP8.5 scenarios. By 2070, the decrease in acidity could be up to 2 gL-1 under the warmest scenario. For malic acid, the reduction could be up to 0.8 and 1 gL-1, respectively, under the RCP4.5 and RCP8.5 scenarios, and up to 1.4 gL-1 by 2070, under the warmest scenario.
4.2. Spatial variability: influence of soil properties and location
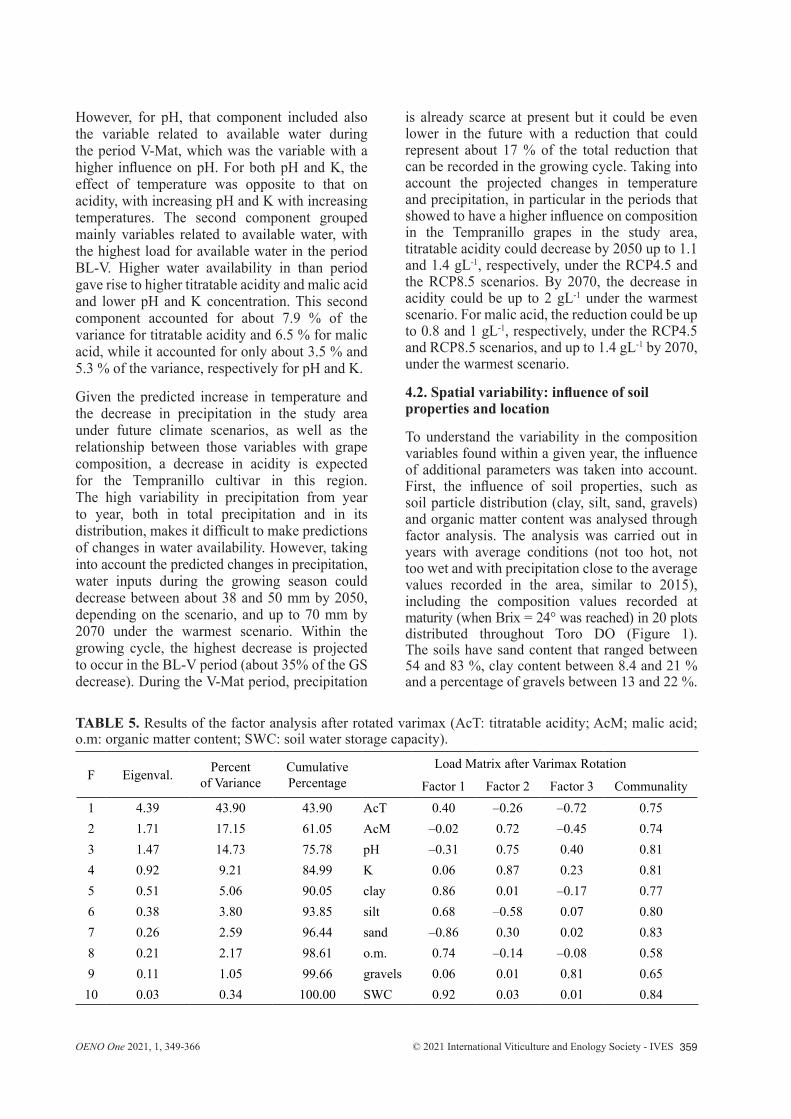
To understand the variability in the composition variables found within a given year, the influence of additional parameters was taken into account. First, the influence of soil properties, such as soil particle distribution (clay, silt, sand, gravels) and organic matter content was analysed through factor analysis. The analysis was carried out in years with average conditions (not too hot, not too wet and with precipitation close to the average values recorded in the area, similar to 2015), including the composition values recorded at maturity (when Brix = 24° was reached) in 20 plots distributed throughout Toro DO (Figure 1). The soils have sand content that ranged between 54 and 83 %, clay content between 8.4 and 21 % and a percentage of gravels between 13 and 22 %.
TABLE 5. Results of the factor analysis after rotated varimax (AcT: titratable acidity; AcM; malic acid; o.m: organic matter content; SWC: soil water storage capacity).
F Eigenval. Percent of Variance
Cumulative Percentage
Load Matrix after Varimax Rotation
Factor 1 Factor 2 Factor 3 Communality1 4.39 43.90 43.90 AcT 0.40 –0.26 –0.72 0.752 1.71 17.15 61.05 AcM –0.02 0.72 –0.45 0.743 1.47 14.73 75.78 pH –0.31 0.75 0.40 0.814 0.92 9.21 84.99 K 0.06 0.87 0.23 0.815 0.51 5.06 90.05 clay 0.86 0.01 –0.17 0.776 0.38 3.80 93.85 silt 0.68 –0.58 0.07 0.807 0.26 2.59 96.44 sand –0.86 0.30 0.02 0.838 0.21 2.17 98.61 o.m. 0.74 –0.14 –0.08 0.589 0.11 1.05 99.66 gravels 0.06 0.01 0.81 0.6510 0.03 0.34 100.00 SWC 0.92 0.03 0.01 0.84
© 2021 International Viticulture and Enology Society - IVES360 OENO One 2021, 1, 349-366
María Concepción Ramos et al.
The organic matter content was relatively low, with values that ranged between 0.65 and 1.1 %.
The results of the factor analysis are shown in Table 5. Three factors were retained, which explained 75.7 % of the variance. The first factor accounted for 43.9 % of the variance and showed the positive relationship between titratable acidity and clay, silt and organic matter content, and with the maximum water holding capacity (SWC) of the soils, while there was a negative influence of the sand content. The second factor, which accounted for 17.1 % of the variance, showed a negative correlation between malic acid, pH and K concentration and silt content. The third factor, which accounted for 14.7 % of the variance, showed a negative relationship between titratable acidity and malic acid and the content of gravels. Soil organic matter and clay content contributed to retaining water in the soils, while the sand and gravel contents favour drainage. Thus, the soils with higher water retention and higher water storage capacity produced higher acidity. These differences could help to understand the differences in acidity observed within a given year. In addition, when the data of acidity recorded in the different plots in each year was compared, it was found that titratable acidity and malic acid was higher in the plots located at a higher elevation and there was a significant correlation between their values and elevation.
DISCUSSION
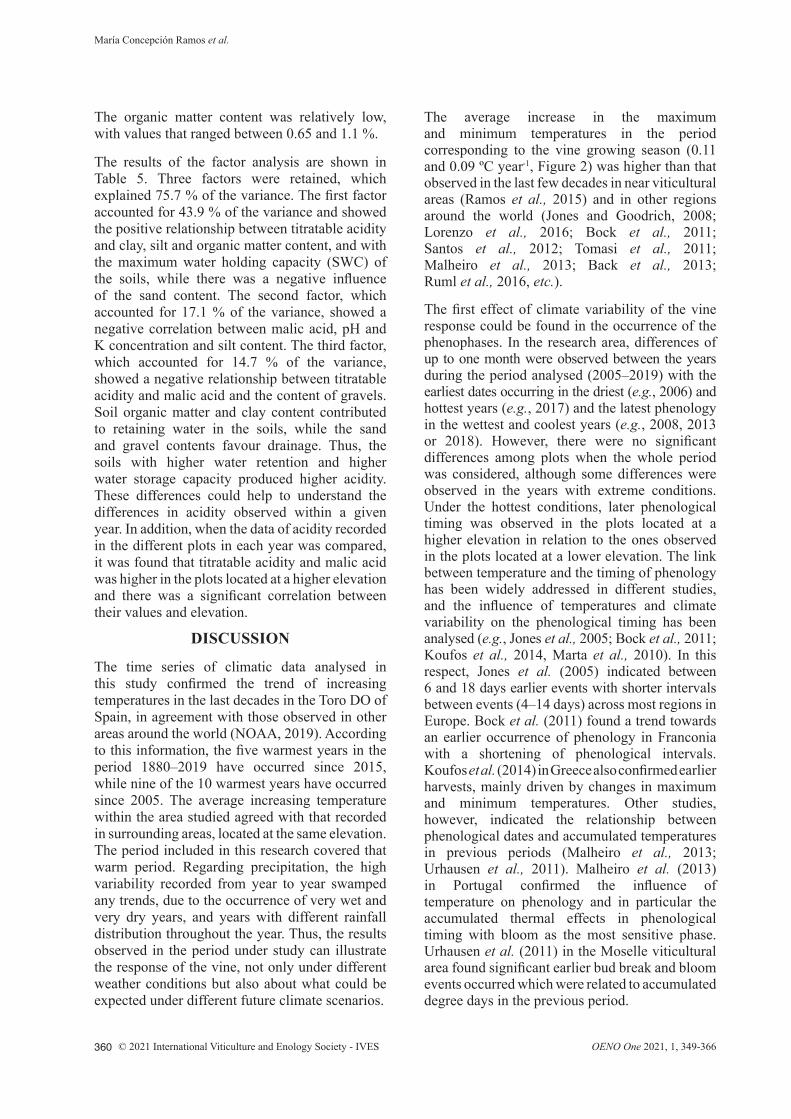
The time series of climatic data analysed in this study confirmed the trend of increasing temperatures in the last decades in the Toro DO of Spain, in agreement with those observed in other areas around the world (NOAA, 2019). According to this information, the five warmest years in the period 1880–2019 have occurred since 2015, while nine of the 10 warmest years have occurred since 2005. The average increasing temperature within the area studied agreed with that recorded in surrounding areas, located at the same elevation. The period included in this research covered that warm period. Regarding precipitation, the high variability recorded from year to year swamped any trends, due to the occurrence of very wet and very dry years, and years with different rainfall distribution throughout the year. Thus, the results observed in the period under study can illustrate the response of the vine, not only under different weather conditions but also about what could be expected under different future climate scenarios.
The average increase in the maximum and minimum temperatures in the period corresponding to the vine growing season (0.11 and 0.09 ºC year-1, Figure 2) was higher than that observed in the last few decades in near viticultural areas (Ramos et al., 2015) and in other regions around the world (Jones and Goodrich, 2008; Lorenzo et al., 2016; Bock et al., 2011; Santos et al., 2012; Tomasi et al., 2011; Malheiro et al., 2013; Back et al., 2013; Ruml et al., 2016, etc.).
The first effect of climate variability of the vine response could be found in the occurrence of the phenophases. In the research area, differences of up to one month were observed between the years during the period analysed (2005–2019) with the earliest dates occurring in the driest (e.g., 2006) and hottest years (e.g., 2017) and the latest phenology in the wettest and coolest years (e.g., 2008, 2013 or 2018). However, there were no significant differences among plots when the whole period was considered, although some differences were observed in the years with extreme conditions. Under the hottest conditions, later phenological timing was observed in the plots located at a higher elevation in relation to the ones observed in the plots located at a lower elevation. The link between temperature and the timing of phenology has been widely addressed in different studies, and the influence of temperatures and climate variability on the phenological timing has been analysed (e.g., Jones et al., 2005; Bock et al., 2011; Koufos et al., 2014, Marta et al., 2010). In this respect, Jones et al. (2005) indicated between 6 and 18 days earlier events with shorter intervals between events (4–14 days) across most regions in Europe. Bock et al. (2011) found a trend towards an earlier occurrence of phenology in Franconia with a shortening of phenological intervals. Koufos et al. (2014) in Greece also confirmed earlier harvests, mainly driven by changes in maximum and minimum temperatures. Other studies, however, indicated the relationship between phenological dates and accumulated temperatures in previous periods (Malheiro et al., 2013; Urhausen et al., 2011). Malheiro et al. (2013) in Portugal confirmed the influence of temperature on phenology and in particular the accumulated thermal effects in phenological timing with bloom as the most sensitive phase. Urhausen et al. (2011) in the Moselle viticultural area found significant earlier bud break and bloom events occurred which were related to accumulated degree days in the previous period.

OENO One 2021, 1, 349-366 361© 2021 International Viticulture and Enology Society - IVES
In this study, the accumulated degree-days between phenological phases described a large percentage of the variance of the phenological dates. However, it was also observed, that the phenological dates, in particular those of veraison and maturity, were also related to available water during the period between bloom and veraison. The results agreed with other studies for the same variety in the Ribera del Duero region (Ramos et al., 2015). The authors related veraison dates to water deficits during bloom to veraison and veraison to harvest period in that area, and the effect was more evident in the vineyards located on hillslopes than on the river terraces, where water deficits could be greater. The influence of water availability in some specific periods on phenology was also indicated for the same variety cultivated in another region in Spain, the Rioja DOCa (Ramos et al., 2020). The results are also in line with that indicated by Castellarin et al. (2007), who indicated that water deficits accelerate ripening, and the time when it occurs alters the timing of particular aspects of the ripening process. These authors indicated that water deficits before veraison accelerated sugar accumulation and the onset of anthocyanin synthesis, and both early and late water deficits increased anthocyanin accumulation after veraison.
The increase of temperature, which is predicted to occur under different emission scenarios, can give rise to a significant advance of all phenological phases (Table 3), although with differences among them. The advance appears to be higher for the later stages, thus is higher for veraison and maturity than for bud break and bloom. Maturity is projected to be advanced up to 22 days and 29 days by 2070, respectively, under the RCP4.5 and RCP8.5 scenarios. The projected advance is slightly greater than that expected for the same variety cultivated in Rioja (Ramos and Martínez de Toda, 2020) and slightly less than in Ribera de Duero (Ramos et al., 2018). The projections found in the different areas, which are at different elevations, indicated a greater advance in the cooler areas. As commented on previously, when all years were considered together in the study area, there were no significant differences between locations despite the plots being located at different elevations (between 745 and 779 m.a.s.l). However, when the dates of plots located at different elevations were compared in the hottest years of the series (like 2009, 2011 or 2017) some differences were clearly observed between plots. Differences between four and 14 days of bloom and between four and nine days for veraison were observed in those years
between the plots located at elevations between 699 and 779 m.a.s.l. Nevertheless, the final effects could be worst for the warmer areas, where at present harvesting already occurs significantly earlier (case observed in Rioja Oriental, which is warmest of the areas compared). In addition, the advance of the phenophases also resulted in a shortening of the growing cycle (up to 21 days between the present and the scenario corresponding to the year 2070 under the warmer conditions) and warmer conditions during ripening. The same effects were also confirmed in other areas for Tempranillo and other varieties (Bardin-Camparotto et al., 2014; Fraga et al., 2016; Pieri et al., 2012; Ramos et al., 2018; Salazar Parra et al., 2010).
In relation to grape quality parameters, climate and soil, both elements of the terroir components exhibited an influence on the composition, although the climate was more influential on the grape characteristics related to acidity. Both variables, temperature and precipitation, drove the differences between years. In the study area, the highest titratable acidity and malic acid were recorded in the wettest year of the series (2013), while the lowest values in almost all plots were recorded in 2012, 2016 and 2017. These years had in common very high water deficits during the period BL-V. In addition, 2016 and 2017 recorded very high maximum temperatures during the period between bloom to veraison and during ripening. It is known that grapes grown in warmer climates have lower acidity than grapes grown in cooler climates and that grape acidity decreases with increasing temperatures. In this respect, Sugiura et al. (2020) found that titratable acidity at harvest decreased when the temperatures of the previous period (40–50 days before to harvest) increased. Vršič et al. (2014) also found strong correlations between changes in temperature and fruit composition indicating trends toward higher sugar levels and lower titratable acidity with the increasing temperatures. Pastore et al. (2017) found that the high-temperature regime contributed to a titratable acidity reduction and a pH increase. Similar results indicating lower acidity with increasing temperatures have been indicated by other authors (Urhausen et al., 2011; Vršič and Vodovnik, 2012; Neumann and Matzarakis, 2014). On the other hand, available water influences acidity. In fact, Bonada et al. (2015) found additive effects between temperature and water for titratable acidity and pH while Koundouras et al. (2006) indicated that water deficit accelerated sugar accumulation and malic
© 2021 International Viticulture and Enology Society - IVES362 OENO One 2021, 1, 349-366
María Concepción Ramos et al.
acid breakdown in the juice. Leibar et al. (2017) found that water deficits decreased both malic and total acid, and van Leeuwen et al. (2009) indicated that quality was determined by the intensity of water deficit stress rather than by air temperatures. Water stress in periods before veraison induces major metabolic modifications in the berry that can be maintained even after re-watering (Shellie et al., 2014; Keller et al., 2016), while the effect of water deficits after veraison may be more variable (Intrigliolo and Castel, 2010). Regarding malic acid, Salazar Parra et al. (2010) confirmed the effect of water deficit at ripeness and the combined effect that high levels of CO2 and water deficits can have on malic acid. However, the same authors did not find significant effects on titratable acidity. The results obtained in this research indicated that available water in the period between bloom and veraison showed the greatest influence. However, the influence of available water after veraison was not significant, either for titratable acidity or for malic acid. The influence of available water on grape composition in this variety has been also indicated in other studies in the same direction (Ramos et al., 2020) and agrees with that found by other authors for other varieties. In agreement with that, Baciocco et al. (2014) indicated that differences in precipitation during the bloom period (mainly in late May–June) had a significant influence on the vintage quality.
The predicted increase in temperature and the reduction of available water in some periods during the growing season leads to a decrease in grape acidity, which be relevant for the Tempranillo variety in the Toro DO, as it is a variety with low acidity. The decrease in titratable acidity could be about 1.1 gL-1 by 2050 under the RCP4.5 scenario and up to 1.4 gL-1 under the warmest scenario. Thus, these decreases represent significant changes (about 15 and 30 % lower, on average, by 2050, respectively under the RCP4.5 and RCP8.5 scenarios). Salazar Parra et al. (2010) confirmed that malic acid concentration might decrease significantly under climate change, due to the combined effect of increasing CO2 concentrations and water deficits. Leolini et al. (2019) indicated that a progressive increase in temperatures resulted in a decreasing trend in acid content. Barnuud et al. (2014) predicted reductions in acidity by 12–15 % for Cabernet-Sauvignon and Shiraz by 2070 under high warming projections, for different areas in Australia. In the study area, for the Tempranillo variety, the decrease in acidity, with the additional effect associated with the expected ripening under warmer conditions due
to the advancing phenology, will likely represent negative impacts on grape quality.
In addition to the climate effect, the results obtained in the research already confirmed the role of soils and location on the vine response. Although there were no significant differences in phenology between plots and locations, some differences were observed in grape composition. The differences were attributed to the differences in soil characteristics, compared to phenology where soil differences were not important. Soil texture influences the soil water holding capacity and drainage (White, 2009), soil water availability (Costantini et al., 2010) and vine water stress (Bonfante et al., 2011). Bowen et al. (2005) indicated that coarse textures appear to be best suited to produce high-quality wines. van Leeuwen et al. (2019) observed differences in the ripening of Cabernet-Sauvignon in the warm gravel soils in relation to other soils with finer textures. The soils of the selected plots analysed in this research had relatively high sand and gravel contents, which confers to the soils’ good drainage conditions and deeper root penetration. The maximum water storage capacity in this study ranged between 7.0 to 10.5 %, and the effect of soil properties, such as texture and organic matter content which condition water holding capacity, on the composition of the Tempranillo variety in the study area were confirmed (Table 4). Titratable acidity was positively correlated with the clay and organic matter content and negatively correlated with the sand and gravel contents. Malic acid was also negatively affected by gravel content and was negatively affected by silt content but exhibited no correlation with clay content. Soils with high gravel content could have greater infiltration capacity, but their retention capacity is lower, while in clayey soils they may have higher retention capacity and lower drainage. This may give rise to slower ripening and acidity tends to be higher. The observed effect of gravels on acidity was in agreement with the lower titratable acidity on gravelly soils indicated by van Leeuwen (2010) and the lower malic acid in soils with high gravel content compared with the ones obtained in soil rich in clay found by Koundouras et al. (1999). Regarding the effect of texture on water availability and its impact on acidity, Leibar et al. (2017) found that water deficit reduced acidity but that effect did not occur for malic acid in the clayey soils.
This soil component effect on acidity has particular relevance for the Tempranillo cultivar, which

OENO One 2021, 1, 349-366 363© 2021 International Viticulture and Enology Society - IVES
usually has low acidity, and it could decrease in the future due to increasing temperatures.
Thus, soil characteristics could be an important factor to be considered when different strategies to mitigate the effect of climate change are necessary to be adopted. In addition, it was also confirmed that higher acidity was recorded in the plots located at a higher elevation. Planting vines at a higher elevation, in areas that could be suitable for vineyard establishment, has been commented by different authors as an alternative to maintain wine quality (Caffarra and Eccel, 2011; Hannah et al., 2013). Thus, the selection of soils with higher soil water holding capacity and areas located at higher elevation could be considered within the strategies for vineyard adaptation under warmer and drier scenarios to balance the impacts on the Tempranillo cultivar in the study area.
CONCLUSIONS
The variability of the response of the Tempranillo cultivar in Toro DO has been documented based on the observed relationship between phenology and grape composition with temperature and available water. The results show the important role that temperature has on phenological timing and indicates that projections to warmer conditions are likely to significantly advance the timing, especially for later events such as veraison and maturity. In terms of available water, the most critical period is between bloom and veraison, which affects not only veraison but also the following phases. The advance in phenology will give rise to ripening occurring under warmer conditions, which will likely affect the grape quality. The grape composition is also affected by temperature and available water, and under warmer conditions, a decrease in acidity could result, which in particular for the Tempranillo variety may be negative as it is already a variety with low acidity. The variability of acidity in relation to soil properties and elevation confirm some aspects that could be taken into account to look for suitable areas in which the potential effects from future climate changes might be smaller and therefore help to maintain grape quality in the Toro DO.
Acknowledgements: Authors thank the Consejo Regulador of Toro DO for the information related to the plots, the Instituto Tecnológico Agrario, Junta de Castilla y León (ITACYL) by the climatic information and the accessibility to the soil information used in this study.
REFERENCES Anderson, J. L., Richardson, E. A., & Kesner, C. D. (1986). Validation of chill unit and flower bud phenology models for “Montmercy” sourcherry. Acta Hortic, 184, 71–78. doi:10.17660/ActaHortic.1986.184.7Baciocco, K. A., Davis, R. E., & Jones, G. V. (2014). Climate and Bordeaux wine quality: identifying the key factors that differentiate vintages based on consensus rankings. Journal of Wine Research, 25(2), 75–90. https://doi.org/10.1080/09571264.2014.888649Back, A. J., Della Bruna, E., & Dalbó, M. A. (2013). Climate changes and grape production in Vale do Rio do Peixe, in the state of Santa Catarina | Mudanças climáticas e a produção de uva no Vale do Rio do Peixe-SC. Revista Brasileira de Fruticultura, 35(1). https://doi.org/10.1590/S0100-29452013000100019Baillod, M. & Baggiolini, M. (1993). Les stades repères de la vigne. Revue Suisse de Viticulture Arboriculture 324 Horticulture (25), 10-12.Bardin-Camparotto, L., Blain, G. C., Pedro Júnior, M. J., Hernandes, J. L., & Cia, P. (2014). Climate trends in a non-traditional high quality wine producing region. Bragantia, 73(3), 327–334. https://doi.org/10.1590/1678-4499.0127Barnuud, N.N., Zerihun, A., Mpelasoka, F., Gibberd, M., & Bates, B. (2014). Responses of grape berry anthocyanin and titratable acidity to the projected climate change across the Western Australian wine regions. International Journal of Biometeorology, 58(6), 1279–1293. https://doi.org/10.1007/s00484-013-0724-1Bock, A., Sparks, T., Estrella, N., & Menzel, A. (2011). Changes in the phenology and composition of wine from Franconia, Germany. Climate Research, 50(1), 69–81. https://doi.org/10.3354/cr01048Bonada, M., Jeffery, D. W., Petrie, P. R., Moran, M. A., & Sadras, V. O. (2015). Impact of elevated temperature and water deficit on the chemical and sensory profiles of Barossa Shiraz grapes and wines. Australian Journal of Grape and Wine Research, 21(2). https://doi.org/10.1111/ajgw.12142Bonfante, A., A. Basile, G. Langella, P. Manna, & Terribile. F. (2011). A physically oriented approach to analysis and mapping of terroirs. Geoderma 167– 168, 103–117. doi:10.1016/j.geoderma.2011.08.004Bowen, P. A., C. P. Bogdanoff, B. P. Estergaard, S. G. Marsh, K.B. Usher, C. A.S. Smith, & G. Frank. (2005). Geology and wine 10. Use of Geographic Information system technology to access viticultural performance, Okanagan and Simalkameen valleys, British Columbia. Geoscience Canada 32, 161–176.Caffarra , A., & Eccel, E. (2011) Projecting the impacts of climate change on the phenology of grapevine in a mountain area. Australian Journal of Grape and Wine Research, 17(1), 52–61. https://doi.org/10.1111/j.1755-0238.2010.00118.x

© 2021 International Viticulture and Enology Society - IVES364 OENO One 2021, 1, 349-366
María Concepción Ramos et al.
Castellarin, S. D., Matthews, M. A., Di Gaspero, G., & Gambetta, G. A. (2007). Water deficits accelerate ripening and induce changes in gene expression regulating flavonoid biosynthesis in grape berries. Planta, 227(1), 101-112. https://doi.org/10.1007/s00425-007-0598-8Costantini, E. A. C., Pellegrini, S., Bucelli, P., Barbetti, R., Campagnolo, S., Storchi, P., magini, S., & Perria, R. (2010). Mapping suitability for Sangiovese wine by means of δ13C and geophysical sensors in soils with moderate salinity. European Journal of Agronomy, 33(3), 208–217. https://doi.org/10.1016/j.eja.2010.05.007Duchêne, E., & Schneider, C. (2005). Grapevine and climatic changes: A glance at the situation in Alsace. Agronomie, 25(1), 93–99. https://doi.org/10.1051/agro:2004057Fishman, S., Erez, A., & Couvillon, G.A. (1987). The temperature dependence of dormancy breakingin plants: mathematical analysis of a two-step model involving a cooperative transition. J Theor Biol, 124, 473–483. doi:10.1016/S0022-5193 (87) 80221-7Fraga, H., Santos, J. A., Moutinho-Pereira, J., Carlos, C., Silvestre, J., Eiras-Dias, J., Mota, T., & Malheiro, A. C. (2016). Statistical modelling of grapevine phenology in Portuguese wine regions: observed trends and climate change projections. The Journal of Agricultural Science, 1–17. https://doi.org/10.1017/S0021859615000933Gómez, V., & Sotés, V. (2002). Delimitación cartográfica de zonas vitícolas en la denominación de origen Toro. Oficina de Transferencia de Tecnología. Escuela Técnica Superior de Ingenieros Agrónomos de la Universidad Politecnica de Madrid.Gómez del Campo, M., Baeza, P., Ruiz, C., Sotés, V., & Lissarrague, J. R. (2007). Effect of previous water conditions on vine response to rewatering. Vitis - Journal of Grapevine Research, 46(2), 51–55. https://doi.org/10.5073/vitis.2007.46.51-55 Goubanova, K., & Li, L. (2007). Extremes in temperature and precipitation around the Mediterranean basin in an ensemble of future climate scenario simulations. Global and Planetary Change, 57(1–2), 27–42. https://doi.org/10.1016/j.gloplacha.2006.11.012Hannah, L., Roehrdanz, P. R., Ikegami, M., Shepard, A. V, Shaw, M. R., Tabor, G., Zhi, L., Marquet, A., & Hijmans, R. J. (2013). Climate change, wine, and conservation. Proceedings of the National Academy of Sciences of the United States of America, 110(17), 6907–6912. https://doi.org/10.1073/pnas.1210127110Iglesias, A., Quiroga, S., & Schlickenrieder, J. (2010). Climate change and agricultural adaptation: Assessing management uncertainty for four crop types in Spain. Climate Research, 44(1), 83–94. https://doi.org/10.3354/cr00921
Intrigliolo, D. S., & Castel, J. R. (2010). Response of plum trees to deficit irrigation under two crop levels: Tree growth, yield and fruit quality. Irrigation Science, 28(6), 525–534. https://doi.org/10.1007/s00271-010-0212-xIPCC (2013). Climate Change 2013: The Physical Science Basis. Contribution of Working Group I to the Fifth Assessment Report of the Intergovernmental Panel on Climate Change [Stocker, T.F., D. Qin, G.-K. Plattner, M. Tignor, S.K. Allen, J. Boschung, A. Nauels, Y. Xia, V. Bex and P.M. Midgley (eds.)]. Cambridge University Press, Cambridge, United Kingdom and New York, NY, USA, 1535 pp.Jones, G. V. (2012). Climate, grapes, and wine: Structure and suitability in a changing climate. Acta Horticulturae, 931, 19-28. https://doi.org/10.17660/ActaHortic.2012.931.1Jones, G.V, & Goodrich, G. (2008). Influence of climate variability on wine regions in the western USA and on wine quality in the Napa Valley. Climate Research, 35(3), 241–254. https://doi.org/10.3354/cr00708Jones, G.V., White, M. A., Cooper, O. R., & Storchmann, K. (2005). Climate Change and Global Wine Quality. Climatic Change, 73(3), 319–343. https://doi.org/10.1007/s10584-005-4704-2Keller, M., Romero, P., Gohil, H., Smithyman, R. P., Riley, W. R., Casassa, L. F., & Harbertson, J. F. (2016). Deficit irrigation alters grapevine growth, physiology, and fruit microclimate. American Journal of Enology and Viticulture, 67(4). https://doi.org/10.5344/ajev.2016.16032Klein Tank, A. M. G., & Können, G. P. (2003). Trends in Indices of Daily Temperature and Precipitation Extremes in Europe, 1946–99. Journal of Climate, 16(22), 3665–3680. https://doi.org/10.1002/joc.1163Koufos, G., Mavromatis, T., Koundouras, S., Fyllas, N. M., & Jones, G. V. (2014). Viticulture-climate relationships in Greece: the impacts of recent climate trends on harvest date variation. International Journal of Climatology, 34(5), 1445–1459. https://doi.org/10.1002/joc.3775Koundouras, S., van Leeuwen, C., Seguin, G., & Glories, Y. (1999). Influence of water status on vine vegetative growth, berry ripening and wine characteristics in mediterranean zone (example of Nemea, Greece, variety Saint-George, 1997) . Journal International Des Sciences de La Vigne et Du Vin, 33(4), 149–160. https://doi.org/10.20870/oeno-one.1999.33.4.1020Koundouras, S., Marinos, V., Gkoulioti, A., Kotseridis, Y., & van Leeuwen, C. (2006). Influence of vineyard location and vine water status on fruit maturation of nonirrigated cv. Agiorgitiko (Vitis vinifera L.). Effects on wine phenolic and aroma components. Journal of Agricultural and Food Chemistry, 54(14), 5077–5086. https://doi.org/10.1021/jf0605446

OENO One 2021, 1, 349-366 365© 2021 International Viticulture and Enology Society - IVES
Leibar, U., Pascual, I., Morales, F., Aizpurua, A., & Unamunzaga, O. (2017). Grape yield and quality responses to simulated year 2100 expected climatic conditions under different soil textures. Journal of the Science of Food and Agriculture, 97(8), 2633–2640. https://doi.org/10.1002/jsfa.8086Leolini, L., Moriondo, M., Romboli, Y., Gardiman, M., Costafreda-Aumedes, S., García De Cortázar-Atauri, I., Granchi, L., & Brilli, L. (2019). Modelling sugar and acid content in Sangiovese grapes under future climates: An Italian case study. Climate Research, 78(3), 211–224. https://doi.org/10.3354/cr01571Lorenzo, M. N., Ramos, A. M., & Brands, S. (2016). Present and future climate conditions for winegrowing in Spain. Regional Environmental Change, 16(3), 617–627. https://doi.org/10.1007/s10113-015-0883-1de Luis, M., González-Hidalgo, J. C., Longares, L. A., & Stepánek, P. (2009). Seasonal precipitation trends in the Mediterranean Iberian Peninsula in second half of 20th century. International Journal of Climatology, 29(9), 1312–1323. https://doi.org/10.1002/joc.1778Malheiro, A. C., Campos, R., Fraga, H., Eiras-Dias, J., Silvestre, J., & Santos, J. A. (2013). Winegrape phenology and temperature relationships in the Lisbon wine region, Portugal. Journal International Des Sciences de La Vigne et Du Vin, 47(4), 287–299. https://doi.org/10.20870/oeno-one.2013.47.4.1558 Marta, A. D., Grifoni, D., Mancini, M., Storchi, P., Zipoli, G., & Orlandini, S. (2010). Analysis of the relationships between climate variability and grapevine phenology in the Nobile di Montepulciano wine production area. The Journal of Agricultural Science, 148(06), 657–666. https://doi.org/10.1017/S0021859610000432Neumann, P., & Matzarakis, A. (2014). Potential climate change impacts on winegrape must density and titratable acidity in southwest Germany. Climate Research, 59(2), 161–172. https://doi.org/10.3354/cr01216Nistor, E., Dobrei, A. G., Dobrei, A., & Camen, D. (2018). Growing season climate variability and its influence on sauvignon Blanc and Pinot Gris Berries and Wine Quality: Study case in Romania (2005-2015). South African Journal of Enology and Viticulture, 39(2), 196–207. https://doi.org/10.21548/39-2-2730NOAA (2019). National Centers for Environmental Information, State of the Climate: Global Climate Report for Annual 2019, published online January 2020, retrieved on January 16, 2020 from https://www.ncdc.noaa.gov/sotc/global/201913.OIV (2004). Organisation Internationale de la Vigne et du Vin. Recueil des Méthodes Internationales d’Analyse des vins et des moûts. Ed. Office International de la Vigne et du Vin, Paris, FranceOIV (2017). Focus OIV 2017. Distribution of the world’s grapevine varieties. OIV, Paris. France.
Parker, A. K., De Cortázar-Atauri, I. G., van Leeuwen, C., & Chuine, I. (2011). General phenological model to characterise the timing of flowering and veraison of Vitis vinifera L. Australian Journal of Grape and Wine Research, 17(2), 206–216. https://doi.org/10.1111/j.1755-0238.2011.00140.xPastore, C., Dal Santo, S., Zenoni, S., Allegro, G., Valentini, G., Tornielli, G. B., & Filippetti, I. (2017). Changes in flavonoid biosynthesis and in the berry whole transcriptome of ‘Sangiovese’ under moderate air temperature increase. Acta Horticulturae. https://doi.org/10.17660/ActaHortic.2017.1188.21Pieri, P., Lebon, E., & Brisson, N. (2012). Climate change impact on French vineyards as predicted by models. In Acta Horticulturae (Vol. 931, pp. 29–38). https://doi.org/10.17660/ActaHortic.2012.931.2 Ramos, M.C. (2017). Projection of phenology response to climate change in rainfed vineyards in north-east Spain. Agricultural and Forest Meteorology, 247. https://doi.org/10.1016/j.agrformet.2017.07.022Ramos, M.C., Jones, G. V., & Yuste, J. (2015). Spatial and temporal variability of cv. Tempranillo phenology and grape quality within the Ribera del Duero DO (Spain) and relationships with climate. International Journal of Biometeorology, 59(12). https://doi.org/10.1007/s00484-015-0992-zRamos, M.C, & Jones, G. V. (2018). Relationships between Cabernet-Sauvignon phenology and climate in two Spanish viticultural regions: Observations and predicted future changes. Journal of Agricultural Science, 156(9), 1079–1089. https://doi.org/10.1017/S0021859618001119Ramos, M. C., Jones, G. V., & Yuste, J. (2018). Phenology of tempranillo and cabernet-sauvignon varieties cultivated in the Ribera Del Duero DO: Observed variability and predictions under climate change scenarios. Oeno One, 52(1), 31–44. https://doi.org/10.20870/oeno-one.2018.52.1.2119Ramos, M. C., & Martínez de Toda, F. (2020). Variability in the potential effects of climate change on phenology and on grape composition of Tempranillo in three zones of the Rioja DOCa (Spain). European Journal of Agronomy, 115, 126014. https://doi.org/10.1016/j.eja.2020.126014Ramos, M. C., Pérez-Álvarez, E.P., Peregrina, F., & Martínez de Toda, F. (2020). Relationships between grape composition of Tempranillo variety and available soil water and water stress under different weather conditions. Scientia Horticulturae, 262. 109063 https://doi.org/10.1016/j.scienta.2019.109063Ruml, M., Korac, N., Vujadinovic, M., Vukovic, A., & Ivaniševic, D. (2016). Response of grapevine phenology to recent temperature change and variability in the wine-producing area of Sremski Karlovci, Serbia. Journal of Agricultural Science, 154(2), 186–206. https://doi.org/10.1017/S0021859615000453

© 2021 International Viticulture and Enology Society - IVES366 OENO One 2021, 1, 349-366
María Concepción Ramos et al.
Sadras, V. O., Moran, M. A., & Bonada, M. (2013). Effects of elevated temperature in grapevine. I Berry sensory traits. Australian Journal of Grape and Wine Research, 19(1), 95–106. https://doi.org/10.1111/ajgw.12007Salazar Parra, C., Aguirreolea, J., Sánchez-Díaz, M., Irigoyen, J. J., & Morales, F. (2010). Effects of climate change scenarios on Tempranillo grapevine (Vitis vinifera L.) ripening: response to a combination of elevated CO2 and temperature, and moderate drought. Plant and Soil, 337(1–2), 179–191. https://doi.org/10.1007/s11104-010-0514-zSantos, J., Malheiro, A., Pinto, J., & Jones, G. (2012). Macroclimate and viticultural zoning in Europe: observed trends and atmospheric forcing. Climate Research, 51(1), 89–103. https://doi.org/10.3354/cr01056Shellie, K., Cragin, J., & Serpe, M. (2014). Performance of alternative European wine grape cultivars in Southwestern Idaho: Cold hardiness, berry maturity, and yield. HortTechnology, 24(1), 138–147. https://doi.org/10.21273/HORTTECH.24.1.138 Sugiura, S., Sato, A,, Shiraishi, M, Amamiya, H., Ohno, H., Takayama, N., Miyata, N., Sakaue, T., & Konno, S. (2020) Prediction of acid concentration in wine and table grape berries from air temperature. Hortic J 89:208–215. doi: 10.2503/hortj.UTD-141Tomasi, D., Jones, G. V., Giust, M., Lovat, L., & Gaiotti, F. (2011). Grapevine Phenology and Climate Change: Relationships and Trends in the Veneto Region of Italy for 1964-2009. American Journal of Enology and Viticulture, 62(3), 329–339. https://doi.org/10.5344/ajev.2011.10108Urhausen, S., Brienen, S., Kapala, A., & Simmer, C. (2011). Climatic conditions and their impact on viticulture in the Upper Moselle region.
Climatic Change, 109(3–4), 349–373. https://doi.org/10.1007/s10584-011-0059-z van Leeuwen, C. (2010). Terroir: The effect of the physical environment on vine growth, grape ripening and wine sensory attributes. Managing Wine Quality: Viticulture and Wine Quality, 273–315. https://doi.org/10.1533/9781845699284.3.273van Leeuwen, C., Destrac-Irvine, A., Dubernet, M., Duchêne, E., Gowdy, M., Marguerit, E., Pieri, P., parker, A., de Rességuier, L., & Ollat, N. (2019). An update on the impact of climate change in viticulture and potential adaptations. Agronomy, 9 (9). https://doi.org/10.3390/agronomy9090514van Leeuwen, C. V., Tregoat, O., Choné, X., Bois, B., Pernet, D., & Gaudillére, J.P. (2009). Vine water status is a key factor in grape ripening and vintage quality for red bordeaux wine. How can it be assessed for vineyard management purposes? Journal International Des Sciences de La Vigne et Du Vin, 43(3), 121–134. https://doi.org/10.20870/oeno-one.2009.43.3.798Vršič, S., Šuštar, V., Pulko, B., & Šumenjak, T. (2014). Trends in climate parameters affecting winegrape ripening in northeastern Slovenia. Climate Research, 58(3), 257–266. https://doi.org/10.3354/cr01197Vršič, S., & Vodovnik, T. (2012) Reactions of grape varieties to climate changes in North East Slovenia. Plant, Soil Environ 58:34–41Webb, L. B., Whetton, P. H., Bhend, J., Darbyshire, R., Briggs, P. R., & Barlow, E. W. R. (2012). Earlier wine-grape ripening driven by climatic warming and drying and management practices. Nature Climate Change, 2(4), 259–264. https://doi.org/10.1038/nclimate1417White, R. E. (2009). Understanding vineyard soils. New York. Oxford University Press.Winkler, A. J., Cook, J.A., Kliewer, W.M., & Lider, L.A. (1974).General Viticulture, University Of California Press, Berkeley 710pp