spatial and temporal variation of phytoplankton in a ... · spatial and temporal variation of...
TRANSCRIPT
Braz. J. Biol., 2016, vol. 76, no. 3, pp. 600-610600600
http://dx.doi.org/10.1590/1519-6984.18914 Original Article
Spatial and temporal variation of phytoplankton in a tropical eutrophic river
L. M. Santanaa,c*, M. E. B. Moraesb, D. M. L. Silvaa end C. Ferragutc
aPrograma de Pós-graduação em Sistemas Aquáticos Tropicais, Laboratório de Biogeoquímica Marinha, Departamento de Ciências Biológicas, Universidade Estadual de Santa Cruz – UESC, Rodovia Jorge Amado,
Km 16, Salobrinho, CEP 45662-900, Ilhéus, BA, BrazilbPrograma de Pós-graduação em Sistemas Aquáticos Tropicais, Laboratório de Análise e Planejamento Ambiental,
Departamento de Ciências Agrárias e Ambientais, Universidade Estadual de Santa Cruz – UESC, Rodovia Jorge Amado, Km 16, Salobrinho, CEP 45662-900, Ilhéus, BA, Brazil
cPrograma de Pós-graduação em Biodiversidade Vegetal e Meio Ambiente, Núcleo de Pesquisa em Ecologia, Laboratório de Ecologia Aquática, Instituto de Botânica – IBt, Av. Miguel Stéfano, 3687, Água Funda,
CEP 04301-902, São Paulo, SP, Brazil*e-mail: [email protected]
Received: September 9, 2014 – Accepted: March 31, 2015 – Distributed: August 31, 2016(With 6 figures)
AbstractThis study aims to evaluate the environmental factors determining of the changes in phytoplankton structure in spatial (upper, middle and lower course) and seasonal (dry and rainy period) scales in a eutrophic river (Almada River, northeastern Brazil). In the study period, total accumulated rainfall was below of the historic average, resulting in flow reduction, mainly in rainy period. High orthophosphate concentration was found at the sampling sites. Phytoplankton chlorophyll a increased from upstream to downstream. Geitlerinema splendidum (S1) and Chlamydomonas sp. (X2) were the most abundant species in the upper course and several species of diatoms (D), Euglenophyceae (W1, W2) and Chlorophyceae (X1) in the middle and lower course. The functional groups were found to be characteristic of lotic ecosystem, shallow, with low light availability, rich in organic matter and eutrophic environments. We conclude that phytoplankton community structure was sensitive to change of the river flow and nutrient availability in spatial and seasonal scale in a tropical river.
Keywords: phytoplankton, tropical river, functional groups, eutrophication.
Variação espacial e temporal do fitoplâncton em um rio eutrófico tropical
ResumoO objetivo deste estudo foi avaliar os fatores ambientais determinantes das mudanças na estrutura do fitoplâncton em escala espacial (alto, médio e baixo curso) e temporal (seca e chuva) em um rio eutrófico tropical (rio Almada, nordeste do Brasil). No período de estudo, a precipitação acumulada mensal foi abaixo da média histórica, resultando na redução da vazão, principalmente no período chuvoso. A concentração de ortofosfato foi elevada nos pontos de amostragem. A clorofila a do fitoplâncton aumentou de montante para jusante. Geitlerinema splendidum (S1) e Chlamydomomas sp. (X2) foram as espécies mais abundantes no alto curso e várias espécies de diatomáceas (D), Euglenophyceae (W1, W2) e Chlorophyceae (X1) no médio e/ou baixo curso. Os grupos funcionais foram característicos de ambientes lóticos, rasos, com baixa disponibilidade de luz, rico em matéria orgânica e eutrófico. Concluímos que a estrutura da comunidade fitoplanctônica foi sensível às mudanças na vazão e na disponibilidade de nutrientes em escala espacial e temporal em um rio tropical.
Palavras-chave: fitoplâncton, rio tropical, grupos funcionais, eutrofização.
1. Introduction
The phytoplankton structure is strongly influenced by physical factors in stream ecosystems (Reynolds, 2000). Water flow is the main hydrological factor determining the phytoplankton structure (named potamoplankton, in rivers), mainly because it can act on numerous environmental
factors controlling the community dynamics (Reynolds, 2000). The water flow fluctuation could allow the exchange and recruitment of species, and can also determine the maintenance of algae in suspension (Reynolds and Glaister, 1993; Reynolds, 2000). Furthermore, water flow
Braz. J. Biol., 2016, vol. 76, no. 3, pp. 600-610 601
Spatial and temporal variation of phytoplankton in a tropical river
601
can influence environmental conditions, such as turbidity, turbulence and residence time, which may change the phytoplankton structure (Allan and Castillo, 2007; Hilton et al., 2006). The response of rivers to excess of nutrients depends mainly on the water residence time because rivers with long-retention time tend to be dominated by phytoplankton and rivers with short-retention time tend to be dominated by benthic and periphytic algae (Hilton et al., 2006). Therefore, changes in the natural flow regime combined with human activities can easily lead to river eutrophication (Dodds, 2006; Ha et al., 1998). Despite increasing eutrophication problems in rivers (Dodds 2006), studies on the phytoplankton community structure are scarce, particularly in tropical and subtropical regions (e.g. Soares et al., 2007; Devercelli, 2010; Moura et al., 2013).
Studies have shown that phytoplankton species are very sensitive to physical and chemical changes in stream ecosystems, including findings indicating that the composition of the phytoplankton responds to different human impacts on temperate rivers (Leland, 2003; Abonyi et al., 2012). The phytoplankton may be an important predictor of environmental impacts on rivers (e.g. Abonyi et al., 2012), as also reported for reservoirs (e.g. Crossetti and Bicudo, 2008). There is a consensus that an increase in nutrients availability, especially phosphorus, is prerequisite to trigger eutrophication, however the relationship between resource availability (light and nutrients) and hydraulic drag need to be better understood in rivers (Hilton et al., 2006).
The phytoplankton response to environmental changes can be detected through various structural characteristics such as species diversity and biomass (Reynolds, 1996). In order to better predict the anthropogenic changes in the environment, Reynolds et al. (2002) grouped phytoplankton species within functional groups based on physiological, morphological and ecological attributes. In a review literature, Padisák et al. (2009) reported on the application of functional groups in lotic and lentic ecosystems. In tropical region, this approach has been successfully applied to phytoplankton of eutrophic (Crossetti and Bicudo, 2008) and oligotrophic reservoirs (Lopes et al., 2005) as well as to identify environmental conditions changes in rivers (Soares et al., 2007; Devercelli, 2010).
According to Hilton et al. (2006), the eutrophication is reasonably well understood in lakes, but knowledge of this process in rivers is still limited. Considering that the excessive increase of phytoplankton is one of the main consequences of eutrophication, the present study aims to evaluate the spatial and temporal variability of phytoplankton in a eutrophic tropical river (Almada River, northeastern Brazil). This work also addresses to identify the main drivers of changes in the phytoplankton structure, as well as identify the functional groups (Reynolds et al., 2002) with the variation of hydrological and limnological conditions.
2. Material and Methods
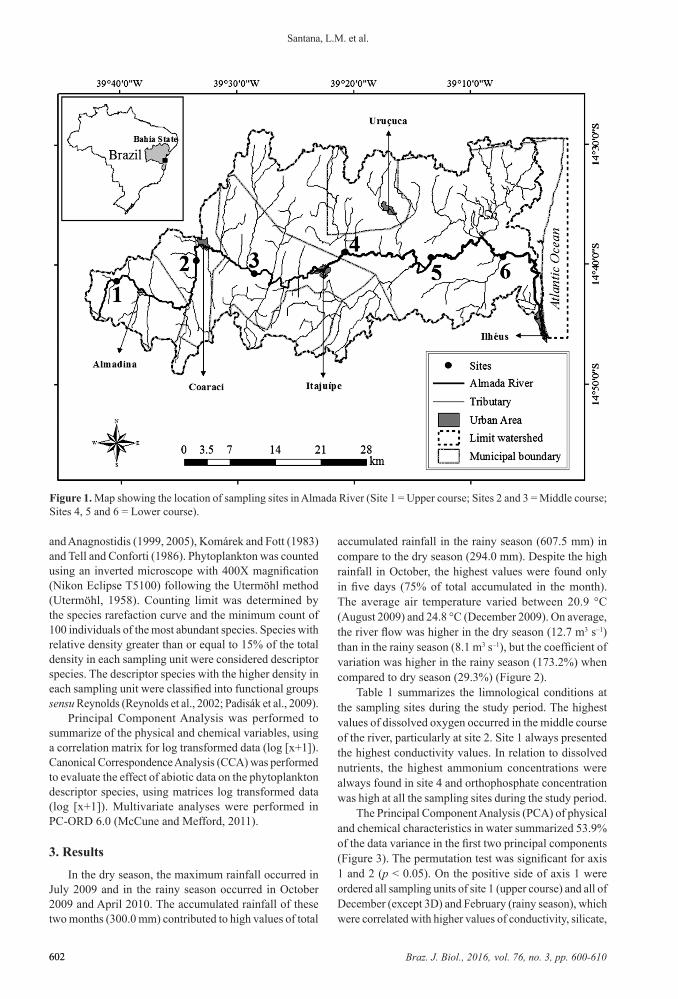
2.1. Study areaThe Almada River is the main course of the Almada
River Basin in Bahia State, northeastern Brazil (Figure 1). This basin is located in the Environmental Protection Area and includes extensive cocoa plantations in forest fragments (53.85%), as well as extensive pastureland (20.49%), preserved areas of Atlantic Forest (16.32%) and “restingas” and mangroves (0.7%) (Silva and Gomes, 2010). Eight cities are situated partially or totally in the Almada River Basin and five of these, ranging from 6.357 to 184.236 in inhabitants, are situated on the banks of the Almada River, or its tributaries (IBGE, 2013). The Almada River is 138 km long with a drainage area of 1.545 km2. The morphometric, human occupation and land use data, as well as general characteristics are summarized in Table 1. In terms of hydrology, the Almada River is perennial and presents historical average annual flow of 13.9 m3 s–1, but in some severe drought periods zero flow has been recorded (Torres et al., 2001). The Almada River water and its tributaries are intended primarily for public supply and watering animals. The climate is tropical humid rainy (Kӧppen: Af). Two climatic seasons can be characterized over a year: a dry season with a lower average monthly rainfall (96 mm) and air temperature (20 °C) (May-September) and a rainy season with a higher average monthly rainfall (172 mm) and air temperature (25 °C) (October-April) (Torres et al., 2001). During the study period, the climate phenomenon El Niño changed precipitation patterns of the rainy season.
2.2. Sampling and methodsFor the evaluation of limnological conditions and
phytoplankton of the Almada River six sites were selected for sampling: site 1 (at upper course), sites 2 and 3 (at middle course), sites 4, 5 and 6 (at lower course) (Figure 1). Sampling was carried out for two consecutive days from downstream to upstream (in June, August, October and December 2009, February and April 2010).
The rainfall and air temperature data were provided by CPTEC/INPE (2010b) and INPE (2012), respectively. The data flow of the Almada River (m3 s–1) during the study period was obtained from two fluviometric stations (ANA, 2015). Samples were collected on the subsurface of the water column to determine the following variables: temperature, pH, electrical conductivity (WTW 3401 multi-parameter probe); dissolved oxygen (Oximeter Hanna HI 9146); total suspended solids (TSS) (Strickland and Parsons, 1972), nitrite, nitrate and ammonium (DIONEX - ICS1000), orthophosphate and silicate (Grasshoff et al., 1983).
Water samples for determining of chlorophyll a were filtrated in a glass fiber filter GF/F and extraction was made by 90% acetone (Parsons et al., 1984; Wetzel and Likens, 1991). Samples for qualitative and quantitative phytoplankton analysis were fixed with formalin (4% final concentration). Keys specialized were used for taxonomic identification, such as Bicudo and Menezes (2006), Komárek
Braz. J. Biol., 2016, vol. 76, no. 3, pp. 600-610602
Santana, L.M. et al.
602
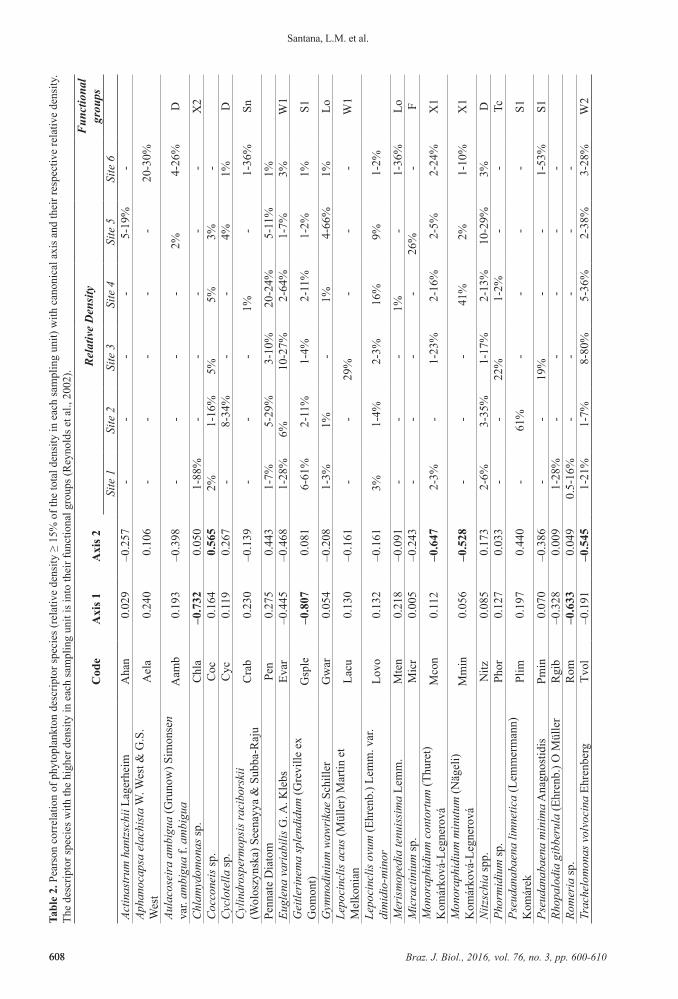
and Anagnostidis (1999, 2005), Komárek and Fott (1983) and Tell and Conforti (1986). Phytoplankton was counted using an inverted microscope with 400X magnification (Nikon Eclipse T5100) following the Utermöhl method (Utermöhl, 1958). Counting limit was determined by the species rarefaction curve and the minimum count of 100 individuals of the most abundant species. Species with relative density greater than or equal to 15% of the total density in each sampling unit were considered descriptor species. The descriptor species with the higher density in each sampling unit were classified into functional groups sensu Reynolds (Reynolds et al., 2002; Padisák et al., 2009).
Principal Component Analysis was performed to summarize of the physical and chemical variables, using a correlation matrix for log transformed data (log [x+1]). Canonical Correspondence Analysis (CCA) was performed to evaluate the effect of abiotic data on the phytoplankton descriptor species, using matrices log transformed data (log [x+1]). Multivariate analyses were performed in PC-ORD 6.0 (McCune and Mefford, 2011).
3. Results
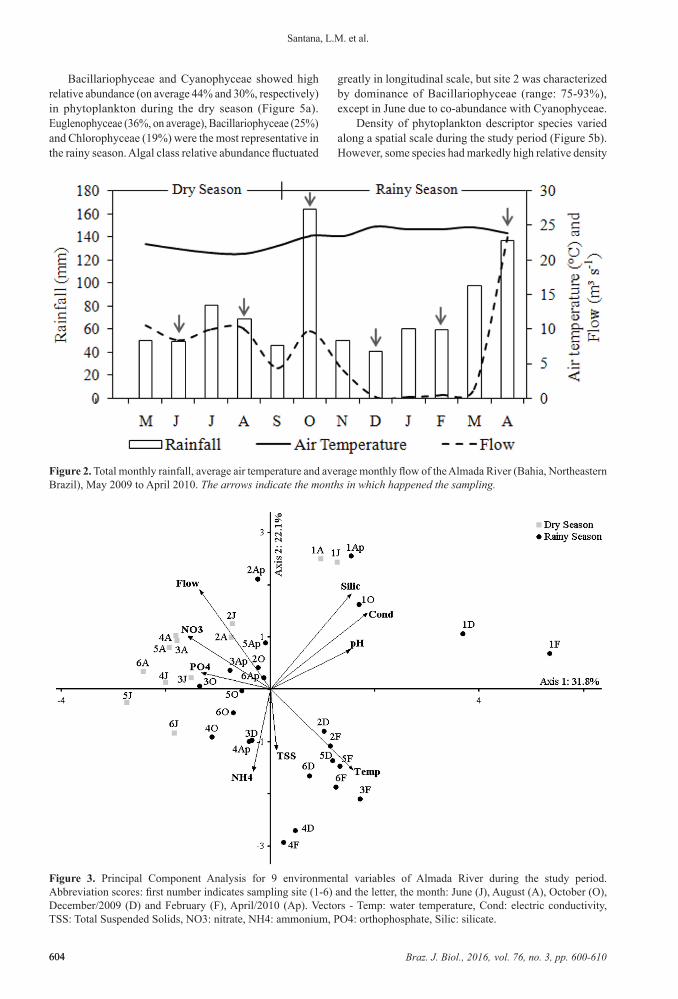
In the dry season, the maximum rainfall occurred in July 2009 and in the rainy season occurred in October 2009 and April 2010. The accumulated rainfall of these two months (300.0 mm) contributed to high values of total
accumulated rainfall in the rainy season (607.5 mm) in compare to the dry season (294.0 mm). Despite the high rainfall in October, the highest values were found only in five days (75% of total accumulated in the month). The average air temperature varied between 20.9 °C (August 2009) and 24.8 °C (December 2009). On average, the river flow was higher in the dry season (12.7 m3 s–1) than in the rainy season (8.1 m3 s–1), but the coefficient of variation was higher in the rainy season (173.2%) when compared to dry season (29.3%) (Figure 2).
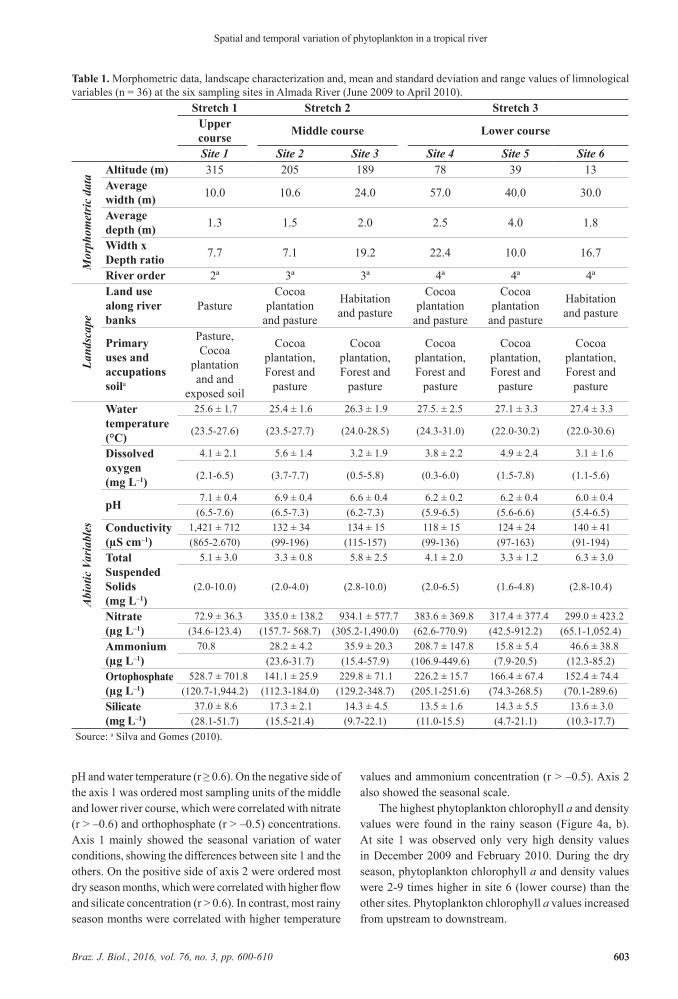
Table 1 summarizes the limnological conditions at the sampling sites during the study period. The highest values of dissolved oxygen occurred in the middle course of the river, particularly at site 2. Site 1 always presented the highest conductivity values. In relation to dissolved nutrients, the highest ammonium concentrations were always found in site 4 and orthophosphate concentration was high at all the sampling sites during the study period.
The Principal Component Analysis (PCA) of physical and chemical characteristics in water summarized 53.9% of the data variance in the first two principal components (Figure 3). The permutation test was significant for axis 1 and 2 (p < 0.05). On the positive side of axis 1 were ordered all sampling units of site 1 (upper course) and all of December (except 3D) and February (rainy season), which were correlated with higher values of conductivity, silicate,
Figure 1. Map showing the location of sampling sites in Almada River (Site 1 = Upper course; Sites 2 and 3 = Middle course; Sites 4, 5 and 6 = Lower course).
Braz. J. Biol., 2016, vol. 76, no. 3, pp. 600-610 603
Spatial and temporal variation of phytoplankton in a tropical river
603
Table 1. Morphometric data, landscape characterization and, mean and standard deviation and range values of limnological variables (n = 36) at the six sampling sites in Almada River (June 2009 to April 2010).
Stretch 1 Stretch 2 Stretch 3Upper course Middle course Lower course
Site 1 Site 2 Site 3 Site 4 Site 5 Site 6
Mor
phom
etri
c da
ta
Altitude (m) 315 205 189 78 39 13Average width (m) 10.0 10.6 24.0 57.0 40.0 30.0
Average depth (m) 1.3 1.5 2.0 2.5 4.0 1.8
Width x Depth ratio 7.7 7.1 19.2 22.4 10.0 16.7
River order 2ª 3ª 3ª 4ª 4ª 4ª
Land
scap
e
Land use along river banks
PastureCocoa
plantation and pasture
Habitation and pasture
Cocoa plantation
and pasture
Cocoa plantation
and pasture
Habitation and pasture
Primary uses and accupations soila
Pasture, Cocoa
plantation and and
exposed soil
Cocoa plantation, Forest and
pasture
Cocoa plantation, Forest and
pasture
Cocoa plantation, Forest and
pasture
Cocoa plantation, Forest and
pasture
Cocoa plantation, Forest and
pasture
Abi
otic
Var
iabl
es
Water temperature (°C)
25.6 ± 1.7 25.4 ± 1.6 26.3 ± 1.9 27.5. ± 2.5 27.1 ± 3.3 27.4 ± 3.3
(23.5-27.6) (23.5-27.7) (24.0-28.5) (24.3-31.0) (22.0-30.2) (22.0-30.6)
Dissolved oxygen (mg L–1)
4.1 ± 2.1 5.6 ± 1.4 3.2 ± 1.9 3.8 ± 2.2 4.9 ± 2.4 3.1 ± 1.6
(2.1-6.5) (3.7-7.7) (0.5-5.8) (0.3-6.0) (1.5-7.8) (1.1-5.6)
pH 7.1 ± 0.4 6.9 ± 0.4 6.6 ± 0.4 6.2 ± 0.2 6.2 ± 0.4 6.0 ± 0.4(6.5-7.6) (6.5-7.3) (6.2-7.3) (5.9-6.5) (5.6-6.6) (5.4-6.5)
Conductivity(µS cm–1)
1,421 ± 712 132 ± 34 134 ± 15 118 ± 15 124 ± 24 140 ± 41(865-2.670) (99-196) (115-157) (99-136) (97-163) (91-194)
Total Suspended Solids (mg L–1)
5.1 ± 3.0 3.3 ± 0.8 5.8 ± 2.5 4.1 ± 2.0 3.3 ± 1.2 6.3 ± 3.0
(2.0-10.0) (2.0-4.0) (2.8-10.0) (2.0-6.5) (1.6-4.8) (2.8-10.4)
Nitrate (µg L–1)
72.9 ± 36.3 335.0 ± 138.2 934.1 ± 577.7 383.6 ± 369.8 317.4 ± 377.4 299.0 ± 423.2(34.6-123.4) (157.7- 568.7) (305.2-1,490.0) (62.6-770.9) (42.5-912.2) (65.1-1,052.4)
Ammonium(µg L–1)
70.8 28.2 ± 4.2 35.9 ± 20.3 208.7 ± 147.8 15.8 ± 5.4 46.6 ± 38.8(23.6-31.7) (15.4-57.9) (106.9-449.6) (7.9-20.5) (12.3-85.2)
Ortophosphate(µg L–1)
528.7 ± 701.8 141.1 ± 25.9 229.8 ± 71.1 226.2 ± 15.7 166.4 ± 67.4 152.4 ± 74.4(120.7-1,944.2) (112.3-184.0) (129.2-348.7) (205.1-251.6) (74.3-268.5) (70.1-289.6)
Silicate (mg L–1)
37.0 ± 8.6 17.3 ± 2.1 14.3 ± 4.5 13.5 ± 1.6 14.3 ± 5.5 13.6 ± 3.0(28.1-51.7) (15.5-21.4) (9.7-22.1) (11.0-15.5) (4.7-21.1) (10.3-17.7)
Source: a Silva and Gomes (2010).
pH and water temperature (r ≥ 0.6). On the negative side of the axis 1 was ordered most sampling units of the middle and lower river course, which were correlated with nitrate (r > –0.6) and orthophosphate (r > –0.5) concentrations. Axis 1 mainly showed the seasonal variation of water conditions, showing the differences between site 1 and the others. On the positive side of axis 2 were ordered most dry season months, which were correlated with higher flow and silicate concentration (r > 0.6). In contrast, most rainy season months were correlated with higher temperature
values and ammonium concentration (r > –0.5). Axis 2 also showed the seasonal scale.
The highest phytoplankton chlorophyll a and density values were found in the rainy season (Figure 4a, b). At site 1 was observed only very high density values in December 2009 and February 2010. During the dry season, phytoplankton chlorophyll a and density values were 2-9 times higher in site 6 (lower course) than the other sites. Phytoplankton chlorophyll a values increased from upstream to downstream.
Braz. J. Biol., 2016, vol. 76, no. 3, pp. 600-610604
Santana, L.M. et al.
604
Bacillariophyceae and Cyanophyceae showed high relative abundance (on average 44% and 30%, respectively) in phytoplankton during the dry season (Figure 5a). Euglenophyceae (36%, on average), Bacillariophyceae (25%) and Chlorophyceae (19%) were the most representative in the rainy season. Algal class relative abundance fluctuated
greatly in longitudinal scale, but site 2 was characterized by dominance of Bacillariophyceae (range: 75-93%), except in June due to co-abundance with Cyanophyceae.
Density of phytoplankton descriptor species varied along a spatial scale during the study period (Figure 5b). However, some species had markedly high relative density
Figure 2. Total monthly rainfall, average air temperature and average monthly flow of the Almada River (Bahia, Northeastern Brazil), May 2009 to April 2010. The arrows indicate the months in which happened the sampling.
Figure 3. Principal Component Analysis for 9 environmental variables of Almada River during the study period. Abbreviation scores: first number indicates sampling site (1-6) and the letter, the month: June (J), August (A), October (O), December/2009 (D) and February (F), April/2010 (Ap). Vectors - Temp: water temperature, Cond: electric conductivity, TSS: Total Suspended Solids, NO3: nitrate, NH4: ammonium, PO4: orthophosphate, Silic: silicate.

Braz. J. Biol., 2016, vol. 76, no. 3, pp. 600-610 605
Spatial and temporal variation of phytoplankton in a tropical river
605
in all sampling sites, such as Geitlerinema splendidum (Greville ex Gomont) Anagnostidis, Trachelomonas volvocina Ehrenberg and some diatoms (e. g. Nitzschia spp. and pennate diatom n. i.). Geitlerinema splendidum was dominant in August and October (61%) and abundant in the other months at site 1 (upper course). Site 2 (middle course) showed high relative diatom abundance (except in June), which presented three species alternated in representativeness (pennate diatom, Cyclotella sp., Nitzschia spp.). During the study period, T. volvocina showed high relative density mainly in sites 3 and 4, but the species was dominant only in site 3/February. Euglena variabilis G. A. Klebs and Chlamydomonas sp. occurred exclusively in the rainy season. G. splendidum, Monoraphidium contortum (Thuret) Komàrková-Legnerová and T. volvocina density were 22, 28 and 9 times, respectively, greater in the rainy than in the dry season.
The evaluation of phytoplankton functional groups (Reynolds et al., 2002) showed a predominance of the group S1 in site 1 and group D in site 2 (Table 2). Group X2 showed high density only in site 1 (rainy season). Although
the other sites present a mixture of functional groups (F, Lo, Sn, W1, W2, X1, X2,), site 6 had the highest Sn density during the rainy season (October and April - high rainfall).
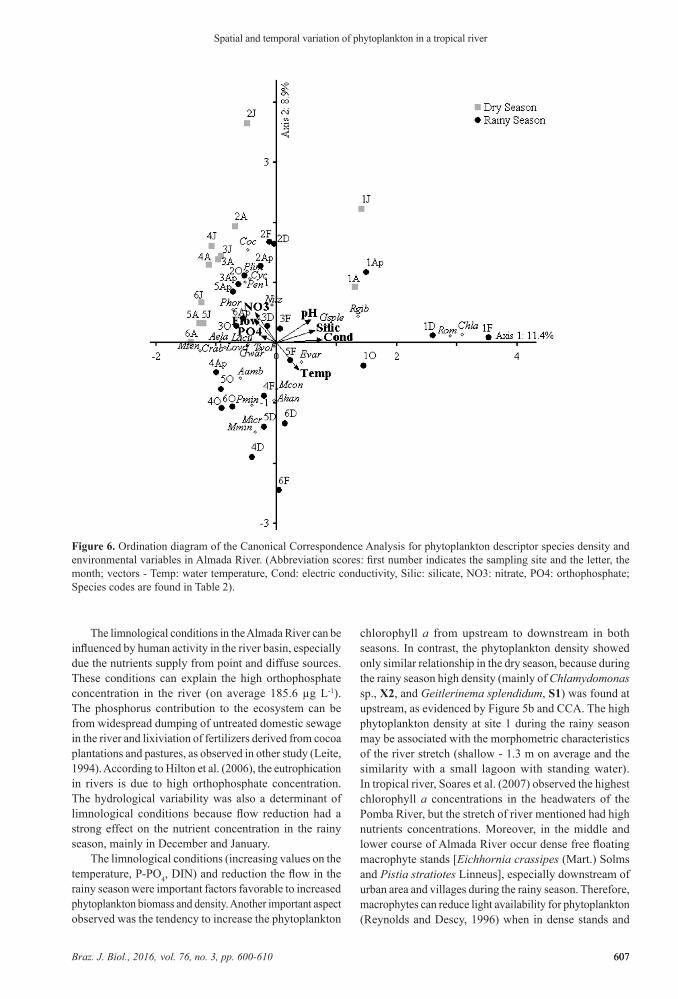
The Canonical Correspondence Analysis (CCA) was performed with 7 environmental variables and 24 descriptor species (Figure 6, Table 2). The eigenvalues of axis 1 and 2 were 0.385 and 0.300, respectively, explaining 20.3% of the total variance in the axis. The species-environment Pearson correlation coefficient for axis 1 and 2 indicated a strong relationship between species distribution and environmental variables (r > 0.8). The Monte Carlo permutation test showed that the correlation between the species and environmental conditions was statistically significant at axis 1 and 2 (p < 0.05).
Situated on the positive side of axis 1 were all sampling units of site 1 (upper course), which were correlated with higher silicate concentration and pH and conductivity values (r = 0.65 to 0.95). According to the centroid property of CCA, Chlamydomonas sp., Geitlerinema splendidum and Romeria sp. were closely associated with site 1. The other sampling sites were located on the negative side of axis
Figure 4. Phytoplankton chlorophyll a (a) and total density (b) in six sites in the Almada River during the study period.

Braz. J. Biol., 2016, vol. 76, no. 3, pp. 600-610606
Santana, L.M. et al.
606
1 and were correlated with higher nitrate and phosphate concentration (r > –0.40). All units of the dry season were situated on the positive side of axis 2 and were correlated with higher nitrate and flow values and high Cocconeis sp. density (r = 0.56). Sites 4, 5 and 6 (lower course) in December and February were situated on the negative side, which were correlated with higher temperature values and Monoraphidium contortum, M. minutum and Trachelomonas volvocina density (r > –0.5).
4. Discussion
During the study period, the rainfall regime in the Almada River Basin was characterized by a period of low rainfall (901 mm) compared to the historical data of annual rainfall total (1639 mm, May - April) (Torres et al.,
2001). This period reflected the influence of El Niño, which resulted in rainfall below average in northeastern Brazil (CPTEC/INPE, 2010a), mainly between November and March. The change in the precipitation regime had a dramatic effect on river flow (ANA, 2015), in which case the Almada River was greatly reduced during the rainy season (December 2009, January-March 2010). In rivers, the phytoplankton dynamics is mainly determined by the flow, which directly influences on the water turbidity and nutrients concentration (Allan and Castillo, 2007; Reynolds, 2000) and, stretches with low flow are more favorable to the community development (Reynolds and Descy, 1996). In this study, climate and hydrological change had a strong influence on the limnological conditions and phytoplankton structure.
Figure 5. Relative density of phytoplankton classes (a) and descriptor species (b) in six sites in the Almada River during the study period.
Braz. J. Biol., 2016, vol. 76, no. 3, pp. 600-610 607
Spatial and temporal variation of phytoplankton in a tropical river
607
The limnological conditions in the Almada River can be influenced by human activity in the river basin, especially due the nutrients supply from point and diffuse sources. These conditions can explain the high orthophosphate concentration in the river (on average 185.6 µg L-1). The phosphorus contribution to the ecosystem can be from widespread dumping of untreated domestic sewage in the river and lixiviation of fertilizers derived from cocoa plantations and pastures, as observed in other study (Leite, 1994). According to Hilton et al. (2006), the eutrophication in rivers is due to high orthophosphate concentration. The hydrological variability was also a determinant of limnological conditions because flow reduction had a strong effect on the nutrient concentration in the rainy season, mainly in December and January.
The limnological conditions (increasing values on the temperature, P-PO4, DIN) and reduction the flow in the rainy season were important factors favorable to increased phytoplankton biomass and density. Another important aspect observed was the tendency to increase the phytoplankton
chlorophyll a from upstream to downstream in both seasons. In contrast, the phytoplankton density showed only similar relationship in the dry season, because during the rainy season high density (mainly of Chlamydomonas sp., X2, and Geitlerinema splendidum, S1) was found at upstream, as evidenced by Figure 5b and CCA. The high phytoplankton density at site 1 during the rainy season may be associated with the morphometric characteristics of the river stretch (shallow - 1.3 m on average and the similarity with a small lagoon with standing water). In tropical river, Soares et al. (2007) observed the highest chlorophyll a concentrations in the headwaters of the Pomba River, but the stretch of river mentioned had high nutrients concentrations. Moreover, in the middle and lower course of Almada River occur dense free floating macrophyte stands [Eichhornia crassipes (Mart.) Solms and Pistia stratiotes Linneus], especially downstream of urban area and villages during the rainy season. Therefore, macrophytes can reduce light availability for phytoplankton (Reynolds and Descy, 1996) when in dense stands and
Figure 6. Ordination diagram of the Canonical Correspondence Analysis for phytoplankton descriptor species density and environmental variables in Almada River. (Abbreviation scores: first number indicates the sampling site and the letter, the month; vectors - Temp: water temperature, Cond: electric conductivity, Silic: silicate, NO3: nitrate, PO4: orthophosphate; Species codes are found in Table 2).
Braz. J. Biol., 2016, vol. 76, no. 3, pp. 600-610608
Santana, L.M. et al.
608
Tabl
e 2.
Pea
rson
cor
rela
tion
of p
hyto
plan
kton
des
crip
tor s
peci
es (r
elat
ive
dens
ity ≥
15%
of t
he to
tal d
ensi
ty in
eac
h sa
mpl
ing
unit)
with
can
onic
al a
xis a
nd th
eir r
espe
ctiv
e re
lativ
e de
nsity
. Th
e de
scrip
tor s
peci
es w
ith th
e hi
gher
den
sity
in e
ach
sam
plin
g un
it is
into
thei
r fun
ctio
nal g
roup
s (R
eyno
lds e
t al.,
200
2).
Cod
eA
xis 1
Axi
s 2R
elat
ive
Den
sity
Fun
ctio
nal
grou
psSi
te 1
Site
2Si
te 3
Site
4Si
te 5
Site
6Ac
tinas
trum
han
tzsc
hii L
ager
heim
Aha
n0.
029
–0.2
57-
--
-5-
19%
-Ap
hano
caps
a el
achi
sta
W. W
est &
G.S
. W
est
Ael
a0.
240
0.10
6-
--
--
20-3
0%
Aula
cose
ira
ambi
gua
(Gru
now
) Sim
onse
n va
r. am
bigu
a f.
ambi
gua
Aam
b0.
193
–0.3
98-
--
-2%
4-26
%D
Chl
amyd
omon
as sp
.C
hla
–0.7
320.
050
1-88
%-
--
--
X2
Coc
cone
is sp
.C
oc0.
164
0.56
52%
1-16
%5%
5%3%
-C
yclo
tella
sp.
Cyc
0.11
90.
267
-8-
34%
--
4%1%
DC
ylin
dros
perm
opsi
s rac
ibor
skii
(Wol
oszy
nska
) See
nayy
a &
Sub
ba-R
aju
Cra
b0.
230
–0.1
39-
--
1%-
1-36
%Sn
Penn
ate
Dia
tom
Pen
0.27
50.
443
1-7%
5-29
%3-
10%
20-2
4%5-
11%
1%Eu
glen
a va
riab
ilis G
. A. K
lebs
Evar
–0.4
45–0
.468
1-28
%6%
10-2
7%2-
64%
1-7%
3%W
1G
eitle
rine
ma
sple
ndid
um (G
revi
lle e
x G
omon
t)G
sple
–0.8
070.
081
6-61
%2-
11%
1-4%
2-11
%1-
2%1%
S1
Gym
nodi
nium
waw
rika
e Sc
hille
rG
war
0.05
4–0
.208
1-3%
1%-
1%4-
66%
1%Lo
Lepo
cinc
lis a
cus (
Mül
ler)
Mar
tin e
t M
elko
nian
Lacu
0.13
0–0
.161
--
29%
--
-W
1
Lepo
cinc
lis o
vum
(Ehr
enb.
) Lem
m. v
ar.
dim
idio
-min
orLo
vo0.
132
–0.1
613%
1-4%
2-3%
16%
9%1-
2%
Mer
ism
oped
ia te
nuis
sim
a Le
mm
.M
ten
0.21
8–0
.091
--
-1%
-1-
36%
LoM
icra
ctin
ium
sp.
Mic
r0.
005
–0.2
43-
--
-26
%-
FM
onor
aphi
dium
con
tort
um (T
hure
t) K
omár
ková
-Leg
nero
váM
con
0.11
2–0
.647
2-3%
-1-
23%
2-16
%2-
5%2-
24%
X1
Mon
orap
hidi
um m
inut
um (N
ägel
i) K
omár
ková
-Leg
nero
váM
min
0.05
6–0
.528
--
-41
%2%
1-10
%X
1
Nitz
schi
a sp
p.N
itz0.
085
0.17
32-
6%3-
35%
1-17
%2-
13%
10-2
9%3%
DPh
orm
idiu
m sp
.Ph
or0.
127
0.03
3-
-22
%1-
2%-
-Tc
Pseu
dana
baen
a lim
netic
a (L
emm
erm
ann)
K
omár
ekPl
im0.
197
0.44
0-
61%
--
--
S1
Pseu
dana
baen
a m
inim
a A
nagn
ostid
isPm
in0.
070
–0.3
86-
-19
%-
-1-
53%
S1Rh
opal
odia
gib
beru
la (E
hren
b.) O
Mül
ler
Rgi
b–0
.328
0.00
91-
28%
--
--
-Ro
mer
ia sp
.R
om–0
.633
0.04
90.
5-16
%-
--
--
Trac
helo
mon
as v
olvo
cina
Ehr
enbe
rgTv
ol–0
.191
–0.5
451-
21%
1-7%
8-80
%5-
36%
2-38
%3-
28%
W2
Braz. J. Biol., 2016, vol. 76, no. 3, pp. 600-610 609
Spatial and temporal variation of phytoplankton in a tropical river
609
contribute to decrease in chlorophyll a, mainly at sites 4 and 6 (February and April 2010).
Considering the phytoplankton descriptor species, the success of flagellate Trachelomonas volvocina (W2) was most likely due to the reduction of flow and accumulation of organic matter, especially in site 3 (with upstream effluents). Euglena variabilis (W1) was also the phytoplankton descriptor species during the rainy season (sites 1, 3 and 4). In lotic habitats, Euglenophyceae growth could be favored by decreasing the flow rate (Reynolds and Descy, 1996) and some species of Trachelomonas and Euglena can respond positively to increasing the nitrate and ammonium concentration (Rosowski, 2003), as observed in this study. Futhermore, this algal class is often associated with the high quantity of organic matter in the aquatic ecosystems (Reynolds et al., 2002; Rosowski, 2003).
The filamentous cyanophycean Geitlerinema splendidum (S1) was an abundant species during the study period, mainly at site 1 as evidenced by the CCA. The characteristics of standing water of this stretch could have favored the success of G. splendidum. This species inhabits turbid layers and tolerates the light deficiency (Reynolds et al., 2002), and can also survive wide variations in conductivity. As noted in this study, site 1 presents high abundance of aquatic macrophytes, especially Nymphaea sp. (rooted with floating leaves). The macrophytes stands in this site may have reduced light penetration, creating favorable conditions for G. splendidum. In tropical streams, Branco et al. (2009) also reported the occurrence of G. splendidum, which according to Komárek and Anagnostidis (2005) is considered a cosmopolitan periphyton species in lentic and lotic environments.
Bacillariophyceae showed high relative density in most sites and seasons, especially in site 2. This river stretch presents the highest slope (4.8 m km-1), which certainly increased water turbulence and this condition is favorable for diatoms because can result in re-suspension of species and nutrients. The high phosphorus availability in the environment can also be contributed to an increase in the functional group D (Nitzschia spp., Cyclotella sp.), which is associated with shallow eutrophic systems and turbid waters, and also appear to be tolerant to flow (Reynolds et al., 2002). This group was also recorded in tropical river associated with turbulent and enriched waters (Soares et al., 2007).
The high density of Chlorophyceae was verified during the period of low water flow. Most species of green algae require good nutrients availability to grow (Happey-Wood, 1988). According to CCA, M. contortum and M. minutum were associated with the sites 4, 5 and 6 in October and December (rainy season), which were characterized by low flow and high values of ammonium and temperature (see PCA). Monoraphidium (X1) is associated with enriched environments and sensitive to nutrient (Reynolds et al., 2002).
The present study showed that the rainfall during the rainy season (El Niño effect) decreased river flow and caused structural changes in phytoplankton. The flow
reduction associated with high phosphorus availability promoted an increase of phytoplankton biomass and density. The functional groups were found to be characteristic of lotic system (D), shallow and enriched (X1), with low light availability (S1, Sn), rich in organic matter (W1), meso-eutrophic (X2, W2) and eutrophic ecosystems (X1, D) (Reynolds et al., 2002; Padisák et al., 2009). The functional groups showed variations in spatial (upper, middle and lower course) and seasonal (dry and rainy) scales. We conclude that phytoplankton structure and functional groups were sensitive to changes in water flow and nutrient availability (seasons and stretches) in tropical Almada River.
Acknowledgements
The authors thank FAPESB (Fundação de Amparo à Pesquisa do Estado da Bahia) for the first author’s Master of Science Fellowship (BOL 0316/2009). We are grateful for the assistance of Laboratório de Biogeoquímica Marinha and Laboratório de Análise e Planejamento Ambiental colleagues of the Universidade Estadual de Santa Cruz.
References
ABONYI, A., LEITÃO, M., LANÇON, A.M. and PADISÁK, J., 2012. Phytoplankton functional groups as indicators of human impacts along the River Loire (France). Hydrobiologia, vol. 698, no. 1, pp. 233-249. http://dx.doi.org/10.1007/s10750-012-1130-0.
AGÊNCIA NACIONAL DE ÁGUAS – ANA, 2015 [viewed 5 February 2015]. Provisão II (53091000) [online]. Brasília: ANA. Available from: http://hidroweb.ana.gov.br/Estacao.asp?Codigo=53091000
ALLAN, J.D. and CASTILLO, M.M., 2007. Stream Ecology: structure and function of running waters. Dordrecht: Springer. 436 p.
BICUDO, C.E.M. and MENEZES, M., 2006. Gêneros de algas de águas continentais do Brasil: chave para identificação e descrições. 2nd ed. São Carlos: Rima. 508 p.
BRANCO, C.C.Z., PERES, C.K., KRUPEK, R.A. and BERTUSSO, F.R., 2009. Macroalgas de ambientes lóticos da região centro-oeste do Paraná, região sul do Brasil. Biota Neotropica, vol. 9, no. 2, pp. 227-236. http://dx.doi.org/10.1590/S1676-06032009000200022.
CENTRO DE PREVISÃO DE TEMPO E ESTUDOS CLIMÁTICOS/ INSTITUTO NACIONAL DE PESQUISAS ESPACIAIS – CPTEC/INPE, 2010a. El Niño continuará atuando nos meses de março a maio de 2010. INFOCLIMA: Boletim de Informações Climáticas do CPTEC/INPE, vol. 17, no. 2, pp. 1-3.
CENTRO DE PREVISÃO DE TEMPO E ESTUDOS CLIMÁTICOS/ INSTITUTO NACIONAL DE PESQUISAS ESPACIAIS – CPTEC/INPE, 2010b [viewed 15 May 2010]. Proclima: Programa de Monitoramento Climático em Tempo Real da Região Nordeste [online]. Available from: http://www6.cptec.inpe.br/proclima2/balanco_hidrico/ balancohidrico.shtml
CROSSETTI, L.O. and BICUDO, C.E.M., 2008. Adaptations in phytoplankton life strategies to imposed change in a shallow urban tropical eutrophic reservoir, Garças Reservoir, over 8 years. Hydrobiologia, vol. 614, pp. 91-105. http://dx.doi.org/10.1007/s10750-008-9539-1.
DEVERCELLI, M., 2010. Changes in phytoplankton morpho-functional groups induced by extreme hydroclimatic events in the
Braz. J. Biol., 2016, vol. 76, no. 3, pp. 600-610610
Santana, L.M. et al.
610
Middle Paraná River (Argentina). Hydrobiologia, vol. 639, no. 1, pp. 5-19. http://dx.doi.org/10.1007/s10750-009-0020-6.
DODDS, W.K., 2006. Eutrophication and trophic state in rivers and streams. Limnology and Oceanography, vol. 51, no. 1_part_2, pp. 671-680. http://dx.doi.org/10.4319/lo.2006.51.1_part_2.0671.
GRASSHOFF, K., ERHARDT, M. and KREMLING, K., 1983. Methods of seawater analysis. Weinheim: Verlag Chemie.
HA, K., KIM, H.-W. and JOO, G.-J., 1998. The phytoplankton succession in the lower part of hypertrophic Nakdong River (Mulgum), South Korea. Hydrobiologia, vol. 369/370, pp. 217-227. http://dx.doi.org/10.1023/A:1017067809089.
HAPPEY-WOOD, C.M., 1988. Ecology of freshwater planktonic green algae. In: S.D. SANDGREN, ed. Growth and reproductive strategies of freshwater phytoplankton. Cambridge: Cambridge University Press, pp. 175-226.
HILTON, J., O’HARE, M., BOWES, M.J. and JONES, J.I., 2006. How green is my river? A new paradigm of eutrophication in rivers. The Science of the Total Environment, vol. 365, no. 1-3, pp. 66-83. http://dx.doi.org/10.1016/j.scitotenv.2006.02.055. PMid:16643991.
INSTITUTO BRASILEIRO DE GEOGRAFIA E ESTATÍTICA – IBGE, 2013 [viewed 15 May 2013]. Sinopse do Censo Demográfico 2010: Bahia [online]. Available from: http://www.censo2010.ibge.gov.br/sinopse/index.php?uf=29&dados=1
INSTITUTO NACIONAL DE PESQUISAS ESPACIAIS – INPE, 2012 [viewed 20 May 2012]. Dados históricos, estação Ilhéus. Available from: http://sinda.crn2.inpe.br/PCD/SITE/novo/site/index.php
KOMÁREK, J. and ANAGNOSTIDIS, K., 1999. Cyanoprokaryota, 1: Chroococcales. In: H. ETTL, G. GARDNER, H. HEYNIG and D. MOLLENHEUER, eds. Süsswasserflora von Mitteleuropa. Jena: Gustav Fischer. 548 p.
KOMÁREK, J. and ANAGNOSTIDIS, K., 2005. Cyanoprokaryota, 2: Oscillatoriales. In: B. BÜNDEL, L. KRIENITZ, G. GÄRDNERG and M. SCHAGERL, eds. Süsswasserflora von Mitteleuropa, München: Elsevier. 759 p.
KOMÁREK, J. and FOTT, B., 1983. Chlorophyceae (Grünalgen), Ordung: Chlorococcales. In: G. HUBER-PESTALOZZI, H. HEYNIG and D. MOLLENHAUER, eds. Das phytoplankton des Sübwassers: systematik und biologie. Stuttgart: E. Schweizerbart’sche Verlagsbuchlandlung. 1044 p.
LEITE, J.O., 1994. Variação das concentrações de P, K, Ca e Mg nas águas fluviais do agrossistema cacaueiro Almada, Bahia. Revista Brasileira de Ciencia do Solo, vol. 18, pp. 483-490.
LELAND, H.V., 2003. The influence of water depth and flow regime on phytoplankton biomass and community structure in a shallow, lowland river. Hydrobiologia, vol. 506-509, no. 1-3, pp. 247-255. http://dx.doi.org/10.1023/B:HYDR.0000008596.00382.56.
LOPES, M.R.M., BICUDO, C.E.M. and FERRAGUT, M.C., 2005. Short term spatial and temporal variation of phytoplankton in a shallow tropical oligotrophic reservoir, southeast Brazil. Hydrobiologia, vol. 542, no. 1, pp. 235-247. http://dx.doi.org/10.1007/s10750-004-8332-z.
MCCUNE, B. and MEFFORD, M.J., 2011. PC-ORD: Multivariate Analysis of Ecological Data. Version 6.0. MjM Software. Oregon: Gleneden Beach.
MOURA, A.N., SEVERIANO, J.S., TAVARES, N.K.A. and DANTAS, E.W., 2013. The role of a cascade of reservoirs and seasonal variation in the phytoplankton structure in a tropical river. Brazilian Journal of Biology = Revista Brasileira de Biologia,
vol. 73, no. 2, pp. 291-298. http://dx.doi.org/10.1590/S1519-69842013000200009. PMid:23917556.
PADISÁK, J., CROSSETTI, L.O. and NASELLI-FLORES, L., 2009. Use and misuse in the application of the phytoplankton functional classification: a critical review with updates. Hydrobiologia, vol. 621, no. 1, pp. 1-19. http://dx.doi.org/10.1007/s10750-008-9645-0.
PARSONS, T.R., MAITA, Y. and LALLI, C.M., 1984. A manual of chemical and biological methods for seawater analysis. New York: Pergamon Press. 173 p.
REYNOLDS, C.S. and DESCY, J.P., 1996. The production, biomass and structure of phytoplankton in large rivers. Archiv für Hydrobiologie, vol. 113, no. 1-4, pp. 161-187.
REYNOLDS, C.S. and GLAISTER, M.S., 1993. Spatial and temporal changes in phytoplankton abundance in the upper and middle reaches of the River Servan. Large Rivers 9. Archiv für Hydrobiologie, vol. 101, pp. 1-22.
REYNOLDS, C.S., 1996. The plant life of the pelagic. Verhandlungen des Internationalen Verein Limnologie, vol. 26, pp. 97-113.
REYNOLDS, C.S., 2000. Hydroecology of river plankton: the role of variability in channel flow. Hydrological Processes, vol. 14, no. 16-17, pp. 3119-3132. http://dx.doi.org/10.1002/1099-1085(200011/12)14:16/17<3119::AID-HYP137>3.0.CO;2-6.
REYNOLDS, C.S., HUSZAR, V., KRUK, C., NASELLI-FLORES, L. and MELO, S., 2002. Towards a functional classification of the freshwater phytoplankton. Journal of Plankton Research, vol. 24, no. 5, pp. 417-428. http://dx.doi.org/10.1093/plankt/24.5.417.
ROSOWSKI, J.R., 2003. Photosynthetic euglenoids. In: J.D. WEHR and R.G. SHEATH, eds. Freshwater algae of north america: ecology and classification. San Diego: Academic Press, pp. 383-416.
SILVA, G.S. and GOMES, R.L., 2010. Aplicação da técnica de avaliação do terreno e análise da fragilidade ambiental da bacia hidrográfica do Rio Almada. Caminhos de Geografia, vol. 11, no. 35, pp. 240-259.
SOARES, M.C.S., HUSZAR, V.L.M. and ROLAND, F., 2007. Phytoplankton dynamics in two tropical rivers with different degrees of human impact (Southeast Brazil). River Research and Applications, vol. 23, no. 7, pp. 698-714. http://dx.doi.org/10.1002/rra.987.
STRICKLAND, J.D.H. and PARSONS, T.R., 1972. A practical handbook of seawater analysis. 2nd ed. Ottawa: Fisheries Research Board Canada. 310 p. Bulletin, no. 167.
TELL, G. and CONFORTI, V., 1986. Euglenophyta pigmentadas de la Argentina. (Bibliotheca Phycologica). Stuttgart: J. Cramer. 301 p.
TORRES, M.L.M., REGO, N.C., NACIF, P.G., LEVY, M.C.T.C. and MOREAU, M., 2001. Programa de Recuperação das Bacias dos Rios Cachoeira e Almada, Diagnóstico Regional. Convênio núcleo de bacias hidrográficas da UESC/superintendência de recursos hídricos do estado da Bahia. Technical Report. Ilhéus: BAHIA/SRH/UESC. vol. 1, tomos 3-5.
UTERMÖHL, H., 1958. Zur Vervollkommung der quantitativen phytoplankton methodik. Mitteilungen Internationale Vereinigung für Theoretische und Angewandte Limnologie, vol. 9, pp. 1-38.
WETZEL, R.G. and LIKENS, G.E., 1991. Limnological Analyses. 2nd ed. New York: Springer-Verlag.