spatial and temporal variations of the concentrations of ... y. q. wang et al.: variations of the...
TRANSCRIPT
Atmos. Chem. Phys., 15, 13585–13598, 2015
www.atmos-chem-phys.net/15/13585/2015/
doi:10.5194/acp-15-13585-2015
© Author(s) 2015. CC Attribution 3.0 License.
Spatial and temporal variations of the concentrations of PM10,
PM2.5 and PM1 in China
Y. Q. Wang1, X. Y. Zhang1, J. Y. Sun1, X. C. Zhang2, H. Z. Che1, and Y. Li1
1State Key Laboratory of Severe Weather, Chinese Academy of Meteorological Sciences, Beijing, China2Meteorological Observation Center, Beijing, China
Correspondence to: Y. Q. Wang ([email protected]) and X. Y. Zhang ([email protected])
Received: 26 March 2015 – Published in Atmos. Chem. Phys. Discuss.: 8 June 2015
Revised: 11 November 2015 – Accepted: 22 November 2015 – Published: 9 December 2015
Abstract. Concentrations of PM10, PM2.5 and PM1 were
monitored at 24 CAWNET (China Atmosphere Watch Net-
work) stations from 2006 to 2014. The highest particulate
matter (PM) concentrations were observed at the stations of
Xian, Zhengzhou and Gucheng, on the Guanzhong Plain and
the Huabei Plain (HBP). The second highest PM concentra-
tions were observed in northeast China, followed by southern
China. According to the latest air quality standards of China,
14 stations reached the PM10 standard, and only 7 stations,
mainly rural and remote stations, reached the PM2.5 stan-
dard. The ratios of PM2.5 to PM10 showed a clear increas-
ing trend from northern to southern China, because of the
substantial contribution of coarse mineral aerosol in northern
China. The ratios of PM1 to PM2.5 were higher than 80 %
at most stations. PM concentrations tended to be highest in
winter and lowest in summer at most stations, and mineral
dust influenced the results in spring. A decreasing interan-
nual trend was observed on the HBP and in southern China
for the period 2006 to 2014, but an increasing trend occurred
at some stations in northeast China. Bimodal and unimodal
diurnal variation patterns were identified at urban stations.
Both emissions and meteorological variations dominate the
long-term PM concentration trend, while meteorological fac-
tors play a leading role in the short term.
1 Introduction
Tropospheric aerosols are important because of their strong
influence on the climate system through both direct and indi-
rect effects. These include the direct effect of scattering and
absorbing radiant energy, and the indirect effect of modifying
the microphysical properties of clouds, and hence their radia-
tive properties and lifetime (Haywood and Boucher, 2000).
They also attract attention because of their adverse effects on
visibility (Watson, 2002) and human health (Delfino et al.,
2005; Pope III and Dockery, 2006). Therefore, the spatial and
temporal variation of aerosols is essential to understand, but
remains a complex subject because of their ephemeral nature
and the complexity of their physical and chemical properties
(Ramanathan et al., 2001).
Particle size is considered a key parameter to define the
impact of particulate matter (PM) on human health; specifi-
cally, fine PM (PM2.5 and PM1) poses a greater health risk
than coarse PM (PM10) (Oberdörster et al., 2005). There
have been numerous network-based observation studies of
the PM2.5 concentration and chemical composition in North
America and Europe. For example, based on a data set across
19 Canadian sites, most of the PM2.5 concentrations were
found to be below 26 µgm−3, and PM2.5 accounted for 49 %
of the measured PM10 (Brook et al., 1997). Meanwhile, El-
dred et al. (1997) reported that PM2.5 and PM10 particulate
concentrations measured at 42 sites of the Interagency Mon-
itoring of Protected Visual Environments (IMPROVE) net-
work over the 1993 seasonal year (March 1993 to Febru-
ary 1994) showed the PM2.5 concentration had a large gradi-
ent from west to east in the US, averaging 3 µgm−3 in most
of the west compared with 13 µgm−3 in the Appalachian re-
gion. Another study, based on 143 IMPROVE sites in the
year 2001, showed that sulfates, carbon and crustal mate-
rial were responsible for most of the measured PM2.5 at
the majority of sites in the US (Malm et al., 2004). The
temporal variation and spatial distribution of PM2.5 con-
centrations have also been reported in Switzerland (Gehrig
Published by Copernicus Publications on behalf of the European Geosciences Union.

13586 Y. Q. Wang et al.: Variations of the concentrations of PM10, PM2.5 and PM1 in China
and Buchmann, 2003), Austria (Gomiscek et al., 2004), and
six central and eastern European countries (Houthuijs et al.,
2001).
As a country with a rapidly developing economy, China
has suffered from a serious air pollution problem in recent
years due to substantial increases in energy consumption and
other related production of large amounts of aerosols and
precursor gas emissions (Zhang et al., 2009). At the coarse
end of the spectrum (PM10), the spatial distribution and inter-
annual variation of concentrations has been comprehensively
studied using a data set accumulated from 86 Chinese cites
(Qu et al., 2010). Furthermore, the chemical compositions of
PM10 samples were investigated at 16 sites over China, and
the result indicated a dominant scattering feature of aerosols
(Zhang et al., 2012). Network-based studies of PM2.5 obser-
vations have, however, been limited to certain seasons in a
single year (Cao et al., 2012), and most other research has
focused on one or more of the largest cities (He et al., 2001;
G. Wang et al., 2002; X. Wang et al., 2006; Wei et al., 1999;
Yao et al., 2002; Zhao et al., 2009; Zheng et al., 2005). The
focus on PM2.5 needs to improve, not least because the grow-
ing problem of heavy haze has compelled the Chinese gov-
ernment to pay greater attention to PM2.5 monitoring and
air quality standards. Indeed, the Ministry of Environmental
Protection of China issued new ambient air quality standards
in 2012, among which the PM2.5 concentration was the first
to be included. Subsequently, the construction of a network
of national environmental PM2.5 monitoring stations began
in 2013.
In this paper, we present a long-term PM10, PM2.5 and
PM1 monitoring data set from 2006 to 2014, based on 24 sta-
tions of CAWNET (China Atmosphere Watch Network), op-
erated by the China Meteorological Administration (CMA).
The spatial pattern of average PM concentration levels and
the relationships among them are reported. In addition, their
seasonal and interannual variations are presented.
2 The near real-time PM data set
The PM10, PM2.5 and PM1 concentrations were monitored
at 24 CAWNET stations from 2006 to 2014 using GRIMM
EDM 180 environmental dust monitor instruments with 31
different size channels at a flow rate of 1.2 Lmin−1. The in-
strument is designed to measure the particle size distribu-
tion and particulate mass, based on a light scattering mea-
surement of individual particles in the sampled air. GRIMM-
developed protocols were used to convert the measured size
number distribution to a mass concentration consistent with
U.S. Environmental Protection Agency protocols for measur-
ing PM using the aerodynamic diameter. A Nafion dryer was
equipped at the inlet to exclude fine particulate water, but the
nonvolatile and semi-volatile components are included in the
measurement result (Grimm and Eatough, 2009). The instru-
ments were calibrated annually using a calibration tower that
Figure 1. Map showing the PM observation stations and bar charts
for their average PM10, PM2.5 and PM1 concentrations (µgm−3).
permitted powder injection (on demand) of aerosol particles
in a wide size range of 0.2–30 µm. The operation was fully
computer-controlled and permitted access to one to three
spectrometers in comparison to one reference “mother unit”.
The 5 min averaged PM10, PM2.5 and PM1 concentrations
were recorded at each station and transported to the CMA
information center hourly in near real-time.
The PM concentration results from the GRIMM instru-
ments were compared to those from tapered element oscil-
lating microbalance (TEOM) instruments reported in a num-
ber of other studies (Grimm and Eatough, 2009; Hansen et
al., 2010). The instruments were in good agreement; lin-
ear regression with TEOM data from Rubidoux (Califor-
nia, USA) yielded a slope of 1.10± 0.05, with an intercept
of −3.9± 4.2 µgm−3 and an uncertainty of 9.9 % (Grimm
and Eatough, 2009). Furthermore, GRIMM and TEOM mea-
surements in Beijing have shown a close linear relationship,
suggesting that optical measurements can be used to de-
rive PM2.5 and account for semi-volatile material in aerosols
(Sciare et al., 2007; Zhao et al., 2011).
The 24 PM observation stations are detailed in Table 1,
and a map of their distribution is given in Fig. 1. Most of the
stations were located in east China, an area of high popula-
tion density and rapid economic development, meaning the
PM emitted from human activities was mainly recorded. The
stations were classified as urban/suburban, rural and remote
stations, according to their location. Unlike rural stations, re-
mote stations were located in areas far away from regions of
strong anthropogenic emissions, and thus natural emissions
and long-range transport of anthropogenic air pollution were
the main sources of PM at these stations.
Atmos. Chem. Phys., 15, 13585–13598, 2015 www.atmos-chem-phys.net/15/13585/2015/

Y. Q. Wang et al.: Variations of the concentrations of PM10, PM2.5 and PM1 in China 13587
Table 1. Description of the PM stations.
Stations Latitude (◦ N) Longitude (◦ E) Altitude (m) Start time Description
Zhengzhou 34.78 113.68 99.0 Jan 2006 Urban, in the center of Zhengzhou, 56 m building.
Chengdu 30.65 104.04 496.0 Mar 2006 Urban, in the center of Chengdu, 91 m building.
Xian 34.43 108.97 363.0 Jan 2006 Urban, in northern margin of Xian, 20 km north of cen-
ter of Xian, 4 m sampling container.
Nanning 22.82 108.35 84.0 Jan 2006 Urban, in Nanning, 140 m hill.
Anshan 41.05 123.00 78.3 Oct 2007 Urban, in Anshan, 10 m building.
Shenyang 41.76 123.41 110.0 Oct 2007 Urban, in Shenyang, 15 m building.
Benxi 41.19 123.47 185.4 Oct 2007 Urban, in Benxi, 12 m building.
Fushun 41.88 123.95 163.0 Oct 2007 Urban, in Fushun, 10 m building.
Qingdao 36.07 120.33 77.2 Mar 2007 Urban, in Qingdao, top of Fulong Shan hill.
Lhasa 29.67 91.13 3663.0 Jan 2006 Urban, in Lhasa, 7 m building.
Siping 43.18 124.33 165.4 Mar 2007 Urban, in Siping, 4 m sampling container.
Panyu 23.00 113.35 5.0 Jan 2006 Suburban, in the Panyu district of Guangzhou, 140 m
hill.
Gucheng 39.13 115.80 15.2 Jan 2006 Suburban, 38 km southwest of Baoding, within area of
rapid urbanization, 8 m building.
42.27 118.97 568.0 Mar 2007 Rural, suburbs of Chifeng, 4 m sampling container.
Dandong 40.05 124.33 13.9 Mar 2007 Rural, suburbs of Dandong, 4 m sampling container.
Erlianhaote 43.65 111.97 965.9 Mar 2007 Rural, suburbs of Erlianhaote, 4 m sampling container.
Yulin 38.43 109.20 1135.0 Jan 2006 Rural, 10 km north of Yulin, at the southeastern edge of
Mu Us desert.
Jinsha 29.63 114.20 416.0 Apr 2006 Rural, 105 km north of Wuhan, 8 m building.
Guilin 25.32 110.30 164.4 Jan 2006 Rural, north margin of Guilin, meteorological observa-
tion field.
Lushan 29.57 115.99 1165.0 Jan 2006 Rural, Kuniubei peak of Mount Lu.
Changde 29.17 111.71 563.0 Jan 2006 Rural, 18 km northwest of Changde, 8 m building.
Dongtan 31.50 121.80 10.0 May 2009 Rural, east of Chongming Island near Shanghai.
Akdala 47.12 87.97 562.0 Sep 2006 Remote, 55 km west of Fuhai, 10 m building.
Shangri-La 28.02 99.73 3580.0 Oct 2006 Remote, 12 km northeast of Shangri-La.
3 Results and discussion
3.1 Average PM10, PM2.5 and PM1 levels in China
The averaged PM concentration values are presented in Ta-
ble 2, and their distributions in Fig. 1. The highest PM10,
PM2.5 and PM1 concentrations were observed at the sta-
tions of Xian (135.4, 93.6 and 77.0 µgm−3, respectively),
Zhengzhou (131.7, 84.8 and 71.0 µgm−3, respectively) and
Gucheng (127.8, 89.7 and 79.4 µgm−3, respectively), which
are located in the most polluted areas of the Huabei Plain
(HBP) and the Guanzhong Plain. Although Gucheng is a sub-
urban site, it is located in the rapid urbanization area around
Beijing, and is therefore subjected to associated large quan-
tities of air pollutants. These areas were also identified by
Zhang et al. (2012) as having experienced similar visibility
changes and large visibility loss in the past 40 years. The sta-
tions all recorded very high coarse- and fine-PM concentra-
tions, implying high emissions of both primary emitted min-
eral particles and secondary anthropogenic particles in these
areas. Qingdao is a coastal city with relatively low PM con-
centrations compared with inland cities on the HBP.
The PM concentrations were also high in northeast China,
which is an established industrial area. The ensemble aver-
age values of the five urban stations of Ansan, Shenyang,
Benxi, Fushun and Siping were 88.8, 58.4 and 49.8 µgm−3,
for PM10, PM2.5 and PM1, respectively. Dandong is a rural
station with relatively low PM concentrations.
The similarity among the PM values for Chifeng, Erlian-
haote and Yulin is due to their location, far from regions of in-
tensive economic development but strongly affected by sand-
storms and dust storms given their proximity to dust source
areas. Thus, the average PM10 concentrations were much
higher than the PM2.5 and PM1 concentrations at these sites.
For example, the average PM10 concentration at Chifeng,
which is surrounded by sandy land, was 88.0 µgm−3, com-
pared with 42.4 and 32.6 µgm−3 for PM2.5 and PM1, respec-
tively.
Chengdu, the capital of the province of Sichuan, is lo-
cated in the Sichuan Basin, another highly polluted area.
High aerosol optical depth and low visibility, due to the poor
dispersion conditions and heavy local industrial emissions,
have been reported for this site (Li et al., 2003; Luo et al.,
2001; Zhang et al., 2012). In the present study, the average
www.atmos-chem-phys.net/15/13585/2015/ Atmos. Chem. Phys., 15, 13585–13598, 2015

13588 Y. Q. Wang et al.: Variations of the concentrations of PM10, PM2.5 and PM1 in China
PM10, PM2.5 and PM1 concentrations were 78.0, 59.5 and
52.7 µgm−3, respectively.
There are three stations in the south China area: Panyu,
located in Guangzhou, the capital of the province of Guang-
dong, which is the center of the Pearl River Delta region;
Nanning, the capital of the province of Guangxi; and Guilin,
a famous tourist city, also located in Guangxi. The ensem-
ble average PM concentrations of these three sites were 55.8,
43.1 and 38.8 µgm−3 for PM10, PM2.5 and PM1, respec-
tively.
Significant visibility loss and relatively high PM10 con-
centrations have been observed over the middle and lower
reaches of the Yangtze River after the 1980s due to the rapid
economic development that has taken place in this region (Qu
et al., 2010; Zhang et al., 2012). Although there was no ur-
ban site available for this study to help quantify the high PM
concentrations in this region, the background conditions and
temporal variance could be determined from the rural site
data. Dongtan, near Shanghai, is located on Chongming Is-
land, where there were low PM concentrations (31.9, 27.4
and 24.8 µgm−3 for PM10, PM2.5 and PM1, respectively) due
to the substantial influence of clean sea air mass. The en-
semble average PM concentrations for Lushan, Changde and
Jinsha were 44.3, 37.2 and 33.6 µgm−3 for PM10, PM2.5 and
PM1, respectively.
Lhasa, the capital of Tibet Autonomous Region, is located
in the center of the Tibetan Plateau at a very high altitude of
3663 m. The PM2.5 and PM1 concentrations in Lhasa were
low, with average values of 14.0 and 9.6 µgm−3, respec-
tively, because of its relatively small population and few in-
dustrial emissions. However, the average PM10 concentration
was 37.7 µgm−3, mainly due to the high amounts of fugitive
dust from dry and bare land and the impacts of regional dust
storm events (Chen et al., 2013). As a result, minerals are the
main constituent of aerosol samples in this area (Zhang et al.,
2012).
The lowest PM concentration values were observed in the
two remote sites of Akdala and Shangri-La. The lower alti-
tude and stronger contribution of soil dust at Akdala (Qu et
al., 2009), located in a dry region, lead to higher PM concen-
trations than at the Shangri-La site.
According to the latest air quality standards of China (an-
nual averaged PM10 and PM2.5 concentrations of 70 and
35 µgm−3), 14 stations reached the PM10 standard, while
only 7 stations, mainly rural and remote stations, reached
the PM2.5 standard. The ratio of substandard (daily averaged
PM10 or PM2.5 concentrations that exceed the standard val-
ues) days to total observation days at each station was cal-
culated using the standard daily averaged PM10 and PM2.5
concentrations of 150 and 75 µgm−3 (Table 2). Substandard
days of PM10 and PM2.5 represented more than 30 and 50 %
of the total period at the three most polluted sites (Xian,
Zhengzhou and Gucheng). The PM2.5 substandard day ratios
at five other stations (Chengdu, Anshan, Shenyang, Benxi
and Siping) were also larger than 20 %.
Average PM10, PM2.5 and PM1 concentrations at ur-
ban/suburban stations in this study were 83.6, 56.3 and
48.3 µgm−3, respectively. Meanwhile, the values were 54.8,
36.3 and 30.8 µgm−3 at rural stations, and 11.9, 7.5 and
6.1 µgm−3 at remote stations. All values were much higher
than results from other countries. For example, the observed
PM concentration in Canada between 1984 to 1993 showed
the average PM2.5 concentration was 14.1 and 10.7 µgm−3
at urban and rural stations, respectively (Brook et al., 1997).
The average PM2.5 values from west to east across the IM-
PROVE network in 1993 (most stations located in rural ar-
eas) were 3 to 13 µgm−3 (Eldred et al., 1997). Observations
in Switzerland from 1998 to 2001 showed average PM10 and
PM2.5 concentrations at urban/suburban stations of 27.7 and
20.1 µgm−3, respectively (Gehrig and Buchmann, 2003). In
Austria, in 1998, the annual mean mass concentrations of
PM10, PM2.5 and PM1 were around 28, 20 and 16 µgm−3,
respectively, at urban sites, and slightly lower at rural sites
(Gomiscek et al., 2004). The average PM10 and PM2.5 con-
centrations were 23.9 and 16.3 µgm−3, respectively, for the
period 2008–2009 in the Netherlands (Janssen et al., 2013).
Between October 2008 and April 2011, the 20 study areas
of the European ESCAPE project showed PM10 and PM2.5
with similar spatial patterns; specifically, low concentrations
in northern Europe and high concentrations in southern and
eastern Europe (Eeftens et al., 2012). With the rapid urban-
ization and corresponding increase in traffic and energy con-
sumption in India, the ambient concentrations of fine PM are
also high. For example, measurements in New Delhi dur-
ing August to December 2007 showed that concentrations
of PM10, PM2.5 and PM1 ranged from 20 to 180 µgm−3 dur-
ing the monsoon season, and from 100 to 500 µgm−3 during
winter (Tiwari et al., 2012).
3.2 Relationships between PM10, PM2.5 and PM1
concentrations
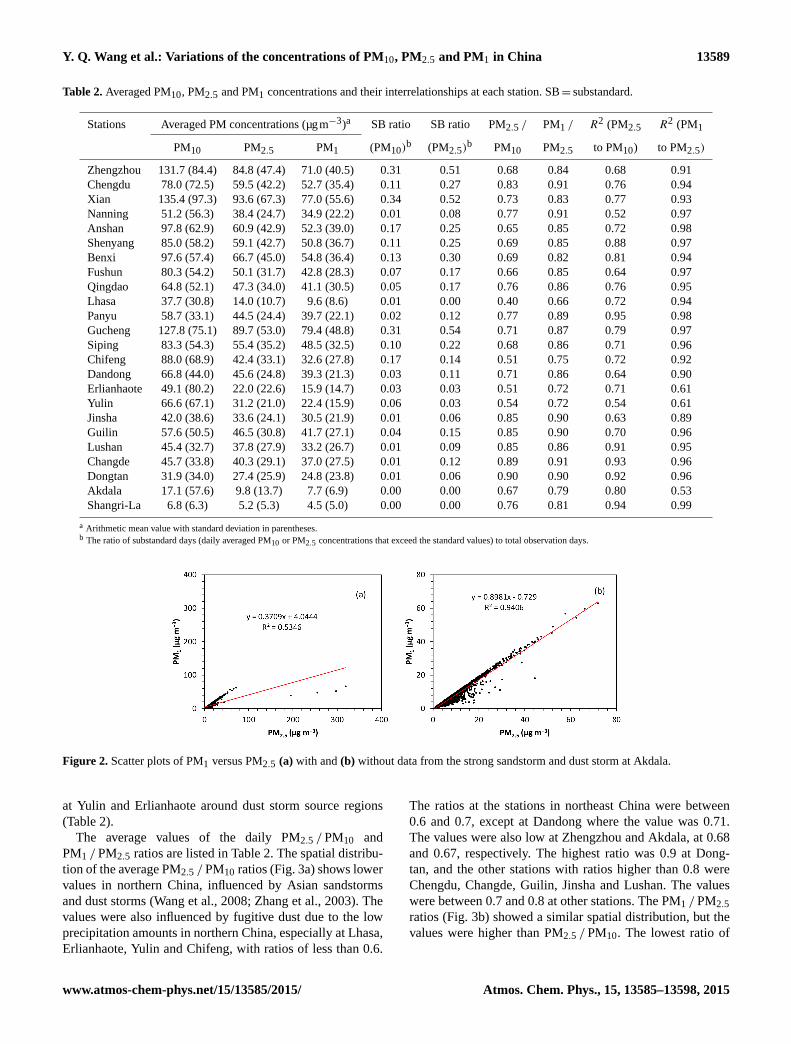
The squared correlation coefficient (R2) values of the linear
fit between PM10 and PM2.5 and between PM1 and PM2.5 are
given in Table 2. Higher values indicate that the two PM size
bins were closer matched in terms of their sources. At most
stations, the R2 values between PM1 and PM2.5 were higher
than the values between PM2.5 and PM10. This is because
PM1 and PM2.5 both belong to fine particle size bins, which
are normally emitted from the same sources. For example,
the R2 values were 0.7857 between PM2.5 and PM10, and
0.9689 between PM1 and PM2.5, at Gucheng. Correlation
analysis is sensitive to outliers, and thus sandstorm events
may have impacted upon the results considerably, due to ab-
normally high concentration values. There were four strong
dust storm event days at Akdala in 2012, on 21 and 22 April,
and 9 and 20 May, which resulted in the four outliers shown
in Fig. 2a, and the low R2 value of 0.5346 between PM1 and
PM2.5. The value increased to 0.9406 when the four outliers
were removed (Fig. 2b). Similar results were also observed
Atmos. Chem. Phys., 15, 13585–13598, 2015 www.atmos-chem-phys.net/15/13585/2015/
Y. Q. Wang et al.: Variations of the concentrations of PM10, PM2.5 and PM1 in China 13589
Table 2. Averaged PM10, PM2.5 and PM1 concentrations and their interrelationships at each station. SB= substandard.
Stations Averaged PM concentrations (µgm−3)a SB ratio SB ratio PM2.5 / PM1 / R2 (PM2.5 R2 (PM1
PM10 PM2.5 PM1 (PM10)b (PM2.5)b PM10 PM2.5 to PM10) to PM2.5)
Zhengzhou 131.7 (84.4) 84.8 (47.4) 71.0 (40.5) 0.31 0.51 0.68 0.84 0.68 0.91
Chengdu 78.0 (72.5) 59.5 (42.2) 52.7 (35.4) 0.11 0.27 0.83 0.91 0.76 0.94
Xian 135.4 (97.3) 93.6 (67.3) 77.0 (55.6) 0.34 0.52 0.73 0.83 0.77 0.93
Nanning 51.2 (56.3) 38.4 (24.7) 34.9 (22.2) 0.01 0.08 0.77 0.91 0.52 0.97
Anshan 97.8 (62.9) 60.9 (42.9) 52.3 (39.0) 0.17 0.25 0.65 0.85 0.72 0.98
Shenyang 85.0 (58.2) 59.1 (42.7) 50.8 (36.7) 0.11 0.25 0.69 0.85 0.88 0.97
Benxi 97.6 (57.4) 66.7 (45.0) 54.8 (36.4) 0.13 0.30 0.69 0.82 0.81 0.94
Fushun 80.3 (54.2) 50.1 (31.7) 42.8 (28.3) 0.07 0.17 0.66 0.85 0.64 0.97
Qingdao 64.8 (52.1) 47.3 (34.0) 41.1 (30.5) 0.05 0.17 0.76 0.86 0.76 0.95
Lhasa 37.7 (30.8) 14.0 (10.7) 9.6 (8.6) 0.01 0.00 0.40 0.66 0.72 0.94
Panyu 58.7 (33.1) 44.5 (24.4) 39.7 (22.1) 0.02 0.12 0.77 0.89 0.95 0.98
Gucheng 127.8 (75.1) 89.7 (53.0) 79.4 (48.8) 0.31 0.54 0.71 0.87 0.79 0.97
Siping 83.3 (54.3) 55.4 (35.2) 48.5 (32.5) 0.10 0.22 0.68 0.86 0.71 0.96
Chifeng 88.0 (68.9) 42.4 (33.1) 32.6 (27.8) 0.17 0.14 0.51 0.75 0.72 0.92
Dandong 66.8 (44.0) 45.6 (24.8) 39.3 (21.3) 0.03 0.11 0.71 0.86 0.64 0.90
Erlianhaote 49.1 (80.2) 22.0 (22.6) 15.9 (14.7) 0.03 0.03 0.51 0.72 0.71 0.61
Yulin 66.6 (67.1) 31.2 (21.0) 22.4 (15.9) 0.06 0.03 0.54 0.72 0.54 0.61
Jinsha 42.0 (38.6) 33.6 (24.1) 30.5 (21.9) 0.01 0.06 0.85 0.90 0.63 0.89
Guilin 57.6 (50.5) 46.5 (30.8) 41.7 (27.1) 0.04 0.15 0.85 0.90 0.70 0.96
Lushan 45.4 (32.7) 37.8 (27.9) 33.2 (26.7) 0.01 0.09 0.85 0.86 0.91 0.95
Changde 45.7 (33.8) 40.3 (29.1) 37.0 (27.5) 0.01 0.12 0.89 0.91 0.93 0.96
Dongtan 31.9 (34.0) 27.4 (25.9) 24.8 (23.8) 0.01 0.06 0.90 0.90 0.92 0.96
Akdala 17.1 (57.6) 9.8 (13.7) 7.7 (6.9) 0.00 0.00 0.67 0.79 0.80 0.53
Shangri-La 6.8 (6.3) 5.2 (5.3) 4.5 (5.0) 0.00 0.00 0.76 0.81 0.94 0.99
a Arithmetic mean value with standard deviation in parentheses.b The ratio of substandard days (daily averaged PM10 or PM2.5 concentrations that exceed the standard values) to total observation days.
Figure 2. Scatter plots of PM1 versus PM2.5 (a) with and (b) without data from the strong sandstorm and dust storm at Akdala.
at Yulin and Erlianhaote around dust storm source regions
(Table 2).
The average values of the daily PM2.5 / PM10 and
PM1 / PM2.5 ratios are listed in Table 2. The spatial distribu-
tion of the average PM2.5 / PM10 ratios (Fig. 3a) shows lower
values in northern China, influenced by Asian sandstorms
and dust storms (Wang et al., 2008; Zhang et al., 2003). The
values were also influenced by fugitive dust due to the low
precipitation amounts in northern China, especially at Lhasa,
Erlianhaote, Yulin and Chifeng, with ratios of less than 0.6.
The ratios at the stations in northeast China were between
0.6 and 0.7, except at Dandong where the value was 0.71.
The values were also low at Zhengzhou and Akdala, at 0.68
and 0.67, respectively. The highest ratio was 0.9 at Dong-
tan, and the other stations with ratios higher than 0.8 were
Chengdu, Changde, Guilin, Jinsha and Lushan. The values
were between 0.7 and 0.8 at other stations. The PM1 / PM2.5
ratios (Fig. 3b) showed a similar spatial distribution, but the
values were higher than PM2.5 / PM10. The lowest ratio of
www.atmos-chem-phys.net/15/13585/2015/ Atmos. Chem. Phys., 15, 13585–13598, 2015

13590 Y. Q. Wang et al.: Variations of the concentrations of PM10, PM2.5 and PM1 in China
Figure 3. Spatial distribution of the average ratios of (a) PM2.5 / PM10 and (b) PM1 / PM2.5.
0.6 was also observed at Lhasa, and the values at most sta-
tions in southern China were greater than or equal to 0.9.
3.3 Seasonal variation
The seasonal variations of PM10 concentrations (Fig. 4a)
show that winter and spring were the most polluted seasons
at all sites except Lushan, where the highest value was ob-
served in autumn. This result is consistent with a previous
study of PM10 variation across China from 2000 to 2006 (Qu
et al., 2010). The higher winter concentrations were caused
by higher emissions during the cold season from heating,
and more stagnant weather conditions with a lower plane-
tary boundary layer. The opposite conditions and more pre-
cipitation due to the summer monsoon resulted in the low-
est PM10 concentration values in summer. Spring is the dust
storm season in east Asia (Qian et al., 2004; Wang et al.,
2008; Zhou and Zhang, 2003), which leads to high PM10
concentrations in dust source regions and downwind areas
in northern China. For example, the PM10 concentrations in
spring were much higher than other seasons at the dust source
sites of Yulin and Erlianhaote.
For PM2.5, winter was still the most polluted season at
most sites, while the contribution of spring decreased sub-
stantially in northern China (Fig. 4b). This trend can be fur-
ther observed from the PM1 distribution (Fig. 6c); hence, the
average PM1 concentration in spring was lowest at Yulin,
Xian, Zhengzhou, Gucheng and Benxi. The seasonal varia-
tion patterns were very similar for PM10, PM2.5 and PM1 at
the sites in southern China.
A spatial distribution map of the seasonal average
PM2.5 / PM10 ratios is given in Fig. 6d. For the reasons given
above, lower PM2.5 / PM10 ratios were observed in spring at
the northern China sites, while the seasonal variation was not
significant at the southern China sites.
3.4 Interannual variation
The interannual variation of PM2.5 at various stations is
presented in Fig. 5. Significant decreasing trends were ob-
served at the HBP stations of Zhengzhou and Gucheng
(Fig. 5a). The annual averaged PM2.5 concentration de-
creased from 123.4 to 65.2 µgm−3 at Zhengzhou, and from
101.0 to 69.1 µgm−3 at Gucheng, during 2006–2014. At
Zhengzhou, the lowest value of 63.7 µgm−3 occurred in
2012, and this level was maintained in subsequent years;
however, at Gucheng, the value increased suddenly in 2012
to 95.1 µgm−3 and then declined rapidly during 2013 and
2014. At Xian, the annual averaged PM2.5 concentration de-
creased from 2006 to 2009, increased until 2011, and then
decreased again until 2014 (Fig. 5a).
For the stations in northeast China, a significant increasing
trend of the PM2.5 concentration was observed at Shenyang
and Benxi from 2006 to 2013, followed by a decrease in
2014 (Fig. 5b). The peak value at Shenyang was especially
high in 2013 at 123.1 µgm−3, while the values were less than
60 µgm−3 in the other years. The highest values were ob-
served in 2009 at Anshan and Dandong, but the lowest val-
ues were in 2014 at Anshan and 2010 at Dandong. A general
decreasing trend was observed at Siping, with a few fluctu-
ations. At Fushun, the value decreased from 2006 to 2011
and then increased to 2013, followed by a slight decrease in
2014.
For the stations along the middle and lower reaches of the
Yangtze River, a common trend was a clearly lower PM2.5
value in 2014 than in 2013, but the general variation trend
was not significant (Fig. 5c). A peak value of 33.7 µgm−3
was observed in 2012 at Dongtan, followed by a decrease
to 24.12 µgm−3 over the subsequent 2 years. At Jinsha and
Changde, the highest value was in 2013, while it was in 2009
at Lushan.
Atmos. Chem. Phys., 15, 13585–13598, 2015 www.atmos-chem-phys.net/15/13585/2015/

Y. Q. Wang et al.: Variations of the concentrations of PM10, PM2.5 and PM1 in China 13591
Figure 4. Spatial distribution of the seasonal average concentrations (µgm−3) of (a) PM10, (b) PM2.5, (c) PM1 and (d) ratios of
PM2.5 / PM10.
For the stations in southern China, a general decreasing
trend was observed, with obvious fluctuations (Fig. 5d). Pa-
nyu is a typical station in the center of the Pearl River Delta
economic area of China. The PM2.5 value decreased from
64.6 µgm−3 in 2006 to 41.6 µgm−3 in 2014, and the lowest
value was 36.4 µgm−3 in 2010. A similar trend was observed
in Guilin, with a stronger fluctuation from 2010 to 2012. At
Nanning, a peak value occurred in 2010 and the lowest value
of 28.5 µgm−3 was observed in 2012.
Generally, the PM10 and PM1 interannual variation trends
were similar to that of PM2.5 at most stations. For example,
a similar trend and fluctuations were observed at the stations
presented in Figs. 8 and 7a. A difference in the trend was
observed at Zhengzhou from 2013 to 2014, with a significant
increasing trend of PM10 and decreasing trend of PM1.
3.5 Diurnal variation
The average diurnal variation of PM2.5 at various stations is
presented in Fig. 7. Pronounced diurnal variation of PM2.5
was observed at most urban sites, with an obvious morning
peak at around 07:00 to 08:00 (Beijing Time) and an after-
noon valley between 14:00 and 16:00. At some stations, an
evening peak could be recognized at around 19:00 to 21:00
(Siping, Benxi, Fushun, Anshan, Guilin and Panyu) or mid-
night (Gucheng, Xian). This bimodal pattern was also ob-
served in Beijing (Zhao et al., 2009). A unimodal pattern,
without an evening peak, could be identified at some other
stations (Zhengzhou, Shenyang and Nanning). In urban ar-
eas, the morning and evening peaks are contributed to by en-
hanced anthropogenic activity during rush hour, and the af-
ternoon valley is mainly due to a higher atmospheric mixing
layer, which is beneficial for air pollution diffusion. Panyu
station is on top of a 140 m hill at the edge of Guangzhou,
www.atmos-chem-phys.net/15/13585/2015/ Atmos. Chem. Phys., 15, 13585–13598, 2015

13592 Y. Q. Wang et al.: Variations of the concentrations of PM10, PM2.5 and PM1 in China
50
60
70
80
90
100
110
120
130
140
2006 2007 2008 2009 2010 2011 2012 2013 2014
PM2.5concen
tration (μg m
−3)
ZhengzhouXianGucheng
(a)
30
40
50
60
70
80
90
100
110
120
130
2006 2007 2008 2009 2010 2011 2012 2013 2014
PM2.5concen
tration (μg m
−3)
Anshan Shenyang
Benxi Fushun
Siping Dandong
(b)
0
10
20
30
40
50
60
70
80
90
2006 2007 2008 2009 2010 2011 2012 2013 2014
PM2.5concen
tration (μg m
−3)
JinshaLushanChangdeDongtan
(c)
20
25
30
35
40
45
50
55
60
65
70
2006 2007 2008 2009 2010 2011 2012 2013 2014
PM2.5concen
tration (μg m
−3)
PanyuNanningGuilin
(d)
Figure 5. Interannual variations of PM2.5 concentrations at the stations (a) on the HBP and Guanzhong Plain, (b) in northeast China, (c) along
the middle and lower reaches of the Yangtze River and (d) in southern China.
Figure 6. Interannual variation of (a) PM10 concentration and (b) PM1 concentration at Zhengzhou, Xian and Gucheng.
so aged and mixing aerosols were observed with a weak ur-
ban diurnal variation pattern. Similar to Panyu station, the
rural stations along the middle and lower reaches of the
Yangtze River showed no typical urban diurnal variation pat-
tern (Fig. 7c). The diurnal variation in PM1 and PM10 con-
centrations was similar to that of PM2.5 at most stations.
3.6 Emission and meteorological influences
PM loadings are controlled by both emissions and meteoro-
logical conditions. Even mineral dust emissions from deserts
and volatile organic compound (VOC) emissions from veg-
etation are controlled by meteorological factors, e.g., wind
speed and temperature. The major source of air pollution in
China is anthropogenic emissions, especially with the rapid
economic development that has taken place in recent years.
As such, the average PM concentration pattern is determined
largely by emissions, but meteorological factors also play an
important role by affecting pollutant diffusion and deposi-
tion.
The distributions of the anthropogenic emissions of black
carbon (BC), PM2.5, SO2 and NO2 in 2010, based on
the HTAP_v2 harmonized emissions database (Janssens-
Maenhout et al., 2015), are presented in Fig. 8. The emissions
data for the east Asia domain were supplied by the MICS-
Asia project. The spatial distributions of species show a con-
sistent pattern with the high emissions regions of the HBP,
Guanzhong Plain, Sichuan Basin, middle and lower reaches
Atmos. Chem. Phys., 15, 13585–13598, 2015 www.atmos-chem-phys.net/15/13585/2015/

Y. Q. Wang et al.: Variations of the concentrations of PM10, PM2.5 and PM1 in China 13593
Figure 7. Diurnal variation of PM2.5 concentrations at the stations (a) on the HBP and Guanzhong Plain, (b) in northeast China, (c) along
the middle and lower reaches of the Yangtze River and (d) in southern China.
Figure 8. Anthropogenic emission distributions at a resolution of 0.1◦× 0.1◦, based on HTAP_v2 data set: (a) BC; (b) PM2.5; (c) SO2;
(d) NOx (units: kgm−2 s−2).
of the Yangtze River, Pearl River Delta region and the in-
dustrial region of northeast China, which is generally similar
to the PM loadings pattern for China (Fig. 1). For example,
most stations subjected to PM pollution are located in the
highest emissions region of the HBP. This indicates that av-
erage PM loadings are controlled by the quantity of anthro-
pogenic emissions in central-eastern China.
www.atmos-chem-phys.net/15/13585/2015/ Atmos. Chem. Phys., 15, 13585–13598, 2015

13594 Y. Q. Wang et al.: Variations of the concentrations of PM10, PM2.5 and PM1 in China
Figure 9. Emissions differences between 2010 and 2008 at a resolution of 0.1◦× 0.1◦, based on HTAP_v2 data set: (a) BC; (b) PM2.5;
(c) SO2; (d) NOx (units: kgm−2 s−2).
The trends in emissions for China during 2005–2010
(S. X. Wang et al., 2014) show that emissions of SO2 and
PM2.5 in east Asia decreased by 15 and 12 %, respectively,
while emissions of NOx and non-methane VOCs increased
by 25 and 15 %, respectively. Driven by changes in emis-
sions, PM2.5 concentrations decreased by 2–17 µgm−3 over
most of the North China Plain, the Yangtze River Delta and
the Pearl River Delta (Zhao et al., 2013). This could explain
the general decreasing trend with respect to PM during 2006–
2010 at most stations (Fig. 5). The spatial distributions of
emissions differences between 2010 and 2008 for BC, PM2.5,
SO2 and NO2 are plotted in Fig. 9, based on the HTAP_v2
emission data set. BC emissions decreased from 2008 to
2010 in most regions of east China, except the provinces of
Hebei, Shanxi, Hubei, Jiangxi and Inner Mongolia (Fig. 9a).
More areas of China showed a reduction in PM2.5 emissions,
except Shanxi and Hubei (Fig. 9b). The difference in SO2
emissions (Fig. 9c) showed a similar pattern to that of BC but
with an increasing trend apparent in northeast China. NOx
emissions increased in most regions of central-eastern China,
except in the provinces of Guangdong, Zhejiang and Taiwan
(Fig. 9d). This trend was driven by the rapid growth of in-
dustry and transportation, combined with inadequate control
strategies (S. X. Wang et al., 2014).
Although there are no published emissions data after 2010,
it is believed that emissions have to a certain extent been
controlled well since the end of 2013, with the arrival of
China’s “Action Plan for the Control of Air Pollution” docu-
ment. This could explain the general decreasing trend for the
year 2014 at most stations (Fig. 5).
Central-eastern China experienced severe haze events in
January 2013, with a regionally stable planetary boundary
layer and low mixing height (H. Wang et al., 2014). The
daily averaged PM2.5 concentrations and meteorological fac-
tors of wind speed and relative humidity for this period at
Zhengzhou, Shenyang and Nanning are plotted in Fig. 10.
Zhengzhou is located in this haze region, and experienced
very high PM2.5 concentrations, especially from 6 to 15 Jan-
uary. The wind speed variation was negatively related with
PM2.5 concentrations. The rapid increase in PM2.5 concen-
trations from 1 to 6 January corresponded with the rapid de-
crease in wind speed during the same period. Also, the strong
wind speed on 24 January resulted in low PM2.5 concentra-
tion. Shenyang and Nanning are not located in this severe
haze region, but still suffered some fine-PM days that month.
A negative correlation between PM2.5 and wind speed was
also observed at Shenyang and Nanning. In general, relative
humidity (RH) was positively related with the PM2.5 concen-
tration if no precipitation occurred. Otherwise, high RH with
precipitation corresponded to low PM concentrations due to
wet deposition.
In terms of interannual variation, the negative correlation
between PM2.5 concentrations and wind speed, and the pos-
itive correlation between PM2.5 concentrations and relative
humidity, could not be well identified (Fig. 11). Although a
generally similar variation trend for the PM10 concentration
Atmos. Chem. Phys., 15, 13585–13598, 2015 www.atmos-chem-phys.net/15/13585/2015/

Y. Q. Wang et al.: Variations of the concentrations of PM10, PM2.5 and PM1 in China 13595
0
0.5
1
1.5
2
2.5
3
3.5
0
50
100
150
200
250
1/1 1/6 1/11 1/16 1/21 1/26 1/31
Wind spee
d (m
s−1 )
PM2.5(μg m
−3)
Date
PM2.5Wind speed
Zhengzhou
0
10
20
30
40
50
60
70
80
90
100
0
50
100
150
200
250
1/1 1/6 1/11 1/16 1/21 1/26 1/31
Relativ
e hu
midity
(%)
PM2.5(μg m
−3)
Date
PM2.5RH
Zhengzhou
0
0.5
1
1.5
2
2.5
3
3.5
4
4.5
5
0
50
100
150
200
250
1/1 1/6 1/11 1/16 1/21 1/26 1/31
Wind spee
d (m
s−1 )
PM2.5(μg m
−3)
Date
PM2.5Wind speed
Shenyang
0
10
20
30
40
50
60
70
80
90
100
0
50
100
150
200
250
1/1 1/6 1/11 1/16 1/21 1/26 1/31
Relativ
e hu
midity
(%)
PM2.5(μg m
−3)
Date
PM2.5RH
Shenyang
0
0.5
1
1.5
2
2.5
3
3.5
0
20
40
60
80
100
120
140
160
180
1/1 1/6 1/11 1/16 1/21 1/26 1/31
Wind spee
d (m
s−1 )
PM2.5(μg m
−3)
Date
PM2.5Wind speed
Nanning
40
50
60
70
80
90
100
0
20
40
60
80
100
120
140
160
180
1/1 1/6 1/11 1/16 1/21 1/26 1/31
Relativ
e hu
midity
(%)
PM2.5(μg m
−3)
Date
PM2.5RH
Nanning
(a) (b)
(c) (d)
(e) (f)
Figure 10. Daily averaged PM2.5 concentrations vs wind speed and relative humidity at (a, b) Zhengzhou, (c, d) Shenyang and (e, f) Nanning
in January 2013.
and relative humidity was observed at Zhengzhou, this was
not found at other stations. The PM2.5 concentration in 2014
was lower than in 2013, but the relative humidity was much
higher and the wind speed much lower. The interannual vari-
ation of PM concentrations could not be explained solely
by meteorological factors, although a recent model simula-
tion for the period 2004–2012 with anthropogenic emissions
fixed at the values for the year 2006 indicated that variations
in meteorological fields dominated the interannual variation
in aerosols in China (Mu and Liao, 2014). Long term, both
emissions and meteorological factors play important roles;
while in the short term, meteorological factors play a leading
role – at least in the absence of significant changes in emis-
sions.
4 Conclusion
Spatial and temporal trends in PM pollution were examined
using PM10, PM2.5 and PM1 concentration data at 24 sta-
tions from 2006 to 2014. Relatively high PM concentrations
were observed at most stations. There were 14 stations that
reached the PM10 annual air quality standard, but only 7 sta-
tions, mostly rural and remote stations, reached the PM2.5
annual air quality standard of China. The highest PM con-
centrations were observed at the stations on the HBP and
Guanzhong Plain. In addition, the percentage value of sub-
standard days of PM2.5 was greater than 50 %, indicating
very serious air pollution in these regions. PM pollutants are
also a serious problem in the industrial regions of northeast
China and the Sichuan Basin. The PM concentrations were
relatively lower in southern areas of China, but the averaged
PM2.5 concentration was still higher than the national stan-
dard.
Given they are both fine particles, PM1 and PM2.5 were
more closely correlated than PM2.5 and PM10. The cor-
relations were sensitive to the effect of outlier data at
those stations heavily impacted by dust storm events. More
dust aerosol was observed in northern China, and thus the
PM2.5 / PM10 ratios increased from less than 0.6 to around
0.9 when moving from north to south China.
Pronounced seasonal variations were observed at most sta-
tions, with the highest concentrations in winter and lowest
www.atmos-chem-phys.net/15/13585/2015/ Atmos. Chem. Phys., 15, 13585–13598, 2015

13596 Y. Q. Wang et al.: Variations of the concentrations of PM10, PM2.5 and PM1 in China
70
72
74
76
78
80
82
84
0
10
20
30
40
50
60
70
80
90
2006 2007 2008 2009 2010 2011 2012 2013 2014
Relativ
e hu
midity
(%)
PM con
centratio
n (µg m
‐3)
Year
PM10 ‐ PM2.5PM2.5 ‐ PM1PM1RH
Nanning
1.3
1.4
1.5
1.6
1.7
1.8
1.9
0
10
20
30
40
50
60
70
80
90
2006 2007 2008 2009 2010 2011 2012 2013 2014
Wind spee
d (m
/s)
PM con
centratio
n (µg m
‐3)
Year
PM10 ‐ PM2.5PM2.5 ‐ PM1PM1Wind speed
Nanning
46
48
50
52
54
56
58
60
62
64
0
50
100
150
200
250
2006 2007 2008 2009 2010 2011 2012 2013 2014
Relativ
e hu
midity
(%)
PM con
centratio
n (µg m
‐3)
Year
PM10 ‐ PM2.5PM2.5 ‐ PM1PM1RH
Zhengzhou
1.8
1.85
1.9
1.95
2
2.05
2.1
2.15
2.2
0
50
100
150
200
250
2006 2007 2008 2009 2010 2011 2012 2013 2014
Wind spee
d (m
/s)
PM con
centratio
n (µg m
‐3)
Year
PM10 ‐ PM2.5PM2.5 ‐ PM1PM1WS
Zhengzhou
(a) (b)
(c) (d)
Figure 11. Interannual variation of PM10, PM2.5 and PM1 vs. wind speed and relative humidity at (a, b) Zhengzhou and (c, d) Nanning.
concentrations in summer. PM10 concentrations were also
high in spring, due to the contribution of dust storm events,
especially at those stations near to dust source regions. For
PM2.5 and PM1, spring was a relatively low concentration
season, especially at the stations in northern China. Also,
low PM2.5 / PM10 ratios were observed in spring in northern
China.
An interannual decreasing trend was observed in the HBP
and southern China from 2006 to 2014, but an increasing
trend occurred at some stations in northeast China, and no
significant trend could be found over the middle and lower
reaches of the Yangtze River. Annual-averaged PM concen-
trations were lower in 2014 than 2013 at most stations, which
may indicate an improvement in air quality following the
“Action Plan for the Control of Air Pollution” document is-
sued by the Chinese government in September 2013.
Bimodal and unimodal diurnal variation patterns were
identified at urban stations. A negative correlation between
PM concentrations and wind speed was found for the short
term, but variations in emissions must be considered for
long-term trend analyses, especially in rapidly developing
countries.
This network-based observation data set provides the
longest continuous record of fine particle concentrations in
China, but it features a limited number of stations and an
uneven spatial distribution. Importantly, there is no represen-
tative city site in the Yangtze River Delta region, which is
an important haze area in China. The emissions sources and
meteorological factors influencing PM spatial and temporal
patterns in China still require further study.
Acknowledgements. This work was supported by grants from the
National Key Project of Basic Research (2014CB441201), the
National Natural Science Foundation of China (41275167) and the
Chinese Academy of Meteorological Sciences (2013Z007). It was
also supported by the Climate Change Collaborative Innovation
Center and the CMA Innovation Team of Haze-fog Observation
and Forecasts.
Edited by: S. Gong
References
Brook, J. R., Dann, T. F., and Burnett, R. T.: The relationship among
TSP, PM10, PM2.5, and Inorganic constituents of atmospheric
particulate matter at multiple Canadian locations, J. Air Waste
Manage. Assoc., 47, 2–19, 1997.
Cao, J.-J., Shen, Z.-X., Chow, J. C., Watson, J. G., Lee, S.-C., Tie,
X.-X., Ho, K.-F., Wang, G.-H., and Han, Y.-M.: Winter and Sum-
mer PM2.5 Chemical Compositions in Fourteen Chinese Cities,
J. Air Waste Manage. Assoc., 62, 1214–1226, 2012.
Chen, S., Huang, J., Zhao, C., Qian, Y., Leung, R., and Yang, B.:
Modeling the transport and radiative forcing of Taklimakan dust
over the Tibetan Plateau: A case study in the summer of 2006, J.
Geophys. Res., 118, 797–812, 2013.
Delfino, R. J., Sioutas, C., and Malik, S.: Potential role of ultrafine
particles in associations between airborne particle mass and car-
diovascular health, Environ. Health Persp., 113, 934–946, 2005.
Atmos. Chem. Phys., 15, 13585–13598, 2015 www.atmos-chem-phys.net/15/13585/2015/

Y. Q. Wang et al.: Variations of the concentrations of PM10, PM2.5 and PM1 in China 13597
Eeftens, M., Tsai, M.-Y., Ampe, C., Anwander, B., Beelen, R., Bel-
lander, T., Cesaroni, G., Cirach, M., Cyrys, J., Hoogh, K. D.,
Nazelle, A. D., Vocht, F. D., Declercq, C., Dedele, A., Eriksen,
K., Galassi, C., Grazuleviciene, R., Grivas, G., Heinrich, J., Hoff-
mann, B., Iakovides, M., Ineichen, A., Katsouyanni, K., Korek,
M., Krämer, U., Kuhlbusch, T., Lanki, T., Madsen, C., Meliefste,
K., Mölter, A., Moslerm, G., Nieuwenhuijsen, M., Oldenwen-
ing, M., Pennanen, A., Probst-Hensch, N., Quass, U., Raaschou-
Nielsen, O., Ranzi, A., Stephanou, E., Sugiri, D., Udvardy, O.,
Vaskövi, É., Weinmayr, G., Brunekreef, B., and Hoek, G.: Spa-
tial variation of PM2.5, PM10, PM2.5 absorbance and PMcoarse
concentrations between and within 20 European study areas and
the relationship with NO2 – Results of the ESCAPE project, At-
mos. Environ., 62, 303–317, 2012.
Eldred, R. A., Cahill, T. A., and Flocchini, R. G.: Composition
of PM2.5 and PM10 aerosols in the IMPROVE network, J. Air
Waste Manage. Assoc., 47, 194–203, 1997.
Gehrig, R. and Buchmann, B.: Characterising seasonal variations
and spatial distribution of ambient PM10 and PM2.5 concentra-
tions based on long-term Swiss monitoring data, Atmos. Envi-
ron., 37, 2571–2580, 2003.
Gomiscek, B., Hauck, H., Stopper, S., and Preining, O.: Spatial and
temporal variations of PM1, PM2.5, PM10 and particle number
concentration during the AUPHEP-project, Atmos. Environ., 38,
3917–3934, 2004.
Grimm, H. and Eatough, D. J.: Aerosol Measurement: The Use of
Optical Light Scattering for the Determination of Particulate Size
Distribution, and Particulate Mass, Including the Semi-Volatile
Fraction, J. Air Waste Manage. Assoc., 59, 101–107, 2009.
Hansen, J. C., Woolwine, W. R., Bates, B. L., Clark, J. M., Kuprov,
R. Y., Mukherjee, P., Murray, J. A., Simmons, M. A., Waite, M.
F., Eatough, N. L., Eatough, D. J., Long, R., and Grover, B. D.:
Semicontinuous PM2.5 and PM10 mass and composition mea-
surements in Lindon, Utah, during winter 2007, J. Air Waste
Manage. Assoc., 60, 346–355, 2010.
Haywood, J. and Boucher, O.: Estimates of the direct and indirect
radiative forcing due to tropospheric aerosols: A review, Rev.
Geophys., 38, 513–543, 2000.
He, K., Yang, F., Ma, Y., Zhang, Q., Yao, X., Chan, C. K., Cadle,
S., Chan, T., and Mulawa, P.: The characteristics of PM2.5 in
Beijing, China, Atmos. Environ., 35, 4959–4970, 2001.
Houthuijs, D., Breugelmans, O., Hoek, G., Vaskövi, É., Mihá-
liková, E., Pastuszka, J. S., Jirik, V., Sachelarescu, S., Lolova,
D., Meliefste, K., Uzunova, E., Marinescu, C., Volf, J., Leeuw,
F. D., Wiel, H. v. d., Fletcher, T., Lebret, E., and Brunekreef, B.:
PM10 and PM2.5 concentrations in Central and Eastern Europe:
results from the Cesar study, Atmos. Environ., 35, 2757–2771,
2001.
Janssen, N. A. H., Fischer, P., Marra, M., Ameling, C., and Cassee,
F. R.: Short-term effects of PM2.5, PM10 and PM2.5−10 on daily
mortality in the Netherlands, Sci. Tot. Environ., 463–464, 20–26,
2013.
Janssens-Maenhout, G., Crippa, M., Guizzardi, D., Dentener, F.,
Muntean, M., Pouliot, G., Keating, T., Zhang, Q., Kurokawa,
J., Wankmüller, R., Denier van der Gon, H., Kuenen, J. J.
P., Klimont, Z., Frost, G., Darras, S., Koffi, B., and Li, M.:
HTAP_v2.2: a mosaic of regional and global emission grid maps
for 2008 and 2010 to study hemispheric transport of air pollu-
tion, Atmos. Chem. Phys., 15, 11411–11432, doi:10.5194/acp-
15-11411-2015, 2015.
Li, C., Mao, J., Lau, K.-H. A., Chen, J.-C., Yuan, Z., Liu, X., Zhu,
A., and Liu, G.: Characteristics of distribution and seasonal vari-
ation of aerosol optical depth in eastern China with MODIS prod-
ucts, Chinese Sci. Bull., 48, 2488–2495, 2003.
Luo, Y., Lu, D., Zhou, X., Li, W., and He, Q.: Characteristics of the
spatial distribution and yearly variation of aerosol optical depth
over China in last 30 years, J. Geophys. Res., 106, 14501–14513,
2001.
Malm, W. C., Schichtel, B. A., Pitchford, M. L., Ashbaugh, L. L.,
and Eldred, R. A.: Spatial and monthly trends in speciated fine
particle concentration in the United States, J. Geophys. Res., 109,
D03306, doi:10.1029/2003JD003739, 2004.
Mu, Q. and Liao, H.: Simulation of the interannual variations of
aerosols in China: role of variations in meteorological parame-
ters, Atmos. Chem. Phys., 14, 9597–9612, doi:10.5194/acp-14-
9597-2014, 2014.
Oberdörster, G., Oberdörster, E., and Oberdörster, J.: Nanotoxicol-
ogy: An Emerging Discipline Evolving from Studies of Ultrafine
Particles, Environ. Health Persp., 113, 823–839, 2005.
Pope III, C. A. and Dockery, D. W.: Health effects of fine particulate
air pollution: Lines that connect, J. Air Waste Manage. Assoc.,
56, 709–742, 2006.
Qian, W. H., Tang, X., and Quan, L. S.: Regional characteristics of
dust storms in China, Atmos. Environ., 38, 4895–4907, 2004.
Qu, W.-J., Zhang, X.-Y., Arimoto, R., Wang, Y.-Q., Wang, D.,
Sheng, L.-F., and Fu, G.: Aerosol background at two remote
CAWNET sites in western China, Sci. Tot. Environ., 407, 3518–
3529, 2009.
Qu, W. J., Arimoto, R., Zhang, X. Y., Zhao, C. H., Wang, Y. Q.,
Sheng, L. F., and Fu, G.: Spatial distribution and interannual
variation of surface PM10 concentrations over eighty-six Chinese
cities, Atmos. Chem. Phys., 10, 5641–5662, doi:10.5194/acp-10-
5641-2010, 2010.
Ramanathan, V., Crutzen, P. J., Kiehl, J. T., and Rosenfeld, D.:
Aerosols, climate, and the hydrological cycle, Science, 294,
2119–2124, 2001.
Sciare, J., Cachier, H., Sarda-Este‘ve, R., Yu, T., and Wang, X.:
Semi-volatile aerosols in Beijing (R.P. China): Characterization
and influence on various PM2.5 measurements, J. Geophys. Res.,
112, D18202, doi:10.1029/2006JD007448, 2007.
Tiwari, S., Chate, D. M., Pragya, P., Ali, K., and Bisht, D. S.: Varia-
tions in Mass of the PM10, PM2.5 and PM1 during the Monsoon
and Winter at New Delhi, Aerosol Air Qual. Res., 12, 20–29,
2012.
Wang, G., Huang, L., Gao, S., Gao, S., and Wang, L.: Measure-
ments of PM10 and PM2.5 in urban area of Nanjing, China and
the assessment of pulmonary deposition of particle mass, Atmos.
Environ., 48, 689–695, 2002.
Wang, H., Xu, J., Zhang, M., Yang, Y., Shen, X., Wang, Y., Chen,
D., and Guo, J.: A study of the meteorological causes of a pro-
longed and severe haze episode in January 2013 over central-
eastern China, Atmos. Environ., 98, 146–157, 2014.
Wang, S. X., Zhao, B., Cai, S. Y., Klimont, Z., Nielsen, C. P.,
Morikawa, T., Woo, J. H., Kim, Y., Fu, X., Xu, J. Y., Hao, J.
M., and He, K. B.: Emission trends and mitigation options for
air pollutants in East Asia, Atmos. Chem. Phys., 14, 6571–6603,
doi:10.5194/acp-14-6571-2014, 2014.
www.atmos-chem-phys.net/15/13585/2015/ Atmos. Chem. Phys., 15, 13585–13598, 2015

13598 Y. Q. Wang et al.: Variations of the concentrations of PM10, PM2.5 and PM1 in China
Wang, X., Bi, X., Sheng, G., and Fu, J.: Chemical composition and
sources of PM10 and PM2.5 aerosols in Guangzhou, China, En-
viron. Monit. Assess., 119, 425–439, 2006.
Wang, Y. Q., Zhang, X. Y., Gong, S. L., Zhou, C. H., Hu, X. Q.,
Liu, H. L., Niu, T., and Yang, Y. Q.: Surface observation of sand
and dust storm in East Asia and its application in CUACE/Dust,
Atmos. Chem. Phys., 8, 545–553, doi:10.5194/acp-8-545-2008,
2008.
Watson, J.: Visibility: Science and Regulation, J. Air Waste Man-
age. Assoc., 52, 628–713, 2002.
Wei, F., Teng, E., Wu, G., Hu, W., Wilson, W. E., Chapman, R. S.,
Pau, J. C., and Zhang, J.: Ambient concentrations and elemental
composition of PM10 and PM2.5 in four Chinese cities, Environ.
Sci. Technol., 33, 4188–4193, 1999.
Yao, X., Chan, C. K., Fang, M., Cadle, S., Chan, T., Mulawa, P., He,
K., and Ye, B.: The water-soluble ionic composition of PM2.5 in
Shanghai and Beijing, China, Atmos. Environ., 36, 4223–4234,
2002.
Zhang, Q., Streets, D. G., Carmichael, G. R., He, K. B., Huo, H.,
Kannari, A., Klimont, Z., Park, I. S., Reddy, S., Fu, J. S., Chen,
D., Duan, L., Lei, Y., Wang, L. T., and Yao, Z. L.: Asian emis-
sions in 2006 for the NASA INTEX-B mission, Atmos. Chem.
Phys., 9, 5131–5153, doi:10.5194/acp-9-5131-2009, 2009.
Zhang, X. Y., Gong, S. L., Zhao, T. L., Arimoto, R., Wang, Y.
Q., and Zhou, Z. J.: Sources of Asian dust and role of climate
change versus desertification in Asian dust emission, Geophys.
Res. Lett., 30, 2272, doi:10.1029/2003GL018206, 2003.
Zhang, X. Y., Wang, Y. Q., Niu, T., Zhang, X. C., Gong, S.
L., Zhang, Y. M., and Sun, J. Y.: Atmospheric aerosol com-
positions in China: spatial/temporal variability, chemical sig-
nature, regional haze distribution and comparisons with global
aerosols, Atmos. Chem. Phys., 12, 779–799, doi:10.5194/acp-
12-779-2012, 2012.
Zhao, B., Wang, S., Dong, X., Wang, J., Duan, L., Fu, X., Hao, J.,
and Fu, J.: Environmental effects of the recent emission changes
in China: implications for particulate matter pollution and soil
acidification, Environ. Res. Lett., 8, 024031, doi:10.1088/1748-
9326/8/2/024031, 2013.
Zhao, X., Zhang, X., Xu, X., Xu, J., Meng, W., and Pu, W.: Seasonal
and diurnal variations of ambient PM2.5 concentration in urban
and rural environments in Beijing, Atmos. Environ., 43, 2893–
2900, 2009.
Zhao, X., Zhang, X., Pu, W., Meng, W., and Xu, X.: Scattering prop-
erties of the atmospheric aerosol in Beijing, China, Atmos. Res.,
101, 799–808, 2011.
Zheng, M., Salmon, L. G., Schauer, J. J., Zeng, L., Kiang, C. S.,
Zhang, Y., and Cass, G. R.: Seasonal trends in PM2.5 source con-
tributions in Beijing, China, Atmos. Environ., 39, 3967–3976,
2005.
Zhou, Z. J. and Zhang, G. C.: Typical severe dust storms in north-
ern China during 1954–2002, Chinese Sci. Bull., 48, 2366–2370,
2003.
Atmos. Chem. Phys., 15, 13585–13598, 2015 www.atmos-chem-phys.net/15/13585/2015/