spatial clustering technique for data mining
TRANSCRIPT
0
Spatial Clustering Technique for Data Mining
Yuichi Yaguchi, Takashi Wagatsuma and Ryuichi OkaThe University of Aizu
Japan
1. Introduction
For mining features from the social web, analysis of the shape, detection of network topologyand corresponding special meanings and also clustering of data become tools, because theinformation obtained by these tools can create useful data behind the social web by revealingits relationships and the relative positions of data. For example, if we want to understand theeffect of someone’s statement on others, it is necessary to analyze the total interaction betweenall data elements and evaluate the focused data that results from the interactions. Otherwise,the precise effect of the data cannot be obtained. Thus, the effect becomes a special feature ofthe organized data, which is represented by a suitable form in which interaction works well.The feature, which is included by social web and it is effect someone’s statement, may be theshape of a network or the particular location of data or a cluster.So far, most conventional representations of the data structure of the social web use networks,because all objects are typically described by the relations of pairs of objects. The weak aspectof network representation is the scalability problem when we deal with huge numbers ofobjects on the Web. It is becoming standard to analyze or mine data from networks in thesocial web with hundreds of millions of items.Complex network analysis mainly focuses on the shape or clustering coefficients of the wholenetwork, and the aspects and attributes of the network are also studied using semistructureddata-mining techniques. These methods use the whole network and data directly, but theyhave high computational costs for scanning all objects in the network.For that reason, the network node relocation problem is important for solving these social-webdata-mining problems. If we can relocate objects in the network into a new space inwhich it is easier to understand some aspects or attributes, we can more easily show orextract the features of shapes or clusters in that space, and network visualization becomesa space-relocation problem.Nonmetric multidimensional scaling (MDS) is a well-known technique for solving new-spacerelocation problems of networks. Kruskal (1964) showed how to relocate an object inton-dimensional space using interobject similarity or dissimilarity. Komazawa & Hayashi (1982)solved Kruskal’s MDS as an eigenvalue problem, which is called quantification method IV(Q-IV). However, these techniques have limitations for cluster objects because the stress,which is the attraction or repulsive force between two objects, is expressed by a linear formula.Thus, these methods can relocate exact positions of objects into a space but it is difficult totranslate clusters into that space.This chapter introduces a novel technique called Associated Keyword Space (ASKS) for thespace-relocation problem,which can create clusters from object correlations. ASKS is based on
16
www.intechopen.com

2 Data Mining
Q-IV but it uses a nonlinear distancemeasure, space uniformalization, to preserve average andvariance in the new space, sparse matrix calculations to reduce calculation costs and memoryusage, and iterative calculation to improve clustering ability. This method allows objects to beextracted into strict clusters and finds novel knowledge about the shape of the whole network,and also finds partial attributes. The method also allows construction of multimedia retrievalsystems that combine all media types into one space.Section 2 surveys social-web data-mining techniques, especially clustering ofnetwork-structured data. In Section 3, we review spatial clustering techniques such asQ-IV and ASKS. Section 4 shows the results of a comparison of Q-IV and ASKS, and alsoshows the clustering performance between ASKS and the K-nearest neighbor technique in anetwork. Section 5 explains an example application utilizing ASKS. Finally, we summarizethis chapter in Section 6.
2. Related work
2.1 Shape of the networkData-mining techniques for network-like relational data structures have been studiedintensively recently. Examining the shape of a network or determining a clusteringcoefficient for each object is an important topic for complex networks (Boccaletti et al.(2006)), because these properties indicate clear features of whole or partially structurednetworks. Watts & Strogatz (1998) explained that human relationships exhibit a small-worldphenomenon, and Albert & Barabasi (2002) showed that the link structure of web documentshas the scale-free property. These factors, the small-world phenomenon, which has lognof radius of n objects in the network, and the scale-free property, which has a power-lawdistribution of the rate number of degree, are found in many real network-like data suchas protein networks (Jeong et al. (2001)), metabolic networks (Jeong et al. (2000)), routingnetworks (Chen et al. (2004)), costar networks (Yan & Assimakopoulos (2009)), and coauthornetworks (Barabasi & Crandall (2003)). The clustering coefficient (Soffer & Vazquez (2005)) isanother measure of network shape and of the local density around an object in a network.Although the clustering of coefficients can extract “how much an object is included in a bigcluster”, it is not able to identify actual objects that are included in a cluster. Thus, to extractobjects into a cluster, the nearest-neighbor technique can be applied to extract objects intothe cluster (Wang et al. (2008)), but it is difficult to check the actual cluster size. Hierarchicalclustering is another useful technique (Boccaletti et al. (2006)), but it is still difficult to find thedensity of a cluster.
2.2 Web mining categorizationWeb mining applications can be categorized into the following three groups.
1. Web content mining retrieves useful information by performing text mining.
2. Web structure mining discovers communities and the relevance of pages based onhyperlink structures.
3. Web usage mining analyzes user access patterns from access logs and click histories.
An excellent review of Web mining can be found in Kosala & Blockeel (2000).In terms of the above categorization, we have developed an algorithm forWeb content miningYaguchi et al. (2006); Ohnishi et al. (2006). This tool helps a user discover text information bydisplaying the hyperlink structure between relatedWeb pages. The following subsection givesa summary of related work on Web content and structure mining methods.
306 New Fundamental Technologies in Data Mining
www.intechopen.com

Spatial Clustering Technique for Data Mining 3
2.3 Web data miningMany schemes have used hyperlink structures to extract valuable information from the WebCarriere & Kazman (1997); Kleinberg (1999); Pirolli et al. (1996); Spertus (1997).Dean et al. introduced two algorithms to identify related Web pages: one derived fromthe HITS algorithm Kleinberg (1999) and the other based on cocitation relationships.To increase accuracy, the HITS algorithm has been combined with content informationBharat & Henzinger (1998); Chakrabarti et al. (1999); Modha & Spangler (2000).He et al. proposed a method to retrieve pages related to a query given by a user that groupedpages into distinct topics He et al. (2001). In the process, they introduced similarity metricsbased on text information, hyperlink structure, and cocitation relationships.Moise et al. treated the problem of how to find related pages effectively (Moise et al. (2003)).They proposed three approaches: hyperlink-based, content-based, and hybrid approaches.They developed an algorithm and showed that it outperformed conventional algorithms inthe precision of its retrieved results.In general, related Web pages are densely connected to each other by hyperlinks, and graphmining approaches can be used to discover such clusters of related Web pages, which arecalled “Web communities.” Recent approaches to the discovery of Web communities aredescribed in ( Murata (2003)), and the requirements for graph mining algorithms suitable forthe discovery of Web communities are also discussed.Youssefi et al. applied data mining and information visualization techniques to Web domains,aiming to benefit from the combined power of human visual perception and computing ability(Youssefi et al. (2004)).Liu et al. modeled a Web site’s content structure in terms of its topic hierarchy by utilizingthree types of information associated with aWeb site: hyperlink structure, directory structure,and Web page content (Liu & Yang (2005)).
3. Spatial clustering
3.1 Nonmetric multidimensional scalingThe problem of creating a new N-dimensional space using the correspondence of pairs ofobjects is the same as the nonmetric multidimensional scaling (MDS) problem. The metricMDS was first proposed in Young and Householder’s study (Young & Householder (1938)),where numerical affinity values were used, and the nonmetric MDS was also presented usingonly orders of affinities (Shepard (1972); Kruskal (1964)). We describe brief definition fornonmetric MDS of Kruskal’s approach.In the study of nonmetric MDS, let N denote the dimension of the space in which objects areallocated, and let each object be numbered i and its location be denoted by xi. The similarityor dissimilarity (nonnegative value) between objects i and j is defined by δi and the Euclideandistance between them is defined as dij = −(xj − xi)
2. Now, object xi is given a more suitableposition xi as a next state by utilizing δi , and the new distance between objects i and j is alsoset as dij = −(xj − xi)
2. Then, the stress S can be defined as:
S =
√
√
√
√
√
√
√
∑i<j
d2ij
∑i<j
(dij − dij)2. (1)
307Spatial Clustering Technique for Data Mining
www.intechopen.com
4 Data Mining
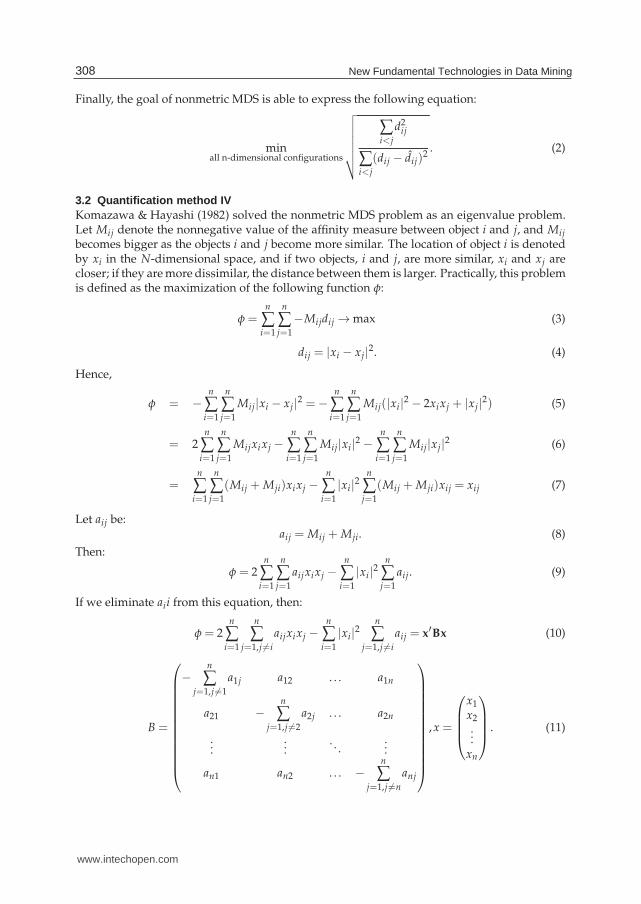
Finally, the goal of nonmetric MDS is able to express the following equation:
minall n-dimensional configurations
√
√
√
√
√
√
√
∑i<j
d2ij
∑i<j
(dij − dij)2. (2)
3.2 Quanti fication method IVKomazawa & Hayashi (1982) solved the nonmetric MDS problem as an eigenvalue problem.Let Mij denote the nonnegative value of the affinity measure between object i and j, and Mij
becomes bigger as the objects i and j become more similar. The location of object i is denotedby xi in the N-dimensional space, and if two objects, i and j, are more similar, xi and xj arecloser; if they aremore dissimilar, the distance between them is larger. Practically, this problemis defined as the maximization of the following function φ:
φ =n
∑i=1
n
∑j=1
−Mijdij →max (3)
dij = |xi − xj|2. (4)
Hence,
φ = −n
∑i=1
n
∑j=1
Mij|xi − xj |2 = −
n
∑i=1
n
∑j=1
Mij(|xi|2 − 2xixj + |xj|
2) (5)
= 2n
∑i=1
n
∑j=1
Mijxixj −n
∑i=1
n
∑j=1
Mij|xi|2 −
n
∑i=1
n
∑j=1
Mij|xj|2 (6)
=n
∑i=1
n
∑j=1
(Mij + Mji)xixj −n
∑i=1
|xi|2
n
∑j=1
(Mij + Mji)xij = xij (7)
Let aij be:aij = Mij + Mji. (8)
Then:
φ = 2n
∑i=1
n
∑j=1
aijxixj −n
∑i=1
|xi|2
n
∑j=1
aij. (9)
If we eliminate aii from this equation, then:
φ = 2n
∑i=1
n
∑j=1,j �=i
aijxixj −n
∑i=1
|xi|2
n
∑j=1,j �=i
aij = x′Bx (10)
B =
⎛
⎜
⎜
⎜
⎜
⎜
⎜
⎜
⎜
⎜
⎜
⎜
⎜
⎝
−n
∑j=1,j �=1
a1j a12 . . . a1n
a21 −n
∑j=1,j �=2
a2j . . . a2n
......
. . ....
an1 an2 . . . −n
∑j=1,j �=n
anj
⎞
⎟
⎟
⎟
⎟
⎟
⎟
⎟
⎟
⎟
⎟
⎟
⎟
⎠
,x =
⎛
⎜
⎜
⎜
⎝
x1x2...xn
⎞
⎟
⎟
⎟
⎠
. (11)
308 New Fundamental Technologies in Data Mining
www.intechopen.com

Spatial Clustering Technique for Data Mining 5
F(k)
2a|k| - a 2
-a 0 k2-2 a
Fig. 1. Nonlinear function used in ASKS.
Maximizing x′Bx under the condition x
′x = const, requires solving equation (3):
φ∗ = x′Bx− λx′x− c (12)
∂φ∗
∂x= Bx− λIx = 0 (13)
. Finally, equation (3) becomes the following equation:
(B− λI)x = 0. (14)
This eigenvalue problem can be solved more quickly if matrix B is sparse. However, thismethod requires all N eigenvalues to be positive. Normally, to ensure eigenvalues arepositive, a sufficiently large value must be subtracted from all elements of B. Thus, thecalculation time and memory requirement becomes O(N2) in many cases.
3.3 Associated keyword space (ASKS)ASKS is a nonlinear version of MDS and is effective for noisy data Takahashi & Oka (2001).This section explains ASKS and describes how to calculate it.Let N denote the spatial dimension of an allocated object. Each object is indexed by i and itslocation is defined by xi . The distance is measured by the formula F:
dij = −F(xj − xi). (15)
F has a parameter a and is defined as:
F(k) =
{
|k|2 (|k| < a)2a|k| − a2 (|k| ≥ a).
(16)
Figure 1 shows a plot of this function.Three types of constraints on the distribution of objects are specified to decide the amount ofspace to be allocated to similar objects in distinguishable clusters:
1. make the original point the center of gravity for the objects;
309Spatial Clustering Technique for Data Mining
www.intechopen.com

6 Data Mining
Fig. 2. Uniformalization types used in ASKS.
2. obtain covariance matrices such that dispersion in any direction creates the same value;and
3. uniformalize the objects in a radially from origin.
Figure 2 shows the method for uniformalization in the super-sphere. Uniformalization isuseful for clustering noisy data that otherwise tend to distribute connections too evenly acrossthe data.
3.4 Iterative solution of nonlinear optimizationThe criterion function of ASKS is:
J(x1,x2, . . . ,xn) = ∑i
∑j
{−MijF(xj − xi)} →max (17)
Mij is an affinity (a nonnegative value) between objects i and j. It is calculated from theco-occurrence of objects i and j. The partial derivative of J with respect to xi gives the formulafor determining the values of xi that maximize J:
∂
∂xi∑i
∑j
{−MijF(xj − xi)} ≡ 0, (18)
∑j
MijF′(xj − xi)≡ 0. (19)
The derivative of F is:
F′(k) =
{
2k (|k| < a)
2a k|k|
(|k| ≥ a),(20)
310 New Fundamental Technologies in Data Mining
www.intechopen.com

Spatial Clustering Technique for Data Mining 7
and parameter a is junction of linear and non-linear distance measure for controlling density.Next, define D by:
D(k) =
{
2 (|k| < a)2a|k|
(|k| ≥ a), , (21)
from which we derive the expression:
F′(xj − xi) = D(xj − xi)(xj − xi). (22)
The following iterative computation converges to the solution xi.
xt+1i =
∑j MijD(x(t)j − x
(t)i )x
(t)j
∑j MijD(x(t)j − x
(t)i )
(23)
The three constraints must be enforced at each step of the iterative computation for allvariables xi (i = 1,2, . . . ,n).
4. Experiment
4.1 Comparison of Q-IV and ASKSThe effectiveness of ASKS is shown by comparing its performance with that of Q-IV.Assume that 1,000,000 objects are to be clustered into C categories of 100, 1000, or 10,000objects. We generated a set of affinity data between objects Mij(1 ≤ i ≤ C,1 ≤ j ≤ C), whereeach Mij took a value of 1 if objects i and j belonged to the same category, and 0 otherwise.We counted the numbers for the first case (Ni) and the second case (No), and then we definedRi as the sum of the affinities in a class for the first case and Ro as the sum of the affinitiesbetween classes for the second case. If objects i and j belonged to the same category, then Mij
was set to Mij = 1 with a probability of Ri/Ni, and the other values of Mij were set to Mij = 0.In the same way, if objects i and j belonged to different categories, the value of Mij was set toMij = 1 according to Ro/No. The ratio of Ro/Ri expresses the level of noise, where a value ofzero denoted no noise and larger values (which could be > 1.0) denoted a high level of noise.Both methods were applied to the case of 1000 categories. The Q-IV method is characterizedby linear optimization and standard distributions of the various noise levels. The clusteringresults for the Q-IV approach are shown in Figure 3, where a subset of 20,000 objects belongingto 20 categories is plotted to aid visualization. The ASKSmethod is characterized by nonlinearoptimization and a uniform distribution of the various noise levels. The results for the ASKSmethod under the same conditions are shown in Figure 4. These results show that the ASKStechnique is superior to the Q-IV approach because ASKS can gather objects belonging tothe same category into a more compact space and can distinguish categories at higher noisevalues.To give a comparison numerically, we measured the ratio of the Standard Distribution (SD)in the associated spaces. The parameter Si is the sum of the SD of objects i and j that belongto the same category, and So is the same sum when the objects are in different categories. Anideal MDS system would gather objects of the same category into a single point, causing thevalue Si = 0. Therefore, we can compare the effectiveness of the above methods in terms ofthe ratio Si/So.Experiments were performed using a range of noise levels (0.01≤ Ri/Ro ≤ 100.0) and variousnumbers of categories. Figure 5(a) shows the results for 100,000 objects in 50 categories for the
311Spatial Clustering Technique for Data Mining
www.intechopen.com

8 Data Mining
Fig. 3. Allocation of items by Q-IV. Noise level (Ro/Ri) [left = 0.01, 0.1, 1.0, right = 100.0].
Fig. 4. Allocation of items by ASKS. Noise level (Ro/Ri) [left = 0.01, 0.1, 1.0, right = 100.0].
same conditions as those shown in Figures 3 and 4. Figure 5(b) shows the results for 100,000objects with 500 categories, and Figure 5(c) shows the results for 5000 categories.Another experiment was also performed to show the effect of parameter a in equation (20). Ifa = 2, then the function of ASKS is same as Q-IV without uniformalization. Thus, we cancall this case as uniformalized Q-IV. Now, we set 100,000 samples, which belong to 1000classes, into three-dimensional space. Figure 6 shows a comparison study on noise robustnessbetween uniformalized Q-IV and ASKS with a= 0.2, and the number of iteration is set to 200.From this figure, Q-IV could not discriminate the classes when ratio Ro/Ri = 0.1 but ASKSstill easily finds the clusters.Figure 7 explains the effect of parameter a which is the junction of the group of linear andnon-linear distance functions. In this figure, if parameter a is getting smaller, then each clusterbecomes tighter but the speed of convergence is slower.To check the dense of clustering, we separate the clustering space into 20× 20× 20 boxes andwe count the number of objects in each box. Figure 8 shows that the result, which is indicatedby the red circled area, is perfectly clustered one or several groups, because each class in thedataset consists of 100 elements, and we can distinctively see in the graph where a box hasmore than 100 elements. Q-IV was unable to cluster these objects when a = 0.01 and a = 0.1,but ASKS was able to perform that clearly.
Fig. 5. Relationship between Ro/Ri and So/Si using 100,000 samples: (a) 50, (b) 500, and (c)5000 classes (for 2000, 200, and 20 samples/class, respectively.) For the larger noise levels(Ro/Ri > 10), there is little difference in efficiency between the conventional method (upperline) and the proposed method (lower line).
312 New Fundamental Technologies in Data Mining
www.intechopen.com

Spatial Clustering Technique for Data Mining 9
Q-IV
ASKSa = 0.2
Noise Ratio
0.001 0.01 0.1 1
Fig. 6. Comparison study on noise robustness between uniformalized Q-IV and ASKS witha = 0.2.
5. Application examples
5.1 Text retrieval systemTakahashi & Oka (2001) constructed a text retrieval system using ASKS. From this study, theyplanned to search similar Japanese documents from fj news group which belongs to a newssystem on the Internet. It gathered 3.7 million articles from 1985 to 2000, and the number ofwords was approximately 520,000. The result of ASKS clustering shows that the study wasable to find the associated word such as the word “Tabasco” and “Hot cod ovum” can befound around the word “Mustard” in the space which has same property “Hot”, or “Rice”,“Laver”, “Soybean paste soup” and “Egg” also can be found around “Soybean paste”, whichare usually appeared in Japanese breakfast(figure 9).
5.2 Multimedia clusteringWagatsuma et al. (2009) also constructed Web mining system using ASKS was performed asfollows.
1. Create an affinity matrix for each of several media-content items and merge these matrices.
2. Create 3D coordinates and allocates each item (e.g., URL or text) by using ASKS.
3. Analyze the associated space.
In this experiment, Web pages were crawled from the page “Office of Prime Minister ofJapan” 1 to a maximum hyperlink depth of four and with no restriction on URL domains.A total of 1371 pages were collected, with included words of 6948 types, and images of 579types. Textual informationwas analyzed byMeCab 2, an open-source Japanese morphologicalanalyzer. This study used three types of media, namely Web page hyperlinks, text, and imagedata.
1http://www.kantei.go.jp/2http://mecab.sourceforge.net/
313Spatial Clustering Technique for Data Mining
www.intechopen.com

10 Data Mining
2.0
1.0
0.6
0.2
0.0555
2 4 6 8 10
Num. of Iteration
a =
Intra-Class Variance: Sw Interclass Variance: Sm
0.00001
0.0001
0.001
0.01
0.1
1
0 1 2 3 4 5 6 7 8 9 1011121314151617181920
0.05
0.2
0.4
0.6
0.8
1
1.2
1.4
1.6
1.8
2
0
0.1
0.2
0.3
0.4
0.5
0.6
0.7
0 1 2 3 4 5 6 7 8 9 10 11 12 13 14 15 16 17 18 19 20
0.05
0.2
0.4
0.6
0.8
1
1.2
1.4
1.6
1.8
2
1
10
100
1000
10000
100000
0 1 2 3 4 5 6 7 8 9 1011121314151617181920
0.05
0.2
0.4
0.6
0.8
1
1.2
1.4
1.6
1.8
2
Interclass Variance
Intra-Class Variance
Num. of Iter. Num. of Iter. Num. of Iter.
a = a = a =
Sw Sm Sm/Sw
Fig. 7. Comparison study on the effect of parameter a to capability of clustering
5.2.1 Calculation of the af finity matrixIn this experiment, the affinity information could be specified in terms of six matrices (seeFigure 10). This study defined the meaning of semantic similarity for each affinity matrix asfollows.
1. Web page hyperlink structure (page vs. page)Increase affinity by 1 when there is a hyperlink from a page to the other page.
314 New Fundamental Technologies in Data Mining
www.intechopen.com

Spatial Clustering Technique for Data Mining 11
Q-IV
ASKSa = 0.2
Num. of Iteration
Num. of Elements
Num. of Iteration
Including a Boxel
Num. of Boxels Rate for
Num. of Boxels Rate for
Num. of Elements
Including a Boxel
Ro/Ri = 0.001 Ro/Ri = 0.01 Ro/Ri = 0.1
Ro/Ri = 0.001 Ro/Ri = 0.01 Ro/Ri = 0.1
Fig. 8. Comparison study on clustering ability in 3D space: We set 20× 20× 20 small boxesinto 3D affinity space, and count the number of boxes which have the same the number ofobjects inside.
2. Word co-occurrence in a sentence (word vs. word)If a word appears in a sentence with other words, then their affinity is calculated accordingto the interword distances. If word i and word j appear in a sentence, the distance dij isspecified as 1 plus the number of words appearing between them. Then the affinity of thetwo words is defined as:
dij = 1−dij − 1
L,
Associated keyword spacefor words into fj news group Around the “Musterd” Around the “Miso”
Fig. 9. ASKS in text retrieval system.
315Spatial Clustering Technique for Data Mining
www.intechopen.com

12 Data Mining
Fig. 10. The affinity matrix represents the presence of semantic similarity between types ofmedia or content (Web page hyperlinks, text, and images.) This affinity matrix is created bymerging six affinity matrices for the separate types.
where L(= 10) is the maximum allowed distance between two words. This definition wasdeveloped in Ohnishi et al. (2006).
3. Similarity between images (image vs. image)All of the images used in aWeb page have a mutual affinity. This affinity is most frequentlycalculated in terms of the distances of the correlation of their color histograms. To calculatethe affinity between image i and image j, with histograms Hi and Hj, their distance dij isdefined as:
dij =〈Hi,Hj〉
(‖Hi‖ · ‖Hj‖).
This study uses the binarized values:
dij =
{
1 i f dij ≥ 0.5,
0 otherwise.
4. Word occurrence in a Web page (page vs. word)If a word appears in a certain page, then the affinity between them is calculated using theTerm Frequency—Inverse Document Frequency (TF-IDF).
5. Image occurrence in a Web page (page vs. image)If an image appears in a certain page, then the affinity between them is set to 1.
6. Image occurrence with word (word vs. image)If an image has a word defined by an alt tag, then the affinity between the image and thealtword is available.
316 New Fundamental Technologies in Data Mining
www.intechopen.com

Spatial Clustering Technique for Data Mining 13
Fig. 11. Visualized associated space with merged affinity matrix. Each allocated nodeexpresses a Web page, a word, or an image. This study can find several clusters in thisassociated space.
5.3 Merging the af finity matricesAfter all six affinity matrices are created, they are simply concatenated into one matrix (seeFigure 10). This merged affinity matrix represents the semantic similarities within the varioustypes of media or content.
5.3.1 Visualization of the associated spaceThis study has developed software to visualize and analyze the 3D-associated space generatedby the affinity matrix, called Visualize ASKS. It allows users to recognize the correlationsbetween items more intuitively. The study also found several clusters in the associated spaceof our example (see Figure 11).
5.3.2 Cluster investigationThis study targeted one cluster constructed from neighboring items to analyze the featuresof the allocation in the association space generated by the affinity matrix involving severalmedia. This study also selected one word within the cluster (the name of a previous PrimeMinister of Japan “Junichiro Koizumi”) as the source word, and analyzed the space within a0.1 radius of this word. Note that the association space has a radius of 1.0.The target area included the following three elements.
317Spatial Clustering Technique for Data Mining
www.intechopen.com

14 Data Mining
Fig. 12. Images gathered in the target area. There is little semantic similarity among them.These were all of the images in the Web pages reached by a few hyperlink steps from theseed page.
– Pages: A large number of Web page nodes existed in the target area, but semanticallydissimilar pages were also mixed in with these pages.
– Words: Examples of several words in the target area (translated from Japanese into English)were
cabinet official, prime minister, ministry, media person, interview, talk, cabinetsecretariat, safety, and government.
Many words linked to politics, the economy, and the names of the previous Prime Ministerof Japan were gathered in the target area.
– Images: Three images were gathered in the target area, as shown in Figure 12. The firstimage appeared in a Web page referring to the Japanese governmental problem expressedthe word “kidnapping” in Japanese 3. The second image was used in the home page of the“Prime Minister of Japan and His Cabinet” 4. The third image is a facial portrait imageof the previous Prime Minister of Japan, “Junichiro Koizumi”, found in the Web page“Introducing Previous Prime Ministers of Japan” 5.These images do not have high mutual semantic similarity scores, as calculated by ourdefinition in Section refsubsec:definition. These were the only images in the Web pagesreached by a few hyperlink steps from the seed page.
A noteworthy feature is that both of the items linked strongly to each other are found withinthe target area. However, many Web pages with semantically dissimilar information are alsoincluded. This Web page cluster was constructed fromWeb pages reached by a few hyperlinksteps from the seed page.
5.3.3 Image allocation investigationThis study investigated the features of a collection of images having semantic similarity, beingfacial portraits of the previous Prime Minister of Japan (see Figure 13). These images wereallocated to clusters in the associated space as shown in Figure 14.
3http://www.rachi.go.jp/4http://www.kantei.go.jp/foreign/index-e.html5http://www.kantei.go.jp/jp/koizumisouri/index.html
318 New Fundamental Technologies in Data Mining
www.intechopen.com

Spatial Clustering Technique for Data Mining 15
Fig. 13. Target images of the previous Prime Minister of Japan. These images have highmutual semantic similarity.
Fig. 14. Target images allocated to clusters. Images allocated to one cluster usually havesimilar domain names.
319Spatial Clustering Technique for Data Mining
www.intechopen.com

16 Data Mining
Images were allocated to several detached clusters, although they all had high mutual affinityvalues. From an analysis of the information about nodes around each image, we found thatimages allocated to the same cluster often have similar domain names. However, a few pairsof images in the same cluster have high affinities but different domain names. We thereforeconclude that the allocation of image nodes is affected by other information.
6. Conclusion
Wehave introduced a novel spatial clustering technique that is calledASKS. ASKS can relocateobjects into a new n-dimensional space from network structured data. Comparing ASKS withQ-IV, it improves the performance of clustering, and it can find actual clusters of objects andretrieve similar objects that are not related by an object of query, and it can be used in amultimedia retrieval system that combines words, Web pages and images.We plan to pursue the following developments in future work. We expect that the visualizedspace used in this research will resemble existing relation graphs, which can be described byrubbery models or which may be easier to understand. Therefore, we should compare thevisualization in this research with existing relationship graphs. Then there is the progressionto categorization using clustering methods with visualized associated spaces to investigatethe meaning of each category. In addition, if we apply categories, it may be possible to builda search system using the categorized information provided.
7. References
Albert, R. & Barabasi, A. (2002). Statistical mechanics of complex networks, Reviews of modernphysics 74(1): 47–97.
Barabasi, A. & Crandall, R. (2003). Linked: The new science of networks, American journal ofPhysics 71: 409.
Bharat, K. & Henzinger, M. R. (1998). Improved algorithms for topic distillation in ahyperlinked environment, Proceedings of the 21st annual international ACM SIGIRconference on Research and development in information retrieval, ACM, pp. 104–111.
Boccaletti, S., Latora, V., Moreno, Y., Chavez, M. & Hwang, D. (2006). Complex networks:Structure and dynamics, Physics Reports 424(4-5): 175–308.
Carriere, S. & Kazman, R. (1997). WebQuery: Searching and visualizing the Web throughconnectivity, Computer Networks and ISDN Systems 29(8-13): 1257–1267.
Chakrabarti, S., Dom, B. E., Kumar, S. R., Raghavan, P., Rajagopalan, S., Tomkins, A., Gibson,D. & Kleinberg, J. (1999). Mining the Web’s link structure, Computer 32(8): 60–67.
Chen, J., Gupta, D., Vishwanath, K., Snoeren, A. & Vahdat, A. (2004). Routing in anInternet-scale network emulator, The IEEEComputer Society’s 12th Annual InternationalSymposium on Modeling, Analysis, and Simulation of Computer and TelecommunicationsSystems, 2004.(MASCOTS 2004). Proceedings, pp. 275–283.
He, X., Ding, C., Zha, H. & Simon, H. (2001). Automatic topic identification using webpageclustering, Proceedings of the 2001 IEEE international conference on data mining, IEEEComputer Society, pp. 195–202.
Jeong, H., Mason, S., Barabasi, A. & Oltvai, Z. (2001). Lethality and centrality in proteinnetworks, Nature 411(6833): 41–42.
Jeong, H., Tombor, B., Albert, R., Oltvai, Z. & Barabasi, A. (2000). The large-scale organizationof metabolic networks, Nature 407(6804): 651–654.
Kleinberg, J. (1999). Authoritative sources in a hyperlinked environment, Journal of the ACM
320 New Fundamental Technologies in Data Mining
www.intechopen.com

Spatial Clustering Technique for Data Mining 17
(JACM) 46(5): 604–632.Komazawa, T. & Hayashi, C. (1982). Quantification Theory and Data Processing, Tokyo:
Asakura-shoten .Kosala, R. & Blockeel, H. (2000). Web mining research: A survey, ACM SIGKDD Explorations
Newsletter 2(1): 1–15.Kruskal, J. (1964). Multidimensional scaling by optimizing goodness of fit to a nonmetric
hypothesis, Psychometrika 29(1): 1–27.Liu, N. & Yang, C. (2005). Mining web site’s topic hierarchy, Special interest tracks and posters
of the 14th international conference on World Wide Web, ACM, pp. 980–981.Modha, D. S. & Spangler, W. S. (2000). Clustering hypertext with applications to web
searching, Proceedings of the eleventh ACM on Hypertext and hypermedia, ACM,pp. 143–152.
Moise, G., Sander, J. & Rafiei, D. (2003). Focused co-citation: Improving the retrieval ofrelated pages on the web, Proceedings of the 12th International world wide web Conference(Budapest, Hungary, 2003) .
Murata, T. (2003). Visualizing the structure of web communities based on data acquired froma search engine, IEEE transactions on industrial electronics 50(5): 860–866.
Ohnishi, H., Yaguchi, Y., Yamaki, K., Oka, R. & Naruse, K. (2006). Word space : Anew approach to describe word meanings, IEICE technical report. Data engineering106(149): 149–154.
Pirolli, P., Pitkow, J. & Rao, R. (1996). Silk from a sow’s ear: extracting usable structures fromthe Web, Proceedings of the SIGCHI conference on Human factors in computing systems:common ground, ACM, p. 125.
Shepard, R. (1972). Multidimensional scaling: Theory and applications in the behavioralsciences, Seminar Press New York.
Soffer, S. & Vazquez, A. (2005). Network clustering coefficient without degree-correlationbiases, Physical Review E 71(5): 57101.
Spertus, E. (1997). ParaSite: Mining structural information on the Web, Computer Networks andISDN Systems 29(8-13): 1205–1215.
Takahashi, H. & Oka, R. (2001). Self-organization an associated keyword space for textretrieval,WMSCI2010, WorldMulti-Conference on Systemics, Cybernetics and Informaticspp. 302–307.
Wagatsuma, T., Yaguchi, Y. & Oka, R. (2009). Cross-media data mining using associatedkeyword space, 10th IEEE International Conference on Computer and InformationTechnology (CIT10) 2: 289–294.
Wang, C., Au, K., Chan, C., Lau, H. & Szeto, K. (2008). Detecting Hierarchical Organizationin Complex Networks by Nearest Neighbor Correlation, Nature Inspired CooperativeStrategies for Optimization (NICSO 2007) pp. 487–494.
Watts, D. & Strogatz, S. (1998). Collective dynamics of ”small-world” networks, Nature393(6684): 440–442.
Yaguchi, Y., Ohnishi, H., Mori, S., Naruse, K., Oka, R. & Takahashi, H. (2006). A miningmethod for linkedweb pages using associated keyword space, IEEE/IPSJ InternationalSymposium on Applications and the Internet (SAINT’06) pp. 268–276.
Yan, J. & Assimakopoulos, D. (2009). The small-world and scale-free structure of aninternet technological community, International Journal of Information Technology andManagement 8(1): 33–49.
Young, G. & Householder, A. (1938). Discussion of a set of points in terms of their mutual
321Spatial Clustering Technique for Data Mining
www.intechopen.com

18 Data Mining
distances, Psychometrika 3(1): 19–22.Youssefi, A., Duke, D. & Zaki, M. (2004). Visual webmining, Proceedings of the 13th international
World Wide Web conference on Alternate track papers & posters, ACM, pp. 394–395.
322 New Fundamental Technologies in Data Mining
www.intechopen.com
New Fundamental Technologies in Data MiningEdited by Prof. Kimito Funatsu
ISBN 978-953-307-547-1Hard cover, 584 pagesPublisher InTechPublished online 21, January, 2011Published in print edition January, 2011
InTech EuropeUniversity Campus STeP Ri Slavka Krautzeka 83/A 51000 Rijeka, Croatia Phone: +385 (51) 770 447 Fax: +385 (51) 686 166www.intechopen.com
InTech ChinaUnit 405, Office Block, Hotel Equatorial Shanghai No.65, Yan An Road (West), Shanghai, 200040, China
Phone: +86-21-62489820 Fax: +86-21-62489821
The progress of data mining technology and large public popularity establish a need for a comprehensive texton the subject. The series of books entitled by "Data Mining" address the need by presenting in-depthdescription of novel mining algorithms and many useful applications. In addition to understanding each sectiondeeply, the two books present useful hints and strategies to solving problems in the following chapters. Thecontributing authors have highlighted many future research directions that will foster multi-disciplinarycollaborations and hence will lead to significant development in the field of data mining.
How to referenceIn order to correctly reference this scholarly work, feel free to copy and paste the following:
Yuichi Yaguchi, Takashi Wagatsuma and Ryuichi Oka (2011). Spatial Clustering Technique for Data Mining,New Fundamental Technologies in Data Mining, Prof. Kimito Funatsu (Ed.), ISBN: 978-953-307-547-1, InTech,Available from: http://www.intechopen.com/books/new-fundamental-technologies-in-data-mining/spatial-clustering-technique-for-data-mining

© 2011 The Author(s). Licensee IntechOpen. This chapter is distributedunder the terms of the Creative Commons Attribution-NonCommercial-ShareAlike-3.0 License, which permits use, distribution and reproduction fornon-commercial purposes, provided the original is properly cited andderivative works building on this content are distributed under the samelicense.