spatial data science: the 21st century mapping toolkit...
TRANSCRIPT

Map
pin
g f
or
a C
han
gin
g C
ali
forn
ia
NASA Blue Marble 2.0
Spatial Data Science:
- the 21st century mapping toolkit
- case studies in remote sensing and
participatory informatics
-where to get more information
Maggi Kelly, University of
California at Berkeley

Many of the challenging natural resource challenges that we face today –
such as invasive species, water, food scarcity, fire, climate change – are
large in spatial scale and impact diverse public groups.
Addressing these challenges requires coordinated monitoring, data
collection and synthesis, novel analytical tools, and increased
communication and cooperation between scientists and citizens.
The 21st century map

Our 21st century mapping toolkit
We analyze data from satellites… other lidar and other remote
platforms… existing GIS layers… historic data…VGI… mobile… all
served and integrated on the web
We use these data to answer questions about our environment
This is spatial data science

revolves around the integration of data – from aircraft, satellites,
mobile phones, historic collections, the web;
core spatial concepts – spatial data is characterized by location or
neighborhood, by format: field, object, network, event, and by scale
and accuracy
application of methods – understanding spatial density, pattern and
distribution, coincidence or interactions of factors across space,
probability or risk of an event occurring in space, and measures of
interconnectedness; and of
collaborations of people - scientists, policy-makers, and the public.
Spatial Data Science

My research and outreach program
Capturing, analyzing
and understanding
meaningful spatial
pattern
sudden oak death
wetlands
neighborhoods and public health
sierra forest management

My research and outreach program
Capturing, analyzing
and understanding
meaningful spatial
pattern
sudden oak death
wetlands
neighborhoods and public health
sierra forest management
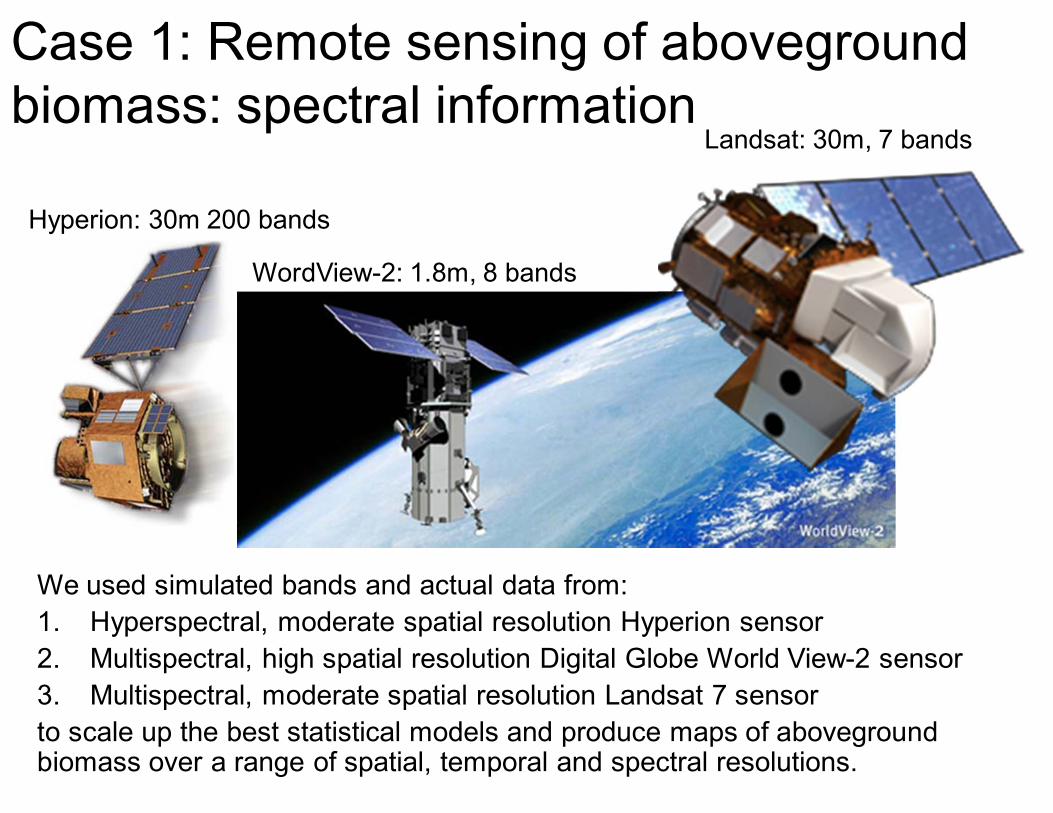
We used simulated bands and actual data from:
1. Hyperspectral, moderate spatial resolution Hyperion sensor
2. Multispectral, high spatial resolution Digital Globe World View-2 sensor
3. Multispectral, moderate spatial resolution Landsat 7 sensor
to scale up the best statistical models and produce maps of aboveground biomass over a range of spatial, temporal and spectral resolutions.
Case 1: Remote sensing of aboveground
biomass: spectral information
WordView-2: 1.8m, 8 bands
Landsat: 30m, 7 bands
Hyperion: 30m 200 bands

Mapping predicted above-ground
biomass
Sherman Island
Measured biomass, 8/15/12: 2,303 g/m2
Hyperion: 1,103 g/m2
Landsat 7: 1,977 g/m2
World View-2: 3,004 g/m2

Case 2: Mapping forest structure to
understand water, wildlife and fire
The spatial structure of
forests: horizontal, vertical
and social, influences how
they function:
• How fire might spread;
• How water quality and
quantity are delivered;
• How animals use the
forests before and after
fuel treatments
These are scientific as well as
management questions
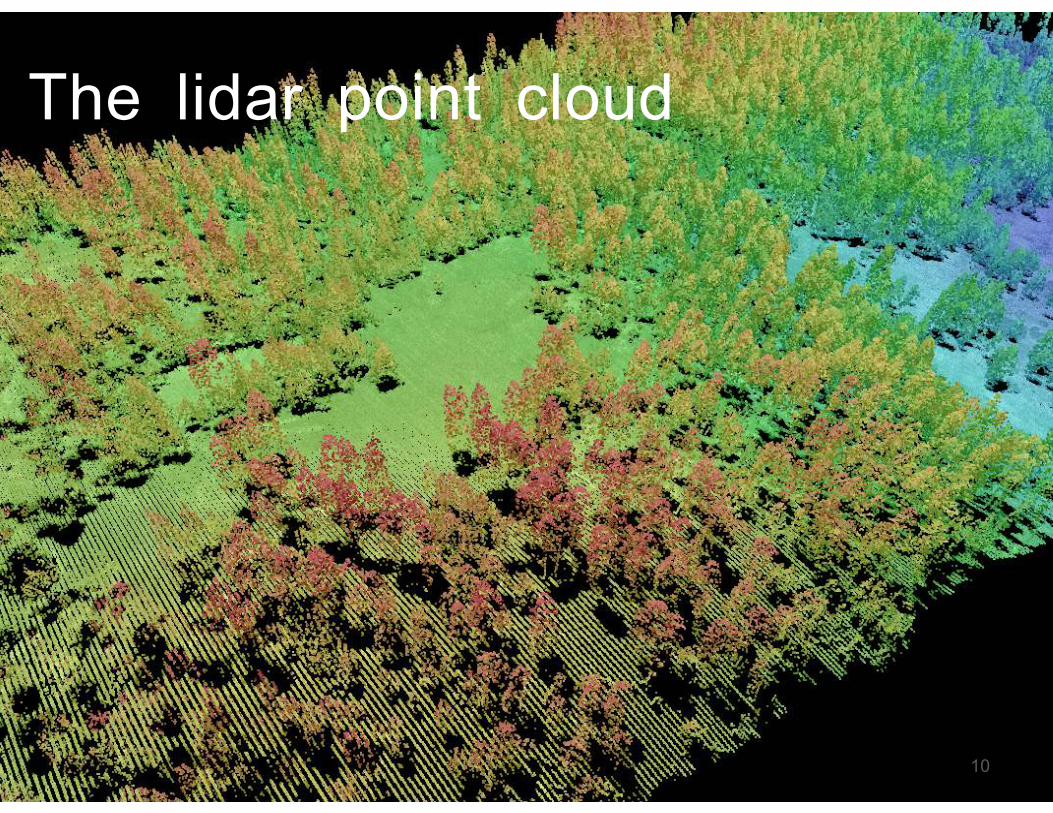
The lidar point cloud
10

The lidar point cloud
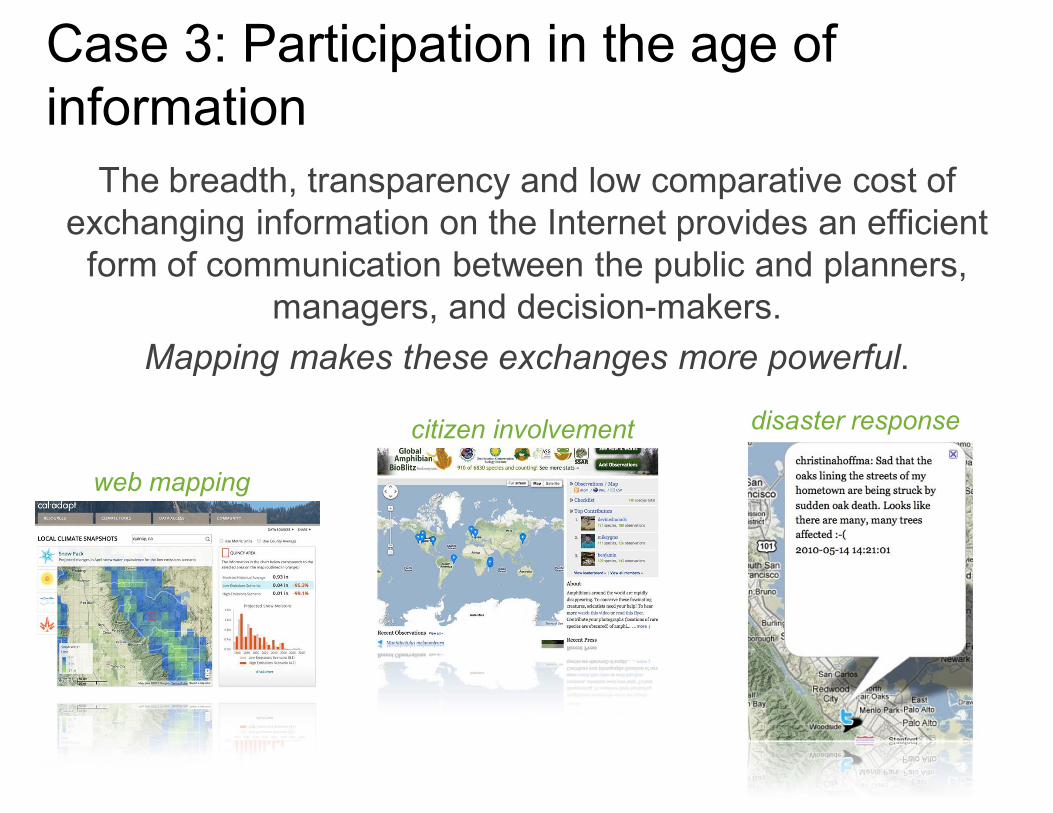
Case 3: Participation in the age of
information
The breadth, transparency and low comparative cost of
exchanging information on the Internet provides an efficient
form of communication between the public and planners,
managers, and decision-makers.
Mapping makes these exchanges more powerful.
web mapping
citizen involvement disaster response
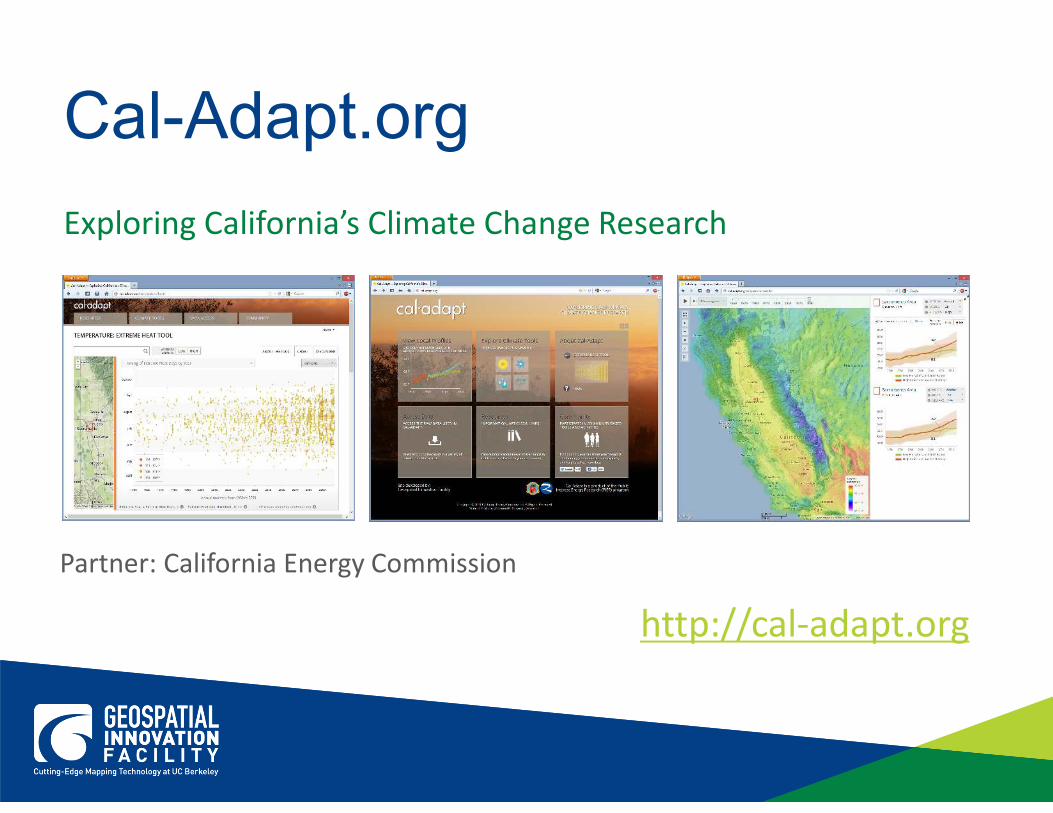
Cal-Adapt.org
Exploring California’s Climate Change Research
http://cal-adapt.org
Partner: California Energy Commission
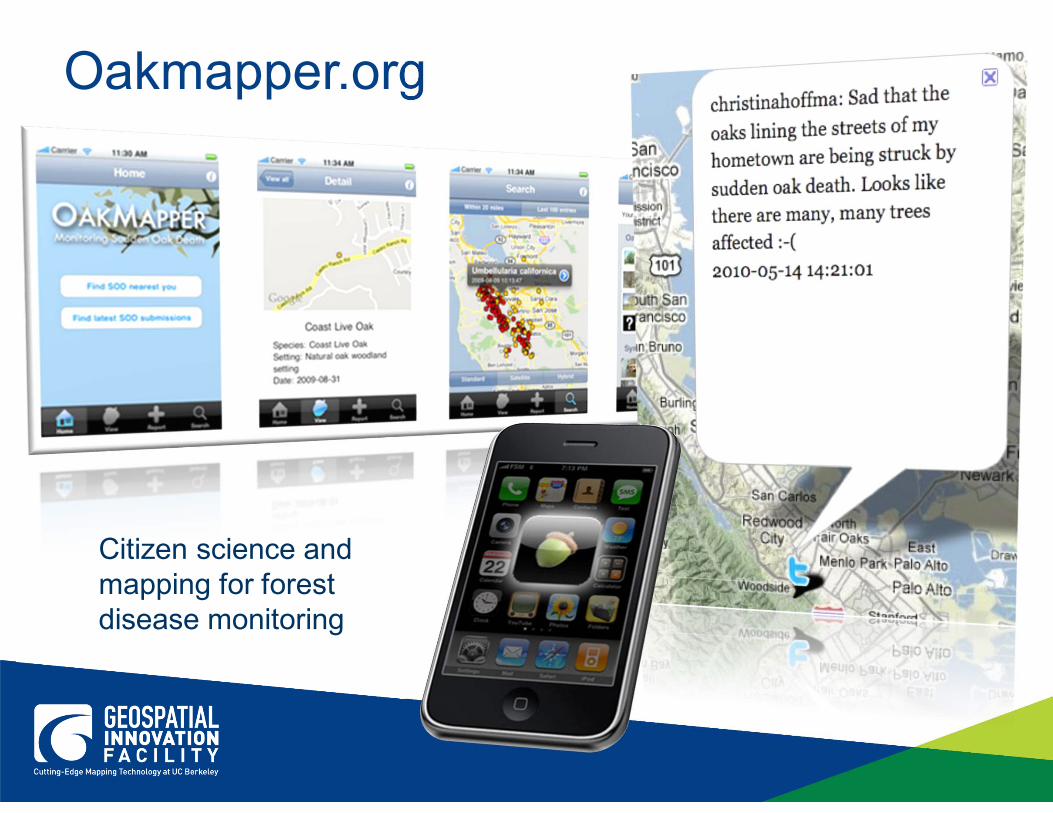
Oakmapper.org
Citizen science and
mapping for forest
disease monitoring

Berkeley Natural History Museums
o Vertebrates: 700,000 specimens (100%
digitized)
o Plants: 2.2 million specimens (~16% dig.)
o Fossils: 6.5 million specimens (<5% dig.)
o Insects: 6.5 million specimens (<2.5% dig.)
Data sources: Geolocated
specimens
Case 4: Rescuing and integrating biological
and environmental data in the face of global
change

• Hand drawn vegetation maps
• Dominant overstory vegetation
mapped in the field directly on
topographic maps
• “Mosaic” types vs “natural”
plant associations
Data sources: Vegetation Type Mapping survey

Data sources: Vegetation Type Mapping survey
• Hand drawn vegetation maps
• Dominant overstory vegetation
mapped in the field directly on
topographic maps
• “Mosaic” types vs “natural”
plant associations
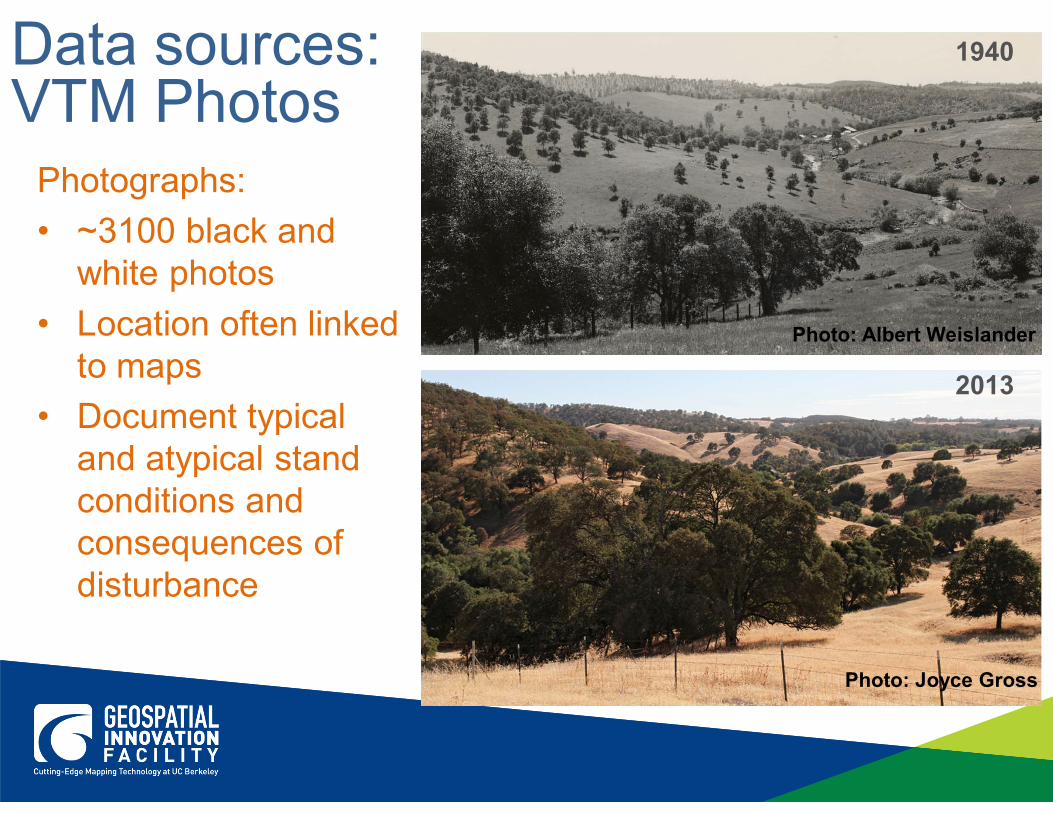
1940
2013
Photo: Albert Weislander
Photo: Joyce Gross
Photographs:
• ~3100 black and
white photos
• Location often linked
to maps
• Document typical
and atypical stand
conditions and
consequences of
disturbance
Data sources: VTM Photos

Data Sources: Big Spatial
Data
Satellite data: Landsat, MODIS…
GIS Layers: Landcover, DEMs, Soils…
Ecosystem models: Climate, Vegetation…

21st Century Challenge
“The overall message is, we have to start dealing with these environmental
problems in a very holistic way, and we need to realize that means understanding
how they interact”
- Anthony Barnosky
(2012 Nature)
Rescuing, digitization and sharing of event and spatial data through
such frameworks as APIs creates:
• Increase in scope and scale of research;
• Novel combinations of models and data create new knowledge;
• New modeling approaches to predict future scenarios; and
• Technological improvements to foster collaboration

Map
pin
g f
or
a C
han
gin
g C
ali
forn
ia
NASA Blue Marble 2.0
Spatial Data Science: integration of data
core spatial concepts
application of methods
collaborations of people
Maggi Kelly, University of
California at Berkeley
The Geospatial Innovation Facility: http://gif.berkeley.edu
My lab and blog: http://kellylab.berkeley.edu
HOLOS: http://ecoengine.berkeley.edu
VTM collection: http://vtm.berkeley.edu
Cal-Adapt: http://cal-adapt.org
Oakmapper.org: http://oakmapper.org