spatial distribution of damage caused by the 1999 earthquakes in
TRANSCRIPT
Spatial Distribution of Damage Caused bythe 1999 Earthquakes in Turkey
C. Donmez,a) M.EERI, and S. Pujol,b) M.EERI
A team of engineering students and faculty from several universities in-vestigated the effects of the 17 August and 12 November 1999 earthquakes inTurkey, documenting the damage in reinforced concrete structures. The teamfocused on the damage in Duzce, Kaynaslı, and Bolu. This article summa-rizes the observations and the data gathered on the spatial distribution of thedamage in reinforced concrete structures with respect to the fault rupture.The data presented are of interest because they do not reveal a clear trendbetween damage and distance to the fault. [DOI: 10.1193/1.1850527]
INTRODUCTION
Most of the urban areas that are threatened by earthquakes in Turkey are not wellprepared for such events. Many of the structures in these areas are built without any en-gineering, planning, or control. Government agencies are in need of efficient tools tomeasure the size of the problem they are facing and formulate plans of action. Urbanareas affected by earthquakes provide very valuable data that can help to design and cali-brate these tools.
A team from several universities1 was formed following the 17 August and 12 No-vember 1999 earthquakes in Turkey under the auspices of the National Science Founda-tion. The team documented the damage in reinforced concrete buildings. The areas sur-veyed (Figures 1 and 2) were affected to different degrees (Table 1) by both earthquakes:the Kocaeli earthquake (17 August 1999, Mw57.4, USGS, Kandilli Observatory) andthe Duzce earthquake (12 November 1999, Mw57.2, USGS). These earthquakes werecaused by the rupture of adjacent segments of the same fault (EERI 2000). The ruptureswere well exposed and have been traced for about 140 km for the Kocaeli earthquake,and for 40 km for the Duzce earthquake. Both fault ruptures passed through urban areas.
The study described here focused on the damage in Duzce, Bolu, and Kaynaslı. Thepopulations of Duzce and Bolu were 77,000 and 81,000, respectively. The population ofKaynaslı was about 7,000 according to the 1997 census (DIE 1997). Duzce sustainedheavy damage during both earthquakes. Bolu and Kaynaslı did not suffer significantdamage in the first earthquake, but both sustained heavy damage in the second earth-quake. The surface trace of the rupture that generated the second earthquake passedthrough urban areas of Kaynaslı.
a) TGRWA, 407 S. Dearborn, Suite 900, Chicago, IL 60605; e-mail: [email protected]) Wiss, Janney, Elstner, 2200 Powell St. Suite 925, Emeryville, CA, 94608; e-mail: [email protected] Purdue University, Middle East Technical University, University of California at Berkeley, University of
Kansas, University of Minnesota, University of Notre Dame, University of Texas, and Izmir Institute ofTechnology.
53Earthquake Spectra, Volume 21, No. 1, pages 53–69, February 2005; © 2005, Earthquake Engineering Research Institute

54 C. DONMEZ AND S. PUJOL
This article summarizes the most salient conclusions inferred based on the data gath-ered in the field after the earthquakes. The following discussions concentrate on the re-lationship between the observed damage and two independent variables: distance tofault, and total area of columns and walls. The latter is normalized using a format sug-gested in previous studies on the formulation efficient tools for rapid screening of largeinventories of structures.
Figure 1. Map of Turkey and locations of the epicenters and surveyed cities.
Figure 2. Study area and locations of cities with respect to the 12 November 1999 earthquakefault trace.

SPATIAL DISTRIBUTION OF DAMAGE CAUSED BY THE 1999 EARTHQUAKES IN TURKEY 55
SAMPLING PROCESSES
A total of 1,202 buildings were surveyed. Approximately 90% of them were 1- to6-story reinforced concrete structures. The data gathered can be classified into twogroups. The first group of data was obtained through a sampling process that will bereferred to as the ‘‘general survey.’’ The purpose of this type of survey was to investigatethe spatial distribution of the damage within a city. The information recorded for eachstructure surveyed included damage rating, number of stories, pictures, and location. Atotal of 1,021 buildings were surveyed in this manner in Bolu and Duzce. The secondgroup of data was obtained through a sampling process that will be referred to as the‘‘Hassan survey’’ (Hassan and Sozen 1997). In this type of survey, in addition to damagerating, number of stories, pictures, and location, approximate floor plans and storyheights were recorded for each building. The total number of structures that were sur-veyed in this manner is 181. All the data collected are available on the Internet atwww.anatolianquake.org.
The damage scale used to categorize all the buildings surveyed refers to structuralmembers only. The damage of a structure was labeled ‘‘light’’ if characterized by hairlineinclined and flexural cracks. Structures with wider cracks and spalling of concrete wereclassified as structures with ‘‘moderate damage.’’ Structures with local structural failureswere classified as structures with ‘‘severe damage.’’
The general survey was organized to obtain a broad picture of the damage distribu-tion within Duzce and Bolu. In the case of Duzce, data were obtained from blocks se-lected through the city randomly (Figure 3). For Bolu, data collection was made alongfive different streets, which run roughly in the north-south direction (Figure 4). Aftercompleting the surveys and comparing the time spent in obtaining the data in Figures 3and 4, it was concluded that surveying along parallel streets is more efficient and pro-vides adequate information on damage distribution.
Although both the general survey and the Hassan survey were designed to producethe most representative samples possible, the Hassan survey may yield more data frombuildings with moderate to severe damage. This is due to the fact that damaged struc-tures are usually evacuated after the earthquake and, therefore, are more accessible forobtaining the information required than structures that remain operational. On the otherhand, it is difficult, if not impossible, to get data about the distribution of columns and
Table 1. Strong motion information (Ozturk 2003)
CityStrong Motion
Instrument Location Soil Type
PGA (cm/s2) PGV (cm/s)
EW NS EW NS
Bolu 40.745N–31.610E sedimentary 17 August 1999 * * * *silty clay 12 November 1999 740 806 63 57
Duzce 40.850N–31.170E sedimentary 17 August 1999 374 315 52 60silty clay 12 November 1999 514 408 90 66
* The instrument did not trigger.

56 C. DONMEZ AND S. PUJOL
walls from a structure that has collapsed. This potential bias must not be present in thedata obtained in the general survey, which did not include collection of informationabout dimensions and distribution of columns and walls.
DAMAGE MAPS
The information obtained through the sampling procedures described above wasused to estimate the distribution of damage within the cities surveyed and with respect tothe zone of rupture. The locations of the structures and the fault were inferred based oninformation from different sources, as follows. Longitude and latitude coordinates wereobtained for all the structures studied in the Hassan survey through GPS receivers (withan accuracy of approximately 10 m). The location of the structures included in the gen-eral survey was recorded on city maps. In order to connect data on the city maps to acoordinate system, latitude-longitude information of several reference points in each citywas recorded on the maps. The coordinates of the buildings in the general survey datawere obtained later by digitizing the city maps and scaling and positioning them usingthe reference points. The coordinates of the east end of the fault, for a length of about 15km, were also obtained using GPS receivers. The location of the fault trace, from Guvento Lake Eften (Figure 2), was estimated after digitizing a geographic map by Bogazici
Figure 3. Distribution of damage in Duzce.

SPATIAL DISTRIBUTION OF DAMAGE CAUSED BY THE 1999 EARTHQUAKES IN TURKEY 57
University’s Geophysics Department (Arpat 1999). The location of the fault rupture inthe vicinity of Kaynaslı was obtained from a very detailed mapping that was done byteam members from Purdue University’s Earth and Atmospheric Sciences Department.In order to have a composite map of all the data available (Figure 2), all the informationabout location was transformed to Universal Transverse Mercator coordinates (UTM,World Geodetic System 1984). The accuracy of the map obtained was inferred by com-paring the coordinates for data points common to different information sources. Themaximum error in the composite map is smaller than two hundred meters. This is thegross error among the different sets of data. Each data set is as exact as the GPS receiv-ers or the city maps used.
SITE CONDITIONS
Duzce is situated in a basin that is filled with colluvial deposits. Available logs ofdeep borings made by DSI (State Water Works) and reports by TUBITAK (1999a, b),show that these deposits are composed of layers of clay, sand, and gravel. The averagedepth to bedrock varies between 200 and 250 meters (Figure 5). This information doesnot indicate that there might have been drastic variations in ground motion amplification
Figure 4. Distribution of damage in Bolu.

58 C. DONMEZ AND S. PUJOL
due to the site conditions throughout the city. This is in agreement with the fact thatdamage was observed to be distributed uniformly throughout the city (Figure 3).
Similar to Duzce, Bolu is also situated in a basin that is filled with colluvial deposits.Information from the limited number of boreholes available indicates that the depth tobedrock is of the order of 100 meters in the area surveyed. Deep and shallow boringsshow that the soils in Bolu are composed of clay, sand, and gravel layers. Based on theinformation from shallow borings, these deposits can be classified as soils Z2 and Z3(Figure 6) according to the 1997 Turkish Earthquake Code (Ministry of Public Works1997). These soil classes are similar to soil classes D and E in the 1997 Uniform Build-ing Code (UBC) (ICBO 1997). The available soil explorations do not indicate drasticchanges in soil properties between the north and the south of the area surveyed. Dam-age, however, was concentrated in the north of Bolu (Figure 4).
Kaynaslı is located in a narrow valley that runs roughly parallel to the fault line. Thesoils in this valley are composed of colluvial and alluvial deposits.
DAMAGE OBSERVATIONS
It was observed that the main cause of the damage in the vicinity of the fault was thediscontinuity caused by the rupture. The measured relative displacement of the rupturereached 4.5 meters at Dagdibi, near the middle of the fault trace for the second event.Measured ground shear strains were larger than 0.001 in an 80-meter-wide band in therupture zone in Kaynaslı (Johnson 2001).
Figure 5. Site information about Duzce.

SPATIAL DISTRIBUTION OF DAMAGE CAUSED BY THE 1999 EARTHQUAKES IN TURKEY 59
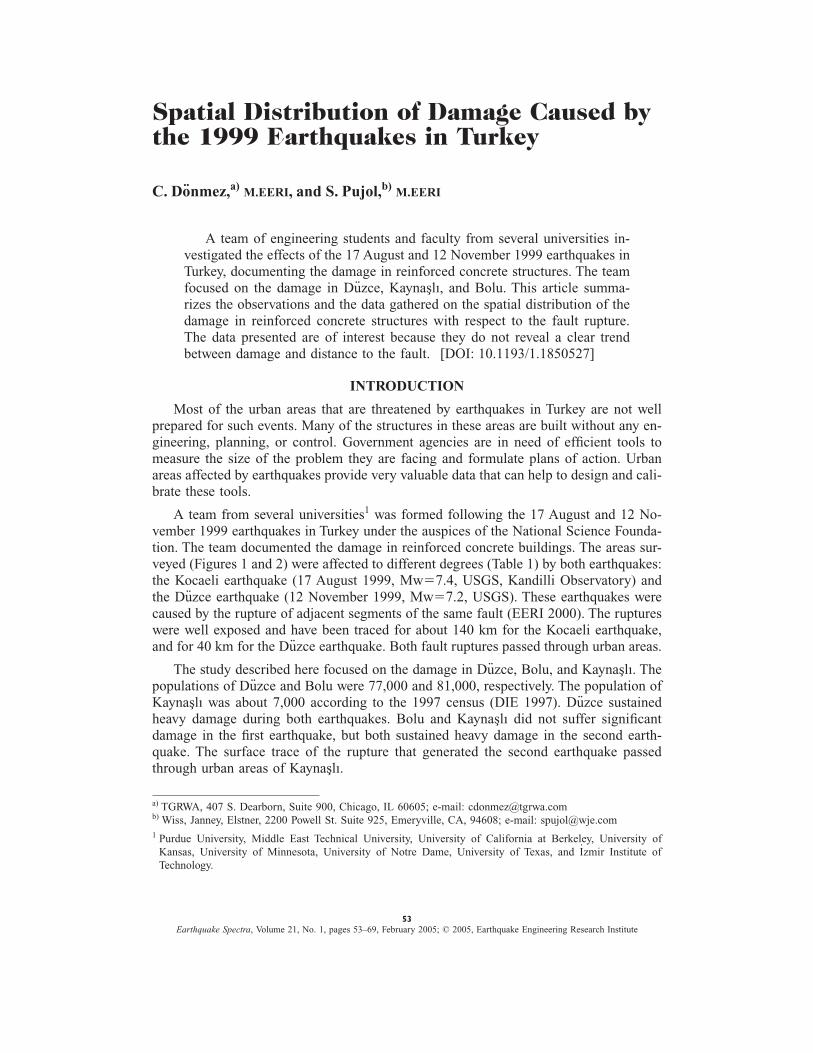
Away from the fault, the majority of the structural damage observed could be attrib-uted to brittle behavior or inability to sustain inelastic displacement reversals. Brittle be-havior was a consequence of poor reinforcement detailing (Figures 7 and 8), presence ofcaptive columns (Figure 9), soft stories, and torsional response. The structures surveyedcan therefore be idealized as a group of brittle oscillators. If one thinks of these oscil-lators as being distributed randomly over the area affected by the earthquakes, it can behypothesized that the distribution of damage observed is an indicator of distribution ofground motion intensity. However, because the area surveyed was affected by two earth-quakes, damage accumulation in a given structure would make the attempt to inferground motion intensity from damage observations a more difficult exercise. But thefact that the structures surveyed were brittle makes the possibility of damage accumu-lation within a given structure not critical because it can be assumed that a structure withbrittle behavior, when subjected to strong ground motion, either does not reach to itsstrength or experiences severe damage or collapse. Such an assumption would imply thatthe damage observed must have been the result of the envelope of the demands fromboth earthquakes.
Duzce sustained heavy damage during both earthquakes. If the acceleration spectraof records obtained at the same station are compared (Figure 10), it can be seen that the
Figure 6. Site information about Bolu.
60 C. DONMEZ AND S. PUJOL
acceleration demands for periods between 0.1 to 1.0 seconds, the expected range for theperiods of the structures surveyed, were considerably larger for the second earthquake.Due to the higher demands, some of the structures that survived the first quake wereseverely damaged or collapsed in the second earthquake.
DISTRIBUTION OF DAMAGE VS DISTANCE TO THE FAULT
In spite of their relatively poor construction quality, many buildings that were closeto the rupture, but not directly on it, did not suffer serious damage. Available attenuationrelationships for earthquake ground motion parameters such as peak ground accelerationwould lead to a different conclusion. Existing attenuation relationships (Anderson 2000,Rathje 2003) would indicate that within a certain distance to fault line (approximately 1to 20 km) peak ground acceleration ‘‘saturates.’’ Beyond the saturation zone PGA wouldbe expected to decrease.
Observations made after the 1999 Turkey earthquakes indicate that ground accelera-tion decreased in the vicinity of the fault line. There is no sufficient data to discern theboundaries of the zone where structural damage seemed to indicate lower acceleration
Figure 7. Column failure, Bolu government hospital.

SPATIAL DISTRIBUTION OF DAMAGE CAUSED BY THE 1999 EARTHQUAKES IN TURKEY 61
Figure 8. Failure of a shear wall in Bolu.
Figure 9. Typical example of captive columns. (Photograph by Mete Sozen)

62 C. DONMEZ AND S. PUJOL
demands. It is clear, however, that this is a relatively narrow zone whose width may bein the order of tens to hundreds of meters. An example of this behavior of structuresclose to the fault is illustrated in Figure 11. The three-story reinforced concrete structureshown was located in Guven (Figure 2). The fault rupture was observed approximately20 m away from the structure. The slip measured was approximately 3 m. The concrete
Figure 10. Response spectra of Duzce ground motions.
Figure 11. Surface rupture at Guven. (Photograph by Mete Sozen)

SPATIAL DISTRIBUTION OF DAMAGE CAUSED BY THE 1999 EARTHQUAKES IN TURKEY 63
water tank in front of the building (Figure 11) was tilted and moved by the rupture. An-other example of structures that did not suffer damage despite their proximity to thefault is the grain storage supported by wooden poles shown in Figure 12. This structurewas within meters from the fault rupture, 2 km from the eastern edge of Lake Eften(Figure 2), and its owners claimed that it was full of grain when the quake hit. Theseobservations indicate that in some areas close to the fault rupture the acceleration of theground may have been low relative to ground acceleration kilometers away from thefault line. Similar observations were made after the 17 August Kocaeli earthquake(EERI 1999, 2003). The spatial distribution of damage in Kaynaslı seems to support thesame conclusion. The fault rupture passed through this small town and, even thoughthere were severely damaged structures, many of the structures close to the fault did sur-vive the earthquake (Figure 13).
The data points gathered in Duzce are in the range of 7 to 9 km from the causativefault. This zone is too narrow to allow observation of attenuation effects. Besides, thedepth to bedrock in the zone is approximately constant. These two observations indicatethat the ground motion may have been relatively uniform throughout the zone surveyed.This hypothesis is in agreement with the fact that the damage observed in Duzce wasdistributed uniformly. (Figure 3)
The damage in Bolu was observed to be concentrated in the north of the city (Figure4). The available soil information does not indicate that there may be a drastic change insoil properties between the north and south of the city (Figure 6). Further analysis isneeded to define the cause of the difference in damage.
Figure 12. Grain storage structure at the east end of Lake Eften. (Photograph by Mete Sozen)

64 C. DONMEZ AND S. PUJOL
VULNERABILITY INDEXES
The construction practice and the failures observed indicate that, in general, rein-forced concrete structures in the region were not capable of reaching inelastic displace-ments before failure. The key for survival for these structures was therefore their baseshear strength.
Hassan and Sozen (1997) defined vulnerability indexes related to base shearstrength:
Column Index51
2
Acolumns
(Afloor(1)
Wall Index5
ARC walls11
10Amasonry walls
(Afloor(2)
Here Acolumns is the cross-sectional area of all columns at base level, ARC walls is thecross-sectional area of reinforced concrete walls at base level, Amasonry walls is the cross-sectional area of masonry walls filling entire frame bays, and (Afloor is the summation offloor areas above the base of the structure.
Hassan and Sozen observed the vulnerability of reinforced concrete structures to de-crease with increasing combinations of column and wall indexes. It follows that vulner-ability decreases as the sum of column and wall indices increase. An additional index
Figure 13. Distribution of damage in Kaynaslı.

SPATIAL DISTRIBUTION OF DAMAGE CAUSED BY THE 1999 EARTHQUAKES IN TURKEY 65
was defined by Hassan and Sozen as the sum of the column and wall indexes. It wastermed ‘‘priority index’’ in reference to its potential use: prioritization of resources forseismic upgrading. The relationship between the priority index and number of stories forthe buildings surveyed is shown in Figure 14. The average priority index was observedto decrease with increasing number of stories, indicating larger vulnerability for thehigher structures. Such indication is in agreement with the fact that, in general, damagewas observed to increase with increasing number of stories (Figure 15). The observeddecrease in the priority index indicates that, in average, the cross-sectional areas ofstructural members remain approximately constant for buildings of different height. Thestrength of the structures surveyed is limited by the shear strength of columns and walls.It is therefore reasonable to assume that strength remains approximately constant whileweight increases for increasing number of stories. At the same time, and for the range ofperiods that may be associated with the structures studied, average spectral accelerationsremain approximately constant, making the taller and heavier structures more vulner-able. Of course, the poor performance observed for taller structures could have been pre-vented with the use of reinforcement details for ductile behavior.
Classifying the general survey data with respect to number of stories for Bolu andDuzce shows again that taller buildings were more vulnerable (Figures 16a and 16c). Anindependent study performed by the municipality of Duzce also confirms this observa-tion (Figure 16b).
Figure 14. Priority index vs. number of stories.

66 C. DONMEZ AND S. PUJOL
SUMMARY AND CONCLUSIONS
The 17 August and 12 November 1999 earthquakes in Turkey affected several urbanareas. In several instances, well-exposed fault ruptures passed through these areas. Anextensive site study was carried out in the Bolu-Duzce region to document the damagein reinforced concrete structures. One of the specific goals of this study was to deter-mine whether there was any correlation between the spatial distribution of the damageobserved in reinforced concrete structures and their location with respect to the faultrupture. No clear correlation between damage and distance to the rupture zone was ob-served.
Existing attenuation relationships (Anderson 2000, Rathje 2003) indicate that withina certain distance to fault line (approximately 1 to 20 km) peak ground acceleration‘‘saturates.’’ Beyond the saturation zone PGA would be expected to decrease. Observa-tions made after the 1999 Turkey earthquakes indicate that ground acceleration de-creased in the vicinity of the fault line. Unfortunately, it is not possible to define theboundaries of this zone with the available data. It is clear, however, that this is a rela-tively narrow zone, the width of which may be on the order of tens to hundreds ofmeters.
Severe damage or collapse was observed more frequently in the taller buildings (4-to 6-story buildings). This observation seems to be in agreement with the fact that thetotal cross-sectional area of columns and walls at the base of the buildings did not vary
Figure 15. General trends of severely damaged or collapsed structures and averagepriority index.

SPATIAL DISTRIBUTION OF DAMAGE CAUSED BY THE 1999 EARTHQUAKES IN TURKEY 67
Figure 16. General survey results for Duzce and Bolu.

68 C. DONMEZ AND S. PUJOL
significantly with number of stories (Figure 14). Given that the structures surveyed, ingeneral, were not provided with reinforcement detailing to ensure ductility, it is reason-able to assume that constant areas of columns and walls resulted in constant base shearstrength. At the same time, the periods of the structures surveyed can be expected to fallin the range in which average spectral acceleration remains approximately constant. In-ertial forces were therefore larger for heavier structures. As a consequence, the taller,and therefore heavier, of these brittle structures had lower ratios of base shear strength tobase shear demand and were more vulnerable. The vulnerability indexes used in thisstudy are based on the ratio of the total cross-sectional area of base columns and wallsto total floor area and are capable of reproducing this trend.
ACKNOWLEDGMENTS
The writers would like to acknowledge the people involved in the site study: SerhatBayılı, Zehra Cagnan, Dr. Ugur Ersoy, Dr. Polat Gulkan, Dr. Guney Ozcebe, Ali CihanPay, H. Aydın Pekoz, Dr. Haluk Sucuoglu, Dr. Cetin Yılmaz, and Tolga Yılmaz, fromMiddle East Technical University; Dr. Antonio Bobbet, Joe Durdella, Keli Ann Engvall,Yeliz Fırat, Dr. Robert Frosch, Turel Gur, Dr. Arvid Johnson, Kaj Johnson, EuridiceOware, Dr. Julio Ramirez, Dr. Kenneth Ridgway, Sibel Sayılı, J. Paul Smith, Joan Sozen,Dr. Mete Sozen, Nihan Tiryaki, and Dr. Koray Tureyen, from Purdue University; Dr. Ha-lil Sezen from the University of California, Berkeley; Dr. Steve McCabe from the Uni-versity of Kansas; Dr. Arturo Schultz from University of Minnesota; Dr. K. Farrow andDr. Cuneyt Kurama from the University of Notre Dame; and Dr. Sharon Wood from theUniversity of Texas.
The writers also specifically acknowledge the support and valuable discussions fromDr. Arvid Johnson, Dr. Julio Ramirez, and Dr. Mete Sozen.
This study was made possible by support from the National Science Foundation,grant No. 0085270-CMS.
REFERENCES
Anderson, J. G., 2000. Expected shape of regression for ground-motion parameters on rock,Bull. Seismol. Soc. Am. 90 (6B), S43–S52.
Arpat, E., Herece, E., Komut, T., and Ozgul, N., 1999. Fault Rupture & Photographs from theField, Bogazici University, Kandilli Observatory & Earthquake Research Institute, Geophys-ics Division. http://www.koeri.boun.edu.tr/jeofizik/duzce2.html
DIE, 1997. General Census, Republic of Turkey, Prime Ministry State Institute of Statistics,www.die.gov.tr.
Earthquake Engineering Research Institute (EERI), 1999. The Izmit (Kocaeli), Turkey earth-quake of August 17, 1999, EERI Special Earthquake Report, Newsletter insert, October.
Earthquake Engineering Research Institute (EERI), 2000. Kocaeli, Turkey, Earthquake of Au-gust 17, 1999 Reconnaissance Report, Earthquake Spectra, Supplement A to vol. 16, pp.65–96.
Earthquake Engineering Research Institute (EERI), 2003. The 1999 Turkey Earthquakes:Bridge Performance and Remedial Actions, Learning from Earthquakes Series, vol. IV.

SPATIAL DISTRIBUTION OF DAMAGE CAUSED BY THE 1999 EARTHQUAKES IN TURKEY 69
Hassan, A. F., and Sozen, M. A., 1997. Seismic vulnerability assessment of low-rise buildingsin regions with infrequent earthquakes, ACI Struct. J. 94 (1), 31–39.
International Conference of Building Officials (ICBO), 1997. Uniform Building Code, Whittier,CA.
Johnson, A., et al., 2001. Main Rupture and Adjacent Belt of Right Lateral Distortion Detectedby Viaduct at Kaynasli, Turkey, 12 November 1999 Duzce Earthquake, internal report, De-partment of Earth and Atmospheric Sciences, Purdue University, West Lafayette, IN.
Ministry of Public Works and Settlement, Government of Republic of Turkey, 1997. Specifica-tions for Structures to be Built in Disaster Areas.
Ozturk, B., 2003. Seismic Drift Response of Building Structures in Seismically Active andNear-Fault Regions, Ph.D. thesis, Purdue University, West Lafayette, IN.
Rathje, E. M., Stokoe, H. K., and Rosenblad, B., 2003. Strong ground motion characterizationand site effects during the 1999 earthquakes in Turkey, Earthquake Spectra 19 (3), 653–675.
Simsek, O., 1994. Duzce Ovası Killerinin Konsolidasyon Ozelliklerinin ve Jeolojik Evrinin In-celenmesi, Ph.D. thesis, Graduate School of Natural and Applied Sciences, University ofIstanbul.
TUBITAK, 1999a. 17 Agustos 1999 Marmara Depremi Sonrası Surekli Iskan AlanlarınınBelirlenmesinde Bolu ve Cevresi Jeoloji-Jeoteknik ve Jeofizik Arastırmalari, Earth, Marine,Atmospherical Sciences, and Environmental Researches Grant Group, MTA and AnkaraUniversity, October.
TUBITAK, 1999b. 12 Kasım 1999 Duzce Bolgesi Depremi Golyaka-Kaynaslı Fayı, Earth,Marine, Atmospherical Sciences, and Environmental Researches Grant Group, Ankara Uni-versity, December.
(Received 18 April 2003; accepted 4 June 2004)