spatial mapping of structural and connectional imaging ... in press... · spatial mapping of...
TRANSCRIPT
Methods xxx (2014) xxx–xxx
Contents lists available at ScienceDirect
Methods
journal homepage: www.elsevier .com/locate /ymeth
Spatial mapping of structural and connectional imaging data for thedeveloping human brain with diffusion tensor imaging
http://dx.doi.org/10.1016/j.ymeth.2014.10.0251046-2023/� 2014 Elsevier Inc. All rights reserved.
⇑ Corresponding author at: Advanced Imaging Research Center, University ofTexas Southwestern Medical Center, 5323 Harry Hines Blvd., Dallas, TX 75390-8542, United States. Fax: +1 214 645 2744.
E-mail address: [email protected] (H. Huang).
Please cite this article in press as: A. Ouyang et al., Methods (2014), http://dx.doi.org/10.1016/j.ymeth.2014.10.025
Austin Ouyang a, Tina Jeon a, Susan M. Sunkin b, Mihovil Pletikos c, Goran Sedmak c,d, Nenad Sestan c,Ed S. Lein b, Hao Huang a,e,⇑a Advanced Imaging Research Center, University of Texas Southwestern Medical Center, Dallas, TX 75390, United Statesb Allen Institute for Brain Science, Seattle, WA, United Statesc Department of Neurobiology and Kavli Institute for Neuroscience, Yale University School of Medicine, New Haven, CT 06510, United Statesd University of Zagreb School of Medicine, Croatian Institute for Brain Research, Salata 12, 10 000 Zagreb, Croatiae Department of Radiology, University of Texas Southwestern Medical Center, Dallas, TX 75390, United States
a r t i c l e i n f o
Article history:Received 15 March 2014Received in revised form 8 September 2014Accepted 21 October 2014Available online xxxx
Keywords:Human brain developmentFetal brainDTITractographyConnectionCortical mapping
a b s t r a c t
During human brain development from fetal stage to adulthood, the white matter (WM) tracts undergodramatic changes. Diffusion tensor imaging (DTI), a widely used magnetic resonance imaging (MRI)modality, offers insight into the dynamic changes of WM fibers as these fibers can be noninvasivelytraced and three-dimensionally (3D) reconstructed with DTI tractography. The DTI and conventionalT1 weighted MRI images also provide sufficient cortical anatomical details for mapping the corticalregions of interests (ROIs). In this paper, we described basic concepts and methods of DTI techniques thatcan be used to trace major WM tracts noninvasively from fetal brain of 14 postconceptional weeks (pcw)to adult brain. We applied these techniques to acquire DTI data and trace, reconstruct and visualize majorWM tracts during development. After categorizing major WM fiber bundles into five unique functionaltract groups, namely limbic, brain stem, projection, commissural and association tracts, we revealed for-mation and maturation of these 3D reconstructed WM tracts of the developing human brain. The struc-tural and connectional imaging data offered by DTI provides the anatomical backbone of transcriptionalatlas of the developing human brain.
� 2014 Elsevier Inc. All rights reserved.
1. Introduction
Human brain development is a complex and fascinating biologi-cal process. Starting as a simple tubular structure, the human brainundergoes a series of cellular and molecular processes underlyingboth microstructural and macrostructural changes during develop-ment. These cellular and molecular processes are precisely modu-lated by differential gene expressions [e.g. 1–4]. Understandingdynamics of neuroanatomy is complementary to establishing tran-scriptional atlas of the developing brain. Histology has been a dom-inant modality and remains to be an important method to study thedetailed neural structures of developing brains [5–10]. Diffusiontensor imaging (DTI) [11], based on diffusion magnetic resonanceimaging, has been effective to delineate the macrostructure andmicrostructure of developing brains. Compared to histology, DTI is
noninvasive, three-dimensional (3D) and requires much less timeto characterize the entire brain anatomy with the modern scanners.DTI based tractography can be used to effectively trace the majorwhite matter (WM) tracts noninvasively. Structural and connec-tional data from DTI, therefore, can serve as the anatomical back-bone for the transcriptional atlas of the developing brain.
Dramatic morphological changes of human brain take placeduring its development from early fetal stage to adulthood. Thebrain WM can be categorized into five tract groups based on theirfunctions, namely, limbic, brain stem, projection, commissural andassociation tracts. In the prenatal early fetal stage such as 14 post-conceptional weeks (pcw), most of traced major tracts with DTItractography are brain stem and limbic tracts [12–15]. The 3Dmorphology of these traced WM tracts provides complementaryinformation to the knowledge of WM obtained from histology atthis age [e.g. 16,17]. More WM tracts in different tract groupscan be appreciated with DTI tractography during fetal develop-ment until birth [12,13,18–20]. At birth, except the superior longi-tudinal fasciculus in the association tract group [e.g. 21], mostother major WM tracts including short association tracts are well
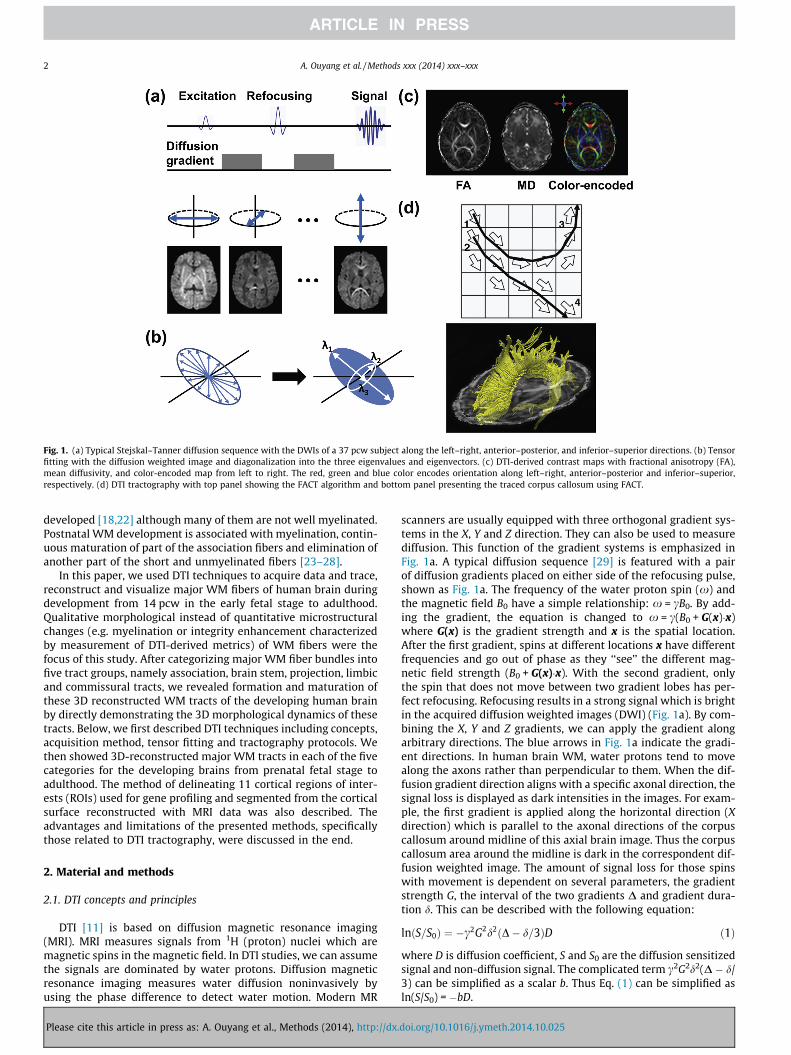
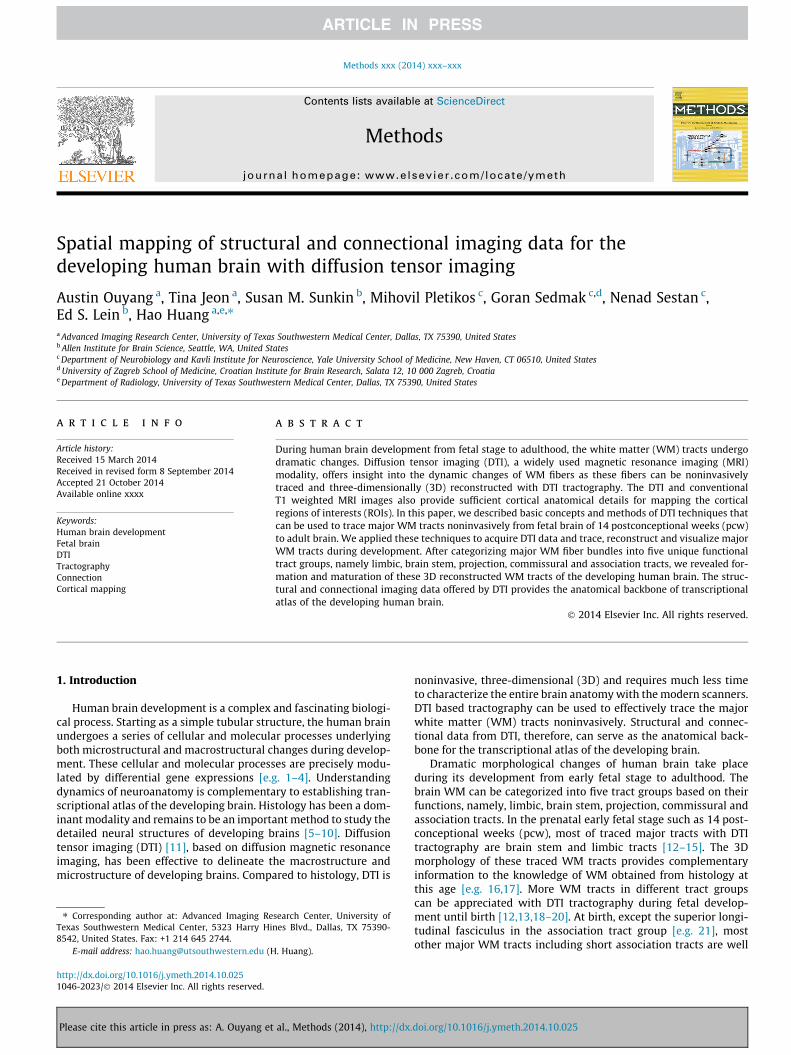
Fig. 1. (a) Typical Stejskal–Tanner diffusion sequence with the DWIs of a 37 pcw subject along the left–right, anterior–posterior, and inferior–superior directions. (b) Tensorfitting with the diffusion weighted image and diagonalization into the three eigenvalues and eigenvectors. (c) DTI-derived contrast maps with fractional anisotropy (FA),mean diffusivity, and color-encoded map from left to right. The red, green and blue color encodes orientation along left–right, anterior–posterior and inferior–superior,respectively. (d) DTI tractography with top panel showing the FACT algorithm and bottom panel presenting the traced corpus callosum using FACT.
2 A. Ouyang et al. / Methods xxx (2014) xxx–xxx
developed [18,22] although many of them are not well myelinated.Postnatal WM development is associated with myelination, contin-uous maturation of part of the association fibers and elimination ofanother part of the short and unmyelinated fibers [23–28].
In this paper, we used DTI techniques to acquire data and trace,reconstruct and visualize major WM fibers of human brain duringdevelopment from 14 pcw in the early fetal stage to adulthood.Qualitative morphological instead of quantitative microstructuralchanges (e.g. myelination or integrity enhancement characterizedby measurement of DTI-derived metrics) of WM fibers were thefocus of this study. After categorizing major WM fiber bundles intofive tract groups, namely association, brain stem, projection, limbicand commissural tracts, we revealed formation and maturation ofthese 3D reconstructed WM tracts of the developing human brainby directly demonstrating the 3D morphological dynamics of thesetracts. Below, we first described DTI techniques including concepts,acquisition method, tensor fitting and tractography protocols. Wethen showed 3D-reconstructed major WM tracts in each of the fivecategories for the developing brains from prenatal fetal stage toadulthood. The method of delineating 11 cortical regions of inter-ests (ROIs) used for gene profiling and segmented from the corticalsurface reconstructed with MRI data was also described. Theadvantages and limitations of the presented methods, specificallythose related to DTI tractography, were discussed in the end.
2. Material and methods
2.1. DTI concepts and principles
DTI [11] is based on diffusion magnetic resonance imaging(MRI). MRI measures signals from 1H (proton) nuclei which aremagnetic spins in the magnetic field. In DTI studies, we can assumethe signals are dominated by water protons. Diffusion magneticresonance imaging measures water diffusion noninvasively byusing the phase difference to detect water motion. Modern MR
Please cite this article in press as: A. Ouyang et al., Methods (2014), http://dx.
scanners are usually equipped with three orthogonal gradient sys-tems in the X, Y and Z direction. They can also be used to measurediffusion. This function of the gradient systems is emphasized inFig. 1a. A typical diffusion sequence [29] is featured with a pairof diffusion gradients placed on either side of the refocusing pulse,shown as Fig. 1a. The frequency of the water proton spin (x) andthe magnetic field B0 have a simple relationship: x = cB0. By add-ing the gradient, the equation is changed to x = c(B0 + G(x)�x)where G(x) is the gradient strength and x is the spatial location.After the first gradient, spins at different locations x have differentfrequencies and go out of phase as they ‘‘see’’ the different mag-netic field strength (B0 + G(x)�x). With the second gradient, onlythe spin that does not move between two gradient lobes has per-fect refocusing. Refocusing results in a strong signal which is brightin the acquired diffusion weighted images (DWI) (Fig. 1a). By com-bining the X, Y and Z gradients, we can apply the gradient alongarbitrary directions. The blue arrows in Fig. 1a indicate the gradi-ent directions. In human brain WM, water protons tend to movealong the axons rather than perpendicular to them. When the dif-fusion gradient direction aligns with a specific axonal direction, thesignal loss is displayed as dark intensities in the images. For exam-ple, the first gradient is applied along the horizontal direction (Xdirection) which is parallel to the axonal directions of the corpuscallosum around midline of this axial brain image. Thus the corpuscallosum area around the midline is dark in the correspondent dif-fusion weighted image. The amount of signal loss for those spinswith movement is dependent on several parameters, the gradientstrength G, the interval of the two gradients D and gradient dura-tion d. This can be described with the following equation:
lnðS=S0Þ ¼ �c2G2d2ðD� d=3ÞD ð1Þ
where D is diffusion coefficient, S and S0 are the diffusion sensitizedsignal and non-diffusion signal. The complicated term c2G2d2(D � d/3) can be simplified as a scalar b. Thus Eq. (1) can be simplified asln(S/S0) = �bD.
doi.org/10.1016/j.ymeth.2014.10.025
A. Ouyang et al. / Methods xxx (2014) xxx–xxx 3
As diffusion gradients can be applied to arbitrary directions, thediffusion profile composed of diffusion coefficients along thesedirections can be calculated. For simplification, the diffusion tensoris widely used to characterize the diffusion profile. Fig. 1b showsthe tensor fitting process. Since a diffusion tensor has six degreesof freedom, at least six diffusion sensitized images need to beacquired to fit the tensor besides a non-diffusion image. The prop-erties of the three-dimensional ellipsoid are usually defined by thefollowing parameters, the length of the longest, middle and short-est axes (called eigenvalues k1, k2 and k3) and their orientations(called eigenvectors m1, m2 and m3), shown in Fig. 1b. As the threeaxes are orthogonal to each other, only six parameters, i.e. k1, k2,k3 and x, y, z component of m1, are independent.
Fractional anisotropy (FA) [30] has been widely used to charac-terize the anisotropy of the tensor. The equations of FA is asfollows:
FA ¼
ffiffiffiffiffiffiffiffiffiffiffiffiffiffiffiffiffiffiffiffiffiffiffiffiffiffiffiffiffiffiffiffiffiffiffiffiffiffiffiffiffiffiffiffiffiffiffiffiffiffiffiffiffiffiffiffiffiffiffiffiffiffiffiffiffiffiffiffiffiffiffiffiffiffiðk1 � k2Þ2 þ ðk1 � k3Þ2 þ ðk2 � k3Þ2
q
ffiffiffi2p ffiffiffiffiffiffiffiffiffiffiffiffiffiffiffiffiffiffiffiffiffiffiffiffiffiffi
k21 þ k2
2 þ k23
q ð2Þ
DTI-derived FA map, mean diffusivity (MD) map, color-encodedmap are shown in Fig. 1c. The values of FA range from 0 to 1. The FAmap characterizes the shapes of the diffusion tensor. The higherthe value of FA is, the more elongated the shape of diffusion ellip-soid looks like. The eigenvector associated with the largest eigen-value (m1) can be used as an indicator of fiber orientation. DTIcolor-encoded map combines the information of FA and m1. In thecolormap, red (R), green (G), and blue (B) colors are assigned toleft–right, anterior–posterior, and superior–inferior orientations,respectively. The MD map depicts the size of diffusion ellipsoid.MD is a physical value and usually has the unit of 10�3 mm2/s.Detailed review of DTI and its derived metrics can be found inthe literature [31–33].
3D axonal bundles can be reconstructed from DTI data. Thedirection of the primary eigenvector (m1) of the tensor is believedto align with the orientation of its underlying organized structures.DTI-based tractography refers to the techniques of reconstructingthe pathways of the WM tracts based on diffusion tensor informa-tion. Streamline propagation methods [34–40] are mostly used.DTI-based tractography requires a fractional anisotropy valuehigher than threshold and orientation continuity of the primaryeigenvector. Upper panel of Fig. 1d shows the diagram of a widelyused streamline tractography, fiber assignment by continuoustracking (FACT) [34], which connects the primary eigenvectors ofdiffusion tensors to reconstruct axonal pathways. Fiber tracingswere initiated from voxel #1 and #2, respectively. With therestricting second region of interest (ROI) which is voxel #3 or#4, two lines were traced. An example of the 3D reconstructed37 pcw-brain corpus callosum (yellow fibers) traced with this FACTalgorithm is shown in the lower panel of Fig. 1d. Due to the factthat the diffusion tensor model oversimplifies complex neuralstructures inside the brain, many other tractography algorithmswhich adapt more sophisticated diffusion models rather than thetensor have been postulated. For major WM tracts, comparison ofthese DTI-based tractography and postmortem histological slideshas shown that tractography based on DTI could reveal generalmorphology of major WM tracts reliably [41,42].
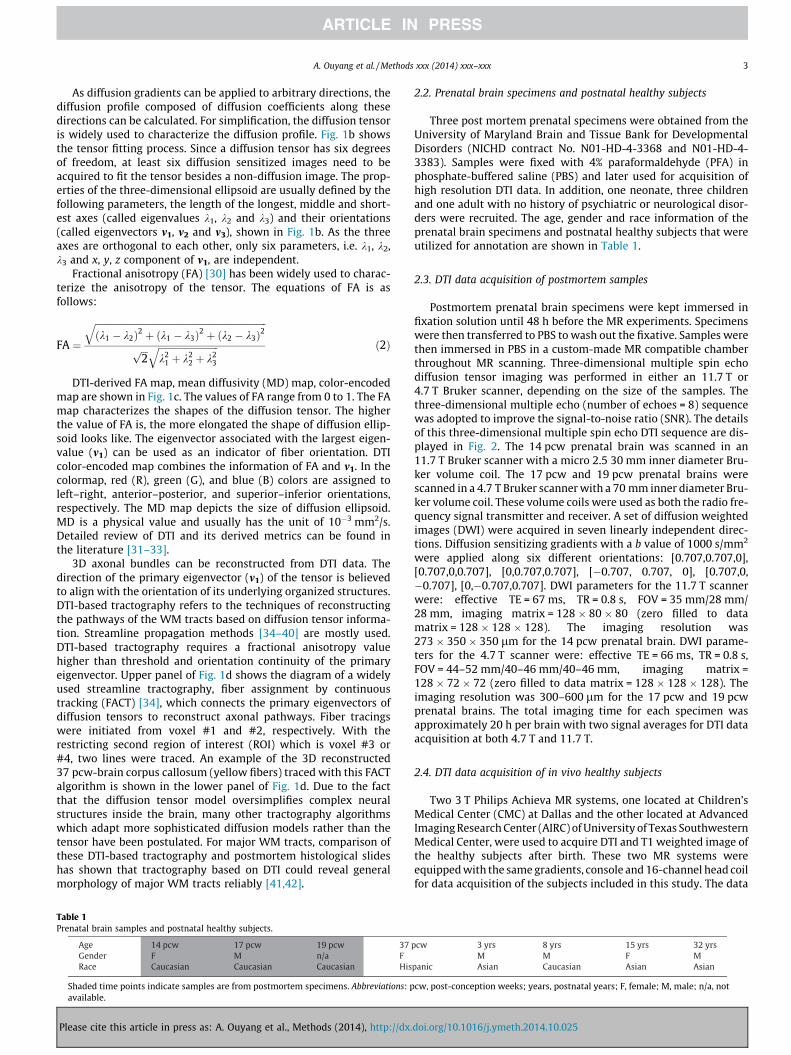
Table 1Prenatal brain samples and postnatal healthy subjects.
Shaded time points indicate samples are from postmortem specimens. Abbreviations: pavailable.
Please cite this article in press as: A. Ouyang et al., Methods (2014), http://dx.
2.2. Prenatal brain specimens and postnatal healthy subjects
Three post mortem prenatal specimens were obtained from theUniversity of Maryland Brain and Tissue Bank for DevelopmentalDisorders (NICHD contract No. N01-HD-4-3368 and N01-HD-4-3383). Samples were fixed with 4% paraformaldehyde (PFA) inphosphate-buffered saline (PBS) and later used for acquisition ofhigh resolution DTI data. In addition, one neonate, three childrenand one adult with no history of psychiatric or neurological disor-ders were recruited. The age, gender and race information of theprenatal brain specimens and postnatal healthy subjects that wereutilized for annotation are shown in Table 1.
2.3. DTI data acquisition of postmortem samples
Postmortem prenatal brain specimens were kept immersed infixation solution until 48 h before the MR experiments. Specimenswere then transferred to PBS to wash out the fixative. Samples werethen immersed in PBS in a custom-made MR compatible chamberthroughout MR scanning. Three-dimensional multiple spin echodiffusion tensor imaging was performed in either an 11.7 T or4.7 T Bruker scanner, depending on the size of the samples. Thethree-dimensional multiple echo (number of echoes = 8) sequencewas adopted to improve the signal-to-noise ratio (SNR). The detailsof this three-dimensional multiple spin echo DTI sequence are dis-played in Fig. 2. The 14 pcw prenatal brain was scanned in an11.7 T Bruker scanner with a micro 2.5 30 mm inner diameter Bru-ker volume coil. The 17 pcw and 19 pcw prenatal brains werescanned in a 4.7 T Bruker scanner with a 70 mm inner diameter Bru-ker volume coil. These volume coils were used as both the radio fre-quency signal transmitter and receiver. A set of diffusion weightedimages (DWI) were acquired in seven linearly independent direc-tions. Diffusion sensitizing gradients with a b value of 1000 s/mm2
were applied along six different orientations: [0.707,0.707,0],[0.707,0,0.707], [0,0.707,0.707], [�0.707, 0.707, 0], [0.707,0,�0.707], [0,�0.707,0.707]. DWI parameters for the 11.7 T scannerwere: effective TE = 67 ms, TR = 0.8 s, FOV = 35 mm/28 mm/28 mm, imaging matrix = 128 � 80 � 80 (zero filled to datamatrix = 128 � 128 � 128). The imaging resolution was273 � 350 � 350 lm for the 14 pcw prenatal brain. DWI parame-ters for the 4.7 T scanner were: effective TE = 66 ms, TR = 0.8 s,FOV = 44–52 mm/40–46 mm/40–46 mm, imaging matrix =128 � 72 � 72 (zero filled to data matrix = 128 � 128 � 128). Theimaging resolution was 300–600 lm for the 17 pcw and 19 pcwprenatal brains. The total imaging time for each specimen wasapproximately 20 h per brain with two signal averages for DTI dataacquisition at both 4.7 T and 11.7 T.
2.4. DTI data acquisition of in vivo healthy subjects
Two 3 T Philips Achieva MR systems, one located at Children’sMedical Center (CMC) at Dallas and the other located at AdvancedImaging Research Center (AIRC) of University of Texas SouthwesternMedical Center, were used to acquire DTI and T1 weighted image ofthe healthy subjects after birth. These two MR systems wereequipped with the same gradients, console and 16-channel head coilfor data acquisition of the subjects included in this study. The data
cw, post-conception weeks; years, postnatal years; F, female; M, male; n/a, not
doi.org/10.1016/j.ymeth.2014.10.025
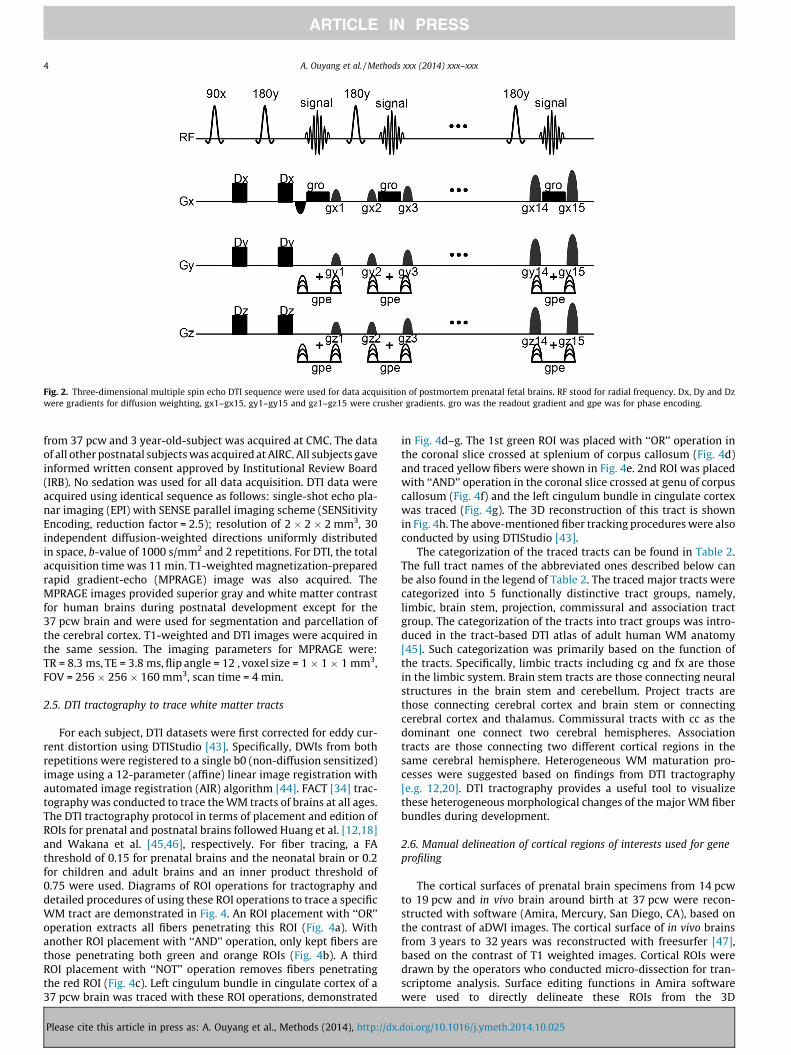
Fig. 2. Three-dimensional multiple spin echo DTI sequence were used for data acquisition of postmortem prenatal fetal brains. RF stood for radial frequency. Dx, Dy and Dzwere gradients for diffusion weighting, gx1–gx15, gy1–gy15 and gz1–gz15 were crusher gradients. gro was the readout gradient and gpe was for phase encoding.
4 A. Ouyang et al. / Methods xxx (2014) xxx–xxx
from 37 pcw and 3 year-old-subject was acquired at CMC. The dataof all other postnatal subjects was acquired at AIRC. All subjects gaveinformed written consent approved by Institutional Review Board(IRB). No sedation was used for all data acquisition. DTI data wereacquired using identical sequence as follows: single-shot echo pla-nar imaging (EPI) with SENSE parallel imaging scheme (SENSitivityEncoding, reduction factor = 2.5); resolution of 2 � 2 � 2 mm3, 30independent diffusion-weighted directions uniformly distributedin space, b-value of 1000 s/mm2 and 2 repetitions. For DTI, the totalacquisition time was 11 min. T1-weighted magnetization-preparedrapid gradient-echo (MPRAGE) image was also acquired. TheMPRAGE images provided superior gray and white matter contrastfor human brains during postnatal development except for the37 pcw brain and were used for segmentation and parcellation ofthe cerebral cortex. T1-weighted and DTI images were acquired inthe same session. The imaging parameters for MPRAGE were:TR = 8.3 ms, TE = 3.8 ms, flip angle = 12 , voxel size = 1 � 1 � 1 mm3,FOV = 256 � 256 � 160 mm3, scan time = 4 min.
2.5. DTI tractography to trace white matter tracts
For each subject, DTI datasets were first corrected for eddy cur-rent distortion using DTIStudio [43]. Specifically, DWIs from bothrepetitions were registered to a single b0 (non-diffusion sensitized)image using a 12-parameter (affine) linear image registration withautomated image registration (AIR) algorithm [44]. FACT [34] trac-tography was conducted to trace the WM tracts of brains at all ages.The DTI tractography protocol in terms of placement and edition ofROIs for prenatal and postnatal brains followed Huang et al. [12,18]and Wakana et al. [45,46], respectively. For fiber tracing, a FAthreshold of 0.15 for prenatal brains and the neonatal brain or 0.2for children and adult brains and an inner product threshold of0.75 were used. Diagrams of ROI operations for tractography anddetailed procedures of using these ROI operations to trace a specificWM tract are demonstrated in Fig. 4. An ROI placement with ‘‘OR’’operation extracts all fibers penetrating this ROI (Fig. 4a). Withanother ROI placement with ‘‘AND’’ operation, only kept fibers arethose penetrating both green and orange ROIs (Fig. 4b). A thirdROI placement with ‘‘NOT’’ operation removes fibers penetratingthe red ROI (Fig. 4c). Left cingulum bundle in cingulate cortex of a37 pcw brain was traced with these ROI operations, demonstrated
Please cite this article in press as: A. Ouyang et al., Methods (2014), http://dx.
in Fig. 4d–g. The 1st green ROI was placed with ‘‘OR’’ operation inthe coronal slice crossed at splenium of corpus callosum (Fig. 4d)and traced yellow fibers were shown in Fig. 4e. 2nd ROI was placedwith ‘‘AND’’ operation in the coronal slice crossed at genu of corpuscallosum (Fig. 4f) and the left cingulum bundle in cingulate cortexwas traced (Fig. 4g). The 3D reconstruction of this tract is shownin Fig. 4h. The above-mentioned fiber tracking procedures were alsoconducted by using DTIStudio [43].
The categorization of the traced tracts can be found in Table 2.The full tract names of the abbreviated ones described below canbe also found in the legend of Table 2. The traced major tracts werecategorized into 5 functionally distinctive tract groups, namely,limbic, brain stem, projection, commissural and association tractgroup. The categorization of the tracts into tract groups was intro-duced in the tract-based DTI atlas of adult human WM anatomy[45]. Such categorization was primarily based on the function ofthe tracts. Specifically, limbic tracts including cg and fx are thosein the limbic system. Brain stem tracts are those connecting neuralstructures in the brain stem and cerebellum. Project tracts arethose connecting cerebral cortex and brain stem or connectingcerebral cortex and thalamus. Commissural tracts with cc as thedominant one connect two cerebral hemispheres. Associationtracts are those connecting two different cortical regions in thesame cerebral hemisphere. Heterogeneous WM maturation pro-cesses were suggested based on findings from DTI tractography[e.g. 12,20]. DTI tractography provides a useful tool to visualizethese heterogeneous morphological changes of the major WM fiberbundles during development.
2.6. Manual delineation of cortical regions of interests used for geneprofiling
The cortical surfaces of prenatal brain specimens from 14 pcwto 19 pcw and in vivo brain around birth at 37 pcw were recon-structed with software (Amira, Mercury, San Diego, CA), based onthe contrast of aDWI images. The cortical surface of in vivo brainsfrom 3 years to 32 years was reconstructed with freesurfer [47],based on the contrast of T1 weighted images. Cortical ROIs weredrawn by the operators who conducted micro-dissection for tran-scriptome analysis. Surface editing functions in Amira softwarewere used to directly delineate these ROIs from the 3D
doi.org/10.1016/j.ymeth.2014.10.025
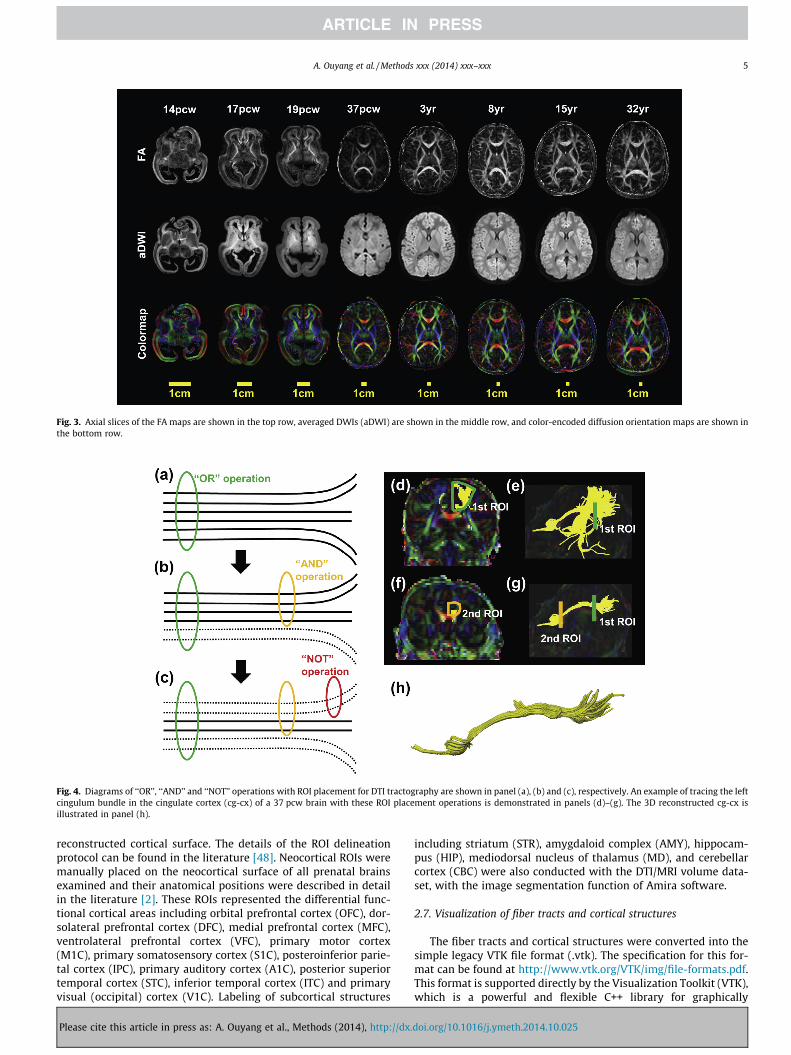
Fig. 3. Axial slices of the FA maps are shown in the top row, averaged DWIs (aDWI) are shown in the middle row, and color-encoded diffusion orientation maps are shown inthe bottom row.
Fig. 4. Diagrams of ‘‘OR’’, ‘‘AND’’ and ‘‘NOT’’ operations with ROI placement for DTI tractography are shown in panel (a), (b) and (c), respectively. An example of tracing the leftcingulum bundle in the cingulate cortex (cg-cx) of a 37 pcw brain with these ROI placement operations is demonstrated in panels (d)–(g). The 3D reconstructed cg-cx isillustrated in panel (h).
A. Ouyang et al. / Methods xxx (2014) xxx–xxx 5
reconstructed cortical surface. The details of the ROI delineationprotocol can be found in the literature [48]. Neocortical ROIs weremanually placed on the neocortical surface of all prenatal brainsexamined and their anatomical positions were described in detailin the literature [2]. These ROIs represented the differential func-tional cortical areas including orbital prefrontal cortex (OFC), dor-solateral prefrontal cortex (DFC), medial prefrontal cortex (MFC),ventrolateral prefrontal cortex (VFC), primary motor cortex(M1C), primary somatosensory cortex (S1C), posteroinferior parie-tal cortex (IPC), primary auditory cortex (A1C), posterior superiortemporal cortex (STC), inferior temporal cortex (ITC) and primaryvisual (occipital) cortex (V1C). Labeling of subcortical structures
Please cite this article in press as: A. Ouyang et al., Methods (2014), http://dx.
including striatum (STR), amygdaloid complex (AMY), hippocam-pus (HIP), mediodorsal nucleus of thalamus (MD), and cerebellarcortex (CBC) were also conducted with the DTI/MRI volume data-set, with the image segmentation function of Amira software.
2.7. Visualization of fiber tracts and cortical structures
The fiber tracts and cortical structures were converted into thesimple legacy VTK file format (.vtk). The specification for this for-mat can be found at http://www.vtk.org/VTK/img/file-formats.pdf.This format is supported directly by the Visualization Toolkit (VTK),which is a powerful and flexible C++ library for graphically
doi.org/10.1016/j.ymeth.2014.10.025
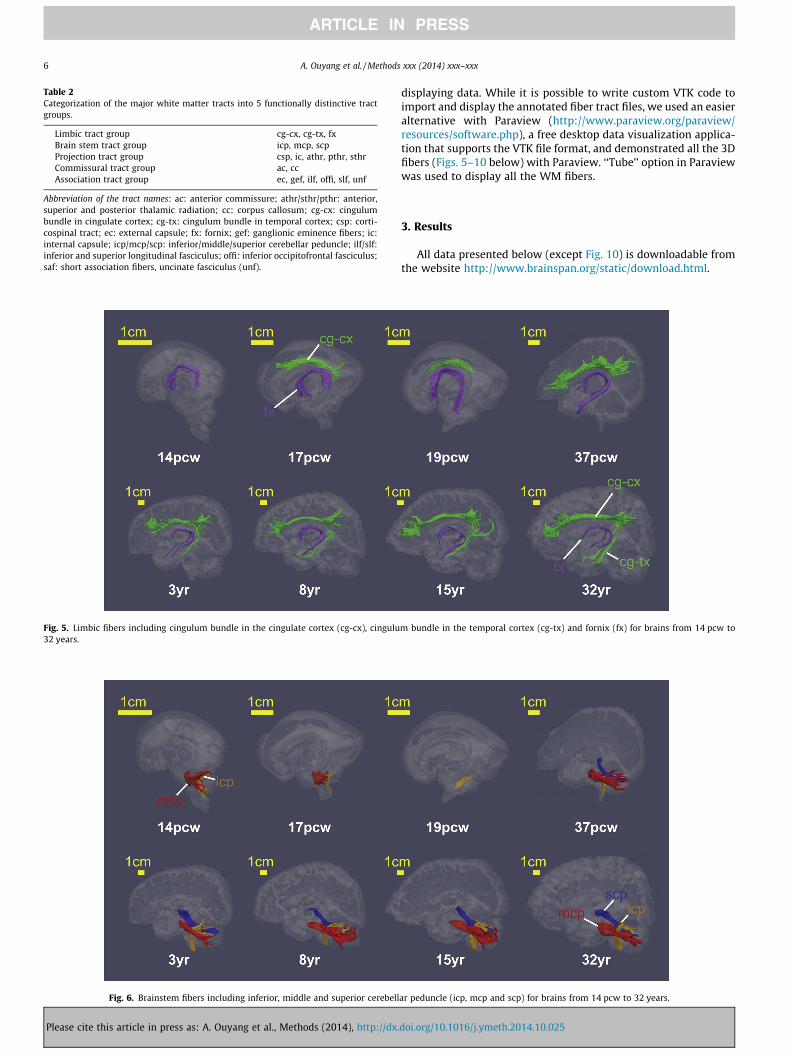
Table 2Categorization of the major white matter tracts into 5 functionally distinctive tractgroups.
Limbic tract group cg-cx, cg-tx, fxBrain stem tract group icp, mcp, scpProjection tract group csp, ic, athr, pthr, sthrCommissural tract group ac, ccAssociation tract group ec, gef, ilf, offi, slf, unf
Abbreviation of the tract names: ac: anterior commissure; athr/sthr/pthr: anterior,superior and posterior thalamic radiation; cc: corpus callosum; cg-cx: cingulumbundle in cingulate cortex; cg-tx: cingulum bundle in temporal cortex; csp: corti-cospinal tract; ec: external capsule; fx: fornix; gef: ganglionic eminence fibers; ic:internal capsule; icp/mcp/scp: inferior/middle/superior cerebellar peduncle; ilf/slf:inferior and superior longitudinal fasciculus; offi: inferior occipitofrontal fasciculus;saf: short association fibers, uncinate fasciculus (unf).
Fig. 5. Limbic fibers including cingulum bundle in the cingulate cortex (cg-cx), cingulu32 years.
Fig. 6. Brainstem fibers including inferior, middle and superior cerebell
6 A. Ouyang et al. / Methods xxx (2014) xxx–xxx
Please cite this article in press as: A. Ouyang et al., Methods (2014), http://dx.
displaying data. While it is possible to write custom VTK code toimport and display the annotated fiber tract files, we used an easieralternative with Paraview (http://www.paraview.org/paraview/resources/software.php), a free desktop data visualization applica-tion that supports the VTK file format, and demonstrated all the 3Dfibers (Figs. 5–10 below) with Paraview. ‘‘Tube’’ option in Paraviewwas used to display all the WM fibers.
3. Results
All data presented below (except Fig. 10) is downloadable fromthe website http://www.brainspan.org/static/download.html.
m bundle in the temporal cortex (cg-tx) and fornix (fx) for brains from 14 pcw to
ar peduncle (icp, mcp and scp) for brains from 14 pcw to 32 years.
doi.org/10.1016/j.ymeth.2014.10.025
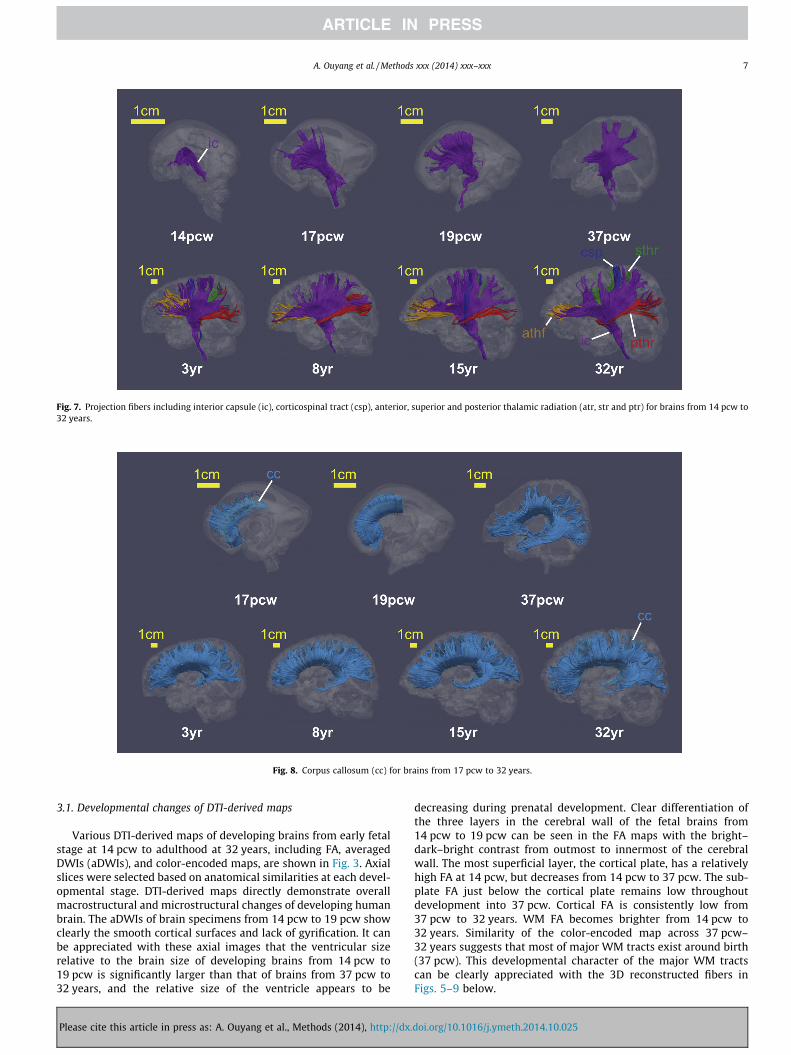
Fig. 7. Projection fibers including interior capsule (ic), corticospinal tract (csp), anterior, superior and posterior thalamic radiation (atr, str and ptr) for brains from 14 pcw to32 years.
Fig. 8. Corpus callosum (cc) for brains from 17 pcw to 32 years.
A. Ouyang et al. / Methods xxx (2014) xxx–xxx 7
3.1. Developmental changes of DTI-derived maps
Various DTI-derived maps of developing brains from early fetalstage at 14 pcw to adulthood at 32 years, including FA, averagedDWIs (aDWIs), and color-encoded maps, are shown in Fig. 3. Axialslices were selected based on anatomical similarities at each devel-opmental stage. DTI-derived maps directly demonstrate overallmacrostructural and microstructural changes of developing humanbrain. The aDWIs of brain specimens from 14 pcw to 19 pcw showclearly the smooth cortical surfaces and lack of gyrification. It canbe appreciated with these axial images that the ventricular sizerelative to the brain size of developing brains from 14 pcw to19 pcw is significantly larger than that of brains from 37 pcw to32 years, and the relative size of the ventricle appears to be
Please cite this article in press as: A. Ouyang et al., Methods (2014), http://dx.
decreasing during prenatal development. Clear differentiation ofthe three layers in the cerebral wall of the fetal brains from14 pcw to 19 pcw can be seen in the FA maps with the bright–dark–bright contrast from outmost to innermost of the cerebralwall. The most superficial layer, the cortical plate, has a relativelyhigh FA at 14 pcw, but decreases from 14 pcw to 37 pcw. The sub-plate FA just below the cortical plate remains low throughoutdevelopment into 37 pcw. Cortical FA is consistently low from37 pcw to 32 years. WM FA becomes brighter from 14 pcw to32 years. Similarity of the color-encoded map across 37 pcw–32 years suggests that most of major WM tracts exist around birth(37 pcw). This developmental character of the major WM tractscan be clearly appreciated with the 3D reconstructed fibers inFigs. 5–9 below.
doi.org/10.1016/j.ymeth.2014.10.025
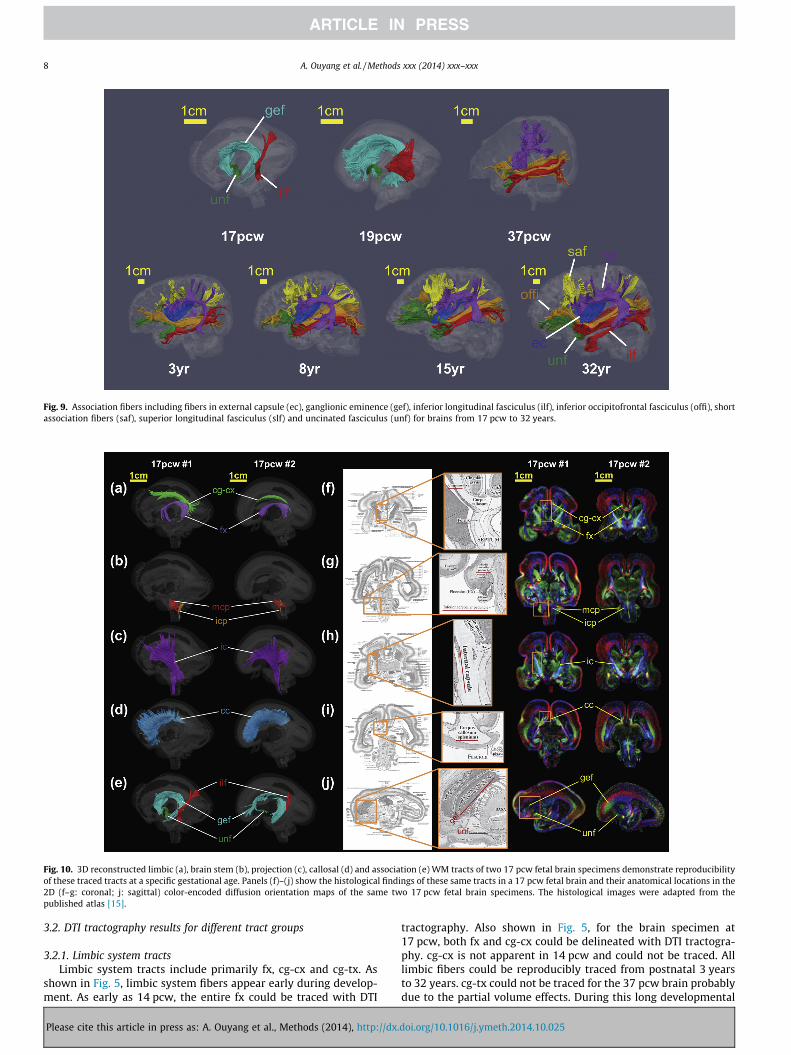
Fig. 9. Association fibers including fibers in external capsule (ec), ganglionic eminence (gef), inferior longitudinal fasciculus (ilf), inferior occipitofrontal fasciculus (offi), shortassociation fibers (saf), superior longitudinal fasciculus (slf) and uncinated fasciculus (unf) for brains from 17 pcw to 32 years.
Fig. 10. 3D reconstructed limbic (a), brain stem (b), projection (c), callosal (d) and association (e) WM tracts of two 17 pcw fetal brain specimens demonstrate reproducibilityof these traced tracts at a specific gestational age. Panels (f)–(j) show the histological findings of these same tracts in a 17 pcw fetal brain and their anatomical locations in the2D (f–g: coronal; j: sagittal) color-encoded diffusion orientation maps of the same two 17 pcw fetal brain specimens. The histological images were adapted from thepublished atlas [15].
8 A. Ouyang et al. / Methods xxx (2014) xxx–xxx
3.2. DTI tractography results for different tract groups
3.2.1. Limbic system tractsLimbic system tracts include primarily fx, cg-cx and cg-tx. As
shown in Fig. 5, limbic system fibers appear early during develop-ment. As early as 14 pcw, the entire fx could be traced with DTI
Please cite this article in press as: A. Ouyang et al., Methods (2014), http://dx.
tractography. Also shown in Fig. 5, for the brain specimen at17 pcw, both fx and cg-cx could be delineated with DTI tractogra-phy. cg-cx is not apparent in 14 pcw and could not be traced. Alllimbic fibers could be reproducibly traced from postnatal 3 yearsto 32 years. cg-tx could not be traced for the 37 pcw brain probablydue to the partial volume effects. During this long developmental
doi.org/10.1016/j.ymeth.2014.10.025
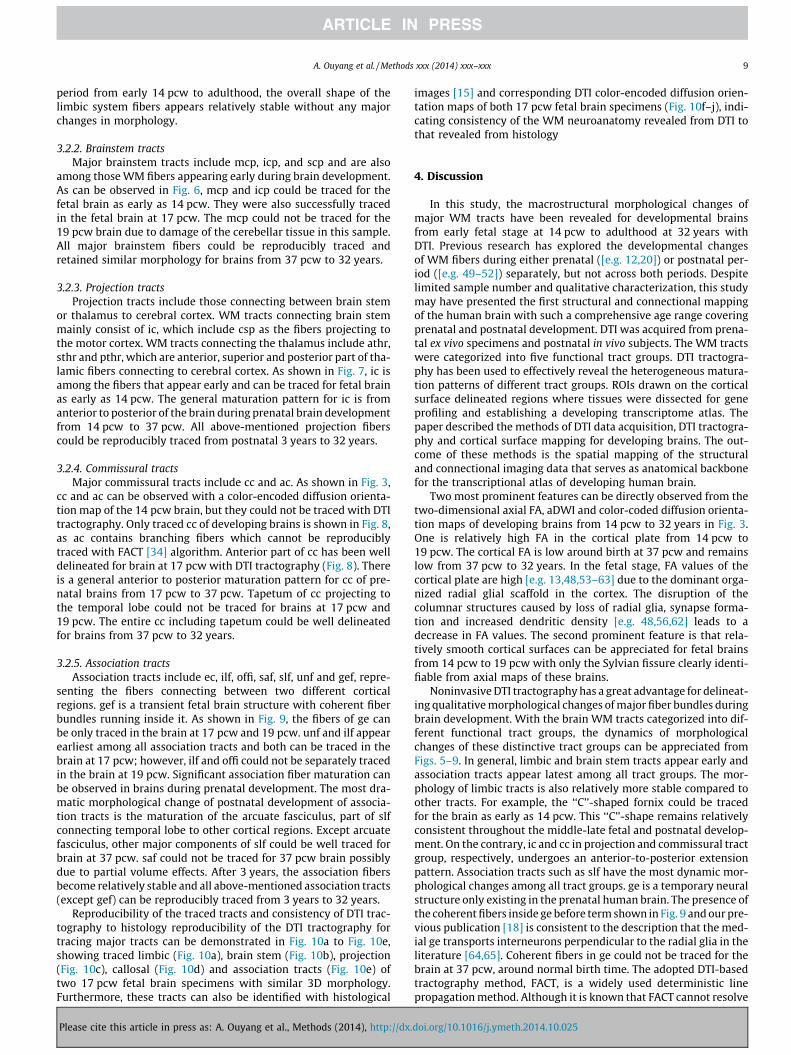
A. Ouyang et al. / Methods xxx (2014) xxx–xxx 9
period from early 14 pcw to adulthood, the overall shape of thelimbic system fibers appears relatively stable without any majorchanges in morphology.
3.2.2. Brainstem tractsMajor brainstem tracts include mcp, icp, and scp and are also
among those WM fibers appearing early during brain development.As can be observed in Fig. 6, mcp and icp could be traced for thefetal brain as early as 14 pcw. They were also successfully tracedin the fetal brain at 17 pcw. The mcp could not be traced for the19 pcw brain due to damage of the cerebellar tissue in this sample.All major brainstem fibers could be reproducibly traced andretained similar morphology for brains from 37 pcw to 32 years.
3.2.3. Projection tractsProjection tracts include those connecting between brain stem
or thalamus to cerebral cortex. WM tracts connecting brain stemmainly consist of ic, which include csp as the fibers projecting tothe motor cortex. WM tracts connecting the thalamus include athr,sthr and pthr, which are anterior, superior and posterior part of tha-lamic fibers connecting to cerebral cortex. As shown in Fig. 7, ic isamong the fibers that appear early and can be traced for fetal brainas early as 14 pcw. The general maturation pattern for ic is fromanterior to posterior of the brain during prenatal brain developmentfrom 14 pcw to 37 pcw. All above-mentioned projection fiberscould be reproducibly traced from postnatal 3 years to 32 years.
3.2.4. Commissural tractsMajor commissural tracts include cc and ac. As shown in Fig. 3,
cc and ac can be observed with a color-encoded diffusion orienta-tion map of the 14 pcw brain, but they could not be traced with DTItractography. Only traced cc of developing brains is shown in Fig. 8,as ac contains branching fibers which cannot be reproduciblytraced with FACT [34] algorithm. Anterior part of cc has been welldelineated for brain at 17 pcw with DTI tractography (Fig. 8). Thereis a general anterior to posterior maturation pattern for cc of pre-natal brains from 17 pcw to 37 pcw. Tapetum of cc projecting tothe temporal lobe could not be traced for brains at 17 pcw and19 pcw. The entire cc including tapetum could be well delineatedfor brains from 37 pcw to 32 years.
3.2.5. Association tractsAssociation tracts include ec, ilf, offi, saf, slf, unf and gef, repre-
senting the fibers connecting between two different corticalregions. gef is a transient fetal brain structure with coherent fiberbundles running inside it. As shown in Fig. 9, the fibers of ge canbe only traced in the brain at 17 pcw and 19 pcw. unf and ilf appearearliest among all association tracts and both can be traced in thebrain at 17 pcw; however, ilf and offi could not be separately tracedin the brain at 19 pcw. Significant association fiber maturation canbe observed in brains during prenatal development. The most dra-matic morphological change of postnatal development of associa-tion tracts is the maturation of the arcuate fasciculus, part of slfconnecting temporal lobe to other cortical regions. Except arcuatefasciculus, other major components of slf could be well traced forbrain at 37 pcw. saf could not be traced for 37 pcw brain possiblydue to partial volume effects. After 3 years, the association fibersbecome relatively stable and all above-mentioned association tracts(except gef) can be reproducibly traced from 3 years to 32 years.
Reproducibility of the traced tracts and consistency of DTI trac-tography to histology reproducibility of the DTI tractography fortracing major tracts can be demonstrated in Fig. 10a to Fig. 10e,showing traced limbic (Fig. 10a), brain stem (Fig. 10b), projection(Fig. 10c), callosal (Fig. 10d) and association tracts (Fig. 10e) oftwo 17 pcw fetal brain specimens with similar 3D morphology.Furthermore, these tracts can also be identified with histological
Please cite this article in press as: A. Ouyang et al., Methods (2014), http://dx.
images [15] and corresponding DTI color-encoded diffusion orien-tation maps of both 17 pcw fetal brain specimens (Fig. 10f–j), indi-cating consistency of the WM neuroanatomy revealed from DTI tothat revealed from histology
4. Discussion
In this study, the macrostructural morphological changes ofmajor WM tracts have been revealed for developmental brainsfrom early fetal stage at 14 pcw to adulthood at 32 years withDTI. Previous research has explored the developmental changesof WM fibers during either prenatal ([e.g. 12,20]) or postnatal per-iod ([e.g. 49–52]) separately, but not across both periods. Despitelimited sample number and qualitative characterization, this studymay have presented the first structural and connectional mappingof the human brain with such a comprehensive age range coveringprenatal and postnatal development. DTI was acquired from prena-tal ex vivo specimens and postnatal in vivo subjects. The WM tractswere categorized into five functional tract groups. DTI tractogra-phy has been used to effectively reveal the heterogeneous matura-tion patterns of different tract groups. ROIs drawn on the corticalsurface delineated regions where tissues were dissected for geneprofiling and establishing a developing transcriptome atlas. Thepaper described the methods of DTI data acquisition, DTI tractogra-phy and cortical surface mapping for developing brains. The out-come of these methods is the spatial mapping of the structuraland connectional imaging data that serves as anatomical backbonefor the transcriptional atlas of developing human brain.
Two most prominent features can be directly observed from thetwo-dimensional axial FA, aDWI and color-coded diffusion orienta-tion maps of developing brains from 14 pcw to 32 years in Fig. 3.One is relatively high FA in the cortical plate from 14 pcw to19 pcw. The cortical FA is low around birth at 37 pcw and remainslow from 37 pcw to 32 years. In the fetal stage, FA values of thecortical plate are high [e.g. 13,48,53–63] due to the dominant orga-nized radial glial scaffold in the cortex. The disruption of thecolumnar structures caused by loss of radial glia, synapse forma-tion and increased dendritic density [e.g. 48,56,62] leads to adecrease in FA values. The second prominent feature is that rela-tively smooth cortical surfaces can be appreciated for fetal brainsfrom 14 pcw to 19 pcw with only the Sylvian fissure clearly identi-fiable from axial maps of these brains.
Noninvasive DTI tractography has a great advantage for delineat-ing qualitative morphological changes of major fiber bundles duringbrain development. With the brain WM tracts categorized into dif-ferent functional tract groups, the dynamics of morphologicalchanges of these distinctive tract groups can be appreciated fromFigs. 5–9. In general, limbic and brain stem tracts appear early andassociation tracts appear latest among all tract groups. The mor-phology of limbic tracts is also relatively more stable compared toother tracts. For example, the ‘‘C’’-shaped fornix could be tracedfor the brain as early as 14 pcw. This ‘‘C’’-shape remains relativelyconsistent throughout the middle-late fetal and postnatal develop-ment. On the contrary, ic and cc in projection and commissural tractgroup, respectively, undergoes an anterior-to-posterior extensionpattern. Association tracts such as slf have the most dynamic mor-phological changes among all tract groups. ge is a temporary neuralstructure only existing in the prenatal human brain. The presence ofthe coherent fibers inside ge before term shown in Fig. 9 and our pre-vious publication [18] is consistent to the description that the med-ial ge transports interneurons perpendicular to the radial glia in theliterature [64,65]. Coherent fibers in ge could not be traced for thebrain at 37 pcw, around normal birth time. The adopted DTI-basedtractography method, FACT, is a widely used deterministic linepropagation method. Although it is known that FACT cannot resolve
doi.org/10.1016/j.ymeth.2014.10.025
10 A. Ouyang et al. / Methods xxx (2014) xxx–xxx
crossing or branching fibers, it is effective in characterizing majorWM fiber bundles after it is combined with brute force and multi-ROI approach [66].
The anatomical information from advanced neural imagingtechniques such as high resolution DTI serves as the anatomicalbackbone for the transcriptional atlas. In the future, it is possibleto set up a one-to-one correspondence between structural mea-surement and gene expression at specific cortical locations. Inte-grating the information from DTI/MRI and gene profiling willhave multiple advantages of accessing complicated brain develop-mental processes. First, associating the cortical map of geneexpression profiling to the cortical map of structural measure-ments helps explain why orderly structural changes occur. Second,DTI/MRI is a noninvasive approach. With the advent of ever moresophisticated MRI technology, high-quality DTI/MRI data willbecome readily available. These advances of DTI/MRI technologiesprovide the possibility of obtaining the sophisticated structuralinformation from not only the in vivo postnatal developing brainsbut also in vivo prenatal fetal brains (with in utero DTI/MRI) nonin-vasively. Establishing the correlation between DTI and gene profil-ing could potentially help interpret structural measurements fromDTI/MRI with gene expression, and vice versa.
There are several limitations of this study. DTI tractographycannot differentiate anterograde and retrograde directions, so pro-jection tract group includes fibers in both directions, i.e. those pro-jecting from brain stem and thalamus to the cerebral cortex andthose from cerebral cortex to subcortical structures. The demon-strated results are mixed ones from both ex vivo and in vivo DTIdata which were acquired with the MR scanners of different mag-netic strengths. With current MR technology limitations, it is stillnot practical to acquire in vivo fetal brain DTI with the high resolu-tion presented in this study from a clinical MR system. Due to theselimitations, only qualitative description of the macrostructuralanatomy of the developing brain from the perspective of DTI trac-tography was presented, as the tractography of WM fibers from adeterministic tracing method is not sensitive to differences of mag-netic strengths or acquisition protocols given sufficient signal-to-noise ratio and resolution of the data. Deterministic tractographyis controlled by two parameters, FA and primary eigenvector of dif-fusion tensor. It has been proved that FA, as a relative index, is notsensitive to fixation [i.e. [67,68]]. In addition, the primary eigen-vector is not sensitive to differences of magnetic strength andimaging protocol. For example, the color-encoded diffusion orien-tation maps of the brain stem from in vivo DTI acquired with a1.5 T scanner and from ex vivo DTI acquired with an 11.7 T scannerdemonstrate similar contrast in a recent study [69]. Besides ourtractography study with postmortem fetal brain samples, similarstudies of postmortem fetal brain samples [20,63] also demon-strated that the tractography could reflect the underlying WM fiberpathways. DTI tractography, however, is sensitive to the factorssuch as image resolution, myelination and coherence of the WMfibers. Some fibers, such as cc of 14 pcw brain, can be well appre-ciated in the DTI color-encoded map (Fig. 3), but cannot be tracedwith DTI tractography (Fig. 8) possibly due to these factors. Thesources of variability of DTI tractography of postmortem fetal brainspecimens could also be related to fixation and tissue damage. Forexample, mcp was identified in the histological atlas of the 19 pcwbrain [15], but we were not able to successfully trace mcp of thepostmortem 19 pcw brain in the Fig. 6 as the cerebellum and brainstem were among the neural structures most easily damaged dur-ing the processes of specimen preparation or transportation.Despite the limitations especially related to ex vivo DTI of postmor-tem fetal brain specimens, Fig. 10 demonstrates that the overallmorphology of major WM tracts revealed from DTI tractographyis reproducible in different brain specimens and consistent to thehistological findings. Small fibers, such as ‘‘U’’-shaped fibers in
Please cite this article in press as: A. Ouyang et al., Methods (2014), http://dx.
peripheral WM, are difficult to trace with the current image reso-lution and limitations of DTI tractography algorithms includingFACT. Therefore, we did not include tractography of any such fiberin this paper. There is no quantitative DTI methods described inthis paper. Although several DTI derived metrics, such as axial orradial diffusivity, offer unique quantitative and microstructuralinsight into both cortical and WM development, the differencesof ex vivo and in vivo DTI and MR scanners can result in significantbiases on these microstructural measurements. The number ofsamples is limited and it makes quantitative and statistical analysisof structural development with DTI/MRI not possible.
5. Conclusion
DTI imaging and tractography have provided an effective meansfor noninvasively characterizing the anatomical and connectionalchanges of developing brains from early fetal stage to adulthood.The heterogeneous formation and maturation processes of WMtracts categorized into five functional tract groups have beenrevealed. Reproducibility of the major tracts traced with DTI tractog-raphy and consistency of these traced tracts to the histological find-ings were also illustrated. The structural and connectional imagingdata offered by DTI provides an anatomical backbone of transcrip-tional atlas of the developing human brain (www.brainspan.org).
Acknowledgments
This study is sponsored by NIH grants MH092535,MH092535S1, MH089921, MH081896, MH089929 and NS051869.
References
[1] M.B. Johnson, Y.I. Kawasaw, C.E. Mason, Z. Krsnik, G. Coppola, D. Bogdanovic,D.H. Geschwind, S.M. Mane, M.W. State, N. Sestan, Neuron 62 (2009) 494–509.
[2] H.J. Kang, Y.I. Kawasawa, F. Cheng, Y. Zhu, X. Xu, M. Li, A.M.M. Sousa, M.Pletikos, K.A. Meyer, G. Sedmak, T. Guennel, Y. Shin, M.B. Johnson, Z. Krsnik, S.Mayer, S. Fertuzinhos, S. Umlauf, S.N. Lisgo, A. Vortmeyer, D.R. Weinberger, S.Mane, T.M. Hyde, A. Huttner, M. Reimers, J.E. Kleinman, N. Sestan, Nature 478(2011) 483–489.
[3] M. Pletikos, A.M.M. Sousa, G. Sedmak, K.A. Meyer, Y. Zhu, F. Cheng, M. Li, Y.Kawasawa, N. Sestan, Neuron 81 (2014) 321–332.
[4] E.S. Lein, M.J. Hawrylycz, N. Ao, M. Ayres, A. Bensinger, A. Bernard, A.F. Boe,M.S. Boguski, K.S. Brockway, E.J. Byrnes, L. Chen, L. Chen, T.M. Chen, M.C. Chin,J. Chong, B.E. Crook, A. Czaplinska, C.N. Dang, S. Datta, N.R. Dee, A.L. Desaki, T.Desta, E. Diep, T.A. Dolbeare, M.J. Donelan, H.W. Dong, J.G. Dougherty, B.J.Duncan, A.J. Ebbert, G. Eichele, L.K. Estin, C. Faber, B.A. Facer, R. Fields, S.R.Fischer, T.P. Fliss, C. Frensley, S.N. Gates, K.J. Glattfelder, K.R. Halverson, M.R.Hart, J.G. Hohmann, M.P. Howell, D.P. Jeung, R.A. Johnson, P.T. Karr, R. Kawal,J.M. Kidney, R.H. Knapik, C.L. Kuan, J.H. Lake, A.R. Laramee, K.D. Larsen, C. Lau,T.A. Lemon, A.J. Liang, Y. Liu, L.T. Luong, J. Michaels, J.J. Morgan, R.J. Morgan,M.T. Mortrud, N.F. Mosqueda, L.L. Ng, R. Ng, G.J. Orta, C.C. Overly, T.H. Pak, S.E.Parry, S.D. Pathak, O.C. Pearson, R.B. Puchalski, Z.L. Riley, H.R. Rockett, S.A.Rowland, J.J. Royall, M.J. Ruiz, N.R. Sarno, K. Schaffnit, N.V. Shapovalova, T.Sivisay, C.R. Slaughterbeck, S.C. Smith, K.A. Smith, B.I. Smith, A.J. Sodt, N.N.Stewart, K.R. Stumpf, S.M. Sunkin, M. Sutram, A. Tam, C.D. Teemer, C. Thaller,C.L. Thompson, L.R. Varnam, A. Visel, R.M. Whitlock, P.E. Wohnoutka, C.K.Wolkey, V.Y. Wong, M. Wood, M.B. Yaylaoglu, R.C. Young, B.L. Youngstrom, X.F.Yuan, B. Zhang, T.A. Zwingman, A.R. Jones, Nature 445 (2007) 168–176.
[5] P. Rakic, J. Comp. Neurol. 145 (1972) 61–83.[6] P. Rakic, Science 241 (1988) 170–176.[7] R.L. Sidman, P. Rakic, Brain Res. 62 (1973) 1–35.[8] R.L. Sidman, P. Rakic, in: W. Haymaker, R.D. Adams (Eds.), Histology and
Histopathology of the Nervous System, Springfield, Illinois, 1982, pp. 3–145.[9] L.S. Honig, K. Herrmann, C.J. Shatz, Cereb. Cortex 6 (1996) 794–806.
[10] J.J. Volpe, Pediatr. Res. 50 (2001) 553–562.[11] P.J. Basser, J. Mattiello, D.L. Bihan, Biophys. J. 66 (1994) 259–267.[12] H. Huang, R. Xue, J. Zhang, T. Ren, L.J. Richards, P. Yarowsky, M.I. Miller, S. Mori,
J. Neurosci. 29 (2009) 4263–4273.[13] H. Huang, L. Vasung, Int. J. Dev. Neurosci. 32 (2014) 11–22.[14] S.A. Bayer, J. Altman, The Human Brain During the Third Trimester, CRC, Boca
Raton, FL, 2004.[15] S.A. Bayer, J. Altman, The Human Brain During the Second Trimester, CRC, Boca
Raton, FL, 2005.[16] I. Kostovic, P.S. Goldman-Rakic, J. Comp. Neurol. 219 (1983) 431–447.[17] I. Kostovic, Neuroscience 17 (1986) 1047–1077.
doi.org/10.1016/j.ymeth.2014.10.025

A. Ouyang et al. / Methods xxx (2014) xxx–xxx 11
[18] H. Huang, J. Zhang, S. Wakana, W. Zhang, T. Ren, L.J. Richards, P. Yarowsky, P.Donohue, E. Graham, P.C.M. van Zijl, S. Mori, Neuroimage 33 (2006) 27–38.
[19] H. Huang, Neuroscientist 16 (2010) 634–649.[20] E. Takahashi, R.D. Folkerth, A.M. Galaburda, P.E. Grant, Cereb. Cortex 22 (2012)
455–464.[21] J. Zhang, A. Evans, L. Hermove, S.K. Lee, S. Wakana, W. Zhang, P. Donohue, M.I.
Miller, H. Huang, X. Want, P.C. van Zijl, S. Mori, Neuroimage 38 (2007) 239–247.
[22] K. Oishi, S. Mori, P.K. Donohue, T. Ernst, L. Anderson, S. Buchthal, A. Faria, H.Jiang, X. Li, M.I. Miller, P.C. van Zijl, L. Chang, Neuroimage 56 (2011) 8–20.
[23] G.M. Innocenti, Science 212 (1981) 824–826.[24] W.M. Cowan, J.W. Fawcett, D.D.M. O’Leary, B.B. Stanfield, Science 225 (1984)
1258–1265.[25] G.M. Innocenti, D.J. Price, Nat. Rev. Neurosci. 6 (2005) 955–965.[26] A.S. LaMantia, P. Rakic, J. Neurosci. 10 (1990) 2156–2175.[27] A.S. LaMantia, P. Rakic, J. Comp. Neurol. 340 (1994) 328–336.[28] T.U. Woo, M.L. Pucak, C.H. Kye, C.V. Matus, D.A. Lewis, Neuroscience 80 (1997)
1149–1158.[29] E.O. Stejskal, J.E. Tanner, J. Chem. Phys. 42 (1965) 288.[30] P.J. Basser, C. Pierpaoli, J. Magn. Res. 111 (1996) 209–219.[31] P.J. Basser, D.K. Jones, NMR Biomed. 15 (2002) 456–467.[32] C. Beaulieu, NMR Biomed. 15 (2002) 435–455.[33] S. Mori, J. Zhang, Neuron 51 (2006) 527–539.[34] S. Mori, B.J. Crain, V.P. Chacko, P. van Zijl, Ann. Neurol. 45 (1999) 265–269.[35] T.E. Conturo, N.F. Lori, T.S. Cull, E. Akbudak, A.Z. Snyder, J.S. Shimony, R.C.
McKinstry, H. Burton, M.E. Raichle, Proc. Natl. Acad. Sci. U.S.A. 96 (1999)10422–10427.
[36] D.K. Jones, A. Simmons, S.C. Williams, M.A. Horsfield, Magn. Reson. Med. 42(1999) 37–41.
[37] P.J. Basser, S. Pajevic, C. Pierpaoli, J. Duda, A. Aldroubi, Magn. Reson. Med. 44(2000) 625–632.
[38] C. Poupon, C.A. Clark, V. Frouin, J. Regis, L. Bloch, D. Le Bihan, J.F. Mangin,Neuroimage 12 (2000) 184–195.
[39] G.J.M. Parker, C.A.M. Wheeler-Kingshott, G.J. Barker, IEEE Trans. Med. Imaging21 (2002) 505–512.
[40] M. Lazar, D.M. Weinstein, J.S. Tsuruda, K.M. Hasan, K. Arfanakis, M.E.Meyerand, B. Badie, H.A. Rowley, V. Haughton, A. Field, A.L. Alexander, Hum.Brain Mapp. 18 (2003) 306–321.
[41] B. Stieltjes, W.E. Kaufmann, P.C.M. van Zijl, K. Fredericksen, G.G. Pearlson, S.Mori, Neuroimage 14 (2001) 723–735.
[42] M. Catani, R.J. Howard, S. Pajevic, D.K. Jones, Neuroimage 17 (2002) 77–94.[43] H. Jiang, P.C.J.K. van Zijl, G.D. Pearlson, S. Mori, Comput. Methods Programs
Biomed. 81 (2006) 106–116.[44] R.P. Woods, S.T. Grafton, C.J. Holmes, S.R. Cherry, J.C. Mazziotta, J. Comput.
Assist. Tomogr. 22 (1998) 139–152.[45] S. Wakana, H. Jiang, L.M. Nagae-Poetscher, P.C. van Zijl, S. Mori, Radiology 230
(2004) 77–87.
Please cite this article in press as: A. Ouyang et al., Methods (2014), http://dx.
[46] S. Wakana, A. Caprihan, M.M. Panzenboeck, J.H. Fallon, M. Perry, R.L. Gollub, K.Hua, J. Zhang, H. Jiang, P. Dubey, A. Blitz, P. van Zijl, S. Mori, Neuroimage 36(2007) 630–644.
[47] B. Fischl, A.M. Dale, Proc. Natl. Acad. Sci. U.S.A. 97 (2000) 11044–11049.[48] H. Huang, T. Jeon, G. Sedmak, M. Pletikos, L. Vasung, X. Xu, P. Yarowsky, L.
Richards, I. Kostovic, N. Sestan, S. Mori, Cereb. Cortex 23 (2013) 2620–2631.[49] N. Barnea-Goraly, V. Menon, M. Eckert, L. Tamm, R. Bammer, A. Karchemskiy,
C.C. Dant, A.L. Reiss, Cereb. Cortex 15 (2005) 1848–1854.[50] J. Dubois, G. Dehaene-Lambertz, M. Perrin, J.F. Mangin, Y. Cointepas, E.
Duchesnay, D. LeBihan, L. Hertz-Pannier, Hum. Brain Mapp. 29 (2008) 14–27.[51] T.J. Eluvathingal, K.M. Hasan, L. Kramer, J.M. Fletcher, L. Ewing-Cobbs, Cereb.
Cortex 17 (2007) 2760–2768.[52] C. Level, L. Walker, A. Leemans, L. Phillips, C. Beaulieu, Neuroimage 40 (2008)
1044–1055.[53] J.S. Thornton, R.J. Ordidge, J. Penrice, E.B. Cady, P.N. Amess, S. Punwani, M.
Clemence, J.S. Wyatt, Magn. Res. Imaging 15 (1997) 433–440.[54] J. Neil, S. Shiran, R. McKinstry, G. Schefft, A. Snyder, C. Almli, E. Akbudak, J.
Arnovitz, J. Miller, B. Lee, T. Conturo, Radiology 209 (1998) 57–66.[55] S. Mori, R. Itoh, J. Zhang, W.E. Kaufmann, P.C.M. van Zijl, M. Solaiyappan, P.
Yarowsky, Magn. Reson. Med. 46 (2001) 18–23.[56] R.C. McKinstry, A. Mathur, J.H. Miller, A. Ozcan, A.Z. Snyder, G.L. Schefft, C.R.
Almli, S.I. Shiran, T.E. Conturo, J.J. Neil, Cereb. Cortex 12 (2002) 1237–1243.[57] L.C. Maas, P. Mukherjee, J. Carballido-Gamio, S. Veeraraghavan, S.P. Miller, S.C.
Partridge, R.G. Henry, A.J. Barkovich, D.B. Vigneron, Neuroimage 22 (2004)1134–1140.
[58] A.R. Deipolyi, P. Mukherjee, K. Gill, R.G. Henry, S.C. Partridge, S. Veeraraghavan,H. Jin, Y. Lu, S.P. Miller, D.M. Ferriero, D.B. Vigneron, A.J. Barkovich,Neuroimage 27 (2005) 579–586.
[59] C.D. Kroenke, D.C. Van Essen, T.E. Inder, S. Rees, G.L. Bretthorst, J.J. Neil, J.Neurosci. 27 (2007) 12506–12515.
[60] S.V. Sizonenko, E.J. Camm, J.R. Garbow, S.E. Maier, T.E. Inder, C.E. Williams, J.J.Neil, P.S. Huppi, Cereb. Cortex 17 (2007) 2609–2617.
[61] C.D. Kroenke, E.N. Taber, L.A. Leigland, A.K. Knutsen, P.V. Bayly, Cereb. Cortex19 (2009) 2916–2929.
[62] H. Huang, A. Yamamoto, M.A. Hossain, L. Younes, S. Mori, J. Neurosci. 28 (2008)1427–1433.
[63] E. Takahashi, G. Dai, G.D. Rosen, R. Wang, K. Ohki, R.D. Folkerth, A.M.Galaburda, V.J. Wedeen, P. Ellen, Cereb. Cortex 21 (2011) 200–211.
[64] A.A. Lavdas, M. Grigoriou, V. Pachnis, J.G. Parnavelas, J. Neurosci. 19 (1999)7881–7888.
[65] H. Wichterle, J.M. Garcia-Verdugo, D.G. Herrera, A. Alvarez-Buylla, Nat.Neurosci. 2 (1999) 461–466.
[66] H. Huang, J. Zhang, P.C. van Zijl, S. Mori, Magn. Reson. Med. 52 (2004) 559–565.[67] S. Kim, J.J. Neil, S. Song, Magn. Reson. Med. 50 (2003) 743–748.[68] J.H. Kim, K. Trinkaus, A. Ozcan, M.D. Budde, S. Song, NMR Biomed. 20 (2006)
352–359.[69] M. Aggarwal, J. Zhang, O. Pletnikova, B. Crain, J. Trocoso, S. Mori, Neuroimage
74 (2013) 117–127.
doi.org/10.1016/j.ymeth.2014.10.025