spatial relationships of heavy rains in the czech republic
TRANSCRIPT
Adv. Geosci., 25, 85–90, 2010www.adv-geosci.net/25/85/2010/© Author(s) 2010. This work is distributed underthe Creative Commons Attribution 3.0 License.
Advances inGeosciences
Spatial relationships of heavy rains in the Czech Republic
S. Bek1, J. Jezek1, and V. Bliznak2,3
1Institute of Applied Mathematics and Information Technologies, Charles University in Prague, Faculty of Science,Czech Republic2Institute of Atmospheric Physics, ASCR, Czech Republic3Department of Physical geography and geoecology, Charles University in Prague, Faculty of Science, Czech Republic
Received: 30 December 2009 – Revised: 5 March 2010 – Accepted: 5 March 2010 – Published: 26 March 2010
Abstract. Study of heavy rain events and their spatial dis-tribution are of great importance. Such events cause lo-cal flooding, accelerate soil erosion and cause damage onproperty. Data for this study were derived by Sokol andBli znak (2009) from radar reflectivity and daily rain gaugemeasurements for the period of 2002–2008. We selectedheavy rain events using spatial and intensity constrains. Westudied relationships between heavy rains, altitude and ter-rain roughness. Heavy rain totals correlate with both altitudeand terrain roughness globally over the Czech Republic. Thecorrelation is also significant for extreme heavy rain totals.The correlation of heavy rain intensities with altitude was notproven. The highest rates of average intensities are locatedin the south-eastern parts of the Czech Republic. The spatialdistribution of heavy rain frequencies strongly correspondsto the spatial distribution of heavy rain totals. The highestpercentage of heavy rains in total precipitation is located inthe north-west of the Czech Republic. The extreme heavyrains occupy higher altitudes.
1 Introduction
Heavy rains during the warm period of the year (April toSeptember) are usually caused by strong convection of airmass. Such rain events cause local flash floods, acceleratesoil erosion and cause damage on property. In addition, theyare hard to be predicted and the knowledge about their spa-tial distribution (over the Czech Republic) is insufficient. Itis well-known that the spatial properties of precipitation cor-respond to orography. The relations were studied from var-ious aspects. For example, Basist et al. (1994) studied rela-tionships between annual precipitation and six topographic
Correspondence to:S. Bek([email protected])
variables, Sevruk and Mieglitz (2002) studied the relation-ship between daily precipitation and altitude, Allamano etal. (2009) annual maximum sub-daily precipitation, durationand altitude, Haiden and Pistornik (2009) the ones between12-h precipitation and altitude. Daikaru et al. (2004) studiedrainfall amount, intensity, duration and frequency relation-ships with altitude.
Sokol and Bliznak (2009) studied correlation relationshipsbetween precipitation totals of short-term heavy rainfalls andaltitude. They focussed on heavy rain data (related to convec-tive storms) and studied the impact of altitude on the precip-itation totals. They concluded that the global correlation ofthe totals decreases with the increasing threshold. For heavyrains, they did not find dependence of the precipitation totalson altitude.
Our paper extends the effort of Sokol and Bliznak (2009)and presents new results regarding the correlation of heavyrains with orography under differently defined heavy rainevents.
2 Basic data
We use the same basic data as Sokol and Bliznak (2009) – theprecipitation data derived from radar reflectivity and dailyrain gauge measurements by merging procedure publishedby Sokol (2003). It consists of 1 h – precipitation totals forthe warm period of the year (April to September) of the years2002–2008 in the horizontal resolution of 1 km×1 km cover-ing the Czech Republic (approx. 78 000 pixels). Only precip-itation intensities higher than 1 mm/h were considered. Thedata were complemented by altitude information. Hourlyprecipitation totals were calculated by time integration basedon radar reflectivity measurements performed every 10 min(starting hh:00 UTC and ending hh:50 UTC). Each data ele-ment is described by: x and y-coordinate, date, hour, precip-itation amount and altitude.
Published by Copernicus Publications on behalf of the European Geosciences Union.
86 S. Bek et al.: Spatial Relationships of Heavy Rains
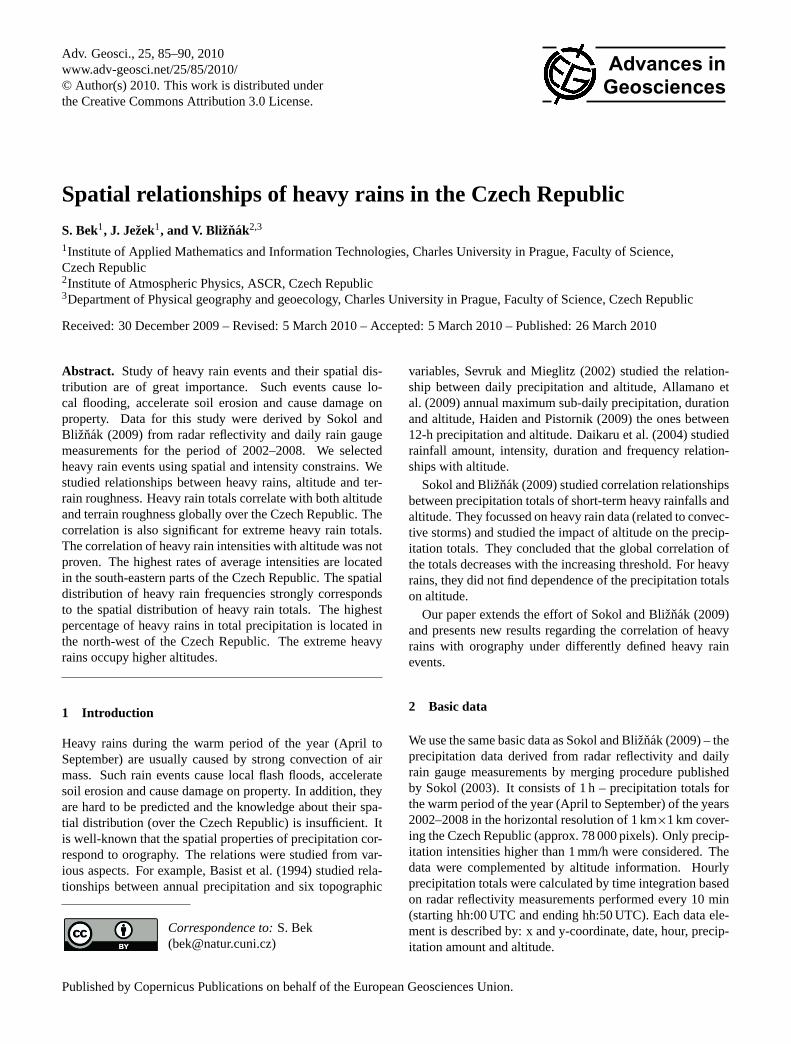
Fig. 1. Average annual precipitation amount for warm period of theyears 2002–2008 (up) and altitude of the Czech Republic (down).
From the altitude dataset we created a simple characteristicof terrain roughness. We used a 3×3 pixel moving window(9 sq. km) and computed standard deviation of the 9 pixel val-ues. The standard deviation represented the terrain roughnessin the central pixel.
3 Heavy rains selection
In order to select relevant data regarding the heavy rains thebasic data have to be processed. Sokol and Bliznak (2009)integrated the data in time, created precipitation events con-sisting of one pixel location and consecutive precipitation in-formation (e.g., event of 1 sq. km and of 3 h duration) andselected heavy rain events by a threshold intensity.
We processed the data another way. For every hour, wecreated a raster representing the actual precipitation situationover the Czech Republic. Then we identified clusters com-posed of non-null pixels. These clusters represent rain events(each of an 1-h duration) from which we selected the heavyrain events as the ones fulfilling the following conditions:i) average precipitation of the cluster is higher than a cho-sen thresholdTprec (typically Tprec= 5 or more mm, ii) max-imum precipitation within the cluster is higher than 15 mm.By these conditions we aimed to guarantee that the event isstrong and has a core as it is common for convective precip-itation (e.g. Steiner et al., 1995; Biggerstaff and Listemaa,2000). The second condition also helps to filter badly clus-
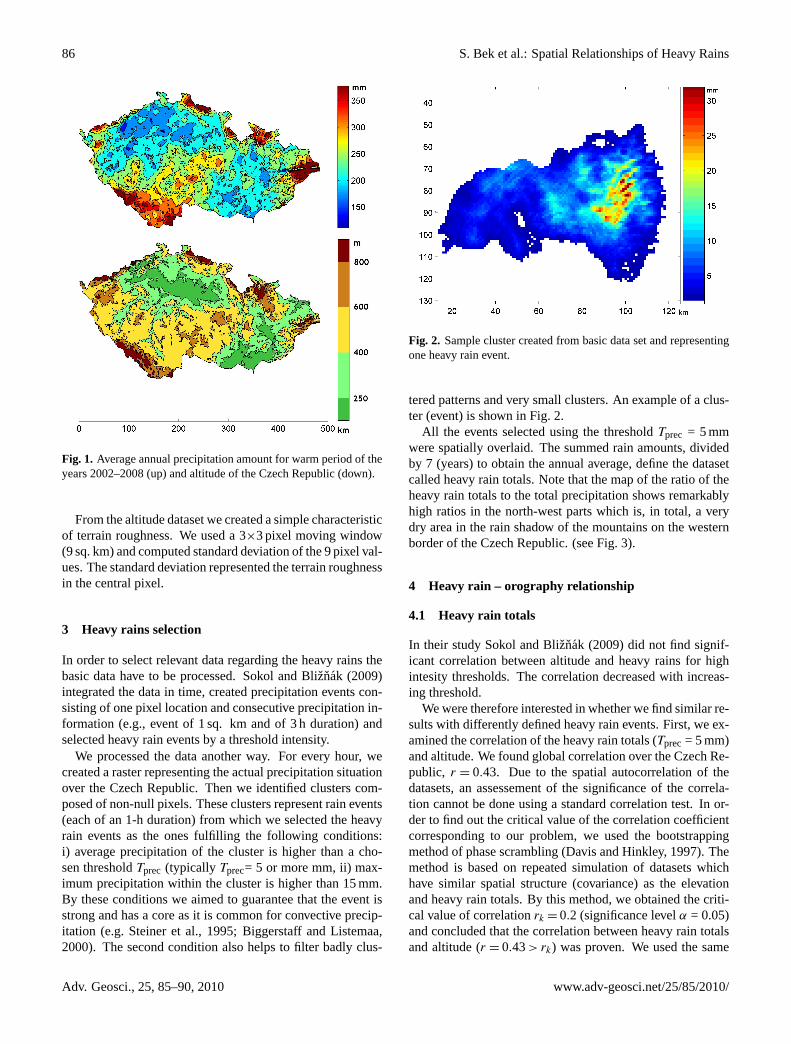
Fig. 2. Sample cluster created from basic data set and representingone heavy rain event.
tered patterns and very small clusters. An example of a clus-ter (event) is shown in Fig. 2.
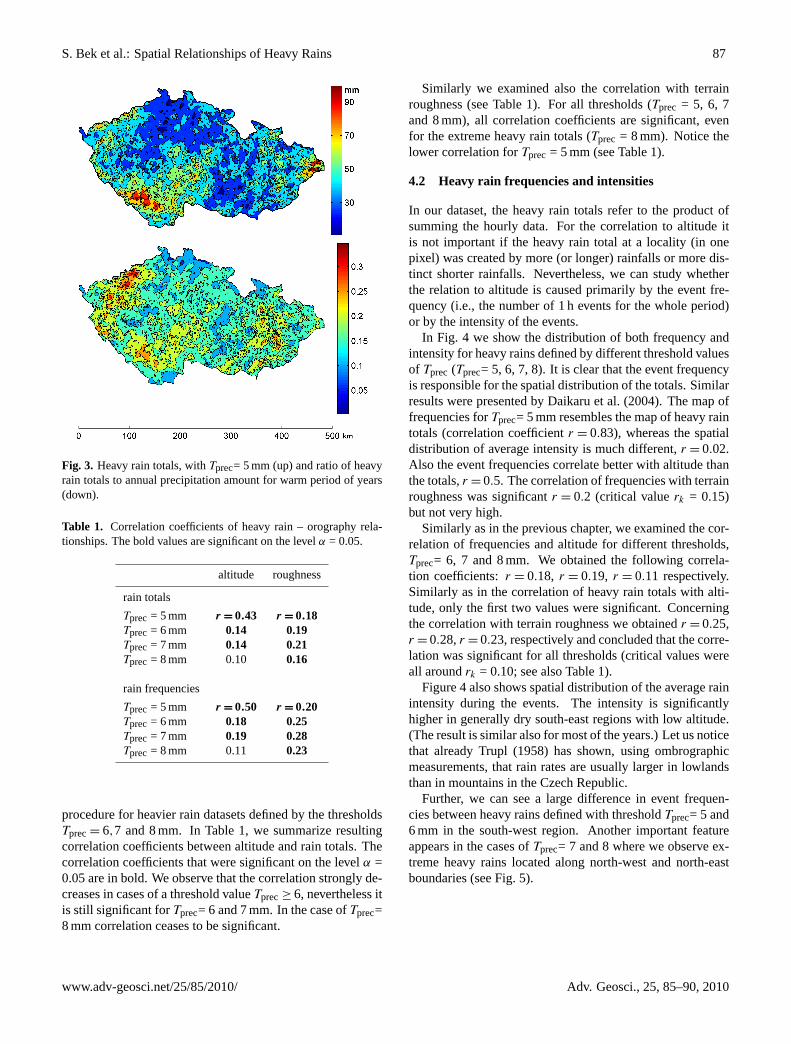
All the events selected using the thresholdTprec = 5 mmwere spatially overlaid. The summed rain amounts, dividedby 7 (years) to obtain the annual average, define the datasetcalled heavy rain totals. Note that the map of the ratio of theheavy rain totals to the total precipitation shows remarkablyhigh ratios in the north-west parts which is, in total, a verydry area in the rain shadow of the mountains on the westernborder of the Czech Republic. (see Fig. 3).
4 Heavy rain – orography relationship
4.1 Heavy rain totals
In their study Sokol and Bliznak (2009) did not find signif-icant correlation between altitude and heavy rains for highintesity thresholds. The correlation decreased with increas-ing threshold.
We were therefore interested in whether we find similar re-sults with differently defined heavy rain events. First, we ex-amined the correlation of the heavy rain totals (Tprec= 5 mm)and altitude. We found global correlation over the Czech Re-public, r = 0.43. Due to the spatial autocorrelation of thedatasets, an assessement of the significance of the correla-tion cannot be done using a standard correlation test. In or-der to find out the critical value of the correlation coefficientcorresponding to our problem, we used the bootstrappingmethod of phase scrambling (Davis and Hinkley, 1997). Themethod is based on repeated simulation of datasets whichhave similar spatial structure (covariance) as the elevationand heavy rain totals. By this method, we obtained the criti-cal value of correlationrk = 0.2 (significance levelα = 0.05)and concluded that the correlation between heavy rain totalsand altitude (r = 0.43> rk) was proven. We used the same
Adv. Geosci., 25, 85–90, 2010 www.adv-geosci.net/25/85/2010/
S. Bek et al.: Spatial Relationships of Heavy Rains 87
Fig. 3. Heavy rain totals, withTprec= 5 mm (up) and ratio of heavyrain totals to annual precipitation amount for warm period of years(down).
Table 1. Correlation coefficients of heavy rain – orography rela-tionships. The bold values are significant on the levelα = 0.05.
altitude roughness
rain totals
Tprec= 5 mm r = 0.43 r = 0.18Tprec= 6 mm 0.14 0.19Tprec= 7 mm 0.14 0.21Tprec= 8 mm 0.10 0.16
rain frequencies
Tprec= 5 mm r = 0.50 r = 0.20Tprec= 6 mm 0.18 0.25Tprec= 7 mm 0.19 0.28Tprec= 8 mm 0.11 0.23
procedure for heavier rain datasets defined by the thresholdsTprec= 6,7 and 8 mm. In Table 1, we summarize resultingcorrelation coefficients between altitude and rain totals. Thecorrelation coefficients that were significant on the levelα =0.05 are in bold. We observe that the correlation strongly de-creases in cases of a threshold valueTprec≥ 6, nevertheless itis still significant forTprec= 6 and 7 mm. In the case ofTprec=8 mm correlation ceases to be significant.
Similarly we examined also the correlation with terrainroughness (see Table 1). For all thresholds (Tprec = 5, 6, 7and 8 mm), all correlation coefficients are significant, evenfor the extreme heavy rain totals (Tprec = 8 mm). Notice thelower correlation forTprec = 5 mm (see Table 1).
4.2 Heavy rain frequencies and intensities
In our dataset, the heavy rain totals refer to the product ofsumming the hourly data. For the correlation to altitude itis not important if the heavy rain total at a locality (in onepixel) was created by more (or longer) rainfalls or more dis-tinct shorter rainfalls. Nevertheless, we can study whetherthe relation to altitude is caused primarily by the event fre-quency (i.e., the number of 1 h events for the whole period)or by the intensity of the events.
In Fig. 4 we show the distribution of both frequency andintensity for heavy rains defined by different threshold valuesof Tprec (Tprec= 5, 6, 7, 8). It is clear that the event frequencyis responsible for the spatial distribution of the totals. Similarresults were presented by Daikaru et al. (2004). The map offrequencies forTprec= 5 mm resembles the map of heavy raintotals (correlation coefficientr = 0.83), whereas the spatialdistribution of average intensity is much different,r = 0.02.Also the event frequencies correlate better with altitude thanthe totals,r = 0.5. The correlation of frequencies with terrainroughness was significantr = 0.2 (critical valuerk = 0.15)but not very high.
Similarly as in the previous chapter, we examined the cor-relation of frequencies and altitude for different thresholds,Tprec= 6, 7 and 8 mm. We obtained the following correla-tion coefficients:r = 0.18, r = 0.19, r = 0.11 respectively.Similarly as in the correlation of heavy rain totals with alti-tude, only the first two values were significant. Concerningthe correlation with terrain roughness we obtainedr = 0.25,r = 0.28,r = 0.23, respectively and concluded that the corre-lation was significant for all thresholds (critical values wereall aroundrk = 0.10; see also Table 1).
Figure 4 also shows spatial distribution of the average rainintensity during the events. The intensity is significantlyhigher in generally dry south-east regions with low altitude.(The result is similar also for most of the years.) Let us noticethat already Trupl (1958) has shown, using ombrographicmeasurements, that rain rates are usually larger in lowlandsthan in mountains in the Czech Republic.
Further, we can see a large difference in event frequen-cies between heavy rains defined with thresholdTprec= 5 and6 mm in the south-west region. Another important featureappears in the cases ofTprec= 7 and 8 where we observe ex-treme heavy rains located along north-west and north-eastboundaries (see Fig. 5).
www.adv-geosci.net/25/85/2010/ Adv. Geosci., 25, 85–90, 2010

88 S. Bek et al.: Spatial Relationships of Heavy Rains
Fig. 4. Heavy rain totals split to frequencies (i.e., the number of 1 h events) (up) and intensities (down), for thresholdsTprec= 5 (left) and6 mm (right).
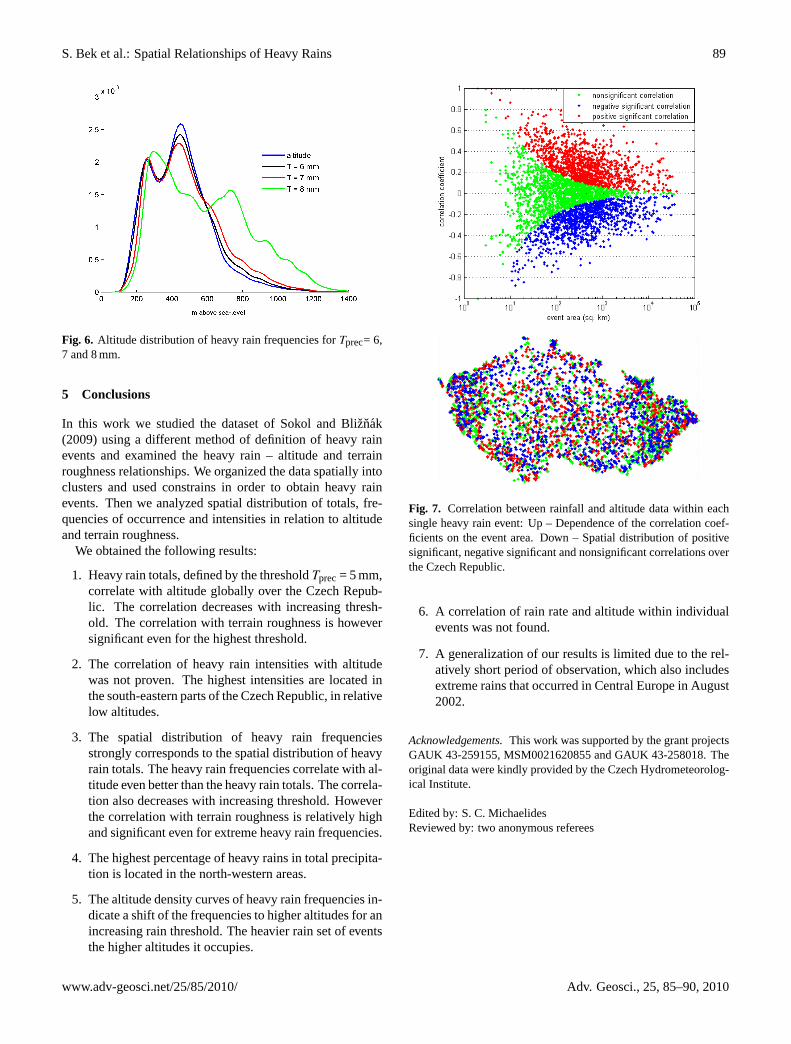
In Fig. 6 we show the altitude distribution of heavy rainfrequencies for the casesTprec= 6, 7 and 8 mm. The densitycurves forTprec= 6 and 7 are relatively close to the density ofaltitude. Nevertheless we observe that for higher thresholdthe density of high rains differs more from altitude. The shiftof the distribution to higher altitudes is apparent.
4.3 Correlation within heavy rain events
Inspired by works studying the precipitation – altitude rela-tionships in mountainous regions (e.g. Haiden and Pistotnik,2009), we tried to correlate precipitation and altitude withineach single event in mountains. The correlation coefficientsfor all 3568 events are shown in Fig. 7 (up). Despite thefact that the datasets are spatially autocorrelated, we used thestandard significance test on the levelα = 0.05. We found thatthe correlation is significant and positive for 30% of eventsand significant and negative for another 30% of events. De-spite such a large proportion of significant correlations, thespatial distribution of these events does not show any regionswith prevailing positive or negative correlation (see Fig. 7– down). We assume that the large proportion is caused bythe spatial autocorrelation. These results do not reveal rela-tionships regarding the rain rates and altitude within singleevents.
Fig. 5. Heavy rain frequencies for thresholdsTprec= 7 (up) and8 mm (down).
Adv. Geosci., 25, 85–90, 2010 www.adv-geosci.net/25/85/2010/
S. Bek et al.: Spatial Relationships of Heavy Rains 89
Fig. 6. Altitude distribution of heavy rain frequencies forTprec= 6,7 and 8 mm.
5 Conclusions
In this work we studied the dataset of Sokol and Bliznak(2009) using a different method of definition of heavy rainevents and examined the heavy rain – altitude and terrainroughness relationships. We organized the data spatially intoclusters and used constrains in order to obtain heavy rainevents. Then we analyzed spatial distribution of totals, fre-quencies of occurrence and intensities in relation to altitudeand terrain roughness.
We obtained the following results:
1. Heavy rain totals, defined by the thresholdTprec= 5 mm,correlate with altitude globally over the Czech Repub-lic. The correlation decreases with increasing thresh-old. The correlation with terrain roughness is howeversignificant even for the highest threshold.
2. The correlation of heavy rain intensities with altitudewas not proven. The highest intensities are located inthe south-eastern parts of the Czech Republic, in relativelow altitudes.
3. The spatial distribution of heavy rain frequenciesstrongly corresponds to the spatial distribution of heavyrain totals. The heavy rain frequencies correlate with al-titude even better than the heavy rain totals. The correla-tion also decreases with increasing threshold. Howeverthe correlation with terrain roughness is relatively highand significant even for extreme heavy rain frequencies.
4. The highest percentage of heavy rains in total precipita-tion is located in the north-western areas.
5. The altitude density curves of heavy rain frequencies in-dicate a shift of the frequencies to higher altitudes for anincreasing rain threshold. The heavier rain set of eventsthe higher altitudes it occupies.
Fig. 7. Correlation between rainfall and altitude data within eachsingle heavy rain event: Up – Dependence of the correlation coef-ficients on the event area. Down – Spatial distribution of positivesignificant, negative significant and nonsignificant correlations overthe Czech Republic.
6. A correlation of rain rate and altitude within individualevents was not found.
7. A generalization of our results is limited due to the rel-atively short period of observation, which also includesextreme rains that occurred in Central Europe in August2002.
Acknowledgements.This work was supported by the grant projectsGAUK 43-259155, MSM0021620855 and GAUK 43-258018. Theoriginal data were kindly provided by the Czech Hydrometeorolog-ical Institute.
Edited by: S. C. MichaelidesReviewed by: two anonymous referees
www.adv-geosci.net/25/85/2010/ Adv. Geosci., 25, 85–90, 2010
90 S. Bek et al.: Spatial Relationships of Heavy Rains
References
Allamano, P., Claps, P., Laio, F., and Thea, C.: A data-based assess-ment of the dependence of short-duration precipitation on eleva-tion, Phys. Chem. Earth, 34, 635–641, 2009.
Basist, A., Bell, G. D., and Meentemeyer, V.: Statistical relation-ships between topography and precipitation patterns, J. Climate,7, 1305–1315, 1994.
Biggerstaff, M. I. and Listemaa, S. A.: An Improved Scheme forConvective/Stratiform Echo Classification Using Radar Reflec-tivity. J. Appl. Meteorol., 39, 2129–2150, 2000.
Daikaru, K., Emori, S., and Oki, T.: Rainfall Amount, Intensity,Duration, and Frequency Relationships in the Mae Chaem Wa-tershed in Southeast Asia, J. Hydrometeorol., 5, 458–470, 2004.
Davis, A. C. and Hinkley, D. V.: Bootstrap Methods and Their Ap-plication, Cammbridge University Press, 1997.
Haiden, T. and Pistotnik, G.: Intensity-dependent parameterizationof elevation effects in precipitation analysis, Adv. Geosci., 20,33–38, 2009,http://www.adv-geosci.net/20/33/2009/.
Sevruk, B. and Mieglitz, K.: The effect of topography, season andweather situation on daily precipitation gradients in 60 Swiss val-leys, Water Sci. Technol., 45, 41–48, 2002.
Sokol, Z.: The use of radar and gauge measurements to estimateareal precipitation for several Czech river basins, Stud. Geophys.Geod. 47, 587–604, 2003.
Sokol, Z. and Bliznak, V.: Areal distribution and precipitation–altitude relationship of heavy short-term precipitation in theCzech Republic in the warm part of the year, Atmos. Res.,doi:10.1016/j.atmosres.2009.03.001, in press., 2010.
Steiner, M., Houze, R. A., and Yuter, S. E.: Climatological Char-acterization of Three-Dimensional Storm Structure from Opera-tional Radar and Rain Gauge Data. J. Appl. Meteorol., 34, 1978–2007, 1995.
Trupl, J.: Intesity kratkodobych des v povodıch Labe, Odry aMoravy. (Rain rates of short-term rainfalls in catchments Labe,Odra and Morava). Prace a studie, 97, VUV, Prague, in Czech,1958.
Adv. Geosci., 25, 85–90, 2010 www.adv-geosci.net/25/85/2010/