spatial -temporal p urban growth - simple...
TRANSCRIPT
TRITA SoM 2009-10
ISSN 1653-6126
ISRN KTH/SoM/09-10/-SE
ISBN 978-91-7415-532-7
SPATIAL-TEMPORAL PATTERNS OF URBAN GROWTH
IN SHANGHAI, CHINA:
MONITORING, ANALYSIS, AND SIMULATION
Qian Zhang
December 2009

Qian Zhang TRITA SoM 2009-10
ii
© Qian Zhang 2009
Licentiate Thesis
Geoinformatics Division
Department of Urban Planning and Environment
Royal Institute of Technology (KTH)
SE-100 44 STOCKHOLM, Sweden
Spatial-Temporal Patterns of Urban Growth in Shanghai, China: Monitoring, Analysis, and Simulation
iii
ABSTRACT
Supporting huge population, megacities are definitely the hot spots of production, consumption, and waste generation. Without careful investment and planning, megacities will be overwhelmed by burgeoning negative impacts on the environment, natural resources, and human health, as well as a host of social and economic issues. The unprecedented combination of economic and population growth since the Reform and Open Policy has led China into transition from a largely rural society to a predominantly urban one. Chinese cities, without question, have not escaped the danger of the series of problems during the rapid progress of urbanization. Therefore, monitoring the spatial-temporal patterns of urban sprawl and their impact on the environment is of critical importance for urban planning and sustainable development, especially in developing Chinese cities such as Shanghai.
To date, few studies have focused on the urban trajectories of Shanghai over the past 30 years from a remote sensing perspective. Most of the studies were concentrated on the technical issues of image processing and classification. Moreover, research on spatial metrics has focused on analyzing remote sensing classification results rather than on the use of interpreting, assessing, and verifying urban simulation results. Furthermore, many researches merely focused on baseline projection and very few studies took into consideration urban growth scenarios so far. As yet there have been no reported scenario simulations of future Shanghai growth with several land-use categories within urban areas. The overall objective of this research is to investigate the integration of remote sensing, spatial metrics, and spatial-temporal models in the monitoring, analysis, and simulation of urban growth in Shanghai, China. The specific objectives are to: 1). monitor urban dynamics over time with multi-sensor remote sensing images; 2). quantify spatial-temporal properties of urban growth and representing the urban morphological structures by means of spatial metrics; and 3). simulate the geographic extent, patterns, and detailed catalogs of urban growth under different scenarios using Markov-Cellular Automata (Markov-CA) model to support decision making for a more sustainable Shanghai. Through this study, the combined approach using remotely sensed data with change detection techniques, spatial metrics, and a scenarios-based simulation model proved to be effective to understand, represent, and predict the spatial-temporal dynamics of urban growth. In detail, the segmented-based hierarchy classification and visual interpretation were effective methods to extract urban and industrial land with high-resolution remotely sensed images. Direct change detection using variables derived from tasseled cap transformation was efficient for monitoring impervious surface sprawl. Spatial metrics is a quick and executable way to assessing the impact of urban sprawl on landscape dynamic. Markov-CA model is a useful tool to simulate the scenarios of future urban developments and therefore provides the policy options for sustainable urban planning. The research results of urban trajectories and impervious surface sprawl showed that Shanghai experienced high-speed urban sprawl and the rate of urban expansion, however, was not homogeneous spatially and temporally. The general annual urban expansion speed was 34.8 km2 per year; nevertheless, it reached 80.2 km2 per year recent six years from 2001 to 2007, while it touched the bottom speed around 14.3 km2 per year during 1979-1989. The expanded area in the Puxi region was 5.23 times of its original area while that of Pudong region was 19.94 times of its original area during 1979-2007. The research results of landscape analysis demonstrated that greenbelt becomes fractured while infrastructural and commercial area is more and more aggregated in the central Shanghai area, and satellite images such as SPOT Pan, XS and Landsat TM with 10-30 meter resolution are sufficient for the landscape dynamic research in central Shanghai area. The results of scenarios-based simulation indicated that built-up areas in Shanghai will increase significantly in 2025 and Shanghai will experience less urban sprawl and retain a better environment in 2025 under

Qian Zhang TRITA SoM 2009-10
iv
service-oriented center (SOC) than under baseline (NS) or manufacturing-dominant center (MDC) scenario. If favorable policy for MDC scenario is adopted, however, there will be a lot of manufacturing industries gathering in Shanghai and more agricultural lands will be encroached.
The present research focused on the analysis of physical and morphological aspects of urban growth. Urban land-use dynamics are, however, intrinsically linked with socio-economic, political, or demographic drivers. Trying to fill in the missing link between traditional urban geography and urban remote sensing & urban simulation and to improve understanding of the interactions between human and natural aspects in the urban socio-ecosystem is the major focus in the next phase of the Ph.D. research.
Keywords: Urban growth, Spatial-temporal pattern, Remote sensing, Spatial metrics, Scenarios-based simulation, Shanghai
Spatial-Temporal Patterns of Urban Growth in Shanghai, China: Monitoring, Analysis, and Simulation
v
ACKNOWLEDGMENTS
This work has been carried out as part of a FORMAS research project “Spatial-temporal patterns of urban sprawl: Monitoring, analysis and modeling” (Grant Holder: Prof. Yifang Ban) and a VR research collaboration programme between the Royal Institute of Technology-KTH, Sweden and the Institute of Geographic Sciences and Natural Resources Research (IGSNRR), Chinese Academy of Sciences (CAS), within the framework of project “Spatial-temporal patterns of urban sprawl in China: Monitoring, analysis and modeling” (Grant holders : Prof. Yifang Ban and Prof. Jiyuan Liu).
I really appreciate my supervisors, Prof. Yifang Ban of KTH and Prof. Jiyuan Liu of IGSNRR, CAS, for their constant support, instruction, guidance, facilitation and encouragement in research and daily life throughout the duration of this study.
Thanks all the staff and PhD students at Geoinformatics Division, KTH. The united international young team gives me inspiration and the feeling of family. I am also grateful to the research group of IGSNRR, CAS for exchanging ideas, providing data and motivation. They are Prof. Quanqin Shao, Prof. Lin Zhen, Prof. Tianxiang Yue, Dr. Yunfeng Hu, and Dr. Wenhui Kuang etc.
I would also like to thank China Scholarship Council (CSC) and School of Architecture and Built Environment (ABE) at KTH for providing the scholarship (2007-2010) and improving the stipend (2008-2010).
Finally, I am deeply grateful to my mother, for her endless love and support all along.
Qian Zhang
Stockholm, December 2009
Qian Zhang TRITA SoM 2009-10
vi
TABLE OF CONTENTS
Abstract.................................................................................................................................................................. iii
Acknowledgments .................................................................................................................................................. v
List of Figures....................................................................................................................................................... vii
List of Tables ....................................................................................................................................................... viii
List of Papers ......................................................................................................................................................... ix
1. Introduction .........................................................................................................................................................1
1.1 Research Objectives .........................................................................................................................................................................2
1.2 Organization of the Thesis .............................................................................................................................................................2
2. Literature Review................................................................................................................................................ 5
2.1 Remote Sensing for Detection of Urban Impervious Surface Sprawl....................................................................................5
2.2 Spatial Metrics for Analysis of Urban Landscapes Dynamics..................................................................................................6
2.3 Spatial-Temporal Modeling for Simulation of Urban Scenarios..............................................................................................8
3. Study Area and Data Description.......................................................................................................................12
3.1 Study Area....................................................................................................................................................................................... 12
3.2 Data .................................................................................................................................................................................................. 14
3.2.1 Remote sensing images ............................................................................................................................................................... 14
3.2.2 Other datasets ........................................................................................................................................................................... 14
4. Methodology ......................................................................................................................................................15
4.1 Monitoring ...................................................................................................................................................................................... 15
4.2 Analysis ............................................................................................................................................................................................ 16
4.3 Simulation ....................................................................................................................................................................................... 18
5. Results & Discussion.........................................................................................................................................19
5.1 Monitoring of Landscape Dynamics.......................................................................................................................................... 19
5.1.1 Urban trajectories in Shanghai over past 30 years ..................................................................................................................... 19
5.1.2 Industrial/Warehouse land distribution and dynamics during 1966-2007 ............................................................................... 20
5.1.3 Impervious Surface Sprawl in Shanghai over past 30 years........................................................................................................ 21
5.2 Landscape Metrics Analysis in CSA........................................................................................................................................... 22
5.2.1 Landscape metrics dynamic analysis at landscape level ............................................................................................................... 22
5.2.2 Determination of optimal scale................................................................................................................................................... 23
5.2.3 Landscape metrics analysis at patch level ................................................................................................................................... 23
5.3 Scenarios-based simulation .......................................................................................................................................................... 25
6. Conclusions....................................................................................................................................................... 30
7. Future Research................................................................................................................................................ 32
8. References......................................................................................................................................................... 33
Spatial-Temporal Patterns of Urban Growth in Shanghai, China: Monitoring, Analysis, and Simulation
vii
LIST OF FIGURES
Figure 2. 1 Some urban and near-urban features in the ternary V-I-S model (Ridd, 1995)..............................................6
Figure 3. 1 Location of the study area in China (3.1a) and the Yangtze River Delta (3.1b)........................................... 12
Figure 3. 2 Population in Shanghai during 1979–2007 (According to Shanghai Statistical Yearbook 2008).................. 13
Figure 3. 3 Remotely sensed images of study area. ...................................................................................................... 13
Figure 4. 1 Framework of integration of monitoring, analysis, and simulation in urban areas.................................... 15
Figure 4. 2 Workflow of landscape metrics analysis .................................................................................................... 16
Figure 4. 3 General workflow of urban simulation with scenarios in GSA................................................................... 18
Figure 5. 1 Urban land distribution and its expansion during 1979-2007 ..................................................................... 19
Figure 5. 2 Urban area and its components ................................................................................................................. 20
Figure 5. 3 Temporal dynamics of urban land in Shanghai ......................................................................................... 20
Figure 5. 4 The Distribution Pattern of Industrial & Warehouse Land in 1966 (L) and 2007(R) ................................. 20
Figure 5. 5 Detected impervious surface sprawl in Shanghai between 1979 & 2009 .................................................... 21
Figure 5. 6 Landscape metrics scalograms in 1991, 1998, 2007 at landscape level........................................................ 22
Figure 5. 7 Area percentage of different landuse types with grain size increasing ...................................................... 23
Figure 5. 8 Landscape metrics scalograms in 1991, 1998, 2007 at patch level............................................................... 25
Figure 5. 9 Urban simulation map series in 2015 and 2025 under different schemes................................................... 26
Figure 5. 10 Percentage of landscape under different years and scenarios .................................................................. 27
Figure 5. 11 Edge density under different years and scenarios .................................................................................... 28
Figure 5. 12 AWMPDF under different years and scenarios ........................................................................................ 28

Qian Zhang TRITA SoM 2009-10
viii
LIST OF TABLES
Table 2. 1 Summary of land-use change models (Lambin, 2004)...................................................................................11
Table 3. 1 List of remote sensing images used in the study......................................................................................... 14
Table 4. 1 Calculation formulae of landscape metrics (Fragstats 3.3)........................................................................... 17
Spatial-Temporal Patterns of Urban Growth in Shanghai, China: Monitoring, Analysis, and Simulation
ix
LIST OF PAPERS
This thesis is based on the following papers, which are referred to in the text by their Roman numerals.
I. Zhang, Q. et al., 2009. The trajectories of urban land and industrial land in Shanghai over the past 30 Years. In 2009 Urban Remote Sensing Joint Event. May, 2009. Shanghai, China: IEEE.
II. Zhang, Q. & Ban, Y., 2009. Monitoring impervious surface sprawl in Shanghai using tasseled cap transformation of Landsat data (Under review, submitted in December 2009 to ISPRS TC VII Symposium “100 Years ISPRS – Advancing Remote Sensing Science”, July 5–7, 2010, Vienna, Austria).
III. Zhang, Q. et al., 2008. Analysis of landscape dynamics in Shanghai using landscape metrics: Effects of spatial resolution. In XXI Congress of International Society for Photogrammetry and Remote Sensing. July, 2008. Beijing, China.
IV. Zhang, Q. et al., 2009. Simulating urban development scenarios using Markov-Cellular Automata: A case study of Shanghai, China. (Under review, submitted in October 2009 to Computers, Environment and Urban Systems).

Qian Zhang TRITA SoM 2009-10
x
Spatial-Temporal Patterns of Urban Growth in Shanghai, China: Monitoring, Analysis, and Simulation
1
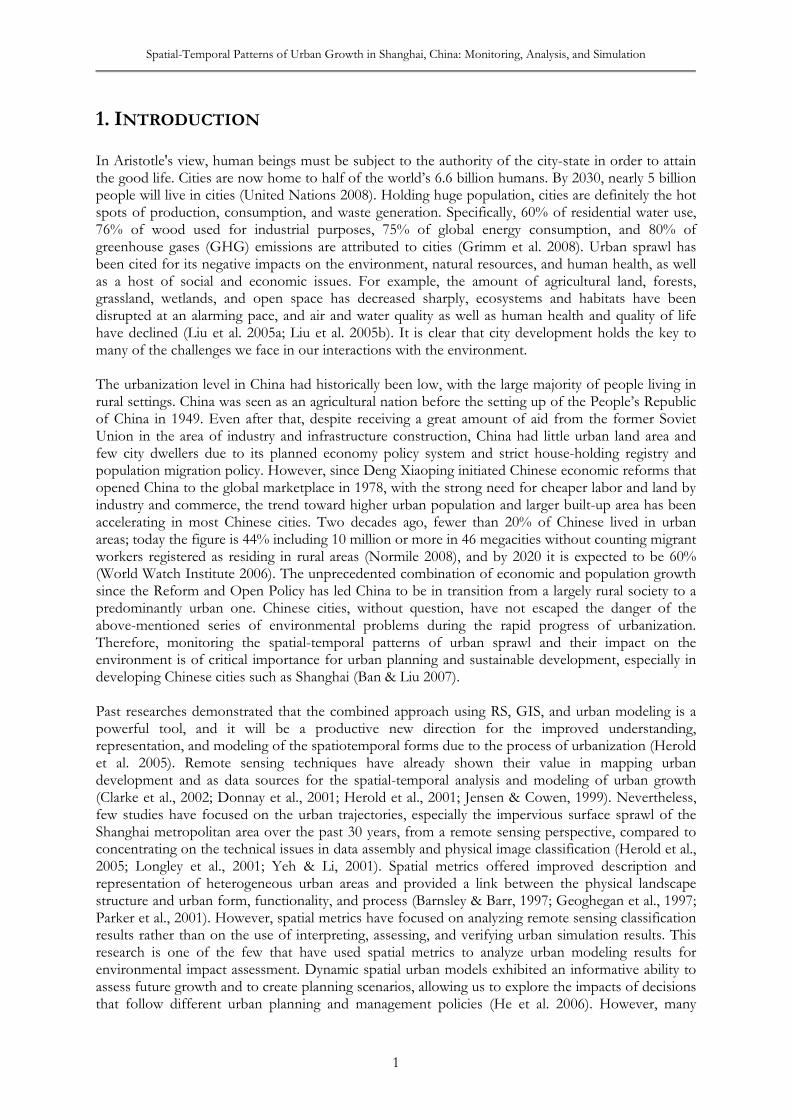
1. INTRODUCTION In Aristotle's view, human beings must be subject to the authority of the city-state in order to attain the good life. Cities are now home to half of the world’s 6.6 billion humans. By 2030, nearly 5 billion people will live in cities (United Nations 2008). Holding huge population, cities are definitely the hot spots of production, consumption, and waste generation. Specifically, 60% of residential water use, 76% of wood used for industrial purposes, 75% of global energy consumption, and 80% of greenhouse gases (GHG) emissions are attributed to cities (Grimm et al. 2008). Urban sprawl has been cited for its negative impacts on the environment, natural resources, and human health, as well as a host of social and economic issues. For example, the amount of agricultural land, forests, grassland, wetlands, and open space has decreased sharply, ecosystems and habitats have been disrupted at an alarming pace, and air and water quality as well as human health and quality of life have declined (Liu et al. 2005a; Liu et al. 2005b). It is clear that city development holds the key to many of the challenges we face in our interactions with the environment. The urbanization level in China had historically been low, with the large majority of people living in rural settings. China was seen as an agricultural nation before the setting up of the People’s Republic of China in 1949. Even after that, despite receiving a great amount of aid from the former Soviet Union in the area of industry and infrastructure construction, China had little urban land area and few city dwellers due to its planned economy policy system and strict house-holding registry and population migration policy. However, since Deng Xiaoping initiated Chinese economic reforms that opened China to the global marketplace in 1978, with the strong need for cheaper labor and land by industry and commerce, the trend toward higher urban population and larger built-up area has been accelerating in most Chinese cities. Two decades ago, fewer than 20% of Chinese lived in urban areas; today the figure is 44% including 10 million or more in 46 megacities without counting migrant workers registered as residing in rural areas (Normile 2008), and by 2020 it is expected to be 60% (World Watch Institute 2006). The unprecedented combination of economic and population growth since the Reform and Open Policy has led China to be in transition from a largely rural society to a predominantly urban one. Chinese cities, without question, have not escaped the danger of the above-mentioned series of environmental problems during the rapid progress of urbanization. Therefore, monitoring the spatial-temporal patterns of urban sprawl and their impact on the environment is of critical importance for urban planning and sustainable development, especially in developing Chinese cities such as Shanghai (Ban & Liu 2007). Past researches demonstrated that the combined approach using RS, GIS, and urban modeling is a powerful tool, and it will be a productive new direction for the improved understanding, representation, and modeling of the spatiotemporal forms due to the process of urbanization (Herold et al. 2005). Remote sensing techniques have already shown their value in mapping urban development and as data sources for the spatial-temporal analysis and modeling of urban growth (Clarke et al., 2002; Donnay et al., 2001; Herold et al., 2001; Jensen & Cowen, 1999). Nevertheless, few studies have focused on the urban trajectories, especially the impervious surface sprawl of the Shanghai metropolitan area over the past 30 years, from a remote sensing perspective, compared to concentrating on the technical issues in data assembly and physical image classification (Herold et al., 2005; Longley et al., 2001; Yeh & Li, 2001). Spatial metrics offered improved description and representation of heterogeneous urban areas and provided a link between the physical landscape structure and urban form, functionality, and process (Barnsley & Barr, 1997; Geoghegan et al., 1997; Parker et al., 2001). However, spatial metrics have focused on analyzing remote sensing classification results rather than on the use of interpreting, assessing, and verifying urban simulation results. This research is one of the few that have used spatial metrics to analyze urban modeling results for environmental impact assessment. Dynamic spatial urban models exhibited an informative ability to assess future growth and to create planning scenarios, allowing us to explore the impacts of decisions that follow different urban planning and management policies (He et al. 2006). However, many
Qian Zhang TRITA SoM 2009-10
2
researches focused merely on baseline projection and very few studies took into consideration urban growth scenarios so far. Even when scenarios were considered, different scenarios were designed according to specific development strategies in specific cities. To date, there have been no reported scenario simulations of future Shanghai growth. Moreover, most simulation studies are still limited by an urban/non-urban perspective and very few simulations have been carried out with several land-use categories within urban areas. Therefore, scenarios-based simulation with detailed land-use categories in this research highlights its advantages and value.
1.1 Research Objectives
The overall objective of this research is to investigate the integration of remote sensing, spatial metrics, and spatial-temporal models in the monitoring, analysis, and simulation of urban growth in Shanghai, China. In particular, satellite remote sensing can monitor urban dynamics at different spatial scales and over time, and is thus a unique resource for urban planning and sustainable management of land resources. Spatial metrics, by means of various landscape indices, quantify the temporal and spatial properties of urban sprawl and show the impacts of growth constraints imposed on expansion by topography and by planning policy. The spatially explicit model aims to determine the geographic extent, patterns, and catalogs of urban growth over time under different scenarios using land-cover information derived from remotely sensed satellite imageries. The primary scientific questions and the corresponding solutions, which are the specific objectives of this research, are listed as follows. Scientific questions to be answered are: (1) Where and when has urban sprawl happened in Shangahai since China’s Reform and Open Policy was launched? (2) How is Shanghai spatially organized? Why did urban processes ultimately result in specific spatial patterns? (3)What will Shanghai look like in the future under the different development priorities and what can we learn from the trajectory and simulation of urban growth? The specific research objectives are: (1) Monitoring urban trajectories over the past 30 years in the Greater Shanghai Area (GSA), China, using optical remotely sensed imageries; (2) Analyzing the landscape dynamics in the selected region of the Central Shanghai Area (CSA), China, using spatial metrics; (3) Simulating scenarios-based urban growth using Markov–Cellular Automata (Markov–CA) model in GSA as guidance for sustainable city planning. This research is part of an academic PhD research proposal and has been carried out as part of a FORMAS research project “Spatial-temporal patterns of urban sprawl: Monitoring, analysis and modeling” and a VR research collaboration program between the Royal Institute of Technology-KTH, Sweden, and the Institute of Geographic Sciences and Natural Resources Research (IGSNRR), Chinese Academy of Sciences (CAS), within the framework of the project “Spatial-temporal patterns of urban sprawl in China: Monitoring, analysis and modeling”.
1.2 Organization of the Thesis
The thesis is structured as follows: Chapter 1 gives an overview of the research, including the importance and rationale of the research, research objectives, and organization of the thesis. Chapter 2 reviews the state-of-the-art of research on temporal-spatial patterns of urban sprawl, including remote sensing for detection of urban impervious surface sprawl, spatial metrics for analysis of urban landscapes dynamics, and spatial-temporal modeling for simulation of urban scenarios. Chapter 3 describes the study area and data used in this research. Chapter 4 illustrates the methodology in
Spatial-Temporal Patterns of Urban Growth in Shanghai, China: Monitoring, Analysis, and Simulation
3
general. Thereafter, Chapter 5 presents the results of monitoring, analysis, and simulation, as well as discusses the related issues. Chapter 6 concludes with a summary of lessons learnt and Chapter 7 presents future perspectives for the next research stage. This thesis is based on the following papers, which are referred to in the text by their Roman numerals. I. Zhang, Q. et al., 2009. The trajectories of urban land and industrial land in Shanghai over the past 30 Years. In 2009 Urban Remote Sensing Joint Event. May, 2009. Shanghai, China: IEEE. II. Zhang, Q. & Ban, Y., 2009. Monitoring impervious surface sprawl in Shanghai using tasseled cap transformation of Landsat data (Under review, submitted in December 2009 to ISPRS TC VII Symposium “100 Years ISPRS – Advancing Remote Sensing Science”, July 5–7, 2010, Vienna, Austria). III. Zhang, Q. et al., 2008. Analysis of landscape dynamics in Shanghai using landscape metrics: Effects of spatial resolution. In XXI Congress of International Society for Photogrammetry and Remote Sensing. July, 2008. Beijing, China. IV. Zhang, Q. et al., 2009. Simulating urban development scenarios using Markov-Cellular Automata: A case study of Shanghai, China. (Under review, submitted in October 2009 to Computers, Environment and Urban Systems). Both Paper I and II related to monitoring urban dynamics using digital change detection techniques, and they gave an overall description of Shanghai’s city development over the past 30 years. Paper I explored the trajectories and quantified the area of urban land and industrial land in CSA using Landsat TM/ETM+, SPOT PAN and XS, and CORONA KH-4A pan images, and also briefly analyzed the driving forces of urban growth during every corresponding period. This paper was presented and published at the 2009 Urban Remote Sensing Joint Event, which was held in Shanghai, China, on May 20–22, 2009. Paper II conducted detection of impervious surface sprawl using tasseled cap transformation within the conceptual framework of Vegetation-Impervious surface-Soil (V-I-S) model (Ridd, 1995). Landsat-3 MSS images from August 4, 1979 and gap-filled Landsat-7 ETM+ images from May 22, 2009 covering the GSA were used in this case study. This paper aims to (1) detect the impervious surface sprawl using tasseled cap transformation; (2) analyze the spatial-temporal dynamics of impervious surface in GSA over the past 30 years; (3) determine the relationship between the variables derived from tasseled cap transformation and the components of the V-I-S model. This paper was submitted in December 2009 to the ISPRS TC VII Symposium “100 Years ISPRS – Advancing Remote Sensing Science” and is under full paper peer review now. Paper III focused on analysis of landscape changes in the selected experiment region of CSA and provided an intensive understanding of urban landscape dynamics. In this paper, SPOT PAN and XS in 1989/1991, 1998 and 2007 is the main data source. Visual interpretation was used to derive the detailed land-cover catalogues, and then several landscape indices were selected, calculated, and comparatively analyzed over time. This paper was presented interactively and published in XXI Congress of International Society for Photogrammetry and Remote Sensing in July, 2008. This paper is going to be extended by enlarging the study area from a 5 km * 5 km testing area to the whole central city within the outer ring road, which will cause the research results to make more sense. Moreover, Landsat TM from August 11, 1989 will be selected as the proximate data source to do the image fusion with a SPOT PAN image from October 20, 1991; hopefully, this will improve the classification accuracy compared to using the individual PAN image. Last but not least, object-based classification instead of a visual interpretation approach will be used in the extended paper; this is expected to increase the efficiency and overcome the subjectivity of visual interpretation without

Qian Zhang TRITA SoM 2009-10
4
losing the high classification accuracy. The experiment is in progress and the manuscript will be resealed in January 2010 at the licentiate seminar. Paper IV investigated an integrated approach to simulate urban development scenarios of GSA by combining remote sensing, spatial analysis, and urban modeling as well as landscape metrics and scenario analysis. When simulating urban growth, many researches merely focused on baseline projection and very few studies took into consideration urban growth scenarios. Even when scenarios were considered, different scenarios were designed according to specific development strategies in specific cities. So far, there have been no reported scenario simulations of Shanghai’s future growth. As Shanghai is experiencing a transition from being a manufacturing-dominant center (MDC) to being service-oriented center (SOC), the different development policies which the city could adopt will lead to significantly different urban futures and thus different environmental consequences. Therefore, in this research, three scenarios, that is, MDC and SOC together with a baseline, were designed and simulated with Markov–CA model in order to support decision making for a more sustainable Shanghai. Moreover, this research was based on detailed land-cover categories other than traditional urban/non-urban areas, and is one of the few that used landscape metrics to analyze urban modeling results for environmental impact assessment. The authors have been invited to submit this paper to Computers, Environment and Urban Systems, and the paper is under peer review at present after presentation at the 3rd ICA Workshop on Geospatial Analysis and Modeling in Gävle on August 6–7, 2009.
Spatial-Temporal Patterns of Urban Growth in Shanghai, China: Monitoring, Analysis, and Simulation
5
2. LITERATURE REVIEW Herold et al. (2005) illustrated a conceptual framework consisting of three components, i.e., remote sensing in urban areas, spatial metrics, and urban modeling and their interrelations. Moreover, they argued that spatial metrics were underused for analyzing the urban landscape heterogeneity and dynamic change process as well as for model calibration and validation, while at the same time the combined use of remote sensing and spatial metrics will lead to new levels of understanding of urban development. In the following three sections (Sections 2.1, 2.2, and 2.3), the state-of-the-art of urban remote sensing, spatial metrics analysis, and urban simulation are reviewed separately, and the rationale of the study is further highlighted in each section.
2.1 Remote Sensing for Detection of Urban Impervious Surface Sprawl
Remote sensing, as a “unique view” of the spatial and temporal dynamics of the processes of land-cover and land-use changes, has been widely used to monitor urban growth. A lot of change detection methods and their improved versions have been widely used in the last two decades. Generally speaking, there are two categories of change detection: one is “binary” change detection, which only detects change and non-change, and the other is “from–to” change detection, which detects the trajectories of land-cover changes and is usually based on detailed classification results. From the techniques angle, Lu et al. (2004) summarized the change detection techniques into seven categories: algebra, transformation, classification, advanced models, GIS-related, visual analysis, and other seldom-used techniques. Specifically, some techniques used fine-resolution data with spatial resolution of less than 10 m (for example, SPOT, IKONOS, QUICKBIRD) to monitor urban land-cover changes instead of using medium resolution images (such as Landsat TM/ETM+); others fused multi-sensor images (optical + SAR, optical 1 + optical 2) to make full use of the advantages of each sensor; some enhanced or transformed original bands to make results more sense, Principal Component Analysis (PCA), Minimum Noise Fraction (MNF), and Tasseled Cap transformation being the cases in point; others improved the accuracy of classification and change detection with the aid of information besides a pure spectral signature, for instance texture, logical judgment, DEM, and other ancillary data; some accepted spectral unmixing analysis to solve mixed pixel problems; and others segmented the images and considered the images as bunches of homogenous objects rather than the individual pixels. Different approaches have their own advantages, disadvantages, and prior application land-cover types. It is impossible to say which approach is absolutely superior to the others, and sometimes different kinds of methods are combined so that the detection result makes more sense (Jensen 2005; Seto et al. 2002). As this research used only optical data, change detection here mainly refers to monitoring urban impervious surface sprawl. The following paragraph explains the theory fundaments and significance of detecting impervious surface sprawl in urban areas. Urban landscapes are complexes of buildings, roads, cloverleaf junctions, greenbelts, gardens, exposed soil, and water bodies. In order to understand the heterogeneous landscapes better, therefore, the standardized model that describes these component surfaces should be defined. To date, the Vegetation-Impervious surface-Soil (V-I-S) model (Ridd 1995) is the conceptual model used most commonly for remote sensing analysis of urban landscapes. Just as the name implies, the V-I-S model assumes that land cover in urban areas is a linear combination of three components: vegetation, impervious surface, and soil (Figure 2.1). The diverse nature of these three substances has a significant impact on the dynamics and distribution of energy and moisture flux, the most important drivers in the ecosystem. Following this conceptual model, the transformation from vegetation (agriculture, forest, and so on) to impervious surface (residential, industrial, commercial land, etc.) is the dominant trajectory of urban growth. The real situation and the V-I-S model fit each other very well. Detecting impervious surface growth, therefore, is powerful and has potential for
Qian Zhang TRITA SoM 2009-10
6
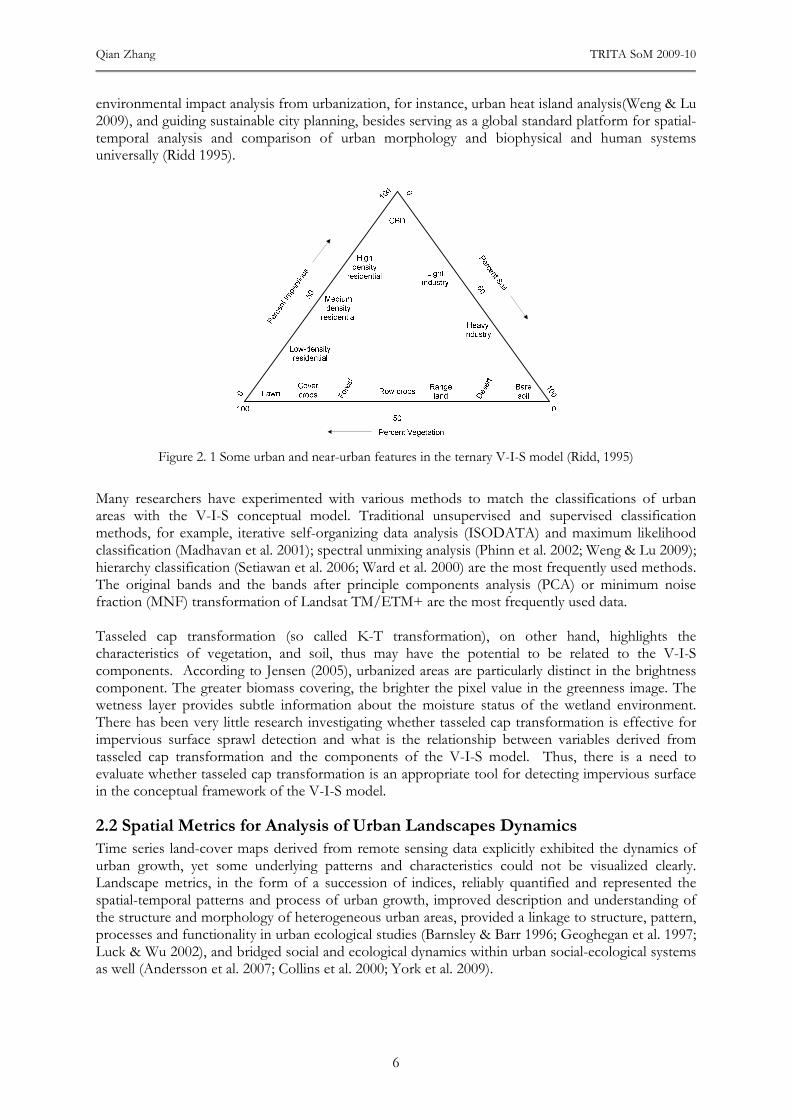
environmental impact analysis from urbanization, for instance, urban heat island analysis(Weng & Lu 2009), and guiding sustainable city planning, besides serving as a global standard platform for spatial-temporal analysis and comparison of urban morphology and biophysical and human systems universally (Ridd 1995).
Figure 2. 1 Some urban and near-urban features in the ternary V-I-S model (Ridd, 1995)
Many researchers have experimented with various methods to match the classifications of urban areas with the V-I-S conceptual model. Traditional unsupervised and supervised classification methods, for example, iterative self-organizing data analysis (ISODATA) and maximum likelihood classification (Madhavan et al. 2001); spectral unmixing analysis (Phinn et al. 2002; Weng & Lu 2009); hierarchy classification (Setiawan et al. 2006; Ward et al. 2000) are the most frequently used methods. The original bands and the bands after principle components analysis (PCA) or minimum noise fraction (MNF) transformation of Landsat TM/ETM+ are the most frequently used data. Tasseled cap transformation (so called K-T transformation), on other hand, highlights the characteristics of vegetation, and soil, thus may have the potential to be related to the V-I-S components. According to Jensen (2005), urbanized areas are particularly distinct in the brightness component. The greater biomass covering, the brighter the pixel value in the greenness image. The wetness layer provides subtle information about the moisture status of the wetland environment. There has been very little research investigating whether tasseled cap transformation is effective for impervious surface sprawl detection and what is the relationship between variables derived from tasseled cap transformation and the components of the V-I-S model. Thus, there is a need to evaluate whether tasseled cap transformation is an appropriate tool for detecting impervious surface in the conceptual framework of the V-I-S model.
2.2 Spatial Metrics for Analysis of Urban Landscapes Dynamics
Time series land-cover maps derived from remote sensing data explicitly exhibited the dynamics of urban growth, yet some underlying patterns and characteristics could not be visualized clearly. Landscape metrics, in the form of a succession of indices, reliably quantified and represented the spatial-temporal patterns and process of urban growth, improved description and understanding of the structure and morphology of heterogeneous urban areas, provided a linkage to structure, pattern, processes and functionality in urban ecological studies (Barnsley & Barr 1996; Geoghegan et al. 1997; Luck & Wu 2002), and bridged social and ecological dynamics within urban social-ecological systems as well (Andersson et al. 2007; Collins et al. 2000; York et al. 2009).
Spatial-Temporal Patterns of Urban Growth in Shanghai, China: Monitoring, Analysis, and Simulation
7
Since O’Neill initiated landscape metrics in the late 1980s (O'Neill et al. 1988), many studies have focused on the development of different indices portraying different aspects of landscape, and numerous indices emerged at a time. However, some theoretical issues related to the application of landscape metrics were still under investigation. Wu et al. (2002) systematically examined how commonly used landscape metrics respond to changing grain size and the extent and direction of analysis, and the results demonstrated that nineteen landscape metrics fell into three general categories with different variation rules. Li and Wu (2004) presented the dos and don’ts of the application based on “conceptual flaws in landscape pattern analysis”, “inherent limitations of landscape indices”, and “improper use of pattern indices”. Wu (2004) explored whether any scaling relations for landscape patterns exist when they are measured over a range of scales, and the results highlighted the need for multi-scale analysis in order to adequately characterize and monitor landscape heterogeneity. Ji et al. (2006) suggested a scale effect that landscape response to urbanization can be better revealed within larger spatial units (e.g. a metropolitan area or a county as compared to a city). Zhu et al. (2006) investigated the effects of remote sensor spatial resolution on urban landscape fragmentation; they found that fragmentation indices were sensitive to varied spatial resolution and grain size, and indicated that fine resolution data and small grain size of about 7.5 m might be optimal for urban fragmentation analysis as well. Buyantuyev and Wu (2007) illustrated the effects of thematic resolution on landscape pattern analysis, and their study results showed that changing thematic resolution may significantly affect landscape metrics with consistent general patterns but is likely to be dependent on specific landscape patterns and classification criteria in detailed patterns. Shao and Wu (2008) discussed how errors of mapped data from remote sensing data can affect landscape metrics and possible solutions which can help improve the reliability of landscape pattern analysis. The above research affirmed that specific landscape metrics, scale, classification schemes, and other related issues should be taken into careful consideration when a specific landscape analysis task is executed. The most frequently used indices in the above-mentioned existing case studies were: Percentage of Landscape (PLAND or %LAND), Patch Density (PD), Edge Density (ED), Largest Patch Index (LPI), Mean Patch Size (MPS), Landscape Shape Index (LSI), and Area Weighted Mean Patch Fractal Dimension (AWMPFD). Shannon’s diversity index (SHDI), Shannon’s evenness index (SHEI), and the contagion index (CONTAG) are usually applied too. The detailed definitions and formulae of these indices can be found in Section 4.2. With the further understanding of theoretical-related issues, landscape metrics have been improved and widely used for characterizing various landscape patterns in the past few decades, while only recently have they been applied to the study of urban morphology (Cifaldi et al. 2004; Furberg & Ban, 2008; Furberg & Ban, 2009; Geoghegan et al. 1997; Herold et al. 2002; Herold et al. 2003; Luck & Wu 2002; Seto & Fragkias 2005). In this paper, the term “spatial metrics” is accepted to refer to the application of landscape metrics outside landscape ecology and across different kinds of environments (urban areas here) according to Herold’s recommendation (Herold et al. 2005). When it comes to the application of spatial metrics for analysis of urban landscape dynamics, some studies focused on only temporal characteristics (Ji et al. 2006), and some concentrated on only spatial properties (Luck & Wu 2002; Zhang et al. 2004) while others were concerned with both sides (Deng et al. 2009; Herold et al. 2002; Seto & Fragkias 2005; Tang et al. 2008; Weng 2007; Herold et al. 2003). As far as temporal analysis is concerned, the time span is usually one decade or several decades, for instance 10 years, 20 years, 30 years, or 72 years. The conventional data source is time-series optical images, for example historical aerial photographs, Landsat MSS/TM/ETM+ images, SPOT, and IKONOS images. In short, most existing analyses were based on thematic maps derived from optical images and very few studies paid attention to the analysis of simulation results. When spatial pattern analysis of urban landscapes is investigated, the key point is how to choose the sample regions that reveal the significant spatial difference effectively. Luck and Wu (2002) initiated the combined approach of gradient analysis with landscape metrics, and thereafter transects analysis became a popular and effective method to demonstrate spatial patterns of urban landscape (Weng 2007; Zhang et al. 2004). Seto and Fragkias (2005) executed the analysis across three concentric
Qian Zhang TRITA SoM 2009-10
8
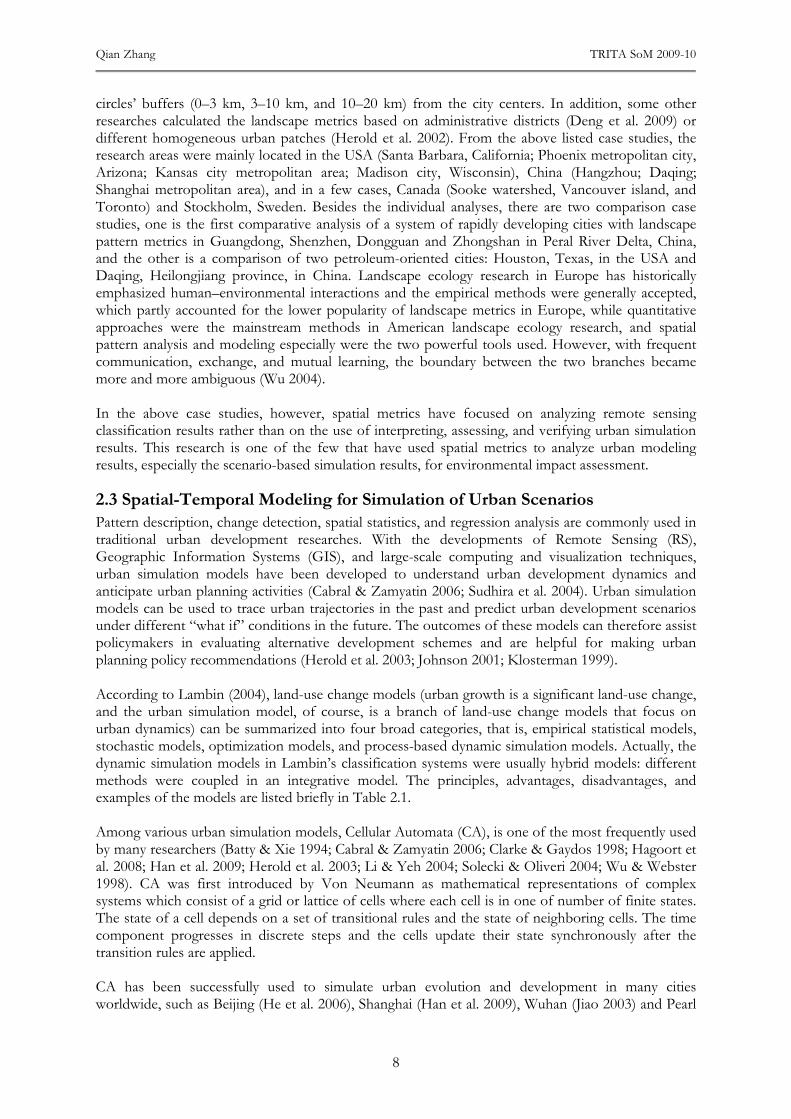
circles’ buffers (0–3 km, 3–10 km, and 10–20 km) from the city centers. In addition, some other researches calculated the landscape metrics based on administrative districts (Deng et al. 2009) or different homogeneous urban patches (Herold et al. 2002). From the above listed case studies, the research areas were mainly located in the USA (Santa Barbara, California; Phoenix metropolitan city, Arizona; Kansas city metropolitan area; Madison city, Wisconsin), China (Hangzhou; Daqing; Shanghai metropolitan area), and in a few cases, Canada (Sooke watershed, Vancouver island, and Toronto) and Stockholm, Sweden. Besides the individual analyses, there are two comparison case studies, one is the first comparative analysis of a system of rapidly developing cities with landscape pattern metrics in Guangdong, Shenzhen, Dongguan and Zhongshan in Peral River Delta, China, and the other is a comparison of two petroleum-oriented cities: Houston, Texas, in the USA and Daqing, Heilongjiang province, in China. Landscape ecology research in Europe has historically emphasized human–environmental interactions and the empirical methods were generally accepted, which partly accounted for the lower popularity of landscape metrics in Europe, while quantitative approaches were the mainstream methods in American landscape ecology research, and spatial pattern analysis and modeling especially were the two powerful tools used. However, with frequent communication, exchange, and mutual learning, the boundary between the two branches became more and more ambiguous (Wu 2004). In the above case studies, however, spatial metrics have focused on analyzing remote sensing classification results rather than on the use of interpreting, assessing, and verifying urban simulation results. This research is one of the few that have used spatial metrics to analyze urban modeling results, especially the scenario-based simulation results, for environmental impact assessment.
2.3 Spatial-Temporal Modeling for Simulation of Urban Scenarios
Pattern description, change detection, spatial statistics, and regression analysis are commonly used in traditional urban development researches. With the developments of Remote Sensing (RS), Geographic Information Systems (GIS), and large-scale computing and visualization techniques, urban simulation models have been developed to understand urban development dynamics and anticipate urban planning activities (Cabral & Zamyatin 2006; Sudhira et al. 2004). Urban simulation models can be used to trace urban trajectories in the past and predict urban development scenarios under different “what if” conditions in the future. The outcomes of these models can therefore assist policymakers in evaluating alternative development schemes and are helpful for making urban planning policy recommendations (Herold et al. 2003; Johnson 2001; Klosterman 1999). According to Lambin (2004), land-use change models (urban growth is a significant land-use change, and the urban simulation model, of course, is a branch of land-use change models that focus on urban dynamics) can be summarized into four broad categories, that is, empirical statistical models, stochastic models, optimization models, and process-based dynamic simulation models. Actually, the dynamic simulation models in Lambin’s classification systems were usually hybrid models: different methods were coupled in an integrative model. The principles, advantages, disadvantages, and examples of the models are listed briefly in Table 2.1. Among various urban simulation models, Cellular Automata (CA), is one of the most frequently used by many researchers (Batty & Xie 1994; Cabral & Zamyatin 2006; Clarke & Gaydos 1998; Hagoort et al. 2008; Han et al. 2009; Herold et al. 2003; Li & Yeh 2004; Solecki & Oliveri 2004; Wu & Webster 1998). CA was first introduced by Von Neumann as mathematical representations of complex systems which consist of a grid or lattice of cells where each cell is in one of number of finite states. The state of a cell depends on a set of transitional rules and the state of neighboring cells. The time component progresses in discrete steps and the cells update their state synchronously after the transition rules are applied. CA has been successfully used to simulate urban evolution and development in many cities worldwide, such as Beijing (He et al. 2006), Shanghai (Han et al. 2009), Wuhan (Jiao 2003) and Pearl
Spatial-Temporal Patterns of Urban Growth in Shanghai, China: Monitoring, Analysis, and Simulation
9
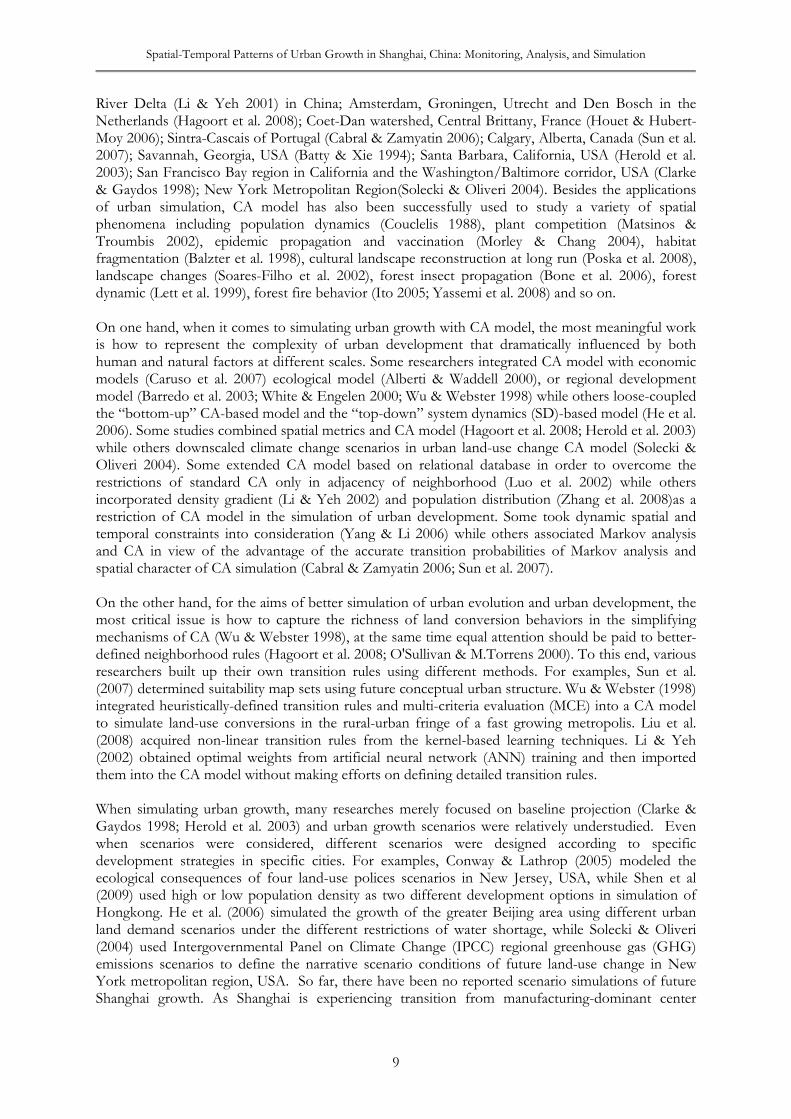
River Delta (Li & Yeh 2001) in China; Amsterdam, Groningen, Utrecht and Den Bosch in the Netherlands (Hagoort et al. 2008); Coet-Dan watershed, Central Brittany, France (Houet & Hubert-Moy 2006); Sintra-Cascais of Portugal (Cabral & Zamyatin 2006); Calgary, Alberta, Canada (Sun et al. 2007); Savannah, Georgia, USA (Batty & Xie 1994); Santa Barbara, California, USA (Herold et al. 2003); San Francisco Bay region in California and the Washington/Baltimore corridor, USA (Clarke & Gaydos 1998); New York Metropolitan Region(Solecki & Oliveri 2004). Besides the applications of urban simulation, CA model has also been successfully used to study a variety of spatial phenomena including population dynamics (Couclelis 1988), plant competition (Matsinos & Troumbis 2002), epidemic propagation and vaccination (Morley & Chang 2004), habitat fragmentation (Balzter et al. 1998), cultural landscape reconstruction at long run (Poska et al. 2008), landscape changes (Soares-Filho et al. 2002), forest insect propagation (Bone et al. 2006), forest dynamic (Lett et al. 1999), forest fire behavior (Ito 2005; Yassemi et al. 2008) and so on. On one hand, when it comes to simulating urban growth with CA model, the most meaningful work is how to represent the complexity of urban development that dramatically influenced by both human and natural factors at different scales. Some researchers integrated CA model with economic models (Caruso et al. 2007) ecological model (Alberti & Waddell 2000), or regional development model (Barredo et al. 2003; White & Engelen 2000; Wu & Webster 1998) while others loose-coupled the “bottom-up” CA-based model and the “top-down” system dynamics (SD)-based model (He et al. 2006). Some studies combined spatial metrics and CA model (Hagoort et al. 2008; Herold et al. 2003) while others downscaled climate change scenarios in urban land-use change CA model (Solecki & Oliveri 2004). Some extended CA model based on relational database in order to overcome the restrictions of standard CA only in adjacency of neighborhood (Luo et al. 2002) while others incorporated density gradient (Li & Yeh 2002) and population distribution (Zhang et al. 2008)as a restriction of CA model in the simulation of urban development. Some took dynamic spatial and temporal constraints into consideration (Yang & Li 2006) while others associated Markov analysis and CA in view of the advantage of the accurate transition probabilities of Markov analysis and spatial character of CA simulation (Cabral & Zamyatin 2006; Sun et al. 2007). On the other hand, for the aims of better simulation of urban evolution and urban development, the most critical issue is how to capture the richness of land conversion behaviors in the simplifying mechanisms of CA (Wu & Webster 1998), at the same time equal attention should be paid to better-defined neighborhood rules (Hagoort et al. 2008; O'Sullivan & M.Torrens 2000). To this end, various researchers built up their own transition rules using different methods. For examples, Sun et al. (2007) determined suitability map sets using future conceptual urban structure. Wu & Webster (1998) integrated heuristically-defined transition rules and multi-criteria evaluation (MCE) into a CA model to simulate land-use conversions in the rural-urban fringe of a fast growing metropolis. Liu et al. (2008) acquired non-linear transition rules from the kernel-based learning techniques. Li & Yeh (2002) obtained optimal weights from artificial neural network (ANN) training and then imported them into the CA model without making efforts on defining detailed transition rules. When simulating urban growth, many researches merely focused on baseline projection (Clarke & Gaydos 1998; Herold et al. 2003) and urban growth scenarios were relatively understudied. Even when scenarios were considered, different scenarios were designed according to specific development strategies in specific cities. For examples, Conway & Lathrop (2005) modeled the ecological consequences of four land-use polices scenarios in New Jersey, USA, while Shen et al (2009) used high or low population density as two different development options in simulation of Hongkong. He et al. (2006) simulated the growth of the greater Beijing area using different urban land demand scenarios under the different restrictions of water shortage, while Solecki & Oliveri (2004) used Intergovernmental Panel on Climate Change (IPCC) regional greenhouse gas (GHG) emissions scenarios to define the narrative scenario conditions of future land-use change in New York metropolitan region, USA. So far, there have been no reported scenario simulations of future Shanghai growth. As Shanghai is experiencing transition from manufacturing-dominant center
Qian Zhang TRITA SoM 2009-10
10
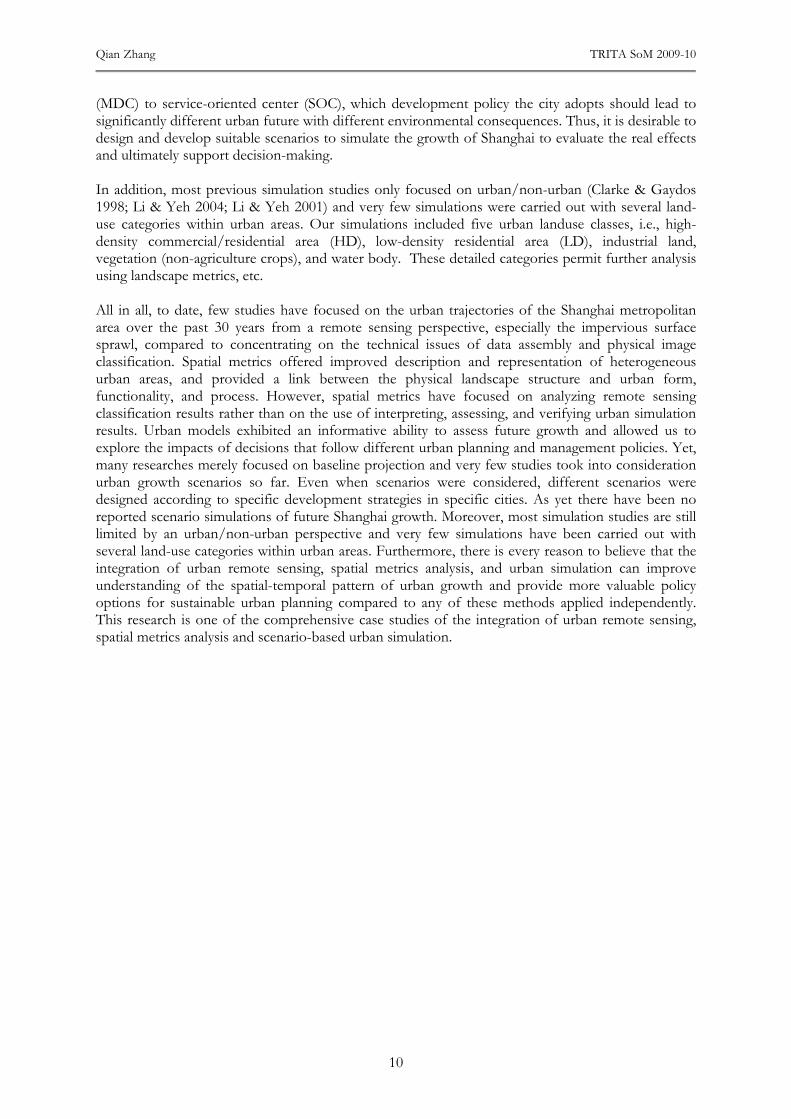
(MDC) to service-oriented center (SOC), which development policy the city adopts should lead to significantly different urban future with different environmental consequences. Thus, it is desirable to design and develop suitable scenarios to simulate the growth of Shanghai to evaluate the real effects and ultimately support decision-making. In addition, most previous simulation studies only focused on urban/non-urban (Clarke & Gaydos 1998; Li & Yeh 2004; Li & Yeh 2001) and very few simulations were carried out with several land-use categories within urban areas. Our simulations included five urban landuse classes, i.e., high-density commercial/residential area (HD), low-density residential area (LD), industrial land, vegetation (non-agriculture crops), and water body. These detailed categories permit further analysis using landscape metrics, etc. All in all, to date, few studies have focused on the urban trajectories of the Shanghai metropolitan area over the past 30 years from a remote sensing perspective, especially the impervious surface sprawl, compared to concentrating on the technical issues of data assembly and physical image classification. Spatial metrics offered improved description and representation of heterogeneous urban areas, and provided a link between the physical landscape structure and urban form, functionality, and process. However, spatial metrics have focused on analyzing remote sensing classification results rather than on the use of interpreting, assessing, and verifying urban simulation results. Urban models exhibited an informative ability to assess future growth and allowed us to explore the impacts of decisions that follow different urban planning and management policies. Yet, many researches merely focused on baseline projection and very few studies took into consideration urban growth scenarios so far. Even when scenarios were considered, different scenarios were designed according to specific development strategies in specific cities. As yet there have been no reported scenario simulations of future Shanghai growth. Moreover, most simulation studies are still limited by an urban/non-urban perspective and very few simulations have been carried out with several land-use categories within urban areas. Furthermore, there is every reason to believe that the integration of urban remote sensing, spatial metrics analysis, and urban simulation can improve understanding of the spatial-temporal pattern of urban growth and provide more valuable policy options for sustainable urban planning compared to any of these methods applied independently. This research is one of the comprehensive case studies of the integration of urban remote sensing, spatial metrics analysis and scenario-based urban simulation.
Spatial-Temporal Patterns of Urban Growth in Shanghai, China: Monitoring, Analysis, and Simulation
11
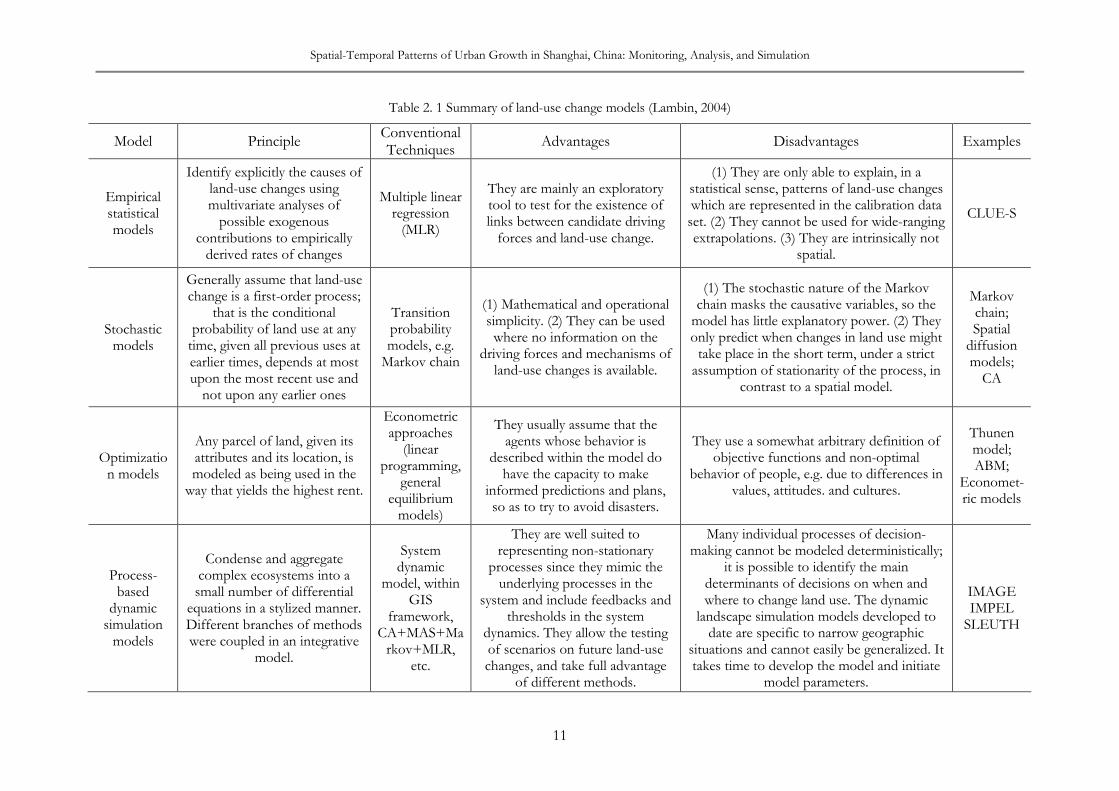
Table 2. 1 Summary of land-use change models (Lambin, 2004)
Model Principle Conventional Techniques
Advantages Disadvantages Examples
Empirical statistical models
Identify explicitly the causes of land-use changes using multivariate analyses of possible exogenous
contributions to empirically derived rates of changes
Multiple linear regression (MLR)
They are mainly an exploratory tool to test for the existence of links between candidate driving forces and land-use change.
(1) They are only able to explain, in a statistical sense, patterns of land-use changes which are represented in the calibration data set. (2) They cannot be used for wide-ranging extrapolations. (3) They are intrinsically not
spatial.
CLUE-S
Stochastic models
Generally assume that land-use change is a first-order process;
that is the conditional probability of land use at any time, given all previous uses at earlier times, depends at most upon the most recent use and not upon any earlier ones
Transition probability models, e.g. Markov chain
(1) Mathematical and operational simplicity. (2) They can be used where no information on the
driving forces and mechanisms of land-use changes is available.
(1) The stochastic nature of the Markov chain masks the causative variables, so the model has little explanatory power. (2) They only predict when changes in land use might take place in the short term, under a strict assumption of stationarity of the process, in
contrast to a spatial model.
Markov chain; Spatial diffusion models; CA
Optimization models
Any parcel of land, given its attributes and its location, is modeled as being used in the
way that yields the highest rent.
Econometric approaches
(linear programming,
general equilibrium models)
They usually assume that the agents whose behavior is
described within the model do have the capacity to make
informed predictions and plans, so as to try to avoid disasters.
They use a somewhat arbitrary definition of objective functions and non-optimal
behavior of people, e.g. due to differences in values, attitudes. and cultures.
Thunen model; ABM;
Economet-ric models
Process-based
dynamic simulation models
Condense and aggregate complex ecosystems into a small number of differential
equations in a stylized manner. Different branches of methods were coupled in an integrative
model.
System dynamic
model, within GIS
framework, CA+MAS+Markov+MLR,
etc.
They are well suited to representing non-stationary
processes since they mimic the underlying processes in the
system and include feedbacks and thresholds in the system
dynamics. They allow the testing of scenarios on future land-use changes, and take full advantage
of different methods.
Many individual processes of decision-making cannot be modeled deterministically;
it is possible to identify the main determinants of decisions on when and where to change land use. The dynamic
landscape simulation models developed to date are specific to narrow geographic
situations and cannot easily be generalized. It takes time to develop the model and initiate
model parameters.
IMAGE IMPEL SLEUTH
Qian Zhang TRITA SoM 2009-10
12
3. STUDY AREA AND DATA DESCRIPTION
3.1 Study Area
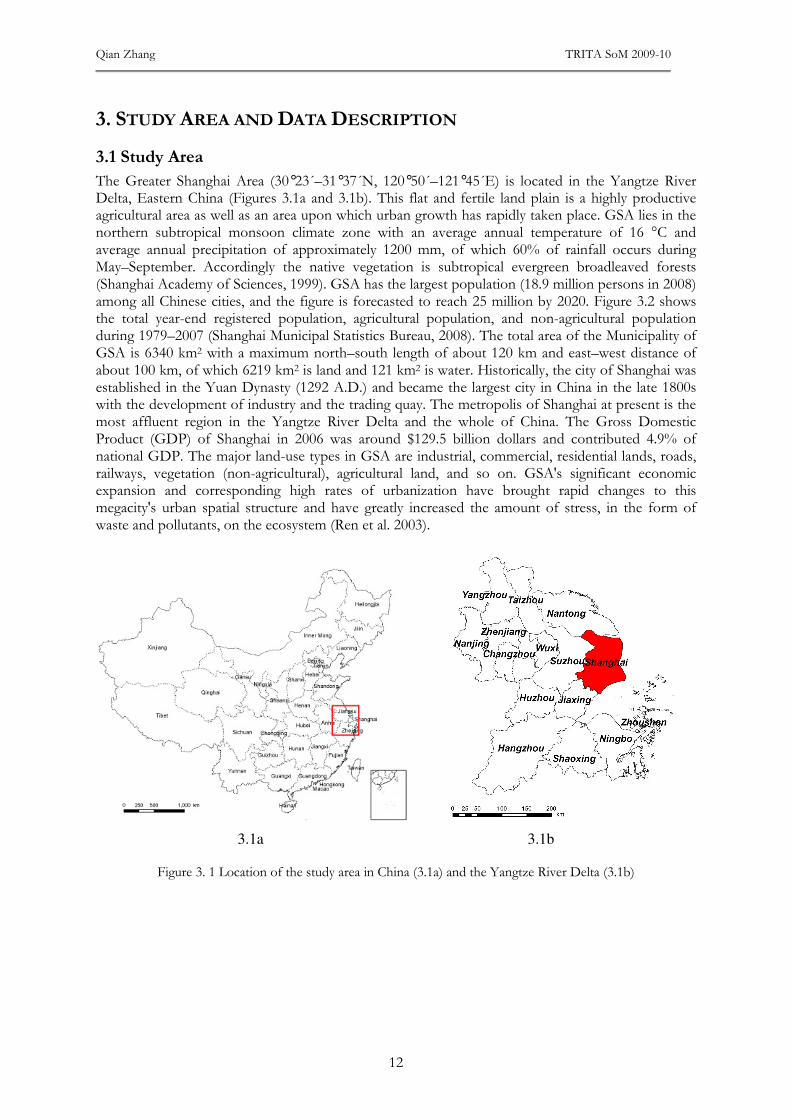
The Greater Shanghai Area (30°23´–31°37´N, 120°50´–121°45´E) is located in the Yangtze River Delta, Eastern China (Figures 3.1a and 3.1b). This flat and fertile land plain is a highly productive agricultural area as well as an area upon which urban growth has rapidly taken place. GSA lies in the northern subtropical monsoon climate zone with an average annual temperature of 16 °C and average annual precipitation of approximately 1200 mm, of which 60% of rainfall occurs during May–September. Accordingly the native vegetation is subtropical evergreen broadleaved forests (Shanghai Academy of Sciences, 1999). GSA has the largest population (18.9 million persons in 2008) among all Chinese cities, and the figure is forecasted to reach 25 million by 2020. Figure 3.2 shows the total year-end registered population, agricultural population, and non-agricultural population during 1979–2007 (Shanghai Municipal Statistics Bureau, 2008). The total area of the Municipality of GSA is 6340 km2 with a maximum north–south length of about 120 km and east–west distance of about 100 km, of which 6219 km2 is land and 121 km2 is water. Historically, the city of Shanghai was established in the Yuan Dynasty (1292 A.D.) and became the largest city in China in the late 1800s with the development of industry and the trading quay. The metropolis of Shanghai at present is the most affluent region in the Yangtze River Delta and the whole of China. The Gross Domestic Product (GDP) of Shanghai in 2006 was around $129.5 billion dollars and contributed 4.9% of national GDP. The major land-use types in GSA are industrial, commercial, residential lands, roads, railways, vegetation (non-agricultural), agricultural land, and so on. GSA's significant economic expansion and corresponding high rates of urbanization have brought rapid changes to this megacity's urban spatial structure and have greatly increased the amount of stress, in the form of waste and pollutants, on the ecosystem (Ren et al. 2003).
3.1a 3.1b
Figure 3. 1 Location of the study area in China (3.1a) and the Yangtze River Delta (3.1b)
Spatial-Temporal Patterns of Urban Growth in Shanghai, China: Monitoring, Analysis, and Simulation
13
Population in Shanghai during 1979-2007100300500700900110013001500
1978 1982 1986 1990 1994 1998 2002 2006YearPopulation(10000 persons)
Year-end Registered Agriculture Non-agriculture
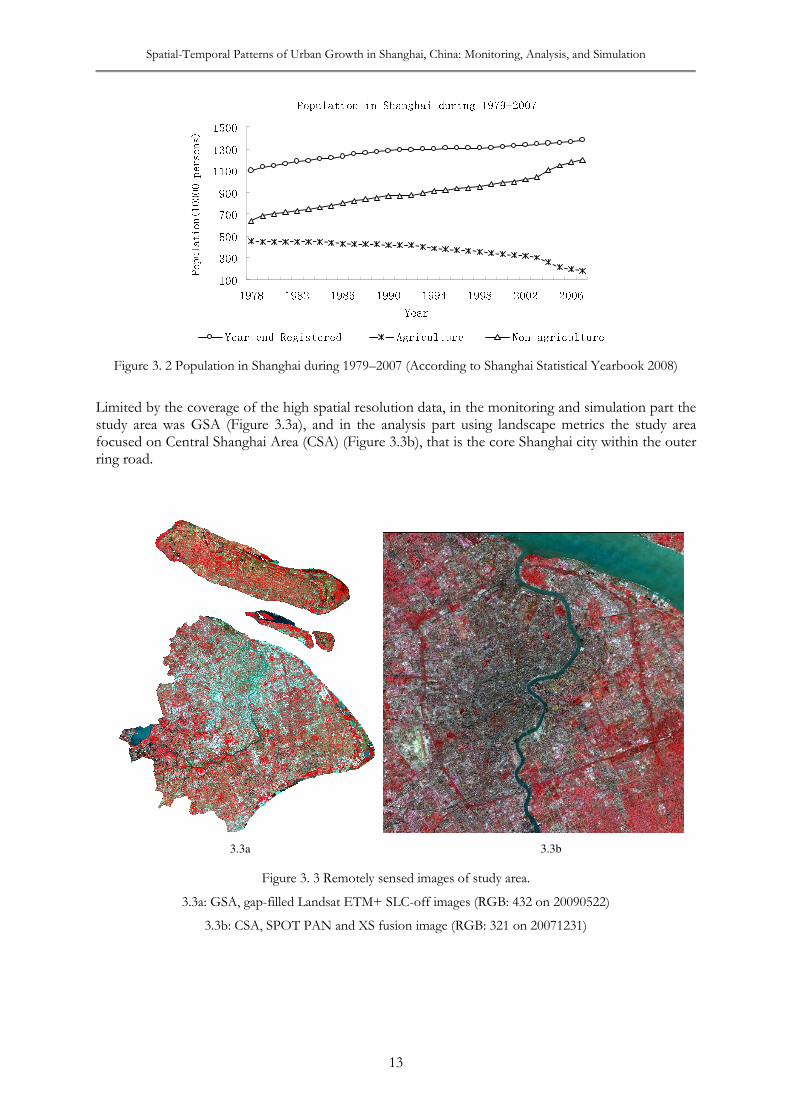
Figure 3. 2 Population in Shanghai during 1979–2007 (According to Shanghai Statistical Yearbook 2008)
Limited by the coverage of the high spatial resolution data, in the monitoring and simulation part the study area was GSA (Figure 3.3a), and in the analysis part using landscape metrics the study area focused on Central Shanghai Area (CSA) (Figure 3.3b), that is the core Shanghai city within the outer ring road.
3.3a 3.3b
Figure 3. 3 Remotely sensed images of study area.
3.3a: GSA, gap-filled Landsat ETM+ SLC-off images (RGB: 432 on 20090522)
3.3b: CSA, SPOT PAN and XS fusion image (RGB: 321 on 20071231)
Qian Zhang TRITA SoM 2009-10
14
3.2 Data
3.2.1 Remote sensing images
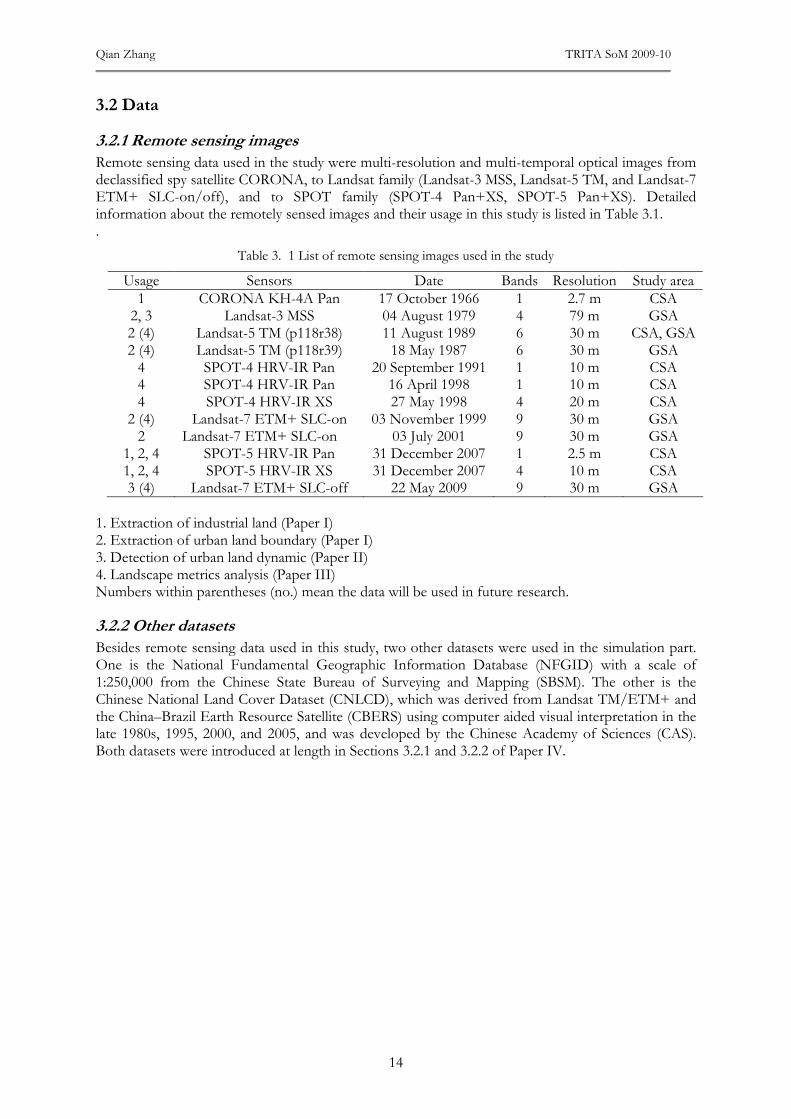
Remote sensing data used in the study were multi-resolution and multi-temporal optical images from declassified spy satellite CORONA, to Landsat family (Landsat-3 MSS, Landsat-5 TM, and Landsat-7 ETM+ SLC-on/off), and to SPOT family (SPOT-4 Pan+XS, SPOT-5 Pan+XS). Detailed information about the remotely sensed images and their usage in this study is listed in Table 3.1. .
Table 3. 1 List of remote sensing images used in the study
Usage Sensors Date Bands Resolution Study area 1 CORONA KH-4A Pan 17 October 1966 1 2.7 m CSA
2, 3 Landsat-3 MSS 04 August 1979 4 79 m GSA 2 (4) Landsat-5 TM (p118r38) 11 August 1989 6 30 m CSA, GSA 2 (4) Landsat-5 TM (p118r39) 18 May 1987 6 30 m GSA 4 SPOT-4 HRV-IR Pan 20 September 1991 1 10 m CSA 4 SPOT-4 HRV-IR Pan 16 April 1998 1 10 m CSA 4 SPOT-4 HRV-IR XS 27 May 1998 4 20 m CSA
2 (4) Landsat-7 ETM+ SLC-on 03 November 1999 9 30 m GSA 2 Landsat-7 ETM+ SLC-on 03 July 2001 9 30 m GSA
1, 2, 4 SPOT-5 HRV-IR Pan 31 December 2007 1 2.5 m CSA 1, 2, 4 SPOT-5 HRV-IR XS 31 December 2007 4 10 m CSA 3 (4) Landsat-7 ETM+ SLC-off 22 May 2009 9 30 m GSA
1. Extraction of industrial land (Paper I) 2. Extraction of urban land boundary (Paper I) 3. Detection of urban land dynamic (Paper II) 4. Landscape metrics analysis (Paper III) Numbers within parentheses (no.) mean the data will be used in future research.
3.2.2 Other datasets
Besides remote sensing data used in this study, two other datasets were used in the simulation part. One is the National Fundamental Geographic Information Database (NFGID) with a scale of 1:250,000 from the Chinese State Bureau of Surveying and Mapping (SBSM). The other is the Chinese National Land Cover Dataset (CNLCD), which was derived from Landsat TM/ETM+ and the China–Brazil Earth Resource Satellite (CBERS) using computer aided visual interpretation in the late 1980s, 1995, 2000, and 2005, and was developed by the Chinese Academy of Sciences (CAS). Both datasets were introduced at length in Sections 3.2.1 and 3.2.2 of Paper IV.
Spatial-Temporal Patterns of Urban Growth in Shanghai, China: Monitoring, Analysis, and Simulation
15
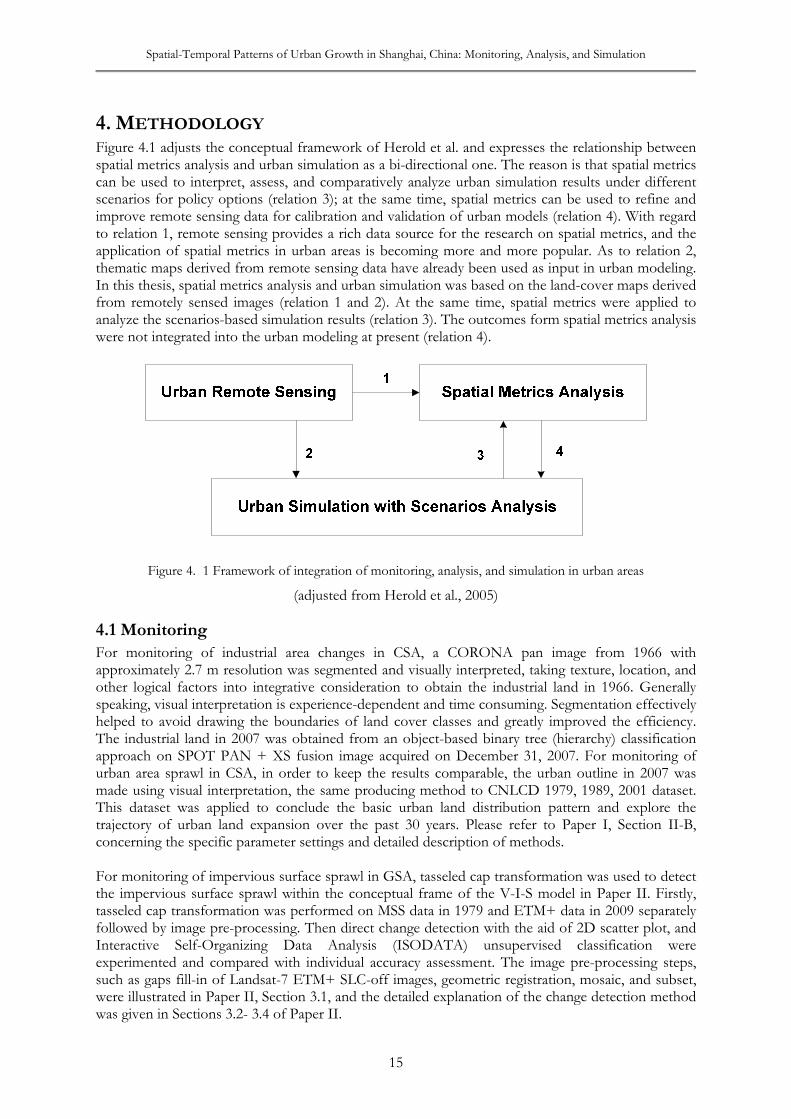
4. METHODOLOGY Figure 4.1 adjusts the conceptual framework of Herold et al. and expresses the relationship between spatial metrics analysis and urban simulation as a bi-directional one. The reason is that spatial metrics can be used to interpret, assess, and comparatively analyze urban simulation results under different scenarios for policy options (relation 3); at the same time, spatial metrics can be used to refine and improve remote sensing data for calibration and validation of urban models (relation 4). With regard to relation 1, remote sensing provides a rich data source for the research on spatial metrics, and the application of spatial metrics in urban areas is becoming more and more popular. As to relation 2, thematic maps derived from remote sensing data have already been used as input in urban modeling. In this thesis, spatial metrics analysis and urban simulation was based on the land-cover maps derived from remotely sensed images (relation 1 and 2). At the same time, spatial metrics were applied to analyze the scenarios-based simulation results (relation 3). The outcomes form spatial metrics analysis were not integrated into the urban modeling at present (relation 4).
Figure 4. 1 Framework of integration of monitoring, analysis, and simulation in urban areas
(adjusted from Herold et al., 2005)
4.1 Monitoring
For monitoring of industrial area changes in CSA, a CORONA pan image from 1966 with approximately 2.7 m resolution was segmented and visually interpreted, taking texture, location, and other logical factors into integrative consideration to obtain the industrial land in 1966. Generally speaking, visual interpretation is experience-dependent and time consuming. Segmentation effectively helped to avoid drawing the boundaries of land cover classes and greatly improved the efficiency. The industrial land in 2007 was obtained from an object-based binary tree (hierarchy) classification approach on SPOT PAN + XS fusion image acquired on December 31, 2007. For monitoring of urban area sprawl in CSA, in order to keep the results comparable, the urban outline in 2007 was made using visual interpretation, the same producing method to CNLCD 1979, 1989, 2001 dataset. This dataset was applied to conclude the basic urban land distribution pattern and explore the trajectory of urban land expansion over the past 30 years. Please refer to Paper I, Section II-B, concerning the specific parameter settings and detailed description of methods. For monitoring of impervious surface sprawl in GSA, tasseled cap transformation was used to detect the impervious surface sprawl within the conceptual frame of the V-I-S model in Paper II. Firstly, tasseled cap transformation was performed on MSS data in 1979 and ETM+ data in 2009 separately followed by image pre-processing. Then direct change detection with the aid of 2D scatter plot, and Interactive Self-Organizing Data Analysis (ISODATA) unsupervised classification were experimented and compared with individual accuracy assessment. The image pre-processing steps, such as gaps fill-in of Landsat-7 ETM+ SLC-off images, geometric registration, mosaic, and subset, were illustrated in Paper II, Section 3.1, and the detailed explanation of the change detection method was given in Sections 3.2- 3.4 of Paper II.
Qian Zhang TRITA SoM 2009-10
16
4.2 Analysis
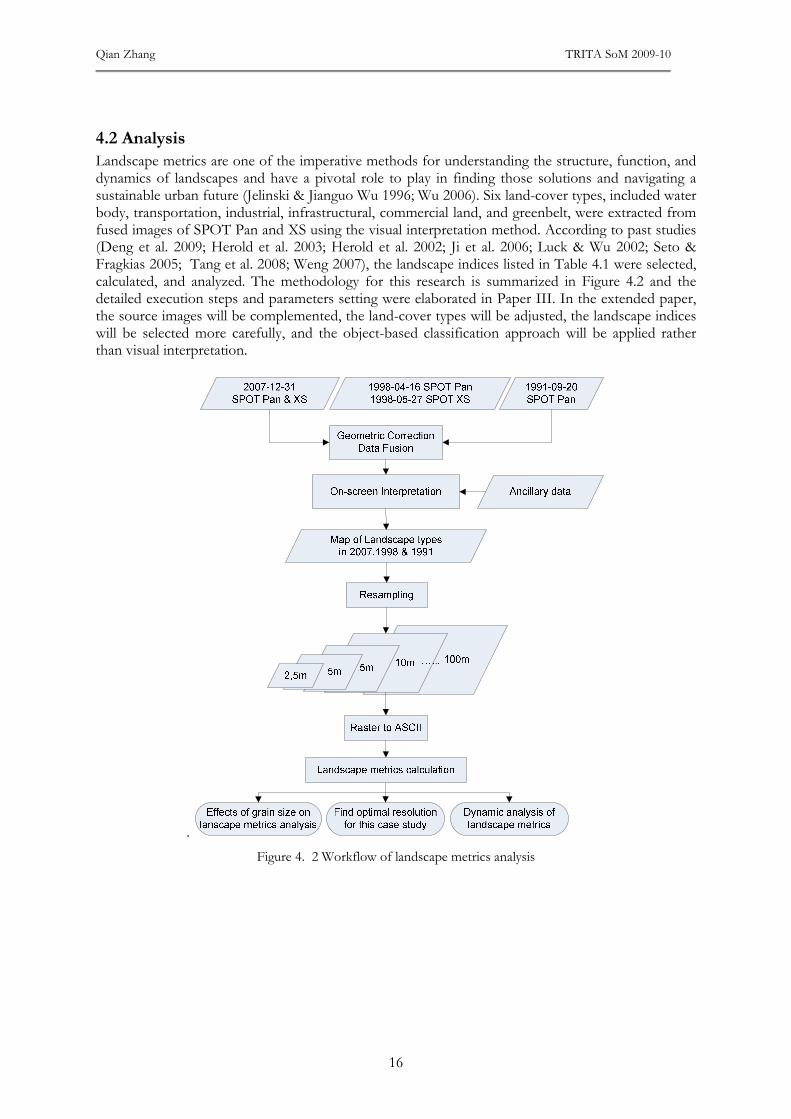
Landscape metrics are one of the imperative methods for understanding the structure, function, and dynamics of landscapes and have a pivotal role to play in finding those solutions and navigating a sustainable urban future (Jelinski & Jianguo Wu 1996; Wu 2006). Six land-cover types, included water body, transportation, industrial, infrastructural, commercial land, and greenbelt, were extracted from fused images of SPOT Pan and XS using the visual interpretation method. According to past studies (Deng et al. 2009; Herold et al. 2003; Herold et al. 2002; Ji et al. 2006; Luck & Wu 2002; Seto & Fragkias 2005; Tang et al. 2008; Weng 2007), the landscape indices listed in Table 4.1 were selected, calculated, and analyzed. The methodology for this research is summarized in Figure 4.2 and the detailed execution steps and parameters setting were elaborated in Paper III. In the extended paper, the source images will be complemented, the land-cover types will be adjusted, the landscape indices will be selected more carefully, and the object-based classification approach will be applied rather than visual interpretation.
.
Figure 4. 2 Workflow of landscape metrics analysis
Spatial-Temporal Patterns of Urban Growth in Shanghai, China: Monitoring, Analysis, and Simulation
17
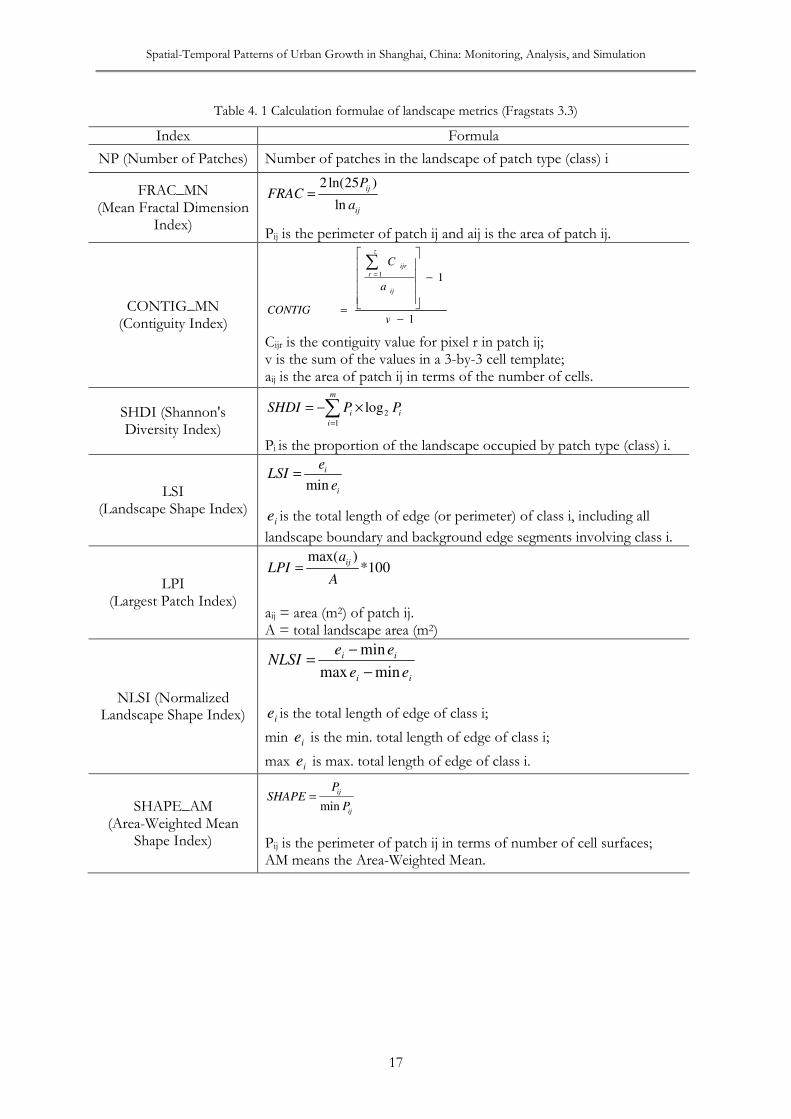
Table 4. 1 Calculation formulae of landscape metrics (Fragstats 3.3)
Index Formula
NP (Number of Patches) Number of patches in the landscape of patch type (class) i
FRAC_MN (Mean Fractal Dimension
Index)
2ln(25 )
ln
ij
ij
PFRAC
a=
Pij is the perimeter of patch ij and aij is the area of patch ij.
CONTIG_MN (Contiguity Index) 1
11
−
−
=
∑=
v
a
C
CONTIG
ij
z
r
ijr
Cijr is the contiguity value for pixel r in patch ij; v is the sum of the values in a 3-by-3 cell template; aij is the area of patch ij in terms of the number of cells.
SHDI (Shannon's Diversity Index)
2
1
logm
i i
i
SHDI P P=
= − ×∑
Pi is the proportion of the landscape occupied by patch type (class) i.
LSI (Landscape Shape Index)
min
i
i
eLSI
e=
ie is the total length of edge (or perimeter) of class i, including all
landscape boundary and background edge segments involving class i.
LPI (Largest Patch Index)
max( )*100
ija
LPIA
=
aij = area (m2) of patch ij. A = total landscape area (m2)
NLSI (Normalized Landscape Shape Index)
ii
ii
ee
eeNLSI
minmax
min
−
−=
ie is the total length of edge of class i;
min ie is the min. total length of edge of class i;
max ie is max. total length of edge of class i.
SHAPE_AM (Area-Weighted Mean
Shape Index)
min
ij
ij
PSHAPE
P=
Pij is the perimeter of patch ij in terms of number of cell surfaces; AM means the Area-Weighted Mean.
Qian Zhang TRITA SoM 2009-10
18
4.3 Simulation
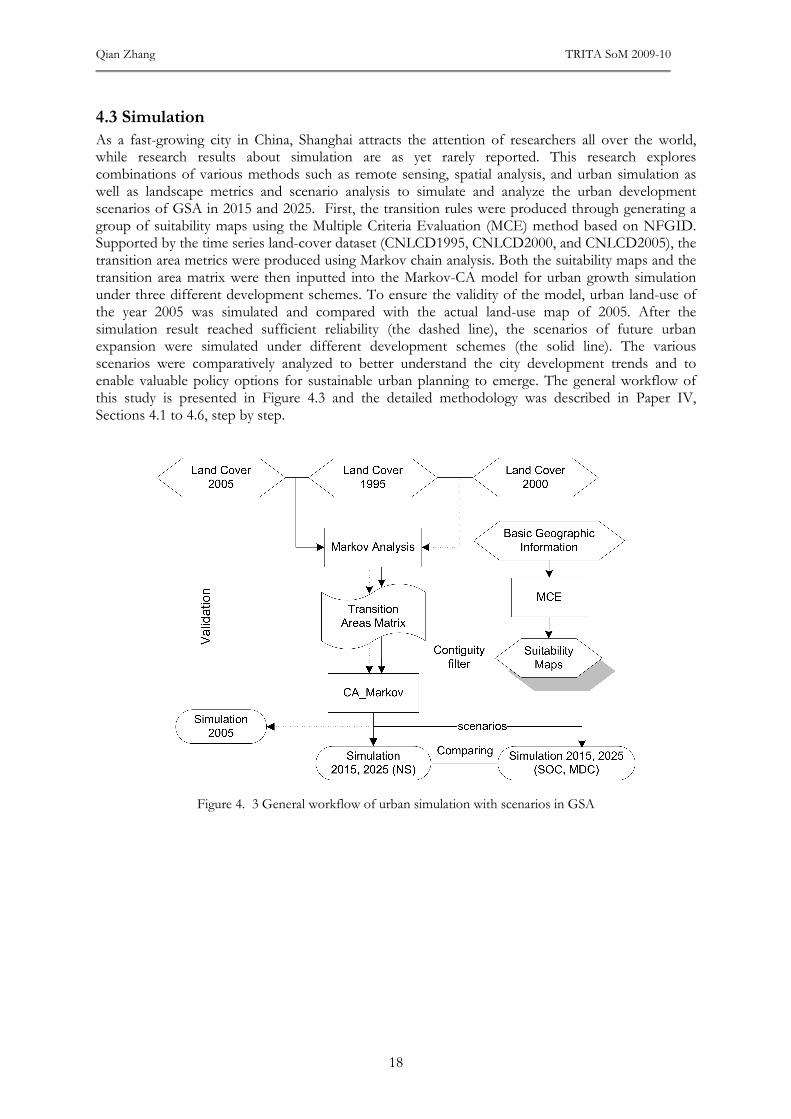
As a fast-growing city in China, Shanghai attracts the attention of researchers all over the world, while research results about simulation are as yet rarely reported. This research explores combinations of various methods such as remote sensing, spatial analysis, and urban simulation as well as landscape metrics and scenario analysis to simulate and analyze the urban development scenarios of GSA in 2015 and 2025. First, the transition rules were produced through generating a group of suitability maps using the Multiple Criteria Evaluation (MCE) method based on NFGID. Supported by the time series land-cover dataset (CNLCD1995, CNLCD2000, and CNLCD2005), the transition area metrics were produced using Markov chain analysis. Both the suitability maps and the transition area matrix were then inputted into the Markov-CA model for urban growth simulation under three different development schemes. To ensure the validity of the model, urban land-use of the year 2005 was simulated and compared with the actual land-use map of 2005. After the simulation result reached sufficient reliability (the dashed line), the scenarios of future urban expansion were simulated under different development schemes (the solid line). The various scenarios were comparatively analyzed to better understand the city development trends and to enable valuable policy options for sustainable urban planning to emerge. The general workflow of this study is presented in Figure 4.3 and the detailed methodology was described in Paper IV, Sections 4.1 to 4.6, step by step.
Figure 4. 3 General workflow of urban simulation with scenarios in GSA
Spatial-Temporal Patterns of Urban Growth in Shanghai, China: Monitoring, Analysis, and Simulation
19
5. RESULTS & DISCUSSION
5.1 Monitoring of Landscape Dynamics
5.1.1 Urban trajectories in Shanghai over past 30 years
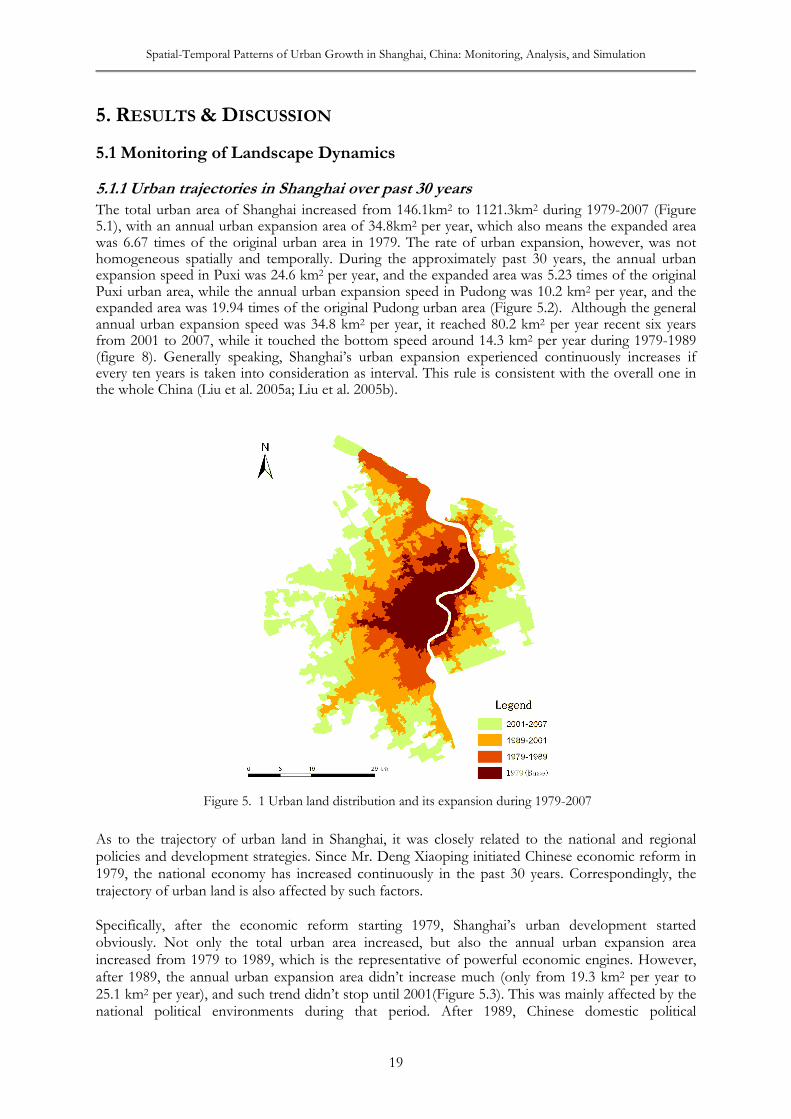
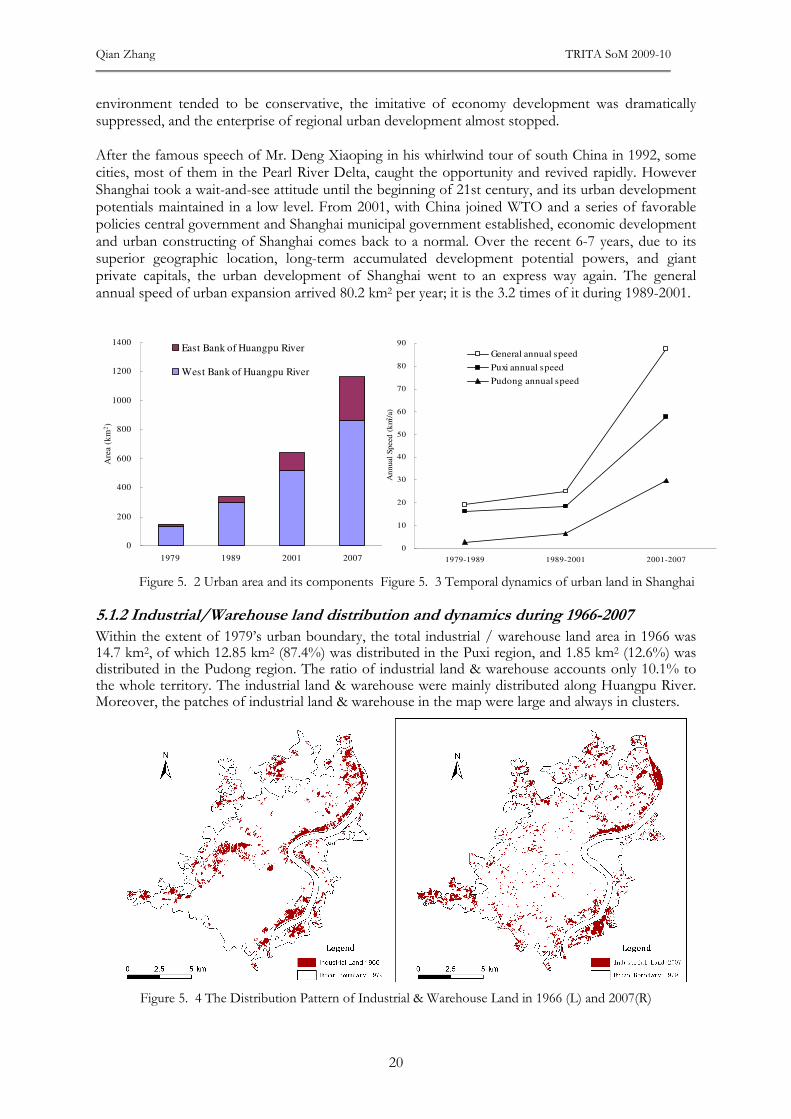
The total urban area of Shanghai increased from 146.1km2 to 1121.3km2 during 1979-2007 (Figure 5.1), with an annual urban expansion area of 34.8km2 per year, which also means the expanded area was 6.67 times of the original urban area in 1979. The rate of urban expansion, however, was not homogeneous spatially and temporally. During the approximately past 30 years, the annual urban expansion speed in Puxi was 24.6 km2 per year, and the expanded area was 5.23 times of the original Puxi urban area, while the annual urban expansion speed in Pudong was 10.2 km2 per year, and the expanded area was 19.94 times of the original Pudong urban area (Figure 5.2). Although the general annual urban expansion speed was 34.8 km2 per year, it reached 80.2 km2 per year recent six years from 2001 to 2007, while it touched the bottom speed around 14.3 km2 per year during 1979-1989 (figure 8). Generally speaking, Shanghai’s urban expansion experienced continuously increases if every ten years is taken into consideration as interval. This rule is consistent with the overall one in the whole China (Liu et al. 2005a; Liu et al. 2005b).
Figure 5. 1 Urban land distribution and its expansion during 1979-2007
As to the trajectory of urban land in Shanghai, it was closely related to the national and regional policies and development strategies. Since Mr. Deng Xiaoping initiated Chinese economic reform in 1979, the national economy has increased continuously in the past 30 years. Correspondingly, the trajectory of urban land is also affected by such factors. Specifically, after the economic reform starting 1979, Shanghai’s urban development started obviously. Not only the total urban area increased, but also the annual urban expansion area increased from 1979 to 1989, which is the representative of powerful economic engines. However, after 1989, the annual urban expansion area didn’t increase much (only from 19.3 km2 per year to 25.1 km2 per year), and such trend didn’t stop until 2001(Figure 5.3). This was mainly affected by the national political environments during that period. After 1989, Chinese domestic political
Qian Zhang TRITA SoM 2009-10
20
environment tended to be conservative, the imitative of economy development was dramatically suppressed, and the enterprise of regional urban development almost stopped. After the famous speech of Mr. Deng Xiaoping in his whirlwind tour of south China in 1992, some cities, most of them in the Pearl River Delta, caught the opportunity and revived rapidly. However Shanghai took a wait-and-see attitude until the beginning of 21st century, and its urban development potentials maintained in a low level. From 2001, with China joined WTO and a series of favorable policies central government and Shanghai municipal government established, economic development and urban constructing of Shanghai comes back to a normal. Over the recent 6-7 years, due to its superior geographic location, long-term accumulated development potential powers, and giant private capitals, the urban development of Shanghai went to an express way again. The general annual speed of urban expansion arrived 80.2 km2 per year; it is the 3.2 times of it during 1989-2001.
0
200
400
600
800
1000
1200
1400
1979 1989 2001 2007
Are
a (
km
2)
East Bank of Huangpu River
West Bank of Huangpu River
0
10
20
30
40
50
60
70
80
90
1979-1989 1989-2001 2001-2007
An
nual
Speed
(k
m2/a
)
General annual speed
Puxi annual speed
Pudong annual speed
Figure 5. 2 Urban area and its components Figure 5. 3 Temporal dynamics of urban land in Shanghai
5.1.2 Industrial/Warehouse land distribution and dynamics during 1966-2007
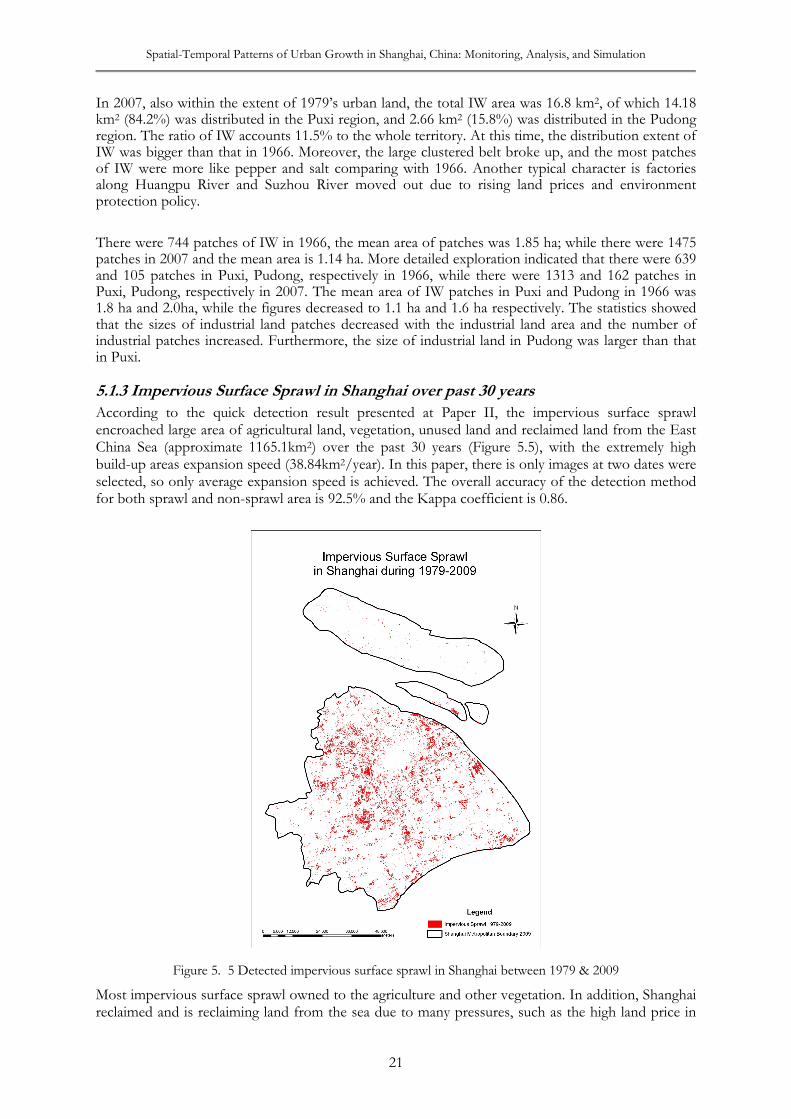
Within the extent of 1979’s urban boundary, the total industrial / warehouse land area in 1966 was 14.7 km2, of which 12.85 km2 (87.4%) was distributed in the Puxi region, and 1.85 km2 (12.6%) was distributed in the Pudong region. The ratio of industrial land & warehouse accounts only 10.1% to the whole territory. The industrial land & warehouse were mainly distributed along Huangpu River. Moreover, the patches of industrial land & warehouse in the map were large and always in clusters.
Figure 5. 4 The Distribution Pattern of Industrial & Warehouse Land in 1966 (L) and 2007(R)
Spatial-Temporal Patterns of Urban Growth in Shanghai, China: Monitoring, Analysis, and Simulation
21
In 2007, also within the extent of 1979’s urban land, the total IW area was 16.8 km2, of which 14.18 km2 (84.2%) was distributed in the Puxi region, and 2.66 km2 (15.8%) was distributed in the Pudong region. The ratio of IW accounts 11.5% to the whole territory. At this time, the distribution extent of IW was bigger than that in 1966. Moreover, the large clustered belt broke up, and the most patches of IW were more like pepper and salt comparing with 1966. Another typical character is factories along Huangpu River and Suzhou River moved out due to rising land prices and environment protection policy.
There were 744 patches of IW in 1966, the mean area of patches was 1.85 ha; while there were 1475 patches in 2007 and the mean area is 1.14 ha. More detailed exploration indicated that there were 639 and 105 patches in Puxi, Pudong, respectively in 1966, while there were 1313 and 162 patches in Puxi, Pudong, respectively in 2007. The mean area of IW patches in Puxi and Pudong in 1966 was 1.8 ha and 2.0ha, while the figures decreased to 1.1 ha and 1.6 ha respectively. The statistics showed that the sizes of industrial land patches decreased with the industrial land area and the number of industrial patches increased. Furthermore, the size of industrial land in Pudong was larger than that in Puxi.
5.1.3 Impervious Surface Sprawl in Shanghai over past 30 years
According to the quick detection result presented at Paper II, the impervious surface sprawl encroached large area of agricultural land, vegetation, unused land and reclaimed land from the East China Sea (approximate 1165.1km2) over the past 30 years (Figure 5.5), with the extremely high build-up areas expansion speed (38.84km2/year). In this paper, there is only images at two dates were selected, so only average expansion speed is achieved. The overall accuracy of the detection method for both sprawl and non-sprawl area is 92.5% and the Kappa coefficient is 0.86.
Figure 5. 5 Detected impervious surface sprawl in Shanghai between 1979 & 2009
Most impervious surface sprawl owned to the agriculture and other vegetation. In addition, Shanghai reclaimed and is reclaiming land from the sea due to many pressures, such as the high land price in
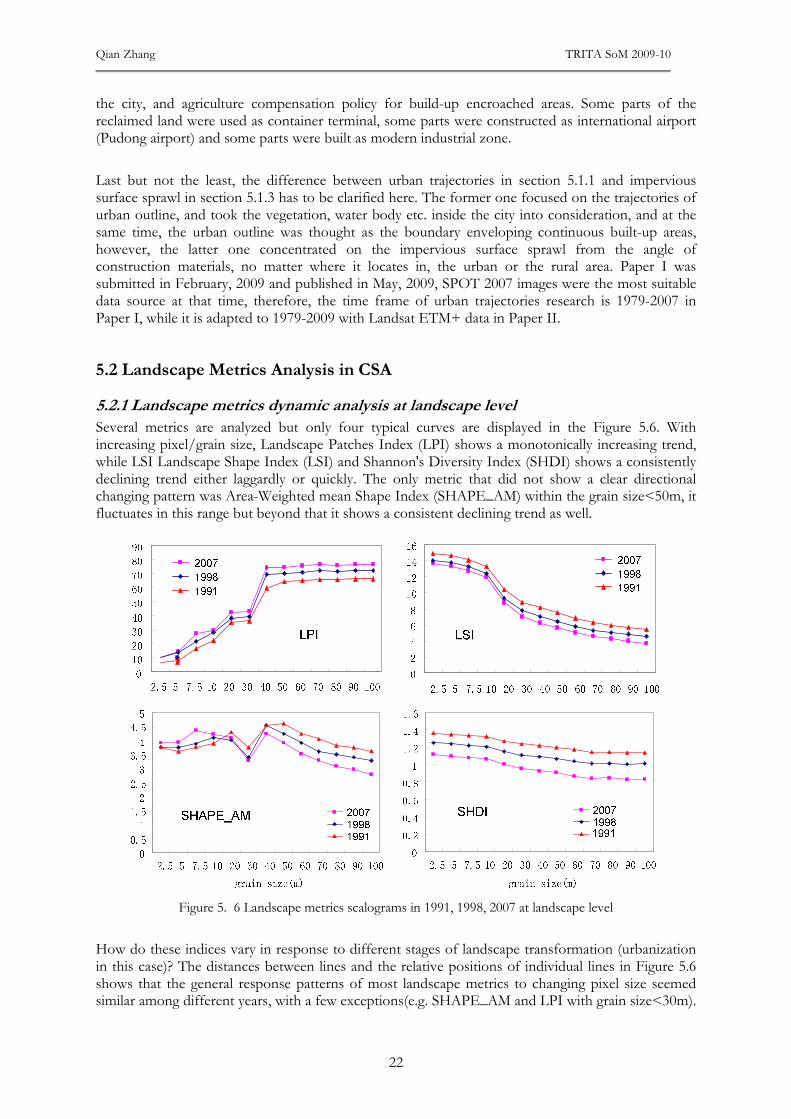
Qian Zhang TRITA SoM 2009-10
22
the city, and agriculture compensation policy for build-up encroached areas. Some parts of the reclaimed land were used as container terminal, some parts were constructed as international airport (Pudong airport) and some parts were built as modern industrial zone.
Last but not the least, the difference between urban trajectories in section 5.1.1 and impervious surface sprawl in section 5.1.3 has to be clarified here. The former one focused on the trajectories of urban outline, and took the vegetation, water body etc. inside the city into consideration, and at the same time, the urban outline was thought as the boundary enveloping continuous built-up areas, however, the latter one concentrated on the impervious surface sprawl from the angle of construction materials, no matter where it locates in, the urban or the rural area. Paper I was submitted in February, 2009 and published in May, 2009, SPOT 2007 images were the most suitable data source at that time, therefore, the time frame of urban trajectories research is 1979-2007 in Paper I, while it is adapted to 1979-2009 with Landsat ETM+ data in Paper II.
5.2 Landscape Metrics Analysis in CSA
5.2.1 Landscape metrics dynamic analysis at landscape level
Several metrics are analyzed but only four typical curves are displayed in the Figure 5.6. With increasing pixel/grain size, Landscape Patches Index (LPI) shows a monotonically increasing trend, while LSI Landscape Shape Index (LSI) and Shannon's Diversity Index (SHDI) shows a consistently declining trend either laggardly or quickly. The only metric that did not show a clear directional changing pattern was Area-Weighted mean Shape Index (SHAPE_AM) within the grain size<50m, it fluctuates in this range but beyond that it shows a consistent declining trend as well.
Figure 5. 6 Landscape metrics scalograms in 1991, 1998, 2007 at landscape level
How do these indices vary in response to different stages of landscape transformation (urbanization in this case)? The distances between lines and the relative positions of individual lines in Figure 5.6 shows that the general response patterns of most landscape metrics to changing pixel size seemed similar among different years, with a few exceptions(e.g. SHAPE_AM and LPI with grain size<30m).
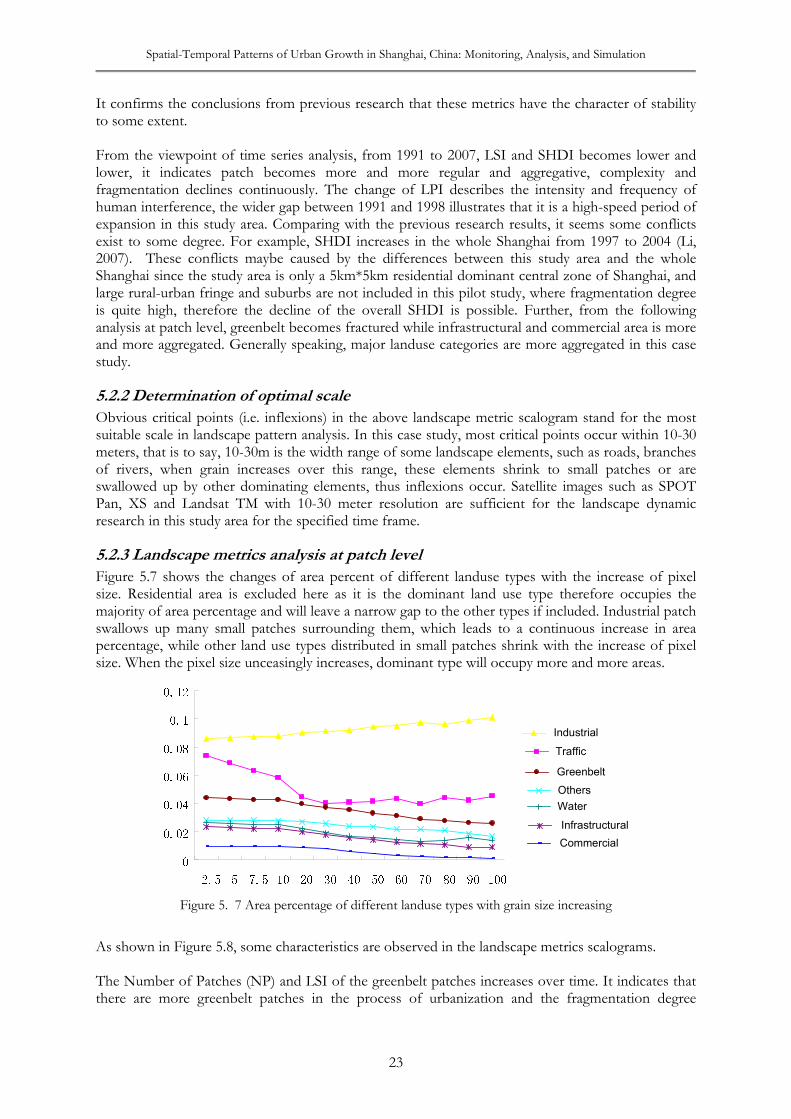
Spatial-Temporal Patterns of Urban Growth in Shanghai, China: Monitoring, Analysis, and Simulation
23
It confirms the conclusions from previous research that these metrics have the character of stability to some extent. From the viewpoint of time series analysis, from 1991 to 2007, LSI and SHDI becomes lower and lower, it indicates patch becomes more and more regular and aggregative, complexity and fragmentation declines continuously. The change of LPI describes the intensity and frequency of human interference, the wider gap between 1991 and 1998 illustrates that it is a high-speed period of expansion in this study area. Comparing with the previous research results, it seems some conflicts exist to some degree. For example, SHDI increases in the whole Shanghai from 1997 to 2004 (Li, 2007). These conflicts maybe caused by the differences between this study area and the whole Shanghai since the study area is only a 5km*5km residential dominant central zone of Shanghai, and large rural-urban fringe and suburbs are not included in this pilot study, where fragmentation degree is quite high, therefore the decline of the overall SHDI is possible. Further, from the following analysis at patch level, greenbelt becomes fractured while infrastructural and commercial area is more and more aggregated. Generally speaking, major landuse categories are more aggregated in this case study.
5.2.2 Determination of optimal scale
Obvious critical points (i.e. inflexions) in the above landscape metric scalogram stand for the most suitable scale in landscape pattern analysis. In this case study, most critical points occur within 10-30 meters, that is to say, 10-30m is the width range of some landscape elements, such as roads, branches of rivers, when grain increases over this range, these elements shrink to small patches or are swallowed up by other dominating elements, thus inflexions occur. Satellite images such as SPOT Pan, XS and Landsat TM with 10-30 meter resolution are sufficient for the landscape dynamic research in this study area for the specified time frame.
5.2.3 Landscape metrics analysis at patch level
Figure 5.7 shows the changes of area percent of different landuse types with the increase of pixel size. Residential area is excluded here as it is the dominant land use type therefore occupies the majority of area percentage and will leave a narrow gap to the other types if included. Industrial patch swallows up many small patches surrounding them, which leads to a continuous increase in area percentage, while other land use types distributed in small patches shrink with the increase of pixel size. When the pixel size unceasingly increases, dominant type will occupy more and more areas.
00.020.040.060.080.10.122.5 5 7.5 10 20 30 40 50 60 70 80 90 100
Traffic
Industrial
Others
Infrastructural
Greenbelt
Water
Commercial
Figure 5. 7 Area percentage of different landuse types with grain size increasing
As shown in Figure 5.8, some characteristics are observed in the landscape metrics scalograms. The Number of Patches (NP) and LSI of the greenbelt patches increases over time. It indicates that there are more greenbelt patches in the process of urbanization and the fragmentation degree
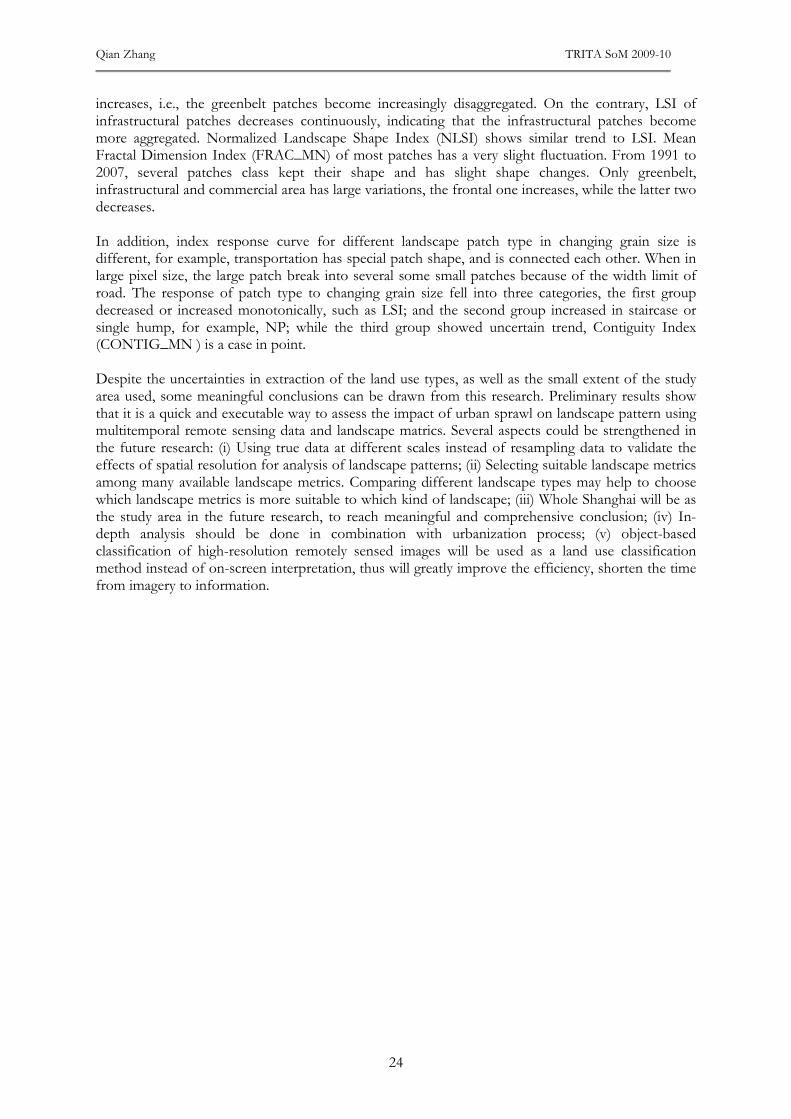
Qian Zhang TRITA SoM 2009-10
24
increases, i.e., the greenbelt patches become increasingly disaggregated. On the contrary, LSI of infrastructural patches decreases continuously, indicating that the infrastructural patches become more aggregated. Normalized Landscape Shape Index (NLSI) shows similar trend to LSI. Mean Fractal Dimension Index (FRAC_MN) of most patches has a very slight fluctuation. From 1991 to 2007, several patches class kept their shape and has slight shape changes. Only greenbelt, infrastructural and commercial area has large variations, the frontal one increases, while the latter two decreases. In addition, index response curve for different landscape patch type in changing grain size is different, for example, transportation has special patch shape, and is connected each other. When in large pixel size, the large patch break into several some small patches because of the width limit of road. The response of patch type to changing grain size fell into three categories, the first group decreased or increased monotonically, such as LSI; and the second group increased in staircase or single hump, for example, NP; while the third group showed uncertain trend, Contiguity Index (CONTIG_MN ) is a case in point. Despite the uncertainties in extraction of the land use types, as well as the small extent of the study area used, some meaningful conclusions can be drawn from this research. Preliminary results show that it is a quick and executable way to assess the impact of urban sprawl on landscape pattern using multitemporal remote sensing data and landscape matrics. Several aspects could be strengthened in the future research: (i) Using true data at different scales instead of resampling data to validate the effects of spatial resolution for analysis of landscape patterns; (ii) Selecting suitable landscape metrics among many available landscape metrics. Comparing different landscape types may help to choose which landscape metrics is more suitable to which kind of landscape; (iii) Whole Shanghai will be as the study area in the future research, to reach meaningful and comprehensive conclusion; (iv) In-depth analysis should be done in combination with urbanization process; (v) object-based classification of high-resolution remotely sensed images will be used as a land use classification method instead of on-screen interpretation, thus will greatly improve the efficiency, shorten the time from imagery to information.
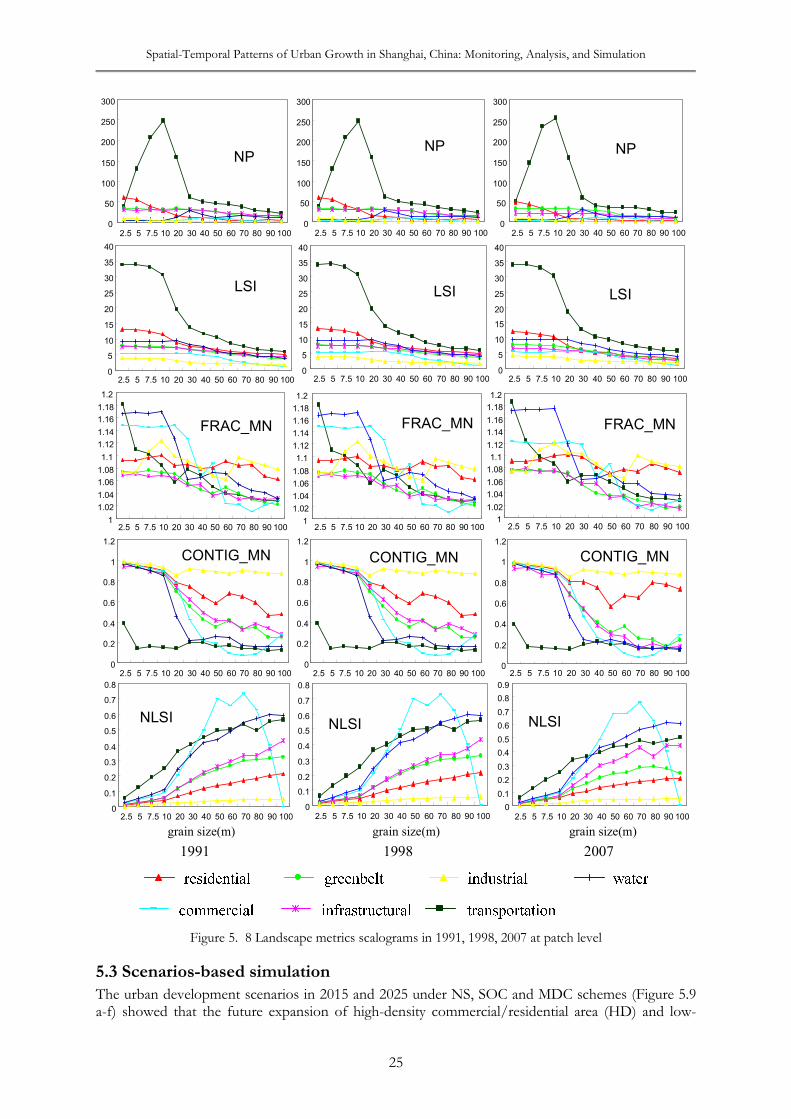
Spatial-Temporal Patterns of Urban Growth in Shanghai, China: Monitoring, Analysis, and Simulation
25
0
50
100
150
200
250
300
2.5 5 7.5 10 20 30 40 50 60 70 80 90 100
NP
0
50
100
150
200
250
300
2.5 5 7.5 10 20 30 40 50 60 70 80 90 100
NP
0
50
100
150
200
250
300
2.5 5 7.5 10 20 30 40 50 60 70 80 90 100
NP
0
5
10
15
20
25
30
35
40
2.5 5 7.5 10 20 30 40 50 60 70 80 90 100
LSI
0
5
10
15
20
25
30
35
40
2.5 5 7.5 10 20 30 40 50 60 70 80 90 100
LSI
0
5
10
15
20
25
30
35
40
2.5 5 7.5 10 20 30 40 50 60 70 80 90 100
LSI
1
1.02
1.04
1.06
1.08
1.1
1.12
1.14
1.16
1.18
1.2
2.5 5 7.5 10 20 30 40 50 60 70 80 90 100
FRAC_MN
1
1.02
1.04
1.06
1.08
1.1
1.12
1.14
1.16
1.18
1.2
2.5 5 7.5 10 20 30 40 50 60 70 80 90 100
FRAC_MN
1
1.02
1.04
1.06
1.08
1.1
1.12
1.14
1.16
1.18
1.2
2.5 5 7.5 10 20 30 40 50 60 70 80 90 100
FRAC_MN
0
0.2
0.4
0.6
0.8
1
1.2
2.5 5 7.5 10 20 30 40 50 60 70 80 90 100
CONTIG_MN
0
0.2
0.4
0.6
0.8
1
1.2
2.5 5 7.5 10 20 30 40 50 60 70 80 90 100
CONTIG_MN
0
0.2
0.4
0.6
0.8
1
1.2
2.5 5 7.5 10 20 30 40 50 60 70 80 90 100
CONTIG_MN
0
0.1
0.2
0.3
0.4
0.5
0.6
0.7
0.8
2.5 5 7.5 10 20 30 40 50 60 70 80 90 100
NLSI
grain size(m)
0
0.1
0.2
0.3
0.4
0.5
0.6
0.7
0.8
0.9
2.5 5 7.5 10 20 30 40 50 60 70 80 90 100
NLSI
grain size(m)grain size(m)
0
0.1
0.2
0.3
0.4
0.5
0.6
0.7
0.8
2.5 5 7.5 10 20 30 40 50 60 70 80 90 100
NLSI
1991 1998 2007
Figure 5. 8 Landscape metrics scalograms in 1991, 1998, 2007 at patch level
5.3 Scenarios-based simulation
The urban development scenarios in 2015 and 2025 under NS, SOC and MDC schemes (Figure 5.9 a-f) showed that the future expansion of high-density commercial/residential area (HD) and low-

Qian Zhang TRITA SoM 2009-10
26
density commercial/residential area (LD) is always around the current urban built-up regions or along the existing transportation lines. In comparison to NS and SOC schemes, industrial land (ID) under the MDC will occupy a higher proportion of farmland in 2015 and 2025, forming industrial park or industrial belt along the Huning (from Shanghai to Nanjing) and Huhang (from Shanghai to Hangzhou) channels (including highways and railroads). The result indicates that a lot of manufacturing industries will gather in GSA if favorable policy for industrial development is adopted. On the other hand, GSA will experience less urban sprawl and retain much green space in 2025 if the service orientated development policy is given priority.
a b c
d e f
Figure 5. 9 Urban simulation map series in 2015 and 2025 under different schemes
(a) 2015 NS scheme (b) 2015 SOC scheme (c) 2015 MDC scheme
(d) 2025 NS scheme (e) 2025 SOC scheme (f) 2025 MDC scheme
Specifically, for the 2015 scenarios, from the statistics of landscape percentage under different years and scenarios (Figure 5.10), the total built-up areas (HD, LD and ID) increased from 29.83% in 2005 to 37.07%, 35.09% and 38.68% under NS, SOC and MDC scenario respectively. Moreover, the proportions of HD under all schemes increased approximately 2% from 2005 while the proportions of LD for all three scenarios increased approximately 3%. The percentage of ID under MDC is more
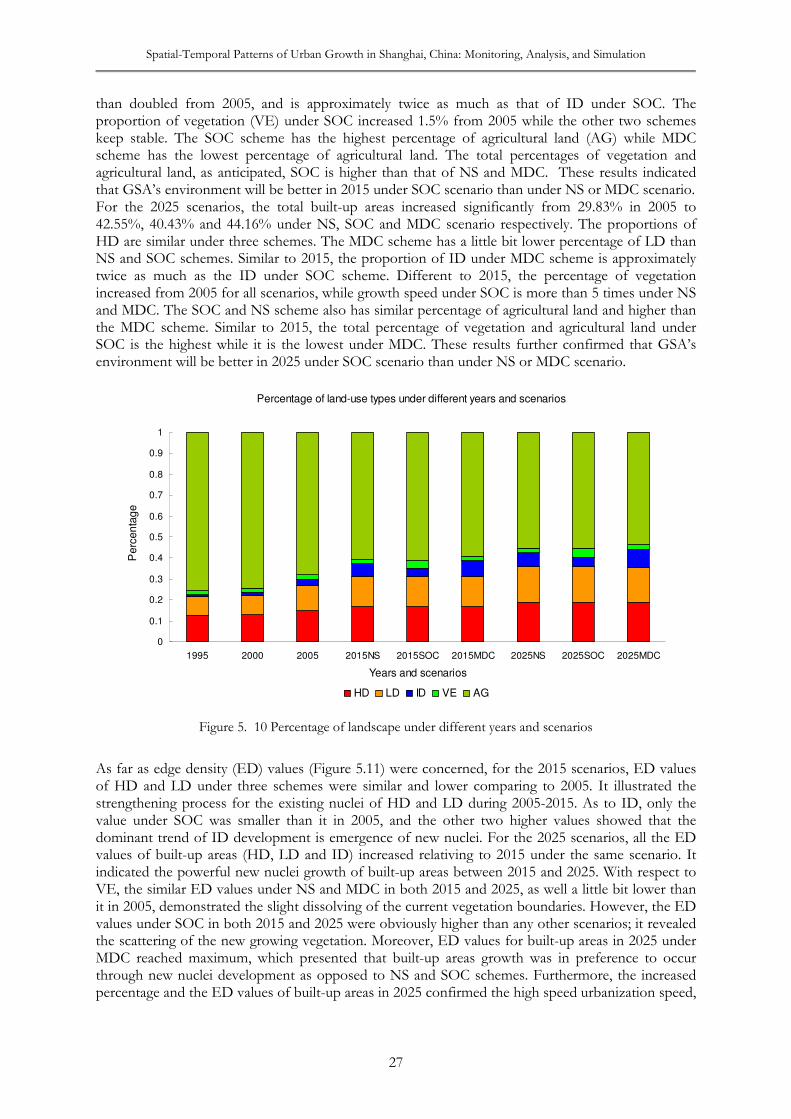
Spatial-Temporal Patterns of Urban Growth in Shanghai, China: Monitoring, Analysis, and Simulation
27
than doubled from 2005, and is approximately twice as much as that of ID under SOC. The proportion of vegetation (VE) under SOC increased 1.5% from 2005 while the other two schemes keep stable. The SOC scheme has the highest percentage of agricultural land (AG) while MDC scheme has the lowest percentage of agricultural land. The total percentages of vegetation and agricultural land, as anticipated, SOC is higher than that of NS and MDC. These results indicated that GSA’s environment will be better in 2015 under SOC scenario than under NS or MDC scenario. For the 2025 scenarios, the total built-up areas increased significantly from 29.83% in 2005 to 42.55%, 40.43% and 44.16% under NS, SOC and MDC scenario respectively. The proportions of HD are similar under three schemes. The MDC scheme has a little bit lower percentage of LD than NS and SOC schemes. Similar to 2015, the proportion of ID under MDC scheme is approximately twice as much as the ID under SOC scheme. Different to 2015, the percentage of vegetation increased from 2005 for all scenarios, while growth speed under SOC is more than 5 times under NS and MDC. The SOC and NS scheme also has similar percentage of agricultural land and higher than the MDC scheme. Similar to 2015, the total percentage of vegetation and agricultural land under SOC is the highest while it is the lowest under MDC. These results further confirmed that GSA’s environment will be better in 2025 under SOC scenario than under NS or MDC scenario.
Percentage of land-use types under different years and scenarios
0
0.1
0.2
0.3
0.4
0.5
0.6
0.7
0.8
0.9
1
1995 2000 2005 2015NS 2015SOC 2015MDC 2025NS 2025SOC 2025MDC
Years and scenarios
Perc
en
tag
e
HD LD ID VE AG
Figure 5. 10 Percentage of landscape under different years and scenarios
As far as edge density (ED) values (Figure 5.11) were concerned, for the 2015 scenarios, ED values of HD and LD under three schemes were similar and lower comparing to 2005. It illustrated the strengthening process for the existing nuclei of HD and LD during 2005-2015. As to ID, only the value under SOC was smaller than it in 2005, and the other two higher values showed that the dominant trend of ID development is emergence of new nuclei. For the 2025 scenarios, all the ED values of built-up areas (HD, LD and ID) increased relativing to 2015 under the same scenario. It indicated the powerful new nuclei growth of built-up areas between 2015 and 2025. With respect to VE, the similar ED values under NS and MDC in both 2015 and 2025, as well a little bit lower than it in 2005, demonstrated the slight dissolving of the current vegetation boundaries. However, the ED values under SOC in both 2015 and 2025 were obviously higher than any other scenarios; it revealed the scattering of the new growing vegetation. Moreover, ED values for built-up areas in 2025 under MDC reached maximum, which presented that built-up areas growth was in preference to occur through new nuclei development as opposed to NS and SOC schemes. Furthermore, the increased percentage and the ED values of built-up areas in 2025 confirmed the high speed urbanization speed,
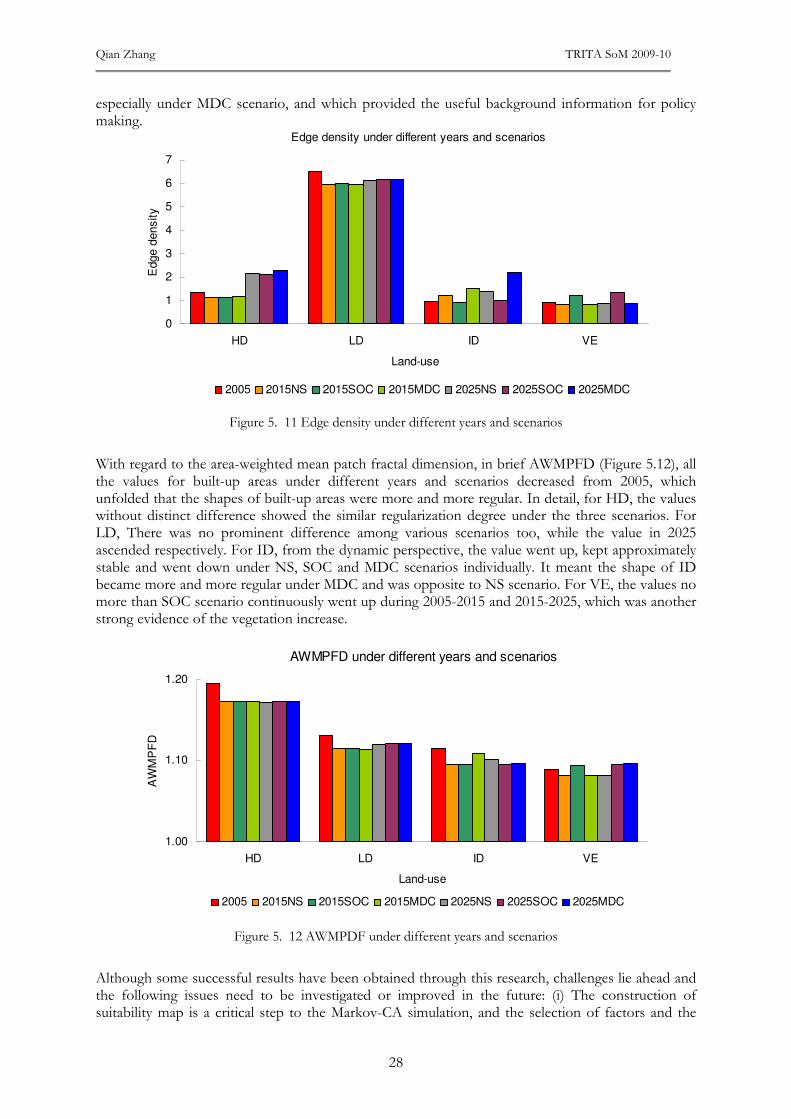
Qian Zhang TRITA SoM 2009-10
28
especially under MDC scenario, and which provided the useful background information for policy making.
Edge density under different years and scenarios
0
1
2
3
4
5
6
7
HD LD ID VE
Land-use
Edge d
ensity
2005 2015NS 2015SOC 2015MDC 2025NS 2025SOC 2025MDC
Figure 5. 11 Edge density under different years and scenarios
With regard to the area-weighted mean patch fractal dimension, in brief AWMPFD (Figure 5.12), all the values for built-up areas under different years and scenarios decreased from 2005, which unfolded that the shapes of built-up areas were more and more regular. In detail, for HD, the values without distinct difference showed the similar regularization degree under the three scenarios. For LD, There was no prominent difference among various scenarios too, while the value in 2025 ascended respectively. For ID, from the dynamic perspective, the value went up, kept approximately stable and went down under NS, SOC and MDC scenarios individually. It meant the shape of ID became more and more regular under MDC and was opposite to NS scenario. For VE, the values no more than SOC scenario continuously went up during 2005-2015 and 2015-2025, which was another strong evidence of the vegetation increase.
AWMPFD under different years and scenarios
1.00
1.10
1.20
HD LD ID VE
Land-use
AW
MP
FD
2005 2015NS 2015SOC 2015MDC 2025NS 2025SOC 2025MDC
Figure 5. 12 AWMPDF under different years and scenarios
Although some successful results have been obtained through this research, challenges lie ahead and the following issues need to be investigated or improved in the future: (i) The construction of suitability map is a critical step to the Markov-CA simulation, and the selection of factors and the

Spatial-Temporal Patterns of Urban Growth in Shanghai, China: Monitoring, Analysis, and Simulation
29
determinations of the weights of different factors are also important to the MCE method. Therefore, it is necessary to examine the sensitivity of the simulation results to various suitability maps as well as the sensitivity of the suitability maps to the factors and weights. (ii) The designation of different schemes is the basic element for the future scenario simulation. Due to the complexity of bureaucracy that make urban development decision and the diversity of regional interests, it is difficult to apply a simple aim on different bureaucratic level and different administrative zone. Thus it may be a good idea to construct a hierarchic and localized scheme system for the better and more practical simulation. (iii) Urban development is strongly affected by political, socio-economic, cultural and other factors. Therefore, future research is necessary but challenging to incorporate these factors into Markov-CA model for more reliable urban simulation in support of sustainable urban development.
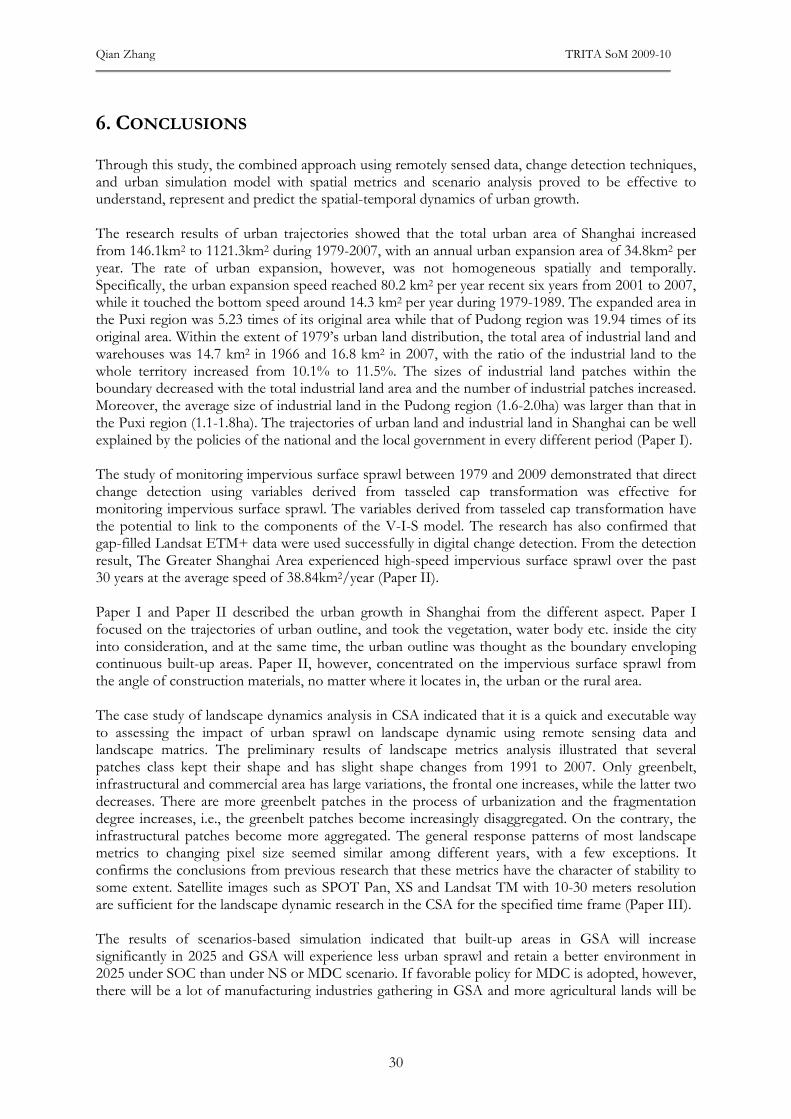
Qian Zhang TRITA SoM 2009-10
30
6. CONCLUSIONS Through this study, the combined approach using remotely sensed data, change detection techniques, and urban simulation model with spatial metrics and scenario analysis proved to be effective to understand, represent and predict the spatial-temporal dynamics of urban growth. The research results of urban trajectories showed that the total urban area of Shanghai increased from 146.1km2 to 1121.3km2 during 1979-2007, with an annual urban expansion area of 34.8km2 per year. The rate of urban expansion, however, was not homogeneous spatially and temporally. Specifically, the urban expansion speed reached 80.2 km2 per year recent six years from 2001 to 2007, while it touched the bottom speed around 14.3 km2 per year during 1979-1989. The expanded area in the Puxi region was 5.23 times of its original area while that of Pudong region was 19.94 times of its original area. Within the extent of 1979’s urban land distribution, the total area of industrial land and warehouses was 14.7 km2 in 1966 and 16.8 km2 in 2007, with the ratio of the industrial land to the whole territory increased from 10.1% to 11.5%. The sizes of industrial land patches within the boundary decreased with the total industrial land area and the number of industrial patches increased. Moreover, the average size of industrial land in the Pudong region (1.6-2.0ha) was larger than that in the Puxi region (1.1-1.8ha). The trajectories of urban land and industrial land in Shanghai can be well explained by the policies of the national and the local government in every different period (Paper I). The study of monitoring impervious surface sprawl between 1979 and 2009 demonstrated that direct change detection using variables derived from tasseled cap transformation was effective for monitoring impervious surface sprawl. The variables derived from tasseled cap transformation have the potential to link to the components of the V-I-S model. The research has also confirmed that gap-filled Landsat ETM+ data were used successfully in digital change detection. From the detection result, The Greater Shanghai Area experienced high-speed impervious surface sprawl over the past 30 years at the average speed of 38.84km2/year (Paper II). Paper I and Paper II described the urban growth in Shanghai from the different aspect. Paper I focused on the trajectories of urban outline, and took the vegetation, water body etc. inside the city into consideration, and at the same time, the urban outline was thought as the boundary enveloping continuous built-up areas. Paper II, however, concentrated on the impervious surface sprawl from the angle of construction materials, no matter where it locates in, the urban or the rural area. The case study of landscape dynamics analysis in CSA indicated that it is a quick and executable way to assessing the impact of urban sprawl on landscape dynamic using remote sensing data and landscape matrics. The preliminary results of landscape metrics analysis illustrated that several patches class kept their shape and has slight shape changes from 1991 to 2007. Only greenbelt, infrastructural and commercial area has large variations, the frontal one increases, while the latter two decreases. There are more greenbelt patches in the process of urbanization and the fragmentation degree increases, i.e., the greenbelt patches become increasingly disaggregated. On the contrary, the infrastructural patches become more aggregated. The general response patterns of most landscape metrics to changing pixel size seemed similar among different years, with a few exceptions. It confirms the conclusions from previous research that these metrics have the character of stability to some extent. Satellite images such as SPOT Pan, XS and Landsat TM with 10-30 meters resolution are sufficient for the landscape dynamic research in the CSA for the specified time frame (Paper III). The results of scenarios-based simulation indicated that built-up areas in GSA will increase significantly in 2025 and GSA will experience less urban sprawl and retain a better environment in 2025 under SOC than under NS or MDC scenario. If favorable policy for MDC is adopted, however, there will be a lot of manufacturing industries gathering in GSA and more agricultural lands will be

Spatial-Temporal Patterns of Urban Growth in Shanghai, China: Monitoring, Analysis, and Simulation
31
encroached. Markov-CA model is a useful tool to simulate the scenarios of future urban developments and therefore provides the policy options for sustainable urban planning (Paper IV).
Qian Zhang TRITA SoM 2009-10
32
7. FUTURE RESEARCH The present research focused on the analysis of physical and morphological aspects of urban growth. Urban land-use dynamics are, however, intrinsically linked with socio-economic, political, or demographic drivers. Better theoretical understanding of the spatial-temporal patterns of urban systems and the link between urban form and socio-economic & demographic characteristics is of particular importance for progress in the field urban geography, urban remote sensing, and modeling (Herold et al. 2006). Trying to fill in the missing link between traditional urban geography and urban remote sensing & urban simulation and to improve understanding of the interactions between human and natural aspects in the urban socio-ecosystem is the major focus in the next phase of the Ph.D. research. In order to fulfill the above objective, there are two directions for future research. One is the analysis of the integrative driving forces of urban growth. Specifically, a series of socio-economic data from the Chinese statistical year books will be analyzed and data mining approaches will be investigated to discover the hidden driving forces of urban growth and to sort out the interests and benefits of different stakeholders. The other is related to urban simulation. Based on the research results of driving forces, participatory agent-based modeling adaptive to the study area will be developed and tested. Modeling of industrial zones will be on the primary focus in the experiment because it takes time to conduct the interviews, field investigation, role-playing games etc. in participatory agent-based simulation. Furthermore, various well-known urban models, for example CLUE-S, GeoMod, Land Change Modeler TM, SLEUTH, UrbanSim, and Land Transformation Model, will be examined, explored, and compared with the same datasets of Shanghai to gain better understanding of urban simulation. The outcomes aiming at sustainable city development from the research results of monitoring, analysis, and simulation in Shanghai, especially from the policy perspective, will be refined as policy options at the end.
Spatial-Temporal Patterns of Urban Growth in Shanghai, China: Monitoring, Analysis, and Simulation
33
8. REFERENCES Alberti, M. & Waddell, P., 2000. An integrated urban development and ecological simulation model.
Integrated Assessment, 1(3), 215-227. Andersson, E., Barthel, S. & Ahrne, K., 2007. Measuring social-ecological dynamics behand the
generation of ecosystem services. Ecological Applications, 17(5), 1267-1278. Balzter, H., Braun, P.W. & Köhler, W., 1998. Cellular automata models for vegetation dynamics.
Ecological Modelling, 107(2-3), 113-125. Ban, Y. & Liu, J., 2007. Spatial-Temporal Patterns of Urban Sprawl in China: Monitoring, Analysis
and Modeling. Barnsley, M. & Barr, S., 1996. Inferring urban land use from satellite sensor images using kernel-
based spatial reclassification. Photogrammetric Engineering and Remote Sensing, 62(8), 949-958. Barredo, J.I. et al., 2003. Modelling dynamic spatial processes: simulation of urban future scenarios
through cellular automata. Landscape and Urban Planning, 64(3), 145-160. Batty, M. & Xie, Y., 1994. From cells to cities. Environment and Planning B: Planning and Design, 21(7),
s31 – s48. Bone, C., Dragicevic, S. & Roberts, A., 2006. A fuzzy-constrained cellular automata model of forest
insect infestations. Ecological Modelling, 192(1-2), 107-125. Buyantuyev, A. & Wu, J., 2007. Effects of thematic resolution on landscape pattern analysis.
Landscape Ecology, 22(1), 7-13. Cabral, P. & Zamyatin, A., 2006. Three land change models for urban dynamics analysis in Sintra-
Cascais area. In 1st EARSeL Workshop of the SIG Urban Remote Sensing. Humboldt-Universität zu Berlin.
Caruso, G. et al., 2007. Spatial configurations in a periurban city. A cellular automata-based
microeconomic model. Regional Science and Urban Economics, 37(5), 542-567. Cifaldi, R.L. et al., 2004. Spatial patterns in land cover of exurbanizing watersheds in southeastern
Michigan. Landscape and Urban Planning, 66(2), 107-123. Clarke, K.C. & Gaydos, L.J., 1998. Loose-coupling a cellular automaton model and GIS: long-term
urban growth prediction for San Francisco and Washington/Baltimore. International Journal of Geographical Information Science, 12(7), 699.
Collins, J.P. et al., 2000. A new urban ecology: Modeling human communities as integral parts of
ecosystems poses special problems for the development and testing of ecological theory. American Scientist, 88, 416-425.
Conway, T.M. & Lathrop, R.G., 2005. Modeling the Ecological Consequences of Land-Use Policies
in an Urbanizing Region. Environmental Management, 35(3), 278-291. Couclelis, H., 1988. Of mice and men: what rodent populations can teach us about complex spatial
dynamics. Environment and Planning A, 20(1), 99 – 109.
Qian Zhang TRITA SoM 2009-10
34
Deng, J.S. et al., 2009. Spatio-temporal dynamics and evolution of land use change and landscape
pattern in response to rapid urbanization. Landscape and Urban Planning, 92(3-4), 187-198. Furberg, D. & Ban, Y., 2009. Satellite monitoring and impact assessment of urban growth in
Stockholm, Sweden between 1986 and 2006. In 29th Annual EARSel Symposium. Chania, Greece.
Furberg, D. & Ban, Y., 2008. Satellite monitoring of urban sprawl and assessing the impact of land
cover changes in the Greater Toronto Area. In The International Archives of the Photogrammetry, Remote Sensing and Spatial Information Sciences. Vol. XXXVII. Part B8. Beijing 2008. Beijing, China, pp. 131-136.
Geoghegan, J., Wainger, L.A. & Bockstael, N.E., 1997. Spatial landscape indices in a hedonic
framework: an ecological economics analysis using GIS. Ecological Economics, 23(3), 251-264. Grimm, N.B. et al., 2008. Global Change and the Ecology of Cities. Science, 319(5864), 756-760. Hagoort, M., Geertman, S. & Ottens, H., 2008. Spatial externalities, neighbourhood rules and CA
land-use modelling. Annals of Regional Science, 42(1), 39-56. Han, J. et al., 2009. Application of an integrated system dynamics and cellular automata model for
urban growth assessment: A case study of Shanghai, China. Landscape and Urban Planning, 91(3), 133-141.
He, C. et al., 2006. Modeling urban expansion scenarios by coupling cellular automata model and
system dynamic model in Beijing, China. Applied Geography, 26(3-4), 323-345. Herold, M. et al., 2006. Urban patterns and processes: A remote snesing perspective. In 1st EARSeL
Workshop of the SIG Urban Remote Sensing. Humboldt-Universität zu Berlin, Germany. Herold, M., Couclelis, H. & Clarke, K.C., 2005. The role of spatial metrics in the analysis and
modeling of urban land use change. Computers, Environment and Urban Systems, 29(4), 369-399. Herold, M., Goldstein, N.C. & Clarke, K.C., 2003. The spatiotemporal form of urban growth:
measurement, analysis and modeling. Remote Sensing of Environment, 86(3), 286-302. Herold, M., Scepan, J. & Clarke, K.C., 2002. The use of remote sensing and landscape metrics to
describe structures and changes in urban land uses. Environment and Planning A, 34(8), 1443 – 1458.
Houet, T. & Hubert-Moy, L., 2006. Modelling and projecting land-use and land-cover changes with a
Cellular Automaton in considering landscape trajectories: An improvement for simulation of plausible future states. EARSeL eProceedings, 5(1), 63-76.
Ito, A., 2005. Modelling of carbon cycle and fire regime in an east Siberian larch forest. Ecological
Modelling, 187(2-3), 121-139. Jelinski, D. & Wu, J., 1996. The modifiable areal unit problem and implications for landscape
ecology. Landscape Ecology, 11(3), 129-140. Jensen, J.R., 2005. Introductory Digital Image Processing A Remote Sensing Perspective 3rd ed., Prentice Hall.
Spatial-Temporal Patterns of Urban Growth in Shanghai, China: Monitoring, Analysis, and Simulation
35
Ji, W. et al., 2006. Characterizing urban sprawl using multi-stage remote sensing images and landscape metrics. Computers, Environment and Urban Systems, 30(6), 861-879.
Jiao, J., 2003. Transition rule elicitation for urban cellular automata models : Case study, Wuhan, China. ,
International Institute for Geo-Information Science and Earth Observation. Enschede, the Nertherland.
Johnson, M.P., 2001. Environmental impacts of urban sprawl: a survey of the literature and proposed
research agenda. Environment and Planning A, 33(4), 717 – 735. Klosterman, R.E., 1999. The What if? collaborative planning support system. Environment and Planning
B: Planning and Design, 26(3), 393 – 408. Lambin, E.F., 2004. Modeling land-use change. In Environmental Modelling: Finding Simplicity in
Complexity Edited by John Wainwright & Mark Mulligan. John Wiley & Sons Inc , p. 430. Lett, C., Silber, C. & Barret, N., 1999. Comparison of a cellular automata network and an individual-
based model for the simulation of forest dynamics. Ecological Modelling, 121(2-3), 277-293. Li, H. & Wu, J., 2004. Use and misuse of landscape indices. Landscape Ecology, 19(4), 389-399. Li, J., 2007. The evolution of urban landscape pattern and its impact on ecological security in
Shanghai. PhD thesis. Fudan University (in Chinese). Li, X. & Yeh, A.G., 2004. Analyzing spatial restructuring of land use patterns in a fast growing region
using remote sensing and GIS. Landscape and Urban Planning, 69(4), 335-354. Li, X. & Yeh, A.G., 2001. Calibration of cellular automata by using neural networks for the
simulation of complex urban systems. Environment and Planning A, 33(8), 1445 – 1462. Li, X. & Yeh, A.G., 2002. Neural-network-based cellular automata for simulating multiple land use
changes using GIS - PB - Taylor & Francis. International Journal of Geographical Information Science, 16(4), 323.
Liu, J., Liu, M. et al., 2005a. Spatial and temporal patterns of China's cropland during 1990-2000: An
analysis based on Landsat TM data. Remote Sensing of Environment, 98(4), 442-456. Liu, J., Tian, H. et al., 2005b. China's changing landscape during the 1990s: Large-scale land
transformations estimated with satellite data. Geophysical Research Letters, 32, L02405. Liu, X. et al., 2008. Simulating complex urban development using kernel-based non-linear cellular
automata. Ecological Modelling, 211(1-2), 169-181. Lu, D. et al., 2004. Change detection techniques. International Journal of Remote Sensing, 25(12), 2365. Luck, M. & Wu, J., 2002. A gradient analysis of urban landscape pattern: a case study from the
Phoenix metropolitan region, Arizona, USA. Landscape Ecology, 17(4), 327-339. Luo, P. et al., 2002. The study on extended cellular automata based on relational database and the
spatio - temporal simulating (In Chinese). Geography and Territorial Research, 18(3), 8-12.
Qian Zhang TRITA SoM 2009-10
36
Madhavan, B.B. et al., 2001. Appraising the anatomy and spatial growth of the Bangkok Metropolitan area using a vegetation-impervious-soil model through remote sensing. International Journal of Remote Sensing, 22(5), 789.
Matsinos, Y.G. & Troumbis, A.Y., 2002. Modeling competition, dispersal and effects of disturbance
in the dynamics of a grassland community using a cellular automaton model. Ecological Modelling, 149(1-2), 71-83.
Morley, P.D. & Chang, J., 2004. Critical behavior in cellular automata animal disease transmission
model. International Journal of Modern Physics C, 15(1), 149-162. Normile, D., 2008. China's living laboratory in urbanization. Science (New York), 319(5864), 740-743. O'Neill, R.V. et al., 1988. Indices of landscape pattern. Landscape Ecology, 1(3), 153-162. O'Sullivan, D. & M.Torrens, P., 2000. Cellular models of urban systems, Centre for Advanced Spatial
Analysis University College London. Available at: http://www.casa.ucl.ac.uk/cellularmodels.pdf.
Phinn, S. et al., 2002. Monitoring the composition of urban environments based on the vegetation-
impervious surface-soil (VIS) model by subpixel analysis techniques. International Journal of Remote Sensing, 23(20), 4131.
Poska, A. et al., 2008. Using quantitative pollen-based land-cover estimations and a spatial
CA_Markov model to reconstruct the development of cultural landscape at Rõuge, South Estonia. Vegetation History and Archaeobotany, 17(5), 527-541.
Ren, W. et al., 2003. Urbanization, land use, and water quality in Shanghai: 1947-1996. Environment
International, 29(5), 649-659. Ridd, M.K., 1995. Exploring a V-I-S (vegetation-impervious surface-soil) model for urban ecosystem
analysis through remote sensing: comparative anatomy for cities†. International Journal of Remote Sensing, 16(12), 2165.
Setiawan, H., Mathieu, R. & Thompson-Fawcett, M., 2006. Assessing the applicability of the V-I-S
model to map urban land use in the developing world: Case study of Yogyakarta, Indonesia. Computers, Environment and Urban Systems, 30(4), 503-522.
Seto, K.C. et al., 2002. Monitoring land-use change in the Pearl River Delta using Landsat TM.
International Journal of Remote Sensing, 23(10), 1985. Seto, K.C. & Fragkias, M., 2005. Quantifying Spatiotemporal Patterns of Urban Land-use Change in
Four Cities of China with Time Series Landscape Metrics. Landscape Ecology, 20(7), 871-888. Shanghai Academy of Sciences, 1999. The Plants of Shanghai, volume 1-The flora, Shanghai Scientific &
Technical Publishers. Shanghai Municipal Statistics Bureau , 2008. Shanghai Statistical Yearbook 2008, China Statistics Press. Shao, G. & Wu, J., 2008. On the accuracy of landscape pattern analysis using remote sensing data.
Landscape Ecology, 23(5), 505-511.
Spatial-Temporal Patterns of Urban Growth in Shanghai, China: Monitoring, Analysis, and Simulation
37
Shen, Q. et al., 2009. A system dynamics model for the sustainable land use planning and development. Habitat International, 33(1), 15-25.
Soares-Filho, B.S., Coutinho Cerqueira, G. & Lopes Pennachin, C., 2002. DINAMICA-a stochastic
cellular automata model designed to simulate the landscape dynamics in an Amazonian colonization frontier. Ecological Modelling, 154(3), 217-235.
Solecki, W.D. & Oliveri, C., 2004. Downscaling climate change scenarios in an urban land use change
model. Journal of Environmental Management, 72(1-2), 105-115. Sudhira, H.S., Ramachandra, T.V. & Jagadish, K.S., 2004. Urban sprawl: metrics, dynamics and
modelling using GIS. International Journal of Applied Earth Observation and Geoinformation, 5(1), 29-39.
Sun, H., Forsythe, W. & Waters, N., 2007. Modeling Urban Land Use Change and Urban Sprawl:
Calgary, Alberta, Canada. Networks and Spatial Economics, 7(4), 353-376. Tang, J., Wang, L. & Yao, Z., 2008. Analyses of urban landscape dynamics using multi-temporal
satellite images: A comparison of two petroleum-oriented cities. Landscape and Urban Planning, 87(4), 269-278.
United Nations, 2008. World urbanization prospects: the 2007 revision. Highlights, New York: Population
Division, Department of Economic and Social Affairs, United Nations. Available at: http://www.un.org/esa/population/publications/wup2007/2007WUP_Highlights_web.pdf.
Ward, D., Phinn, S.R. & Murray, A.T., 2000. Monitoring growth in rapidly urbanizing areas using
remotely sensed data. Professional Geographer, 52(3), 371-386. Weng, Q. & Lu, D., 2009. Landscape as a continuum: an examination of the urban landscape
structures and dynamics of Indianapolis City, 1991–2000, by using satellite images. International Journal of Remote Sensing, 30(10), 2547.
Weng, Y., 2007. Spatiotemporal changes of landscape pattern in response to urbanization. Landscape
and Urban Planning, 81(4), 341-353. White, R. & Engelen, G., 2000. High-resolution integrated modelling of the spatial dynamics of
urban and regional systems. Computers, Environment and Urban Systems, 24(5), 383-400. World Watch Institute, 2006. State of the World 2006: Special Focus: China and India, New York: W.W.
Norton &. Company Ltd. Wu & Webster, 1998. Simulation of land development through the integration of cellular automata
and multicriteria evaluation. Environment and Planning B: Planning and Design, 25(1), 103 – 126. Wu, J., 2004. Effects of changing scale on landscape pattern analysis: scaling relations. Landscape
Ecology, 19(2), 125-138. Wu, J., 2006. Landscape Ecology, Cross-disciplinarity, and Sustainability Science. Landscape Ecology,
21(1), 1-4. Wu, J. et al., 2002. Empirical patterns of the effects of changing scale on landscape metrics. Landscape
Ecology, 17(8), 761-782.
Qian Zhang TRITA SoM 2009-10
38
Yang, Q. & Li, X., 2006. Dynamic constrained CA model for simulating complex urban systems (In Chinese). Geography and Geo-Information Science, 22(5), 10-15.
Yassemi, S., Dragicevic, S. & Schmidt, M., 2008. Design and implementation of an integrated GIS-
based cellular automata model to characterize forest fire behaviour. Ecological Modelling, 210(1-2), 71-84.
York, A.M. et al., 2009. Landscape fragmentation under rapid urbanization. UGEC Viewpoints, 2, 20-
24. Zhang, L. et al., 2004. RETRACTED: A GIS-based gradient analysis of urban landscape pattern of
Shanghai metropolitan area, China. Landscape and Urban Planning, 69(1), 1-16. Zhang, Y., Chen, Y. & Li, J., 2008. Study on the dynamic city model based on cellular automata and
population condition (In Chinese). Journal of Image and Graphics, 12(8), 1483-1488. Zhu, M. et al., 2006. The effects of sensor spatial resolution and changing grain size on
fragmentation indices in urban landscape. International Journal of Remote Sensing, 27(21), 4791.