spatial variability of chemical pedoindicators in haplic ... · 1251 current management systems...
TRANSCRIPT

1250
AJCS 12(08):1250-1258 (2018) ISSN:1835-2707 doi: 10.21475/ajcs.18.12.08.PNE963
Spatial variability of chemical pedoindicators in Haplic Inceptisol under different management systems in southern Amazonas state, Brazil Ivanildo Amorim de Oliveira1, Milton César Costa Campos2*, Renato Eleotério de Aquino3, Ludmila de Freitas1, Zigomar Menezes de Souza4, José Maurício da Cunha2, Marcelo Dayron Rodrigues Soares2, Douglas Marcelo Pinheiro da Silva2, Julimar da Silva Fonseca2, Laércio Santos Silva3, Fernando Gomes de Souza2 1Instituto Federal de Educação, Ciência e Tecnologia do Pará, Antônio Fulgêncio da Silva, S/N, Parque Universitário – CEP: 68.800-000 Breves, PA, Brazil 2Universidade Federal do Amazonas, Instituto de Educação, Agricultura e Ambiente, Rua 29 de agosto, 786, Centro, CEP 69800-000 Humaitá, AM, Brazil 3Faculdade de Ciências Agrárias e Veterinárias, Universidade Estadual “Júlio de Mesquita Filho”, Via de Acesso Prof. Paulo Donato Castellane, S/N, 14884-900, Jaboticabal, São Paulo, Brazil 4Universidade Estadual de Campinas, Departamento de Água e Solo, Avenida Cândido Rondon, 501, Cidade Universitária Zeferino Vaz, Barão Geraldo, CEP 13083-875 Campinas, SP, Brazil *Corresponding author: [email protected] Abstract Inceptisols are poorly developed soils with original material characteristics and high or low base saturation depending on the environment in which they developed. This study aimed to evaluate the spatial variability of chemical pedoindicators in an Inceptisol under different management systems. The study was carried out in three agricultural areas cultivated with cassava, sugarcane and an agroforestry system, with cultivation time of 15, 8 and 17 years, respectively. All the areas investigated were located in Southern Amazonas state, Brazil. In these areas, a square mesh was established measuring 70.00 x 70.00 m, with cross points spaced 10.00 m apart and a total of 64 sampling points in each grid. Soil samples were then collected at a depth between 0.00 and 0.10 m to determine organic matter, pH, calcium, magnesium, potassium, available phosphorus, potential acidity, sum of bases, cation exchange capacity and base saturation, in addition to magnetic susceptibility in all the samples, using 10 cm
3 of soil.
Data were analyzed using multivariate, descriptive and geostatistics. It was found that magnetic susceptibility may be a pedoindicador for areas under cassava cultivation, potential acidity for the agroforestry environment, and pH for areas under sugarcane cultivation. The agroforestry area had higher data heterogeneity, since a nugget effect was encountered for all the properties analyzed. Based on the scaled semivariograms, the lower range values indicate greater spatial variability in the sugarcane and agroforestry systems, due to the specificities of the management system. Keywords: geostatistics, scaled semivariogram, principal component analysis. Introduction The absence or reduction of soil disturbance may lead to surface accumulation of nutrients (Merten and Mielniczuk 1991), due to organic waste deposition on the surface, as well as the fertilizer application mode and low degree of fertilizer mixture (Pereira et al., 2009). However, native vegetation renewal for cropping systems can cause significant changes in soil chemical properties, in the first year of implementation (Lourente et al., 2011). In this context, the most common cropping systems in the Amazon region, such as cassava (Manihot esculenta), are generally small-scale; however, their cultivation plays an important role, both as a food source and job and income generator (Schons et al., 2009). On the other hand, sugarcane is socially and economically important in the
ethanol and sugar chains, as well as in generating direct and indirect jobs (Marçal, 2009) in small molasses, brown sugar, brandy and forage feed companies. Moreover, agroforestry environments are a common form of land use in the region, in which perennial woody species (shrubs and trees) are planted with agricultural and/or livestock breeding, in order to provide environmental, socioeconomic and cultural sustainability (MacDicken and Vergara, 1990). A number of no-tillage systems have had a positive effect on soil organic matter content and quality, reflecting directly or indirectly on soil chemical characteristics (Frazão et al., 2008). On the other hand, spatial distribution of these properties in natural and transformed areas is extremely important, because soil formation processes over time and

1251
current management systems emphasize these property variations (Cavalcante et al., 2007). Understanding them is critical to establishing management practices and evaluating the environmental effects (Cambardella et al., 1994). In order to adopt adequate management practices, magnetic susceptibility (MS) has been widely used in discriminating soil and plant properties (Marques JR et al., 2014). Siqueira et al. (2010a) found positive correlations between organic matter and clay content, cation exchange capacity, phosphorus adsorption capacity and hematite content, indicating its use in estimating these soil properties in a pedotransfer study. In sugarcane areas, Peluco et al. (2013) reported that SM exhibits a linear spatial correlation with the recommended doses of vinasse and the capacity of soil to withstand vinasse application. Peluco et al. (2015) mapped areas with different phosphorus adsorption potentials in soil under sugarcane cultivation and natural fertility conditions. These studies reveal the potential use of this technique in strategic management planning in agricultural production environments, indicating possible changes in soil chemical quality and demonstrating why the aforementioned authors consider MS an important pedoindicator. In this respect, geostatistical techniques are used to study the spatial variability of soil and plant properties (Zanão Junior et al., 2007; Marins et al., 2008; Vieira et al., 2011; Campos et al., 2012a, 2013; Bottega et al., 2013; Camargo et al., 2013). However, a previously planned sample collection is required and the exact spatial location of each sample point must be recorded (Montanari et al., 2012). Thus, a number of studies applying geostatistical techniques have been conducted to determine the spatial variability of soil properties (Siqueira et al., 2010), using a scaled semivariogram (Aquino et al., 2014; Oliveira et al., 2014) with Sanos software to help in sample planning (Montanari et al., 2012). Nevertheless, few studies on this issue have been performed in the Amazon region, despite being of paramount importance in mapping soil spatial variability and the use of alternative techniques to estimate soil properties, making it possible to exploit the local potential for crop production. Thus, we hypothesized that management systems, such as cassava, sugarcane and agroforestry, may cause changes in the spatial distribution and chemical quality of Inceptisols in the Amazon region. As such, the aim of this study was to use scaled semivariograms to evaluate the spatial variability of chemical pedoindicators of a Haplic Inceptisol under different management systems in Humaitá County, Amazonas state (AM), Brazil. Results and Discussion Influence of crop management on soil chemical quality The mean test values of chemical properties demonstrated differences between the environments under study (Table 1). H+Al, P, and CEC were higher for the agroforestry area, while pH in water was lower compared to cassava and sugarcane fields, which show poor soil fertility. For agroforestry, the low pH in water is likely due to intense leaching, since the region has intense rainfall and good drainage conditions (Campos et al., 2010-2012b). The H+Al ratio in clayey soils derives from OM decomposition and
crop waste, showing the smallest OM contents in the agroforestry environment. OM decomposition releases organic compounds onto the soil surface, forming water-soluble organic complexes of Ca and Mg with organic binders (Miyazawa et al., 1993), which facilitates cation percolation through the soil profile (Franchini et al., 1999), resulting in soil acidification. Higher pH, OM, Ca, Mg, BS and V% values were observed in the sugarcane field. The amount of liming and fertilizer application contributed to increasing base content. In addition, these values were influenced by plant residue management at harvest, as well as industrial organic waste applied to the crop, such as filter cake and vinasse, which increases OM levels in the soil (Ribeiro and Pesquero, 2010). However, in the cassava crop, only K showed higher content than in sugarcane, with values similar to those found in agroforestry. Moreover, MS was greater in the cassava field, followed by sugarcane, which might be related to the high clay content in both areas. Based on variations in chemical properties between management systems, we performed factor analysis (Table 2). This procedure helped select properties with higher factor loading, as determined by the varimax method, whereby the properties that exhibit discriminatory power compatible with the management systems under study can be established. These attributes could be considered potential indicators of environmental changes. These studies are required for areas with high environmental sensitivity, such as those found in the deforestation arc of Southern Amazonas. The first two factors explained 79.3% of total variance, and OM, P and K did not have high factor loading. The pH, H+Al, Ca, Mg, BS, CEC and SB were the most relevant properties for Factor 1, explaining 66.42% of total variance, while MS is related to Factor 2, which explained 12.88% of the variance. Principal component analysis (PCA) was performed using high discriminatory power variables (Figure 1). The PCA explained 96.07% of the total variance in the first two components (PC1 and PC2) of the selected data. Furthermore, it was possible to evaluate interactions between properties and the management system. MS is directly related to cassava management, and CEC and H+Al with the agroforestry area. BS, V%, Ca, Mg and pH are related to the sugarcane area, which accounted for continuous lime and fertilizer applications, contributing to higher base contents. This indicates that these properties may be the most sensitive to change and, therefore, better able to reflect local balance alterations than other properties. sAs such, they can be considered indicators of environmental changes. SM was indicated for cassava management because this area has higher clay content, when compared to other locations (Figure 1). According to Siqueira et al. (2010), there is a positive relationship between clay content and MS, given that it is an intrinsic soil characteristic and reflects soil mineralogy. With respect to sugarcane, BS, V%, Ca, Mg and pH occur due to the continuous application of limestone and fertilizers that contribute to an increase in base content. In cassava, CEC and H + Al are linked to organic matter and plant waste decomposition, which forms water-soluble organic complexes of Ca and Mg with organic binders (Miyazawa et al., 1993), facilitating cation leaching along the soil profile.

1252
Table 1. Mean test values of chemical properties at a depth of 0.00-0.10 m in the management systems studied in Humaitá County – AM, Brazil.
Parameters Chemical properties
pH H+Al OM P K Ca Mg SB CEC V MS
H2O cmolcdm-3
g dm-3
mg dm-3
------------------cmolcdm-3
------------------ % 10-8
m3 kg
-1
Cassava Mean 3.9b 15.77b 27.69b 6.03b 0.14a 0.23b 0.13b 0.51b 16.2b 3.26b 56.53a
Agroforestry Mean 3.8 c 18.95a 20.58c 8.19a 0.11a 0.23b 0.13b 0.48b 19.43a 2.52b 20.73b
Sugarcane Mean 4.4a 8.96c 30.48a 6.36b 0.05b 0.14a 0.81a 2.31a 11.27c 21.06a 5.78c
* Means followed by the same uppercase letter in the column do not differ statistically according to Tukey’s test at 5% probability; H+Al = potential acidity; OM = organic
matter; P = phosphorus; K = potassium; Ca = calcium; Mg = magnesium; SB = sum of bases; CEC = cation exchange capacity; V = base saturation
S SSSS
SS
S
S
SSS S
S
S
SS
S
S
S
S
S
SSSSS S
S
SS SSS S
S
SS
SS
SSSSS
SSSS
S
S
S
SSSS
S S
S
S
S
S SS
A AA
AA
AA
A
A
AAA
AA
A
A
A
A AA
A AA
A
A
A AAA
A
A
A
A
A
A
A
AA
A AAAA
AA
AA
A
AA
A
AA
A
AAAA A
AA
AA
A
C
C
C
C
C
CC
C
CC
CCC CC
C
C C C
C
C
C
C
C
C
C
C
C
C
CCC
CC
C
C
C
C
CC
C
C CC
C C
C
C
C
C
CCCC
C C
C
C CC
CC
C
C
-4 -3 -2 -1 0 1 2 3 4-3
-2
-1
0
1
2
3
PC 1: 84.64 %
PC
2:
11
.43
%
MS
BSCa Mg
V%
pH
CEC
H+Al
Fig 1. Principal component analysis (PCA) of chemical properties and magnetic susceptibility (SM) of the soil, with high discriminatory power of the areas under cultivation S = cane; C = cassava; A = agroforestry. H+Al = potential acidity; Ca = calcium; Mg = magnesium; SB = sum of bases; CEC = cation exchange capacity; V = base saturation. Table 2. Factors extracted by principal component analysis, emphasizing the chemical properties of factor loading above 0.7 (module) for the management systems in Humaitá – AM, Brazil.
Variables Factor 1 Factor 2
pH H2O 0.983813 0.035209 Potential acidity -0.956561 0.103229 Organic matter 0.574255 -0.163449 Phosphorus -0.363696 0.678398 Potassium -0.374322 -0.462004 Calcium 0.959594 0.233058 Magnesium 0.935195 0.224003 Sum of bases 0.955261 0.201596 Cation exchange capacity -0.915057 0.175811 Base saturation 0.969095 0.168662 Magnetic susceptibility -0.483930 -0.776340
Eigenvalues 7.306691 1.416438 % Total variance 66.42447 12.87671 Cumulative eigenvalue 7.306691 8.723129 % Cumulative 66.42447 79.30118

1253
Fig 2. Scaled semivariograms adjusted to the soil chemical properties with highdiscriminatory power for the management systems evaluated in Humaitá - AM, Brazil. Sph. = spherical; [model (nugget effect - variance – DSD - R
2 – range)]. DSD= degree of spatial
dependence; R2 = coefficient of determination.
Table 3. Descriptive statistics of soil chemical properties with high discriminatory power for the management systems studied in Humaitá County – AM, Brazil.
Parameters Chemical properties
pH H+Al Ca Mg SB CEC V MS
Cassava
Mean 3.91 157.69 2.38 1.39 5.16 162.85 3.26 56.53 Median 3.90 150.00 2.00 1.00 4.40 156.40 2.79 53.50 SD 0.06 16.10 0.52 1.06 2.00 15.08 1.58 10.68 Variance 0.00 259.23 0.27 1.13 3.99 227.49 2.49 114.09 CV 1.53 10.21 21.87 76.47 38.69 9.26 48.19 19.00 skewness 0.77 0.02 0.88 6.02 3.31 0.21 3.62 1.62 d 0.39* 0.25* 0.41* 0.36* 0.23* 0.20* 0.21* 0.14*
Agroforestry
Mean 3.78 189.52 2.39 1.36 4.86 194.37 2.52 20.73 Median 3.80 185.00 2.00 1.00 4.15 191.40 2.20 20.00 SD 0.06 17.54 0.55 0.48 1.15 17.45 0.66 6.23 Variance 0.00 307.78 0.31 0.23 1.33 304.44 0.44 38.77 CV 1.53 9.26 23.11 35.58 23.73 8.98 26.24 30.00 skewness -0.48 -0.51 1.03 0.60 0.67 -0.51 0.75 1.06 d 0.06
ns 0.05
ns 0.09
ns 0.10
ns 0.28* 0.24* 0.18* 0.12*
Sugarcane
Mean 4.43 89.64 14.58 8.06 23.13 112.77 21.06 5.78 Median 4.50 80.00 15.00 8.00 23.30 107.50 21.6 5.00 SD 0.15 21.09 4.17 2.84 6.92 18.35 6.83 3.80 Variance 0.02 444.68 17.42 8.06 47.85 336.85 46.70 14.43 CV 3.39 23.52 28.63 35.21 29.90 16.27 32.44 66.00 skewness -0.85 2.96 0.07 0.75 0.33 3.30 -0.12 3.23 d 0.05
ns 0.15* 0.03
ns 0.07
ns 0.06
ns 0.19* 0.05* 0.25*
SD = standard deviation; CV = coefficient of variation; d = normality test, *significant according to the Kolmogorov-Smirnov test. H+Al = potential acidity; Ca = calcium; Mg = magnesium; SB = sum of bases; CEC = cation exchange capacity; V% = base saturation; MS= magnetic susceptibility; *= significant; ns= non-significant.
1254
Soil with cassava
0 250 500 1000 km
Amazonas State
Soil with sugarcane
Soil with agroforestry
Southern Amazonas
Alt
itu
de
(m)
70
72
0 75 150 300 km 0 75 150 300 km
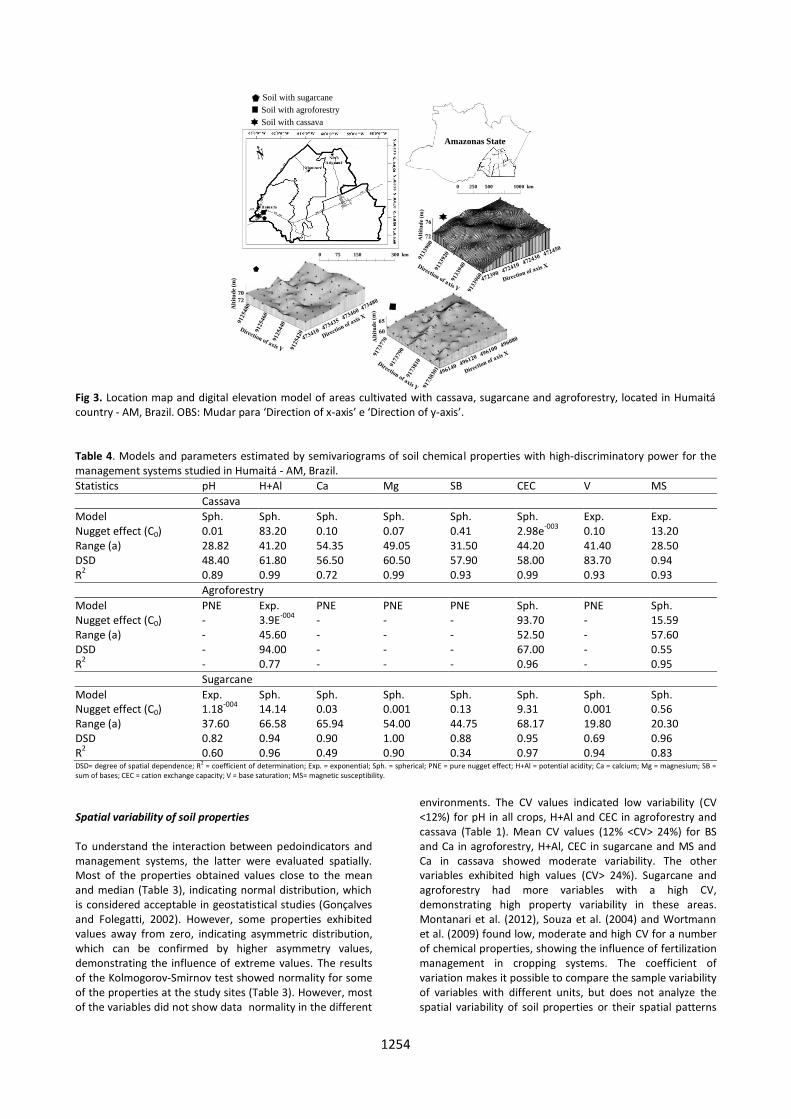
Fig 3. Location map and digital elevation model of areas cultivated with cassava, sugarcane and agroforestry, located in Humaitá country - AM, Brazil. OBS: Mudar para ‘Direction of x-axis’ e ‘Direction of y-axis’.
Table 4. Models and parameters estimated by semivariograms of soil chemical properties with high-discriminatory power for the management systems studied in Humaitá - AM, Brazil.
Statistics pH H+Al Ca Mg SB CEC V MS
Cassava
Model Sph. Sph. Sph. Sph. Sph. Sph. Exp. Exp. Nugget effect (C0) 0.01 83.20 0.10 0.07 0.41 2.98e
-003 0.10 13.20
Range (a) 28.82 41.20 54.35 49.05 31.50 44.20 41.40 28.50 DSD 48.40 61.80 56.50 60.50 57.90 58.00 83.70 0.94 R
2 0.89 0.99 0.72 0.99 0.93 0.99 0.93 0.93
Agroforestry
Model PNE Exp. PNE PNE PNE Sph. PNE Sph. Nugget effect (C0) - 3.9E
-004 - - - 93.70 - 15.59
Range (a) - 45.60 - - - 52.50 - 57.60 DSD - 94.00 - - - 67.00 - 0.55 R
2 - 0.77 - - - 0.96 - 0.95
Sugarcane
Model Exp. Sph. Sph. Sph. Sph. Sph. Sph. Sph. Nugget effect (C0) 1.18
-004 14.14 0.03 0.001 0.13 9.31 0.001 0.56
Range (a) 37.60 66.58 65.94 54.00 44.75 68.17 19.80 20.30 DSD 0.82 0.94 0.90 1.00 0.88 0.95 0.69 0.96 R
2 0.60 0.96 0.49 0.90 0.34 0.97 0.94 0.83
DSD= degree of spatial dependence; R2 = coefficient of determination; Exp. = exponential; Sph. = spherical; PNE = pure nugget effect; H+Al = potential acidity; Ca = calcium; Mg = magnesium; SB = sum of bases; CEC = cation exchange capacity; V = base saturation; MS= magnetic susceptibility.
Spatial variability of soil properties To understand the interaction between pedoindicators and management systems, the latter were evaluated spatially. Most of the properties obtained values close to the mean and median (Table 3), indicating normal distribution, which is considered acceptable in geostatistical studies (Gonçalves and Folegatti, 2002). However, some properties exhibited values away from zero, indicating asymmetric distribution, which can be confirmed by higher asymmetry values, demonstrating the influence of extreme values. The results of the Kolmogorov-Smirnov test showed normality for some of the properties at the study sites (Table 3). However, most of the variables did not show data normality in the different
environments. The CV values indicated low variability (CV <12%) for pH in all crops, H+Al and CEC in agroforestry and cassava (Table 1). Mean CV values (12% <CV> 24%) for BS and Ca in agroforestry, H+Al, CEC in sugarcane and MS and Ca in cassava showed moderate variability. The other variables exhibited high values (CV> 24%). Sugarcane and agroforestry had more variables with a high CV, demonstrating high property variability in these areas. Montanari et al. (2012), Souza et al. (2004) and Wortmann et al. (2009) found low, moderate and high CV for a number of chemical properties, showing the influence of fertilization management in cropping systems. The coefficient of variation makes it possible to compare the sample variability of variables with different units, but does not analyze the spatial variability of soil properties or their spatial patterns

1255
(Camargo et al., 2008). To that end, data with high discriminatory power underwent geostatistical analysis, showing spatial dependence, which is expressed by adjusted semivariograms (Table 4). The spherical model was predominant for the study areas. However, the exponential model was adjusted in cassava for V% and MS; in agroforestry for H+Al, and in sugarcane for pH. This same trend was detected for scaled semivariograms (Figure 2). Models fit to the variables describe property behavior, since, as stated by Isaaks and Srivastava (1989), exponential models are best fitted to small-scale erratic phenomena, while their spherical counterparts describe properties with high spatial continuity, or less erratic on a small-scale, i.e., value transition is less abrupt. According to Carvalho et al. (2002), the spherical model is prevalent in soil sciences. On the other hand, McBratney and Webster (1983), Bertolani and Vieira (2001) and Siqueira et al. (2010) highlight spherical and exponential models as the most widely used in soil and environmental sciences. Some properties showed no spatial dependence, characterized by the pure nugget effect (PNE), mainly for the agroforestry area (Table 4 and Figure 2). When the variable is spatially independent, C0 (nugget effect) is equal to C1+C0 (sill). The PNE may occur due to measurement errors, sampling errors, or non-detected micro variations, considering the sampling space greater than needed to detect spatial dependence (Cambardella et al., 1994; Zanão Júnior et al., 2010). The degree of spatial dependence (DSD) for individual semivariograms, expressed by the ratio between the nugget effect (C0) and sill (C0 + C) (Cambardella et al., 1994), was classified as moderate for almost all the properties in all the environments (Table 4 and Figure 2). For scaled semivariograms, the variables also showed moderate DSD, possibly due to soil homogeneity. The range of semivariograms for individual and scaled properties showed that the sugarcane area has lower spatial dependence and greater variability, with range values of 23 m. In this respect, range is an important measure in planning and experimental evaluation, since it may help establish sampling procedures (McBratney and Webster 1983; Souza et al., 2009). The characteristics of the agroforestry area, an environment in the recovery process, differ from those of sugarcane and cassava cropping areas, because recovery time was not enough to obtain a new equilibrium (Oliveira et al., 2015). Thus, these results may be the basis for further research aimed at soil mapping, since these environments are representative of the region and few studies are being carried out in these areas. Materials and methods Study area description The study was conducted on three farms located in Humaitá County, Southern Amazonas state. The cassava crop area is situated at geographical coordinates 7º 49' 42" S latitude and 6º 15' 05" W longitude, at an average altitude of 71 m. The sugarcane crop lies at 7º 54' 38" S and 63º 14' 27" W, at an average altitude of 70 m. The agroforestry area is located at 7º 28' 29" S and 63º 02' 07" W, with an average altitude of 63 m (Figure 3). According to the Köppen classification
system, climate is classified as tropical rainy, with a short dry season (Am), temperatures ranging between 25 and 27 ºC, average annual rainfall of 2,500 mm, a rainy season between October and June, and relative air humidity between 85 and 90%. Soil source material comes from ancient alluvial sediments, which belong to the Holocene period (Brazil, 1978) and the soil was classified as Plinthic Alithic Haplic Cambisol (Inceptisol), with moderate, medium texture (CXalf) (EMBRAPA, 2013). Physical characterization of management systems can be found in Oliveira et al. (2013). Forest areas have two clearly distinct typologies: dense rainforest that evolved from a combination of climatic factors extremely favorable to the development of biological activities, such as abundance of light, water and temperature. On the other hand, open rainforest is characterized by the presence of widely spaced trees, allowing light to penetrate to the lower strata (Campos, 2009). In these areas, a regular square mesh measuring 70.00 x 70.00 m or approximately 0.49 ha, was established, where soil was sampled at cross points spaced 10.00-m apart, at a total of 64 points in each grid (Figure 1). These points were georeferenced by a Garmin Etrex GPS device (South American Datum - SAD 1969). Characterization of study areas Three areas under different cropping systems were selected in this region of the Amazon: a) Cassava: Area under 15 years of continuous cassava cultivation; received liming and fertilization; and harrowed in the second year of cultivation. The crop was in the fourth month of cultivation. In the last year before planting, harrowing was carried out to a depth between 0.00 and 0.40 m. b) Sugarcane: Area cultivated under sugarcane for over eight years, using manual harvesting after burning. In the last year, plants were cut and burned for crop renewal, and soil was harrowed, limed and fertilized once, according to crop needs. c) Agroforestry: Area under an agroforestry system for 17 years using Amazonian fruit species (cupuaçu, cacao, açaí, bacaba, mango etc.). Liming and fertilization had never been performed; it was managed with hand tools (hoes and scythes). Chemical analysis Soil samples were collected between May and June 2011. Deformed soil samples were collected at a depth of 0.00-0.10 m for chemical analysis. Analysis found amounts of exchangeable calcium (Ca), magnesium (Mg), potassium (K), available phosphorus (P) and potential acidity (H+Al), using a method developed by Raij et al. (2001). Based on the results, we calculated the sum of bases (SB), cation exchange capacity (CEC) and base saturation (V %). The pH was measured with a potentiometer at a 1:2.5 soil/water ratio (EMBRAPA, 2011). Total carbon was determined by the Walkley-Black method modified by Yoemans and Bremner (1988) and organic matter (OM) was estimated by organic carbon.

1256
Magnetic susceptibility Magnetic susceptibility (MS) was determined using fine air-dried soil samples (FADS) using a Bartington MS2 susceptibility meter coupled to a Bartington MS2B sensor. Evaluation was carried out at a low frequency (0.47 kHz) (Dearing, 1994). A single reading is indicated for the more accurate results (Bartington, 2013); this methodology was adopted in the present study. Statistical analysis Data were submitted to variance analysis (ANOVA), and means compared by Tukey’s test at 5% probability, using Minitab statistical software (Minitab, 2000). However, considering the multivariate structure of the data, multivariate statistical techniques were applied to establish chemical properties with discriminatory power and can be considered as potential indicators of environmental changes, and to check similarities between management systems in order to group them according to their chemical properties. Factors were analyzed to relate a set of variables to be explained to a limited number of new variables. We chose to use the principal component extraction (Jeffers, 1978), calculated from the correlation matrix between variables. To facilitate interpretation, we used the orthogonal varimax rotation method (Hoffmann, 1992). Factor analysis was complemented by principal component analysis (PCA) to obtain a smaller set of linear combinations of the selected variables to analyze factors that have maintained most of the information provided by the original variables (Silva et al., 2010). This analysis makes it possible to assess how properties interact qualitatively at the same time. Original values were normalized to a mean of zero and variance of one to determine the variables used in PCA. Components were selected according to their eigenvalues, which had to be above 1.00 and able to synthesize a cumulative variance above 70% (Hair et al., 2005). These data were used to establish the chemical properties considered potential pedoindicators for environmental changes. Based on the interaction between the chemistry and the management systems under study, these data underwent exploratory analysis, calculating mean, median, standard deviation, variance, coefficient of variation (CV), skewness and Kolmogorov-Smirnov test for normality. The coefficient of variation (CV%) was calculated based on Warrick and Nielsen (1980), who classified CV as low (<12%), medium (from 12 to 24%) and high (> 24%). Geostatistical Analysis Spatial dependence was determined by modeling semivariograms using geostatistical analysis (Isaaks and Srivastava 1989). Under the theory of intrinsic hypothesis, Equation 1 estimated the experimental semivariogram:
)(
1
2^
)()()(2
1)(
hN
i
ii hxZxZhN
h
(1) where γ(h) is the semivariance value for a distance h; N(h) the number of pairs involved in semivariance calculation;
Z(xi) the Z attribute value at point xi; Z(xi+h) - Z attribute value separated by distance h from point xi. A scaled semivariogram was built based on experimental semivariogram parameters of soil attributes. The experimental semivariogram was scaled dividing semivariances by statistical variance (Isaaks and Srivastava 1989). In the present study, semivariograms were scaled to reduce them into a same scale, facilitating comparison between the results of different variables. Furthermore, several semivariograms were analyzed simultaneously to better understand similarity standards and the causes of spatial variability (Ceddia et al., 2009). The spherical (Equation 2) and exponential (Equation 3) models were fit to the experimental scaled semivariograms, identified in the figures as Sph. / Exp. (C0 - C1 -[(C0/(C0+C1)] - R
2- a):
ahseCCh
ahsea
h
a
hCCh
,)(ˆ
0,2
1
2
3)(ˆ
10
3
10
(2)
0,)3
exp(1)( 10
h
a
hCCh
(3) Where C0 = nugget effect; C0 + C1 = sill; h = distance between two observations; a = range of spatial dependence. The nugget effect represents unexplained variability, considering the sampling distance used (Vieira, 2000). We used the classification developed by Cambardella et al. (1994) to analyze the degree of spatial dependence (DSD) of the study variables, in which [(C0/(C0+C1)*100] values lower than 25% are considered strong, between 25 and 75% moderate, and greater than 75% weak. Conclusion Magnetic susceptibility can be a pedoindicator for cassava crop areas, while potential acidity and pH serve this function in agroforestry environments and sugarcane fields, respectively. The agroforestry environment displayed greater data heterogeneity, with a pure nugget effect for almost all the properties assessed. Based on the scaled semivariogram, sugarcane and agroforestry areas had higher data variability and lower range values. Acknowledgments The authors would like to thank the Research Support Foundation of Amazonas State (FAPEAM), Department of Science and Technology of Amazonas State (SECTI-AM), and the Research Support Foundation of São Paulo State (FAPESP) for financial support. References Aquino RE, Campos MCC, Marques Júnior J, Oliveira IA,
Mantovaneli BC, Soares MDR (2014) Geoestatística na avaliação dos atributos físicos em Latossolo sob floresta nativa e pastagem na região de Manicoré, Amazonas. R Bras Ci Solo. 38:397-406.
Bartington (2013) Operation Manual for MS2 Magnetic Susceptibility System. Bartington Instruments., 71p. Available at:

1257
http://www.bartington.com/Literaturepdf/Operation%20 Manuals/om0408%20MS2.pdf. 24/01/2013.
Bertolan FC, Vieira SR (2001) Variabilidade espacial da taxa de infiltração de água e da espessura do horizonte A, em um Argissolo Vermelho-Amarelo, sob diferentes usos. R Bras Ci Solo. 25:987-995.
Bertolani FC, Vieira SR (2001) Variabilidade espacial da taxa de infiltração de água e da espessura do horizonte A, em um Argissolo Vermelho-Amarelo, sob diferentes usos. Revista Brasileira de Ciência do Solo, Viçosa. 25:987-995.
Bottega EL, Queiroz DM, Pinto FAC, Souza CMA (2013) Variabilidade espacial de atributos do solo em sistema de semeadura direta com rotação de culturas no cerrado brasileiro. R Ci Agronomica. 44:1-9.
Brasil (1978) Ministério das Minas e Energia. Projeto Radambrasil, folha SB. 20, Purus. Rio de Janeiro.
Camargo LA, Marques Júnior J, Pereira GT, Horvat RA (2008) Variabilidade espacial de atributos mineralógicos de um Latossolo sob diferentes formas do relevo. II - correlação espacial entre mineralogia e agregados. R Bras Ci Solo. 32:2279-2288.
Camargo LA, Marques Júnior J, Pereira GT (2013) Mineralogy of the clay fraction of alfisols in two slope curvatures. IV - Spatial correlation with physical properties. R Bras Ci Solo. 37:307-316.
Cambardella CA, Moorman TB, Novak JM, Parkin TB, Karlen DL, Turco R, Konopka AE (1994) Field-scale variability of soil properties in Central Iowa Soil. Soil Sci Soc Am J. 58:1501-1511.
Campos MCC, Aquino EA, Oliveira IA, Bergamin AC (2013) Variabilidade espacial da resistência mecânica do solo à penetração e umidade do solo em área cultivada com cana-de-açúcar na região de Humaitá, Amazonas, Brasil. Agrária. 8:305-310.
Campos MCC, Oliveira IA, Santos LAC, Aquino EA, Soares MDR (2012ª) Variabilidade espacial da resistência do solo à penetração e umidade em áreas cultivadas com mandioca na região de Humaitá, AM. R Agro@mbiente. 2012;6:9-16.
Campos MCC, Ribeiro MR, Souza Júnior VS, Ribeiro Filho MR, Almeida MC. 2012b. Topossequência de solos na transição Campos Naturais-Floresta na região de Humaitá, Amazonas. A Amazônica. 42:387-398.
Carvalho M, Soratto RP, Freddi OS (2002) Variabilidade espacial de atributos físicos em um LATOSSOLO VERMELHO Distrófico sob preparo convencional em Selvíria, Estado de Mato Grosso do Sul. A Scientiarum. 24:1353-1361.
Cavalcante EGS, Alves MC, Souza ZM, Pereira GT (2007) Variabilidade espacial de atributos químicos do solo sob diferentes usos e manejos. R Bras Ci Solo. 31:1329-1339.
Ceddia MB, Vieira SR, Villela ALO, Mota LS, Anjos LHC, Carvalho DF (2009) Topography and spatial variability of soil physical properties. Sci Agrícola. 66:338-352.
Empresa Brasileira de Pesquisa Agropecuária - Embrapa. (2011) Manual de métodos de análise de solo. Rio de Janeiro. Centro Nacional de Pesquisa de Solos.
Empresa Brasileira de Pesquisa Agropecuária - Embrapa. (2013) Sistema brasileiro de classificação de solos. 3. ed. Brasília: Embrapa Solos.
Franchini JC, Malavolta E, Miyazawa M, Pavan MA (1999) Alterações químicas em solos ácidos após a aplicação de resíduos vegetais. R Bras Ci Solo. 23:533-542.
Frazão LA, Píccolo MC, Feigl BJ, Cerri CC, Cerri CEP (2008) Propriedades químicas de um Neossolo Quartzarênico sob diferentes sistemas de manejo no Cerrado mato-grossense. Pesq Agropec Brasileira. 43:641-648.
Gonçalves ACA, Folegatti MV (2007) Correlação espacial entre retenção de água e textura do solo, para fins de manejo de irrigação. Eng Agrícola. 22(3):296–303.
Hair JR, Anderson RE, Tatham RL, Black WC (2005) Análise multivariada de dados. Bookman: Porto Alegre.
Hoffmann R (1992) Componentes principais e análise fatorial. (Departamento de Economia e Sociologia Rural. Escola Superior de Agricultura “Luiz de Queiroz”, Universidade de São Paulo: Piracicaba.
Isaaks EH, Srivastava RM (1989) An introduction to applied geoestatistics. New York: Oxford University Press.
Jeffers JNR (1978) An Introduction to System Analysis: with Ecological Applications. E. Arnold Publ.: London.
Lourente ERP, Mercante FM, Alovisi AMT, Gomes CF, Gasparini AS, Nunes CM (2011) Atributos microbiológicos, químicos e físicos de solo sob diferentes sistemas de manejo e condições de cerrado. Pesq Agropec Brasileira. 41:20-28.
Macdicken KG, Vergara NT (1990) Agroforestry: classificationand management. New York: John Wiley.
Marques JRJ, Siqueira DS, Camargo LA, Teixeira DDB, Barrón V, Torrent J (2014) Magnetic susceptibility and diffuse reflectance spectroscopy to characterize the spatial variability of soil properties in a Brazilian Haplustalf. Geoderma. 219‑220:63‑71.
Marçal CT (2009) Efeitos da cultura da cana-de-açúcar e seu manejo (uso de vinhaça e método de colheita) sobre a mesofauna do solo [dissertation]. Curitiba, PR: Universidade Federal do Paraná.
Marins AC, Uribe-Opazo MA, Johann JA (2008) Estimadores New1 e New2 no estudo de dependência espacial da produtividade da soja e atributos físicos do solo de uma área comercial. Eng Agricultura. 16:133-143.
Mcbratney AB, Webster R. 1983. How many observations are needed for regional estimation of soil properties. Soil Sci. 135:177-183.
Merten GH, Mielniczuk J (1991) Distribuição de sistema radicular e dos nutrientes em Latossolo Roxo sob dois sistemas de preparo de solo. R Bras Ci Solo. 15:369-374.
Minitab Release 14.1. 2000. Statistical Software. US/ Canadá.
Miyazawa M, Pavan MA, Calegari A (1993) Efeito de material vegetal na acidez do solo. R Bras Ci Solo. 17:411-416
Montanari R, Souza GSA, Pereira GT, Marques Junior J, Siqueira DS, Siqueira GM (2012) The use of scaled semivariograms to plan soil sampling in sugarcane fields. P Agriculture. 13:542-552.
Oliveira IA, Campos MCC, Aquino RE, Marques Júnior J, Freitas L, Souza ZM (2014) Semivariograma escalonado no planejamento amostral da resistência à penetração e umidade de solo com cana-de-açúcar. R Ci Agrarias. 57:287-296.
Oliveira IA, Campos MCC, Marques Júnior J, Aquino RE, Teixeira DB (2015) Use of scaled semivariograms in sample planning of soil chemical attributes in southern Amazonas. R Bras Ci Solo. 31:21-30.
Oliveira IA, Campos MCC, Soares MCR, Aquino RE, Marques Júnior J, Nascimento EP (2013) Variabilidade espacial de atributos físicos em um Cambissolo Háplico, sob diferentes
1258
usos na região sul do Amazonas. R Bras Ci Solo. 37:1103-1112.
Pereira RG, Albuquerque AW, Cunha JLXL, Paes RA, Cavalcante M (2009) Atributos químicos do solo influenciados por sistemas de manejo. Caatinga. 22:78-84.
Peluco RG, Marques JRJ, Siqueira DS, Pereira GT, Barbosa RS, Teixeira DB (2015) Mapeamento do fósforo adsorvido por meio da cor e da suscetibilidade magnética do solo. Pesquisa Agropecuária Brasileira. 50:259-266.
Peluco RG, Marques JRJ, Siqueira DS, Pereira GT, Barbosa RS, Teixiera DB, Adame CR, Cortez LA (2013) Suscetibilidade magnética do solo e estimação da capacidade de suporte à aplicação de vinhaça. Pesquisa Agropecuária Brasileira. 48(6):661-672.
Raij B Van, Andrade JC, Cantarella H, Quaggio JA (2001) Análise química para avaliação da fertilidade do solo. Campinas: Instituto Agronômico.
Ribeiro H, Pesquero C (2010) Queimadas de cana-de-açúcar: avaliação de efeitos na qualidade do ar e na saúde respiratória de crianças. Est Avançados. 24:255-271.
Schons A, Streck NA, Storck L, Buriol GA, Zanon AJ, Pinheiro DG, Kraulich B (2009) Arranjos de plantas de mandioca e milho em cultivo solteiro e consorciado: Crescimento, desenvolvimento e produtividade. Bragantia. 68:155-167.
Silva AS, Lima JSS, Xavier AC, Teixeira MM (2010) Variabilidade espacial de atributos químicos de um Latossolo Vermelho-Amarelo húmico cultivado com café. R Bras Ci Solo. 34, 15-22.
Siqueira DS, Marques Júnior J, Pereira GT (2010) The use of landforms to predict the variability of soil and orange attributes. Geoderma. 155:55–66.
Souza ZM, Marques Júnior J, Pereira GT, Moreira LF (2004) Variabilidade espacial do pH, Ca, Mg e V% do solo em diferentes formas do relevo sob cultivo de cana-de-açúcar. Ci Rural. 34:1763-1771.
Souza ZM, Marques Júnior J, Pereira GT (2009) Geoestatística e atributos do solo em áreas cultivadas com cana-de-açúcar. Ci Rural. 40:48-56.
VIEIRA SR (2000) Geoestatística em estudos de variabilidade espacial do solo. In: NOVAIS, R.F.; ALVAREZ, V., V.H. & SCHAEFER, G.R., eds. Tópicos em ciência do solo. Viçosa, MG, Sociedade Brasileira de Ciência do Solo, 2000. v. 1. p.1-54
Warrick AW, Nielsen DR (1980) Spatial variability of soil physical properties in the field. In: HILLEL, D., ed. Applications of soil physics. New York: Academic.
Wortmann CS, Dobermann A, Ferguson RB, Hergert GW, Shapiro CA, Tarkalson DD, Walters DT (2009) High yield corn response to applied phosphorus, potassium, and sulfur in Nebraska. Agron J. 101:546–555.
Yeomans JC, Bremner JM (1988) A rapid and precise method for routine determination of organic carbon in soil. Commun Soil Sci Plant Analysis. 19:1467-1476.
Zanão Júnior LA, Lana RMQ, Carvalho-Zanão MP, Guimarães EC (2010) Variabilidade espacial de atributos químicos em diferentes profundidades em um Latossolo em sistema de plantio direto. R Ceres. 57:429-438.
Zanão Júnior LA, Lana RMQ, Guimarães EC (2007) Variabilidade espacial do pH, teores de matéria orgânica e micronutrientes em profundidade em um Latossolo Vermelho sob semeadura direta. Ci Rural. 37:1000-1007.