spatial variability of oil shale grade within rich and ... · j. d. yeakel and n. mansoor 29th oil...
TRANSCRIPT
Spatial Variability of Oil Shale Grade Within Rich and Lean Oil Shale Zones, Green River Formation, Piceance Basin, Colorado
J. D. Yeakel and N. Mansoor
29th Oil Shale Symposium
October 21, 2009
2
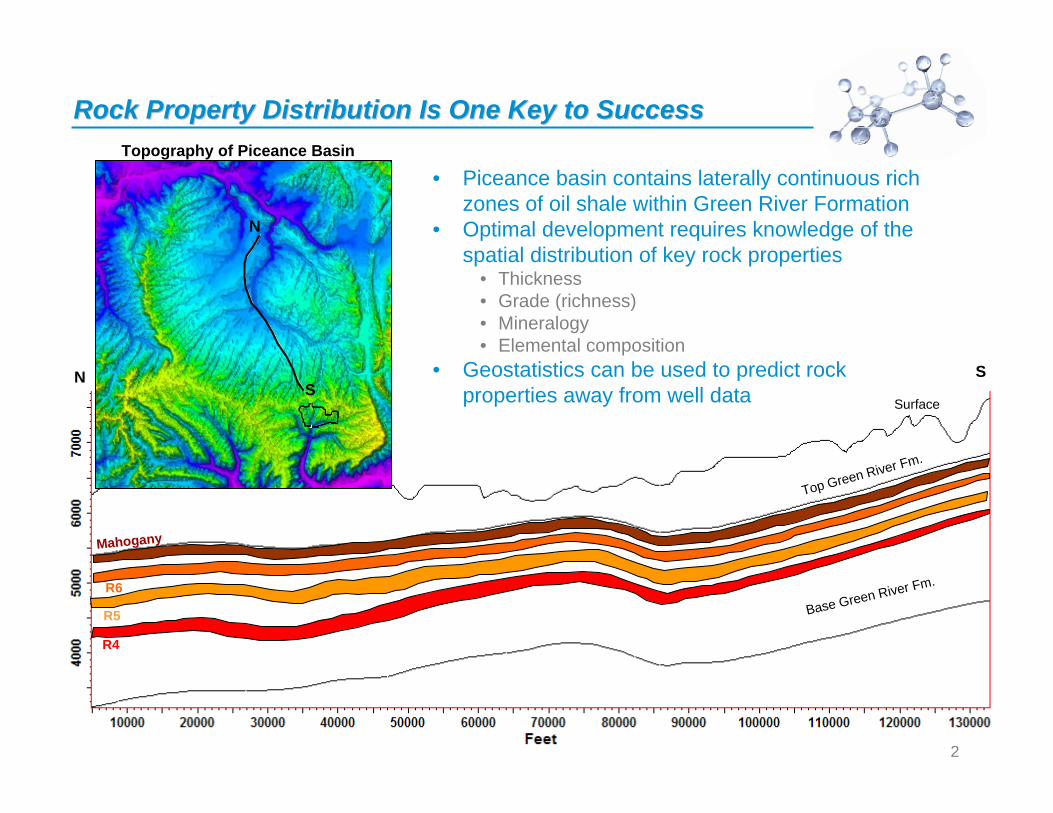
• Piceance basin contains laterally continuous rich zones of oil shale within Green River Formation
• Optimal development requires knowledge of the spatial distribution of key rock properties
• Thickness• Grade (richness)• Mineralogy• Elemental composition
• Geostatistics can be used to predict rock properties away from well data
Mahogany
R6
R5
R4
Top Green River Fm.
Base Green River Fm.
Surface
SN
N
S
Topography of Piceance Basin
Rock Property Distribution Is One Key to Success Rock Property Distribution Is One Key to Success
3
• High Grade Piceance Basin Oil Shale Exhibits Remarkable Continuity over Distances of Several Miles
• Internal Stratigraphy of Rich Zones (e.g. Mahogany) Possess High Degree of Spatial Continuity in Grade over Distances of Thousands of Feet.
• Within the Rich Layers of the Mahogany:• Rich layers are greater than 30 gallons per ton (gpt).• Such layers have a very significant nugget.• Ranges extend out to nearly 1000 feet.
Spatial Variability of Oil Shale Properties Spatial Variability of Oil Shale Properties
4
• Qualitative example in deep Piceance basin –R4 and Mahogany intervals• Introduction to stratigraphy• R4 stratigraphy and correlation• Mahogany stratigraphy and correlation
• Detailed spatial analysis of Mahogany zone at Colony mine site• Introduction to site• Stratigraphy• Geostatistics• Application to the larger Colony acreage
Outline Outline
5
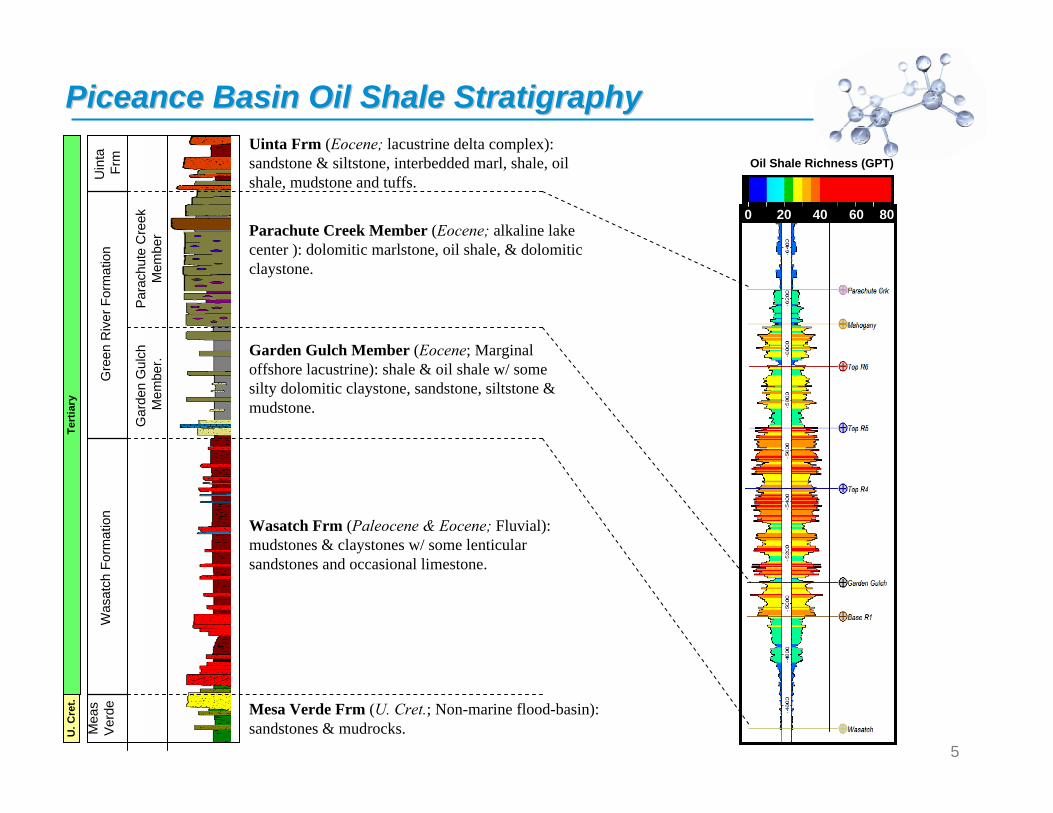
Piceance Basin Oil Shale Stratigraphy Piceance Basin Oil Shale Stratigraphy M
eas
Verd
eW
asat
ch F
orm
atio
n
Gar
den
Gul
chM
embe
r.
Gre
en R
iver
For
mat
ion
Para
chut
e C
reek
Mem
ber
Uin
ta
Frm
Mesa Verde Frm (U. Cret.; Non-marine flood-basin): sandstones & mudrocks. U
. Cre
t.Te
rtia
ry
Wasatch Frm (Paleocene & Eocene; Fluvial): mudstones & claystones w/ some lenticularsandstones and occasional limestone.
Garden Gulch Member (Eocene; Marginal offshore lacustrine): shale & oil shale w/ some silty dolomitic claystone, sandstone, siltstone & mudstone.
Parachute Creek Member (Eocene; alkaline lake center ): dolomitic marlstone, oil shale, & dolomitic claystone.
Uinta Frm (Eocene; lacustrine delta complex): sandstone & siltstone, interbedded marl, shale, oil shale, mudstone and tuffs.
Oil Shale Richness (GPT)
0 20 40 8060
6
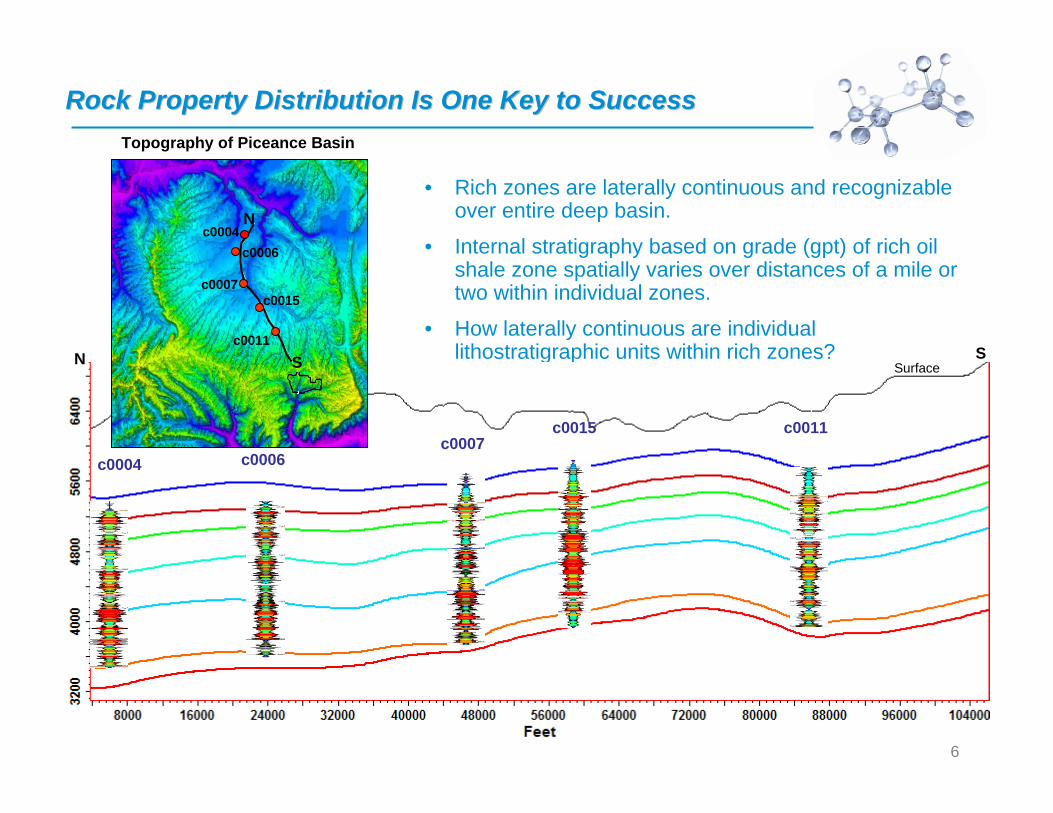
• Rich zones are laterally continuous and recognizable over entire deep basin.
• Internal stratigraphy based on grade (gpt) of rich oil shale zone spatially varies over distances of a mile or two within individual zones.
• How laterally continuous are individual lithostratigraphic units within rich zones?
Topography of Piceance Basin
SurfaceSN
c0004 c0006c0007
c0015 c0011
Rock Property Distribution Is One Key to Success Rock Property Distribution Is One Key to Success
N
S
c0004c0006
c0007c0015
c0011
7
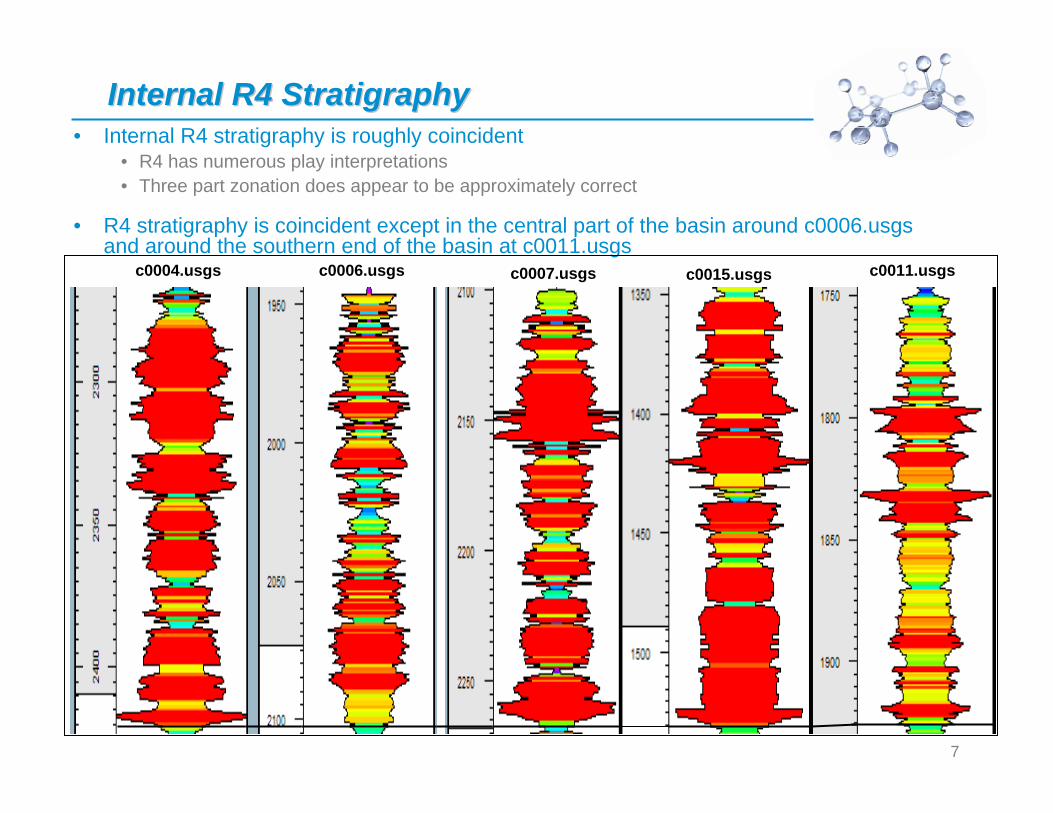
• Internal R4 stratigraphy is roughly coincident• R4 has numerous play interpretations• Three part zonation does appear to be approximately correct
• R4 stratigraphy is coincident except in the central part of the basin around c0006.usgs and around the southern end of the basin at c0011.usgs
c0004.usgs c0006.usgs c0007.usgs c0015.usgs c0011.usgs
Internal R4 Stratigraphy Internal R4 Stratigraphy
8
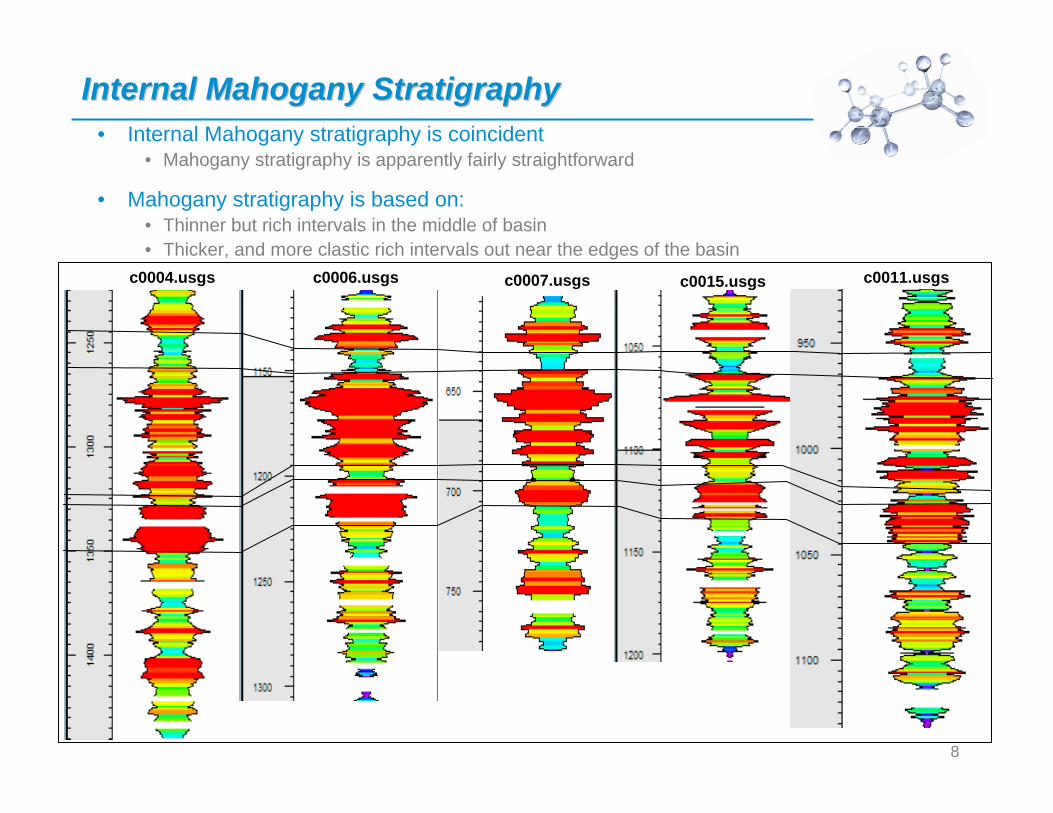
• Internal Mahogany stratigraphy is coincident• Mahogany stratigraphy is apparently fairly straightforward
• Mahogany stratigraphy is based on:• Thinner but rich intervals in the middle of basin• Thicker, and more clastic rich intervals out near the edges of the basin
c0004.usgs c0006.usgs c0007.usgs c0015.usgs c0011.usgs
Internal Mahogany Stratigraphy Internal Mahogany Stratigraphy
9
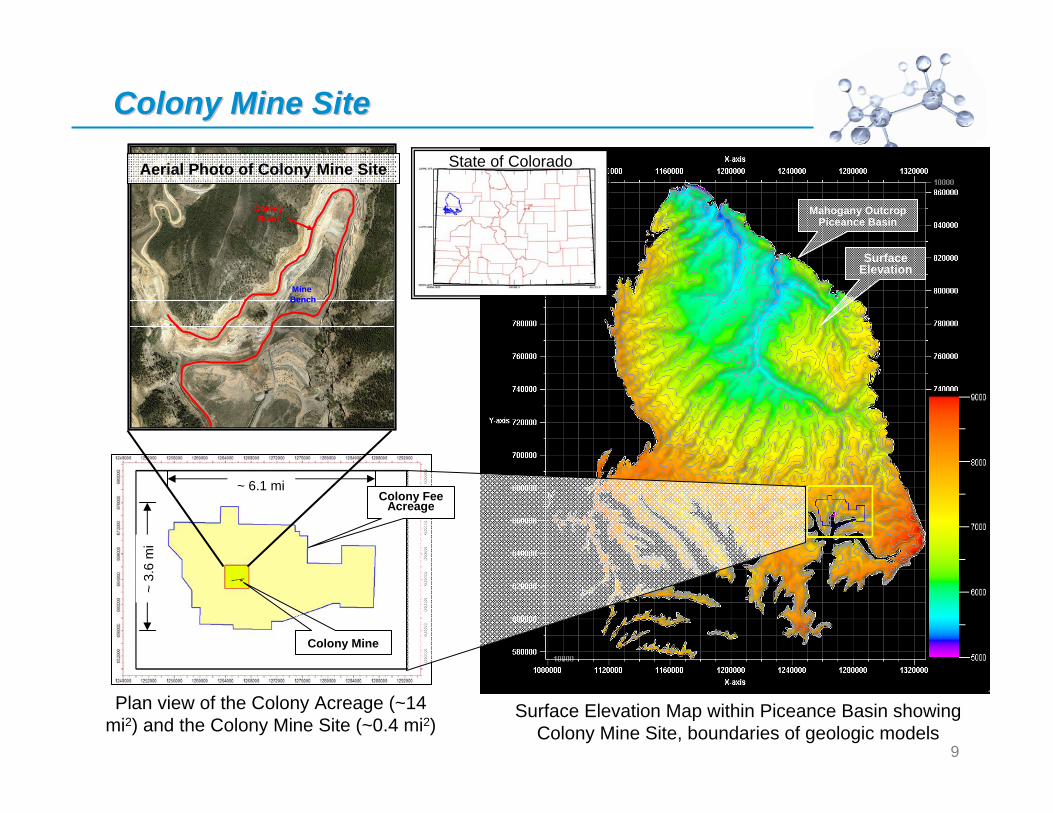
Colony Mine SiteColony Mine Site
~ 6.1 mi
~ 3.
6 m
i
Colony Mine
Mahogany Outcrop Piceance Basin
Surface Elevation
Surface Elevation Map within Piceance Basin showing Colony Mine Site, boundaries of geologic models
Plan view of the Colony Acreage (~14 mi2) and the Colony Mine Site (~0.4 mi2)
Mine Bench
ColonyRoad
Mine Bench
ColonyRoad
Colony Fee Acreage
State of ColoradoAerial Photo of Colony Mine Site
10
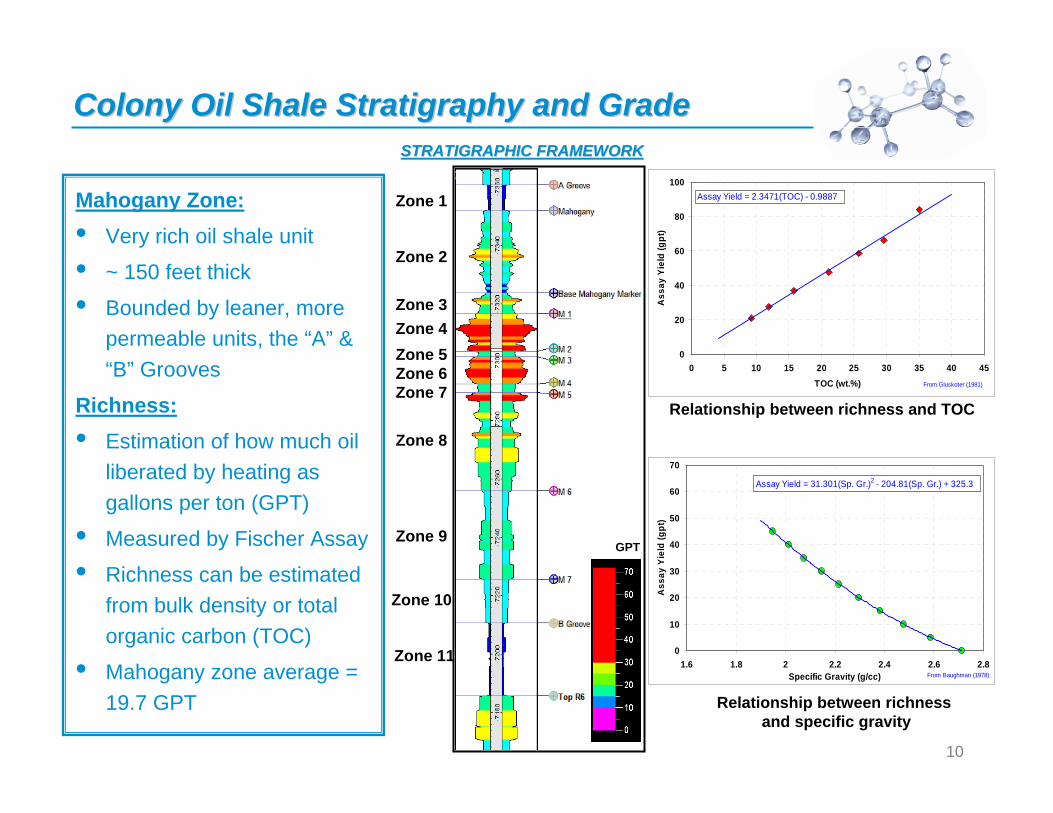
Colony Oil Shale Stratigraphy and GradeColony Oil Shale Stratigraphy and Grade
0
10
20
30
40
50
60
70
1.6 1.8 2 2.2 2.4 2.6 2.8Specific Gravity (g/cc)
Ass
ay Y
ield
(gpt
)From Baughman (1978)
Assay Yield = 31.301(Sp. Gr.)2 - 204.81(Sp. Gr.) + 325.3
0
20
40
60
80
100
0 5 10 15 20 25 30 35 40 45TOC (wt.%)
Ass
ay Y
ield
(gpt
)
From Gluskoter (1981)
Assay Yield = 2.3471(TOC) - 0.9887
Relationship between richness and specific gravity
Relationship between richness and TOC
Mahogany Zone:• Very rich oil shale unit
• ~ 150 feet thick
• Bounded by leaner, more permeable units, the “A” & “B” Grooves
Richness:• Estimation of how much oil
liberated by heating as gallons per ton (GPT)
• Measured by Fischer Assay
• Richness can be estimated from bulk density or total organic carbon (TOC)
• Mahogany zone average = 19.7 GPT
Zone 1
Zone 2
Zone 3Zone 4Zone 5Zone 6Zone 7
Zone 8
Zone 9
Zone 10
Zone 11
GPT
STRATIGRAPHIC FRAMEWORKSTRATIGRAPHIC FRAMEWORK
11
e Mahogany Marker
M 1
M 2
M 3
M 4
M 5
M 6
-714
0-7
130
-712
0-7
110
-710
0-7
090
-708
0-7
070
-706
0-7
050
-7048
M 1
M 2
M 3
M 4
M 5
M 6
Base Mahogany Marker
-714
0-7
130
-712
0-7
110
-710
0-7
090
-708
0-7
070
-706
0(-
7050
)
(-7045)
M 1
M 2
M 3
M 4
Base Mahogany Marker
M 5
M 6
-714
0-7
130
-712
0-7
110
-710
0-7
090
-708
0-7
070
-706
0(-
7050
)
(-7046)
M 1
Base Mahogany Marker
M 2
M 3
M 4
M 5
M 6
-71
-713
0-7
120
-711
0-7
100
-709
0-7
080
-707
0-7
060
(-70
50)
(-7044)
M 1
Base Mahogany Marker
M 2
M 3
M 4
M 5
M 6
-713
0-7
120
-711
0-7
100
-709
0-7
080
-707
0-7
060
(-70
50)
(-7042)
M 1
Base Mahogany Marker
M 2
M 3
M 4
M 5
M 6
-71
-713
0-7
120
-711
0-7
100
-709
0-7
080
-707
0-7
060
(-70
50)
(-7044)
M 1
Base Mahogany Marker
M 2
M 3
M 4
M 5
M 6
-71
-713
0-7
120
-711
0-7
100
-709
0-7
080
-707
0-7
060
(-70
50)
(-7044)
M 1
Base Mahogany Marker
M 2
M 3
M 4
M 5
M 6
-713
0-7
120
-711
0-7
100
-709
0-7
080
-707
0-7
060
(-70
50)
(-7039)
M 1
Base Mahogany Marker
M 2
M 3
M 4
M 5
M 6
-713
0-7
120
-711
0-7
100
-709
0-7
080
-707
0-7
060
(-70
50)
(-7040)
M 1
Base Mahogany Marker
M 2
M 3
M 4
M 5
M 6
-713
0-7
120
-711
0-7
100
-709
0-7
080
-707
0-7
060
(-70
50)
(-70
40)
(-7038)
M 1
Base Mahogany Marker
M 2
M 3
M 4
M 5
M 6
-713
0-7
120
-711
0-7
100
-709
0-7
080
-707
0-7
060
-705
0
( -7039)
M 1
Base Mahogany Marker
M 2
M 3
M 4
M 5
M 6
-713
0-7
120
-711
0-7
100
-709
0-7
080
-707
0-7
060
(-70
50)
(-70
40)
( -7036)
M 1
Base Mahogany Marker
M 2
M 3
M 4
M 5
M 6
-713
0-7
120
-711
0-7
100
-709
0-7
080
-707
0-7
060
-705
0(-
7040
)
(-7037)
M 1
Base Mahogany Marker
M 2
M 3
M 4
M 5
M 6
(-71
30)
-712
0-7
110
-710
0-7
090
-708
0-7
070
-706
0-7
050
(-70
40)
(-7038)
M 1
Base Mahogany Marker
M 2
M 3
M 4
M 5
M 6
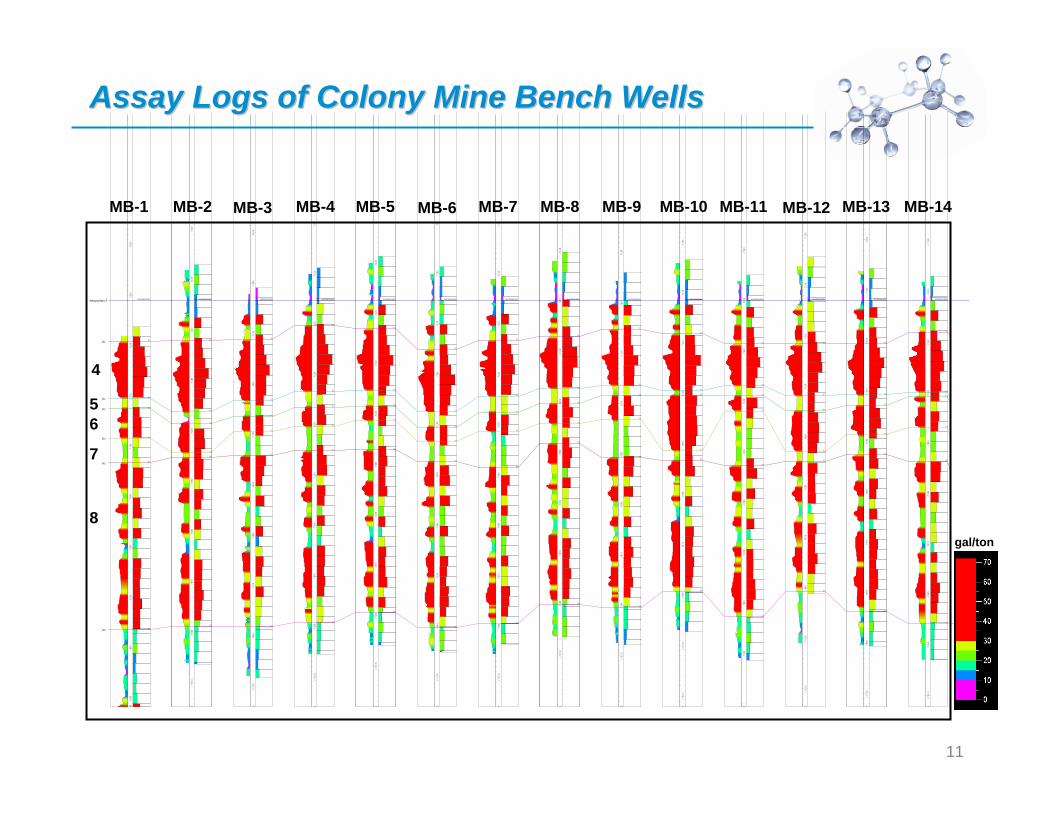
MB-1 MB-2 MB-3 MB-4 MB-5 MB-6 MB-7 MB-8 MB-9 MB-10 MB-11 MB-12 MB-13 MB-14
Assay Logs of Colony Mine Bench WellsAssay Logs of Colony Mine Bench Wells
4
8
65
7
gal/ton
12
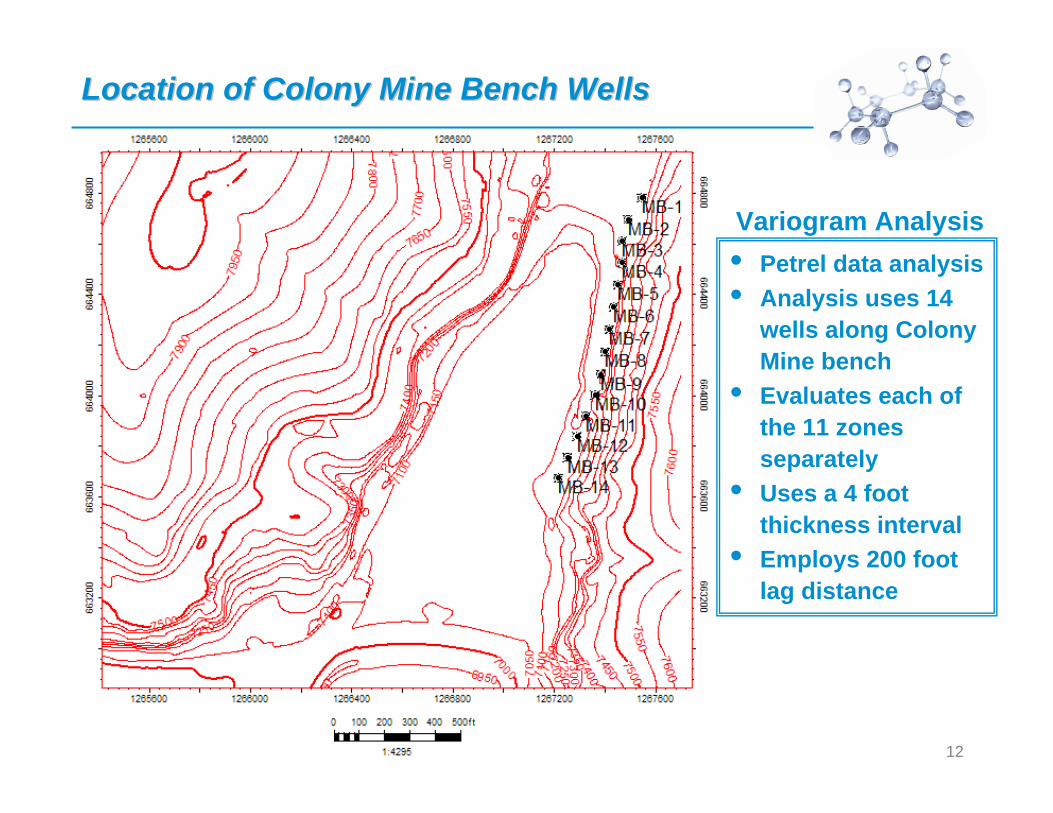
Location of Colony Mine Bench WellsLocation of Colony Mine Bench Wells
• Petrel data analysis• Analysis uses 14
wells along Colony Mine bench
• Evaluates each of the 11 zones separately
• Uses a 4 foot thickness interval
• Employs 200 foot lag distance
Variogram Analysis
13
Geostatistical Analysis: Variogram BasicsGeostatistical Analysis: Variogram Basics
0 200 400 600 800 1000 1200 1400 1600 1800 2000
0 200 400 600 800 1000 1200 1400 1600 1800 2000
00.
20.
40.
60.
81
1.2
1.4
00.2
0.40.6
0.81
1.21.4
Separation Distance
Sem
ivar
ianc
e
Variogram (Gaussian) Variogram (Exponential) Variogram (Spherical)
Nugget
Range
Sill
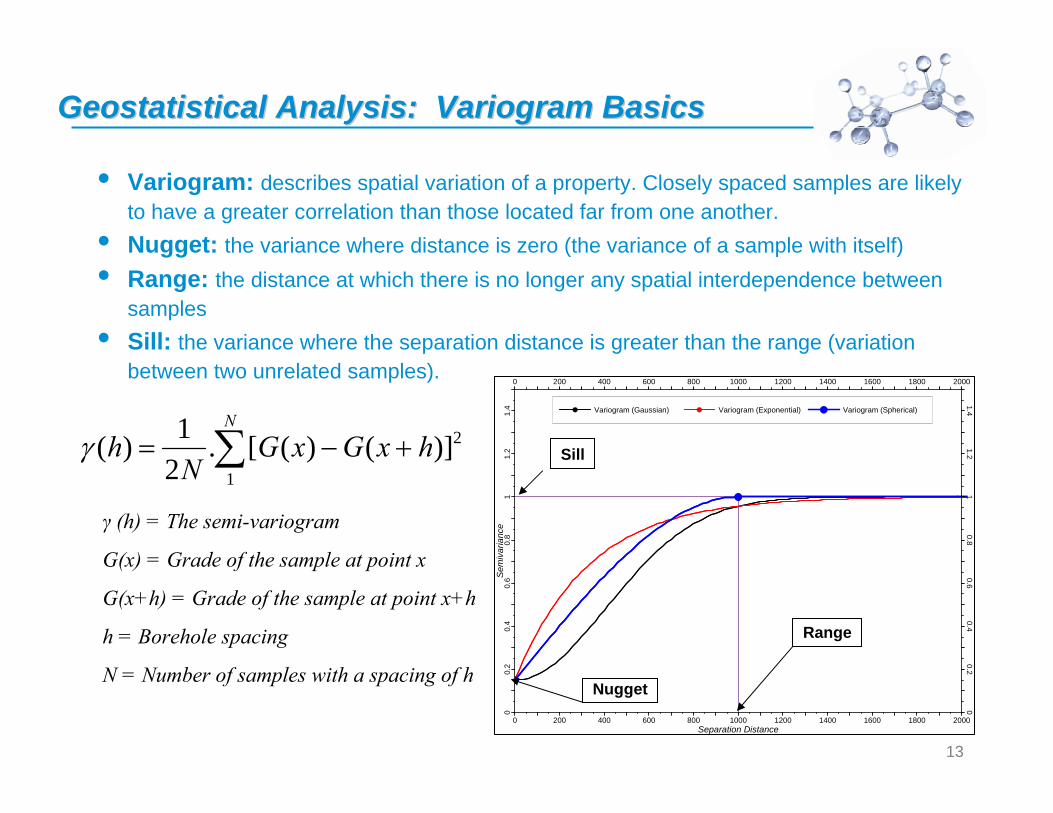
• Variogram: describes spatial variation of a property. Closely spaced samples are likely to have a greater correlation than those located far from one another.
• Nugget: the variance where distance is zero (the variance of a sample with itself)• Range: the distance at which there is no longer any spatial interdependence between
samples• Sill: the variance where the separation distance is greater than the range (variation
between two unrelated samples).
γ (h) = The semi-variogram
G(x) = Grade of the sample at point x
G(x+h) = Grade of the sample at point x+h
h = Borehole spacing
N = Number of samples with a spacing of h
∑ +−=N
hxGxGN
h1
2)]()([.21)(γ
14
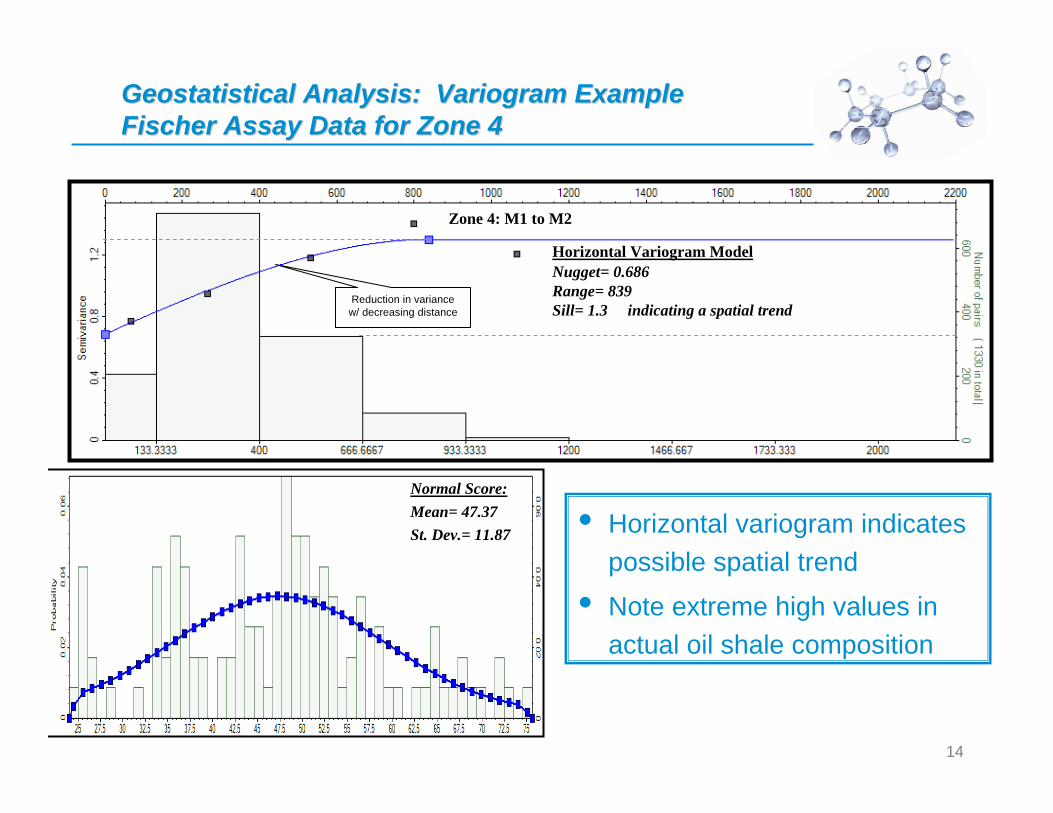
Geostatistical Analysis: Variogram ExampleGeostatistical Analysis: Variogram ExampleFischer Assay Data for Zone 4Fischer Assay Data for Zone 4
Normal Score:Mean= 47.37St. Dev.= 11.87
Horizontal Variogram ModelNugget= 0.686Range= 839Sill= 1.3 indicating a spatial trend
Zone 4: M1 to M2
Reduction in variance w/ decreasing distance
• Horizontal variogram indicates possible spatial trend
• Note extreme high values in actual oil shale composition
15
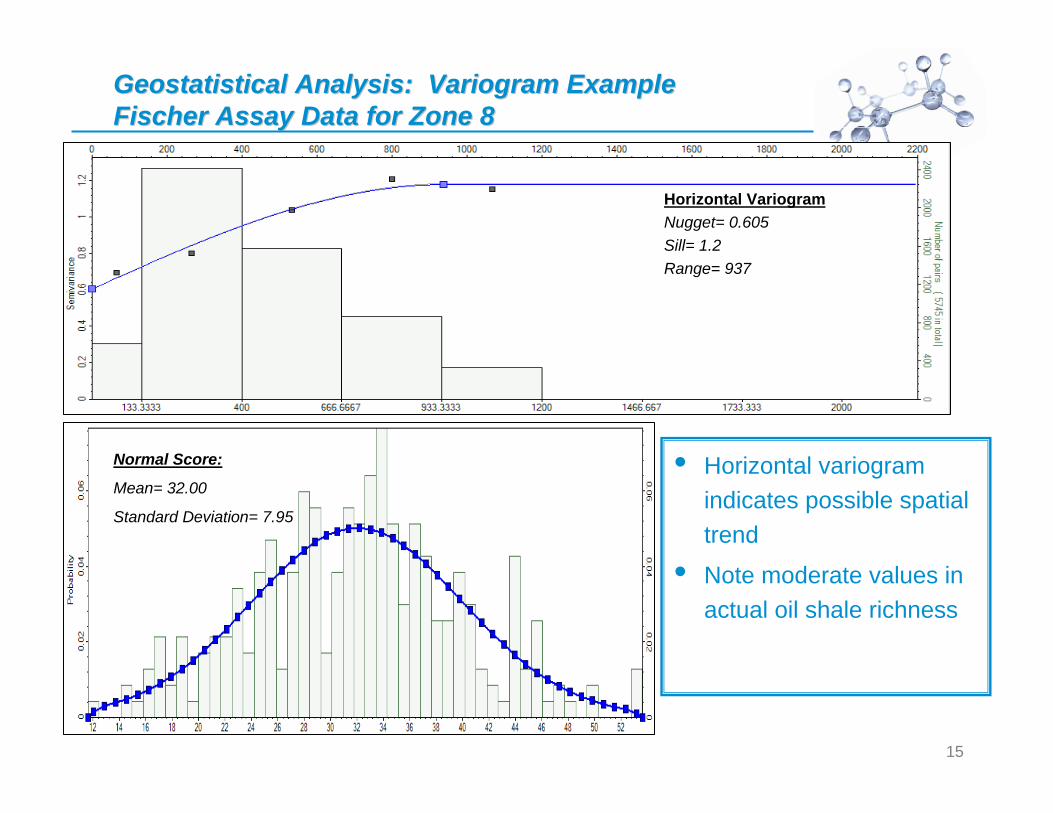
Normal Score:
Mean= 32.00
Standard Deviation= 7.95
Horizontal VariogramNugget= 0.605Sill= 1.2Range= 937
Geostatistical Analysis: Variogram ExampleGeostatistical Analysis: Variogram ExampleFischer Assay Data for Zone 8Fischer Assay Data for Zone 8
• Horizontal variogram indicates possible spatial trend
• Note moderate values in actual oil shale richness
16
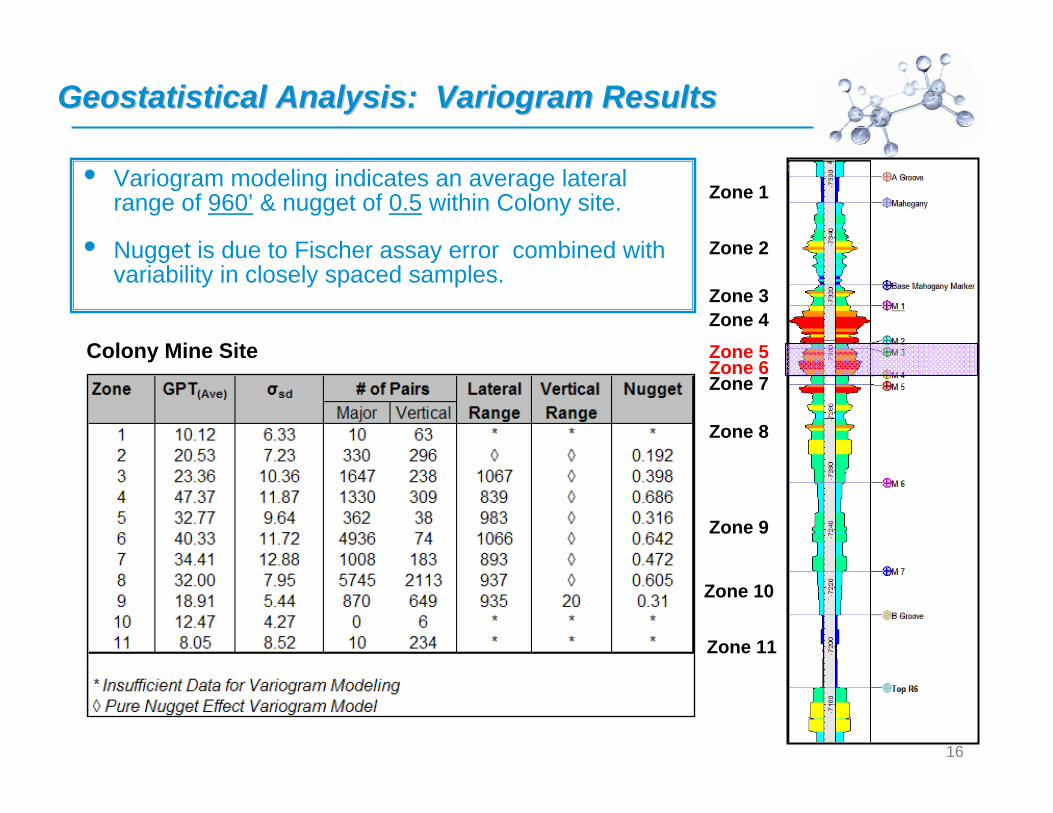
Geostatistical Analysis: Variogram ResultsGeostatistical Analysis: Variogram Results
Zone 1
Zone 2
Zone 3Zone 4Zone 5Zone 6Zone 7
Zone 8
Zone 9
Zone 10
Zone 11
Colony Mine Site
• Variogram modeling indicates an average lateral range of 960’ & nugget of 0.5 within Colony site.
• Nugget is due to Fischer assay error combined with variability in closely spaced samples.
17
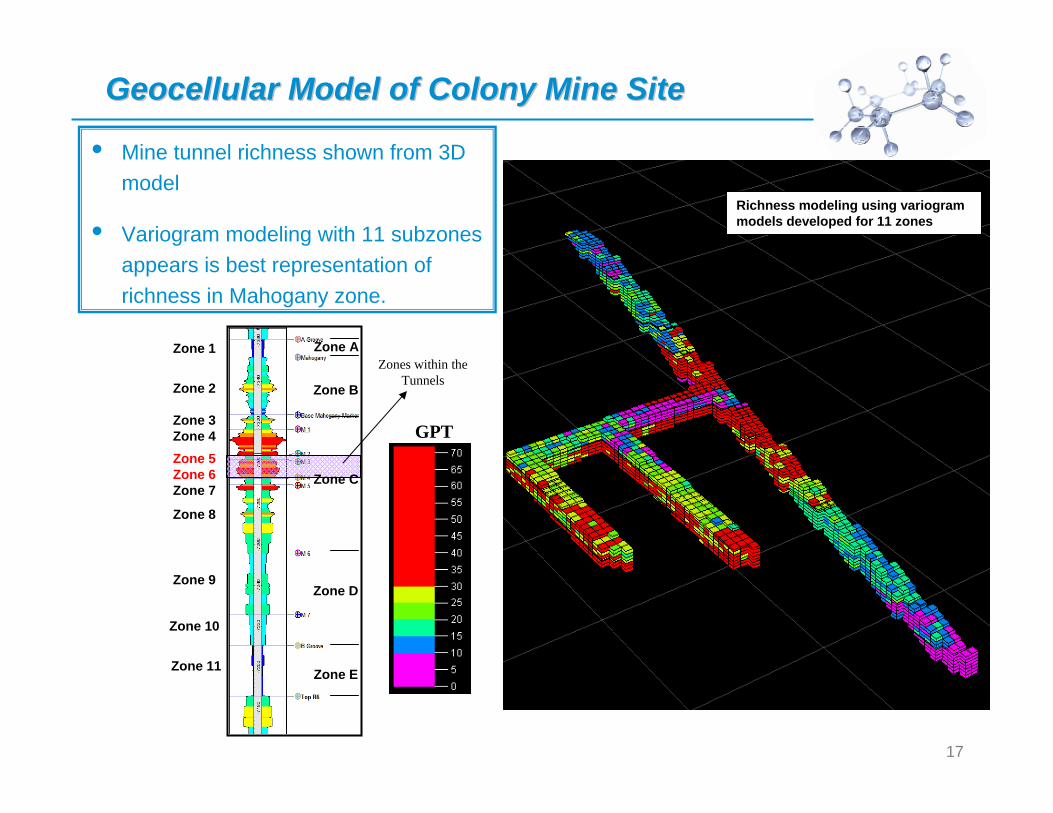
Geocellular Model of Colony Mine SiteGeocellular Model of Colony Mine Site
Richness modeling using variogram models developed for 11 zones
Zone 1
Zone 2
Zone 3Zone 4Zone 5Zone 6Zone 7
Zone 8
Zone 9
Zone 10
Zone 11
Zone A
Zone B
Zone C
Zone D
Zone E
• Mine tunnel richness shown from 3D model
• Variogram modeling with 11 subzones appears is best representation of richness in Mahogany zone.
GPT
Zones within the Tunnels
18
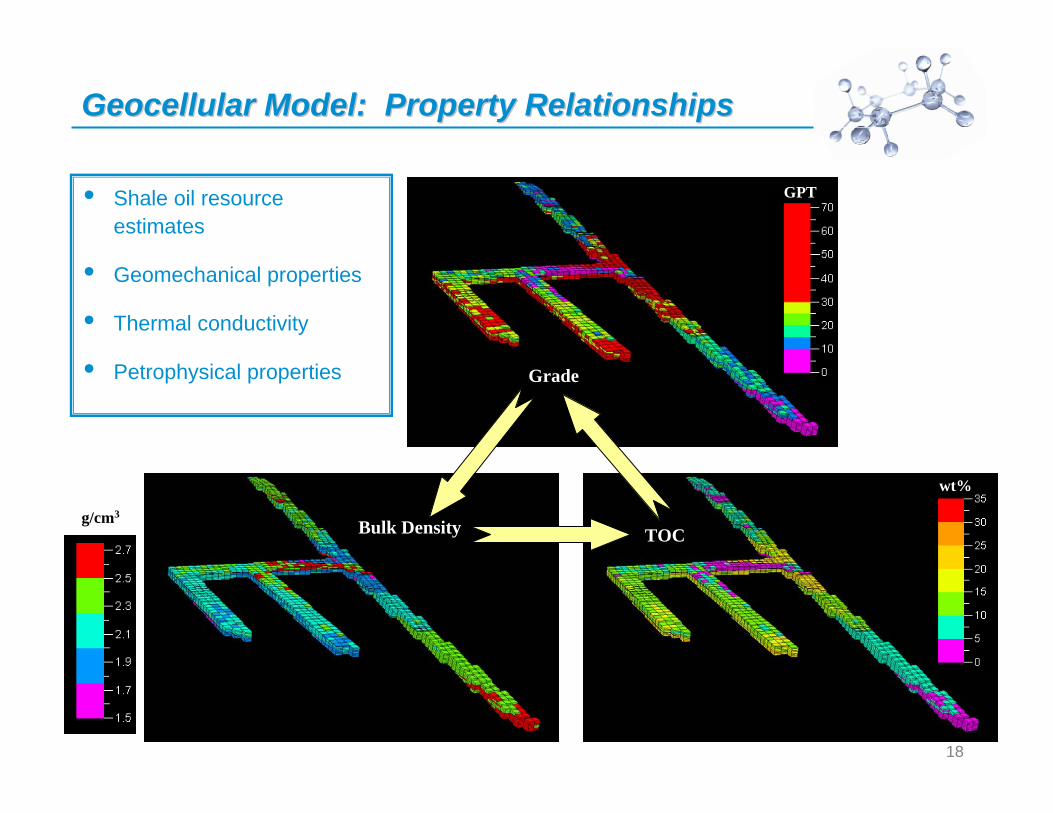
Geocellular Model: Property RelationshipsGeocellular Model: Property Relationships
Grade
Bulk Density TOC
• Shale oil resource estimates
• Geomechanical properties
• Thermal conductivity
• Petrophysical properties
GPT
wt%
g/cm3
19
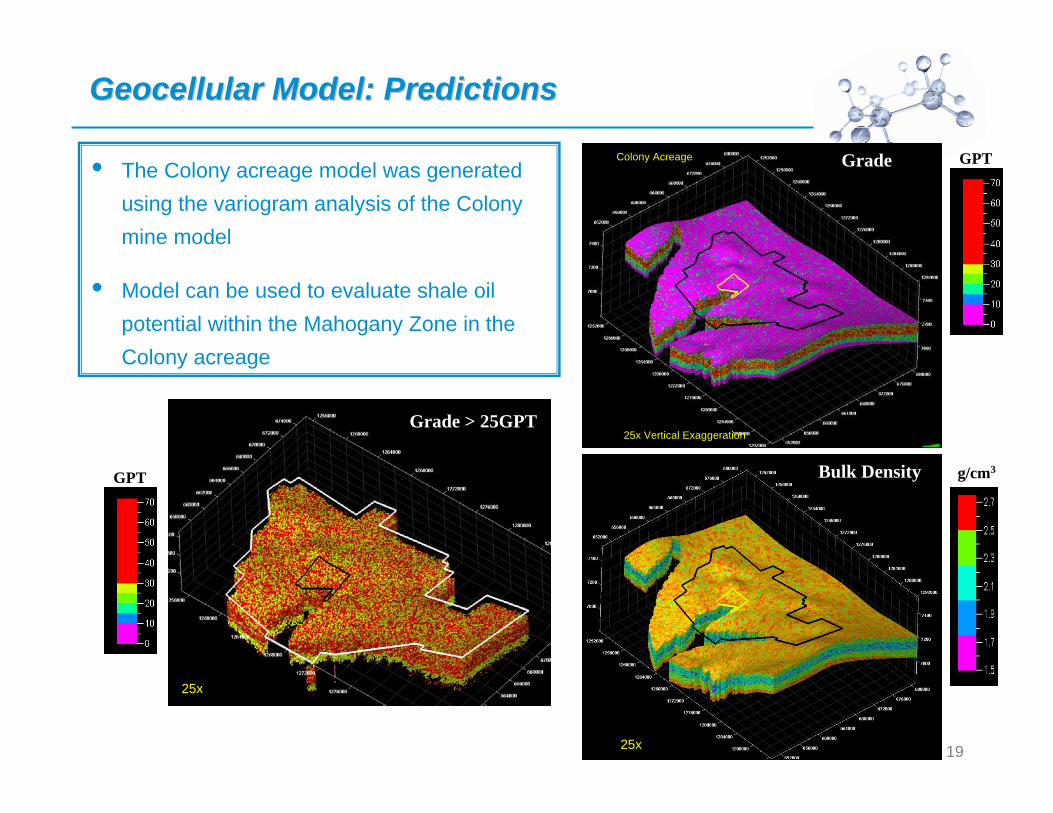
Geocellular Model: PredictionsGeocellular Model: Predictions
25x Vertical Exaggeration
Colony Acreage
Bulk Density
• The Colony acreage model was generated using the variogram analysis of the Colony mine model
• Model can be used to evaluate shale oil potential within the Mahogany Zone in the Colony acreage
25x
25x
Grade > 25GPT
Grade GPT
g/cm3GPT
20
• High grade Piceance basin oil shale exhibits remarkable continuity over distances of several miles
• Internal stratigraphy of rich zones (e.g. Mahogany) possess high degree of spatial continuity in grade over distances of thousands of feet.
• Geostatistics of the rich layers of the Mahogany:• Rich layers are greater than 30 gallons per ton (gpt)• Such layers have a very significant nugget• Ranges extend out to nearly 800 - 1000 feet
• Geostatistics developed in a data-rich area were used to predict rock properties over a larger acreage
ConclusionsConclusions
21
Thank You!Thank You!