spatio-temporal exploration of paleo fire climate patterns using the superposed epoch analysis...
TRANSCRIPT
Spatio-temporal Exploration of
Paleo Fire Climate Patterns Using the
Superposed Epoch Analysis (S.E.A.)
Capstone Project Proposal, PSU MGIS
Author: Wendy Gross, Advisor: Dr. Alan Taylor
Proposal Outline
• Background
• Goals and Objectives
• Proposed Methodology
• Project Timeline
• Conclusions and Anticipated Results
1
Background
Goals and Objectives ProposedMethodology
Project Timeline
Conclusionsand Anticipated Results
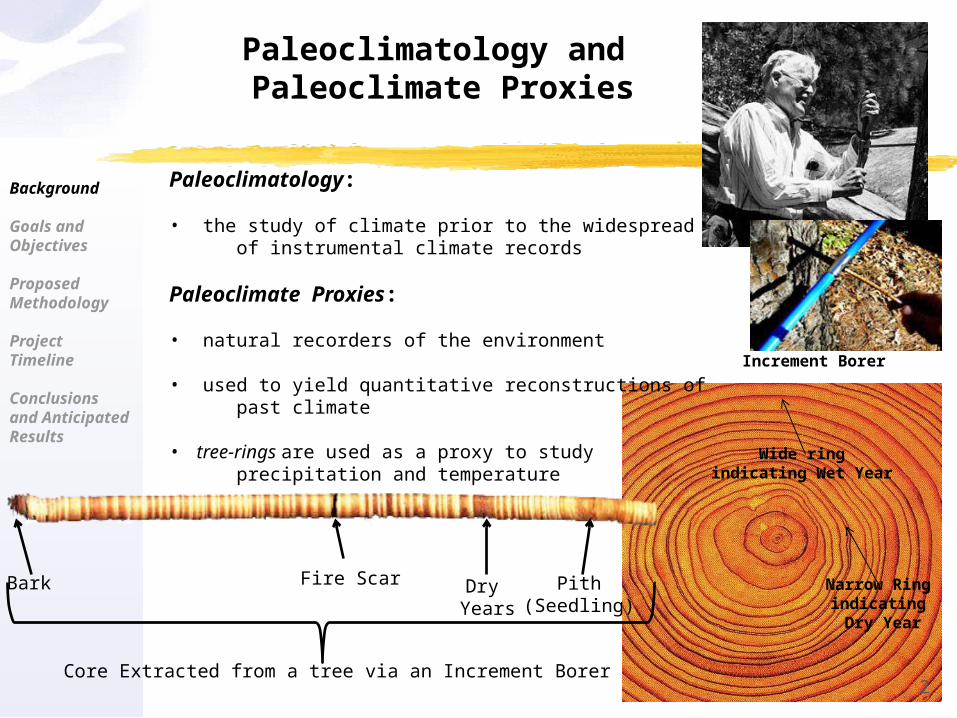
Wide ringindicating Wet Year
Narrow Ring indicating Dry Year
Paleoclimatology:
• the study of climate prior to the widespread availability of instrumental climate records
Paleoclimate Proxies:
• natural recorders of the environment
• used to yield quantitative reconstructions of past climate
• tree-rings are used as a proxy to study precipitation and temperature
Paleoclimatology and Paleoclimate Proxies
Increment Borer
Core Extracted from a tree via an Increment Borer
Fire Scar Pith(Seedling)
Dry Years
Bark
2
Background
Goals and Objectives ProposedMethodology
Project Timeline
Conclusionsand Anticipated Results
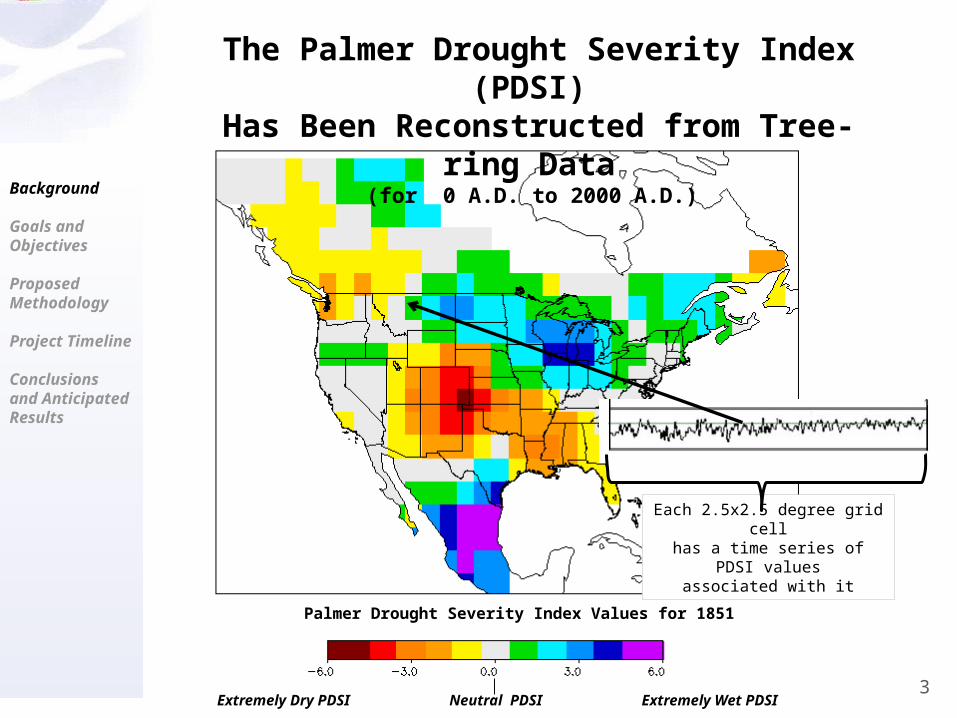
Palmer Drought Severity Index Values for 1851
Extremely Dry PDSI Neutral PDSI Extremely Wet PDSI
Each 2.5x2.5 degree grid cellhas a time series of PDSI values
associated with it
3
The Palmer Drought Severity Index (PDSI) Has Been Reconstructed from Tree-ring Data
(for 0 A.D. to 2000 A.D.)
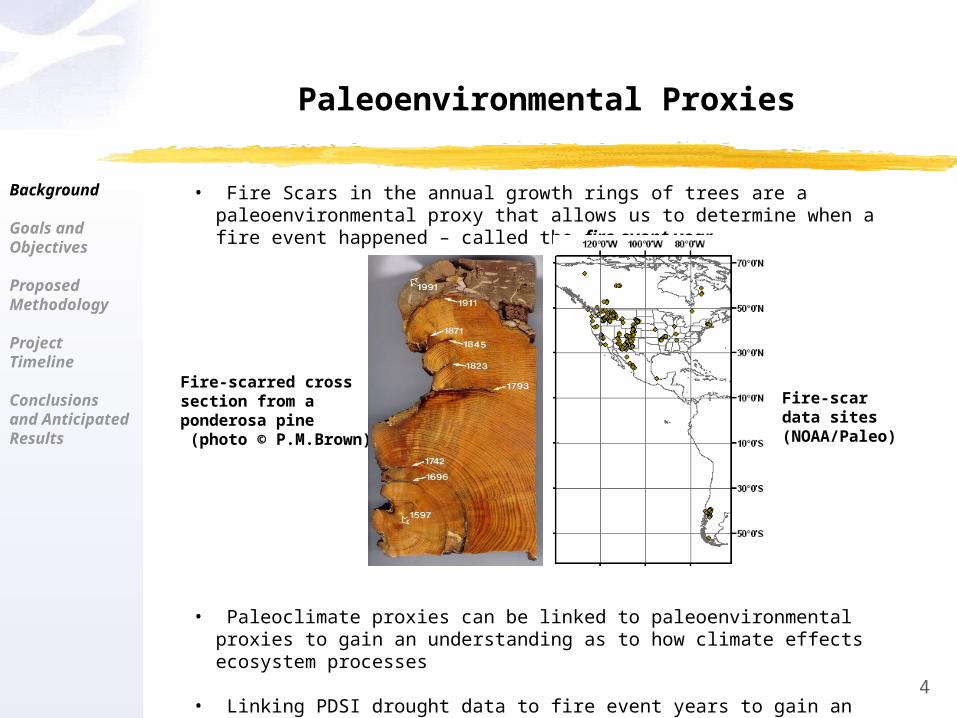
Paleoenvironmental Proxies
• Fire Scars in the annual growth rings of trees are a paleoenvironmental proxy that allows us to determine when a fire event happened – called the fire event year
• Paleoclimate proxies can be linked to paleoenvironmental proxies to gain an understanding as to how climate effects ecosystem processes
• Linking PDSI drought data to fire event years to gain an understanding of how drought affects fire
,
Fire-scarred cross section from a ponderosa pine (photo © P.M.Brown)
Background
Goals and Objectives ProposedMethodology
Project Timeline
Conclusionsand Anticipated Results
4
Fire-scardata sites(NOAA/Paleo)
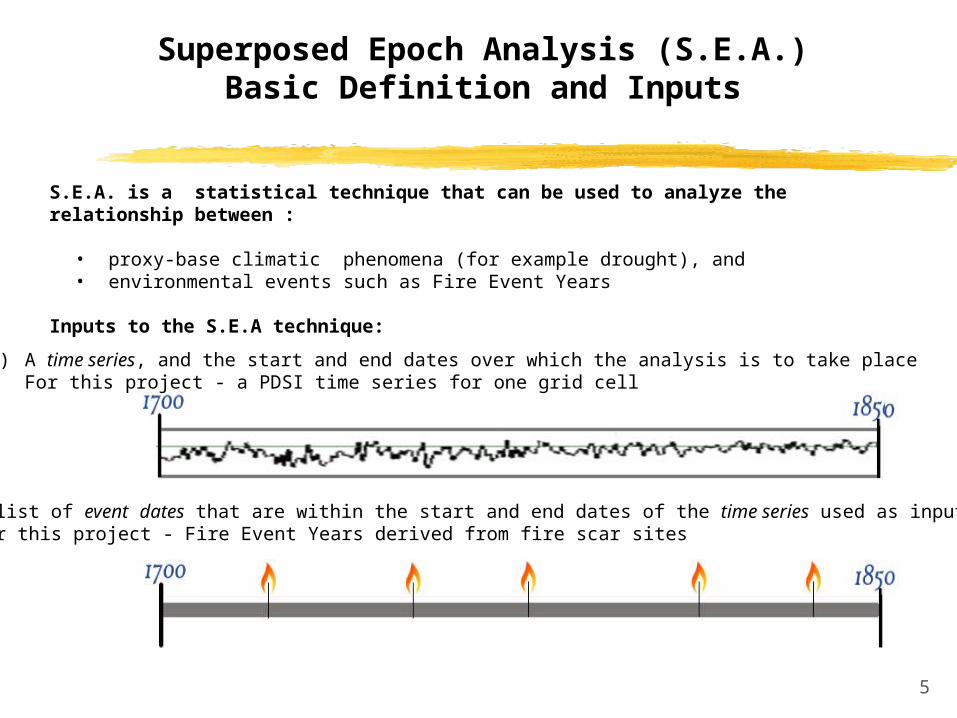
Superposed Epoch Analysis (S.E.A.) Basic Definition and Inputs
(2) A list of event dates that are within the start and end dates of the time series used as inputFor this project - Fire Event Years derived from fire scar sites
S.E.A. is a statistical technique that can be used to analyze the relationship between :
• proxy-base climatic phenomena (for example drought), and• environmental events such as Fire Event Years
Inputs to the S.E.A technique:
5
(1) A time series, and the start and end dates over which the analysis is to take place For this project - a PDSI time series for one grid cell
Background
Goals and Objectives ProposedMethodology
Conclusions
Anticipated Results
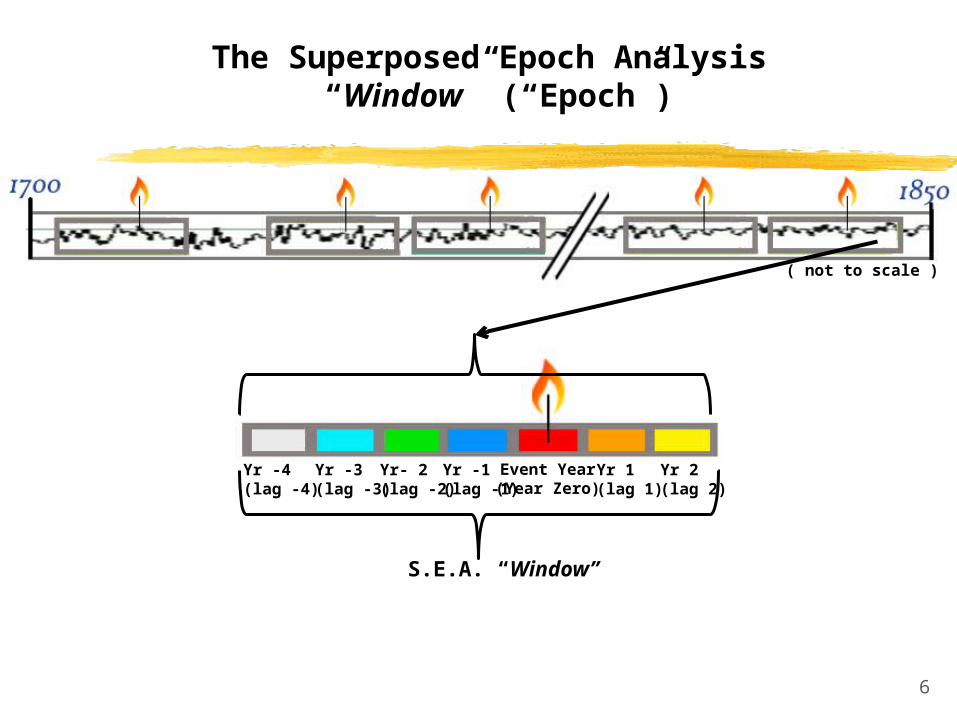
The Superposed Epoch Analysis “Window” (“Epoch”)
S.E.A. “Window”
Event Year(Year Zero)
Yr 2(lag 2)
Yr 1(lag 1)
( not to scale )
Yr -1(lag -1)
Yr- 2(lag -2)
Yr -3(lag -3)
Yr -4(lag -4)
6
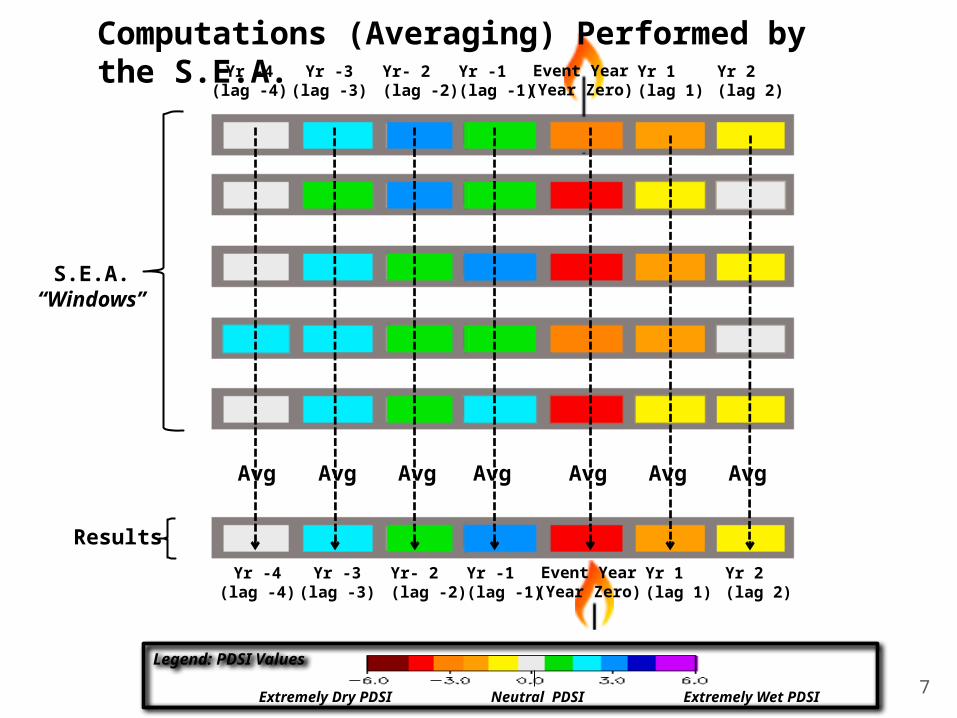
Computations (Averaging) Performed by the S.E.A.
AvgAvgAvg
Results
S.E.A.“Windows”
Avg AvgAvg Avg
Yr 2(lag 2)
Yr 1(lag 1)
Yr -1(lag -1)
Yr- 2(lag -2)
Yr -3(lag -3)
Yr -4(lag -4)
Event Year(Year Zero)
Legend: PDSI Values
Yr 2(lag 2)
Yr 1(lag 1)
Yr -1(lag -1)
Yr- 2(lag -2)
Yr -3(lag -3)
Yr -4(lag -4)
Event Year(Year Zero)
7Extremely Dry PDSI Neutral PDSI Extremely Wet PDSI
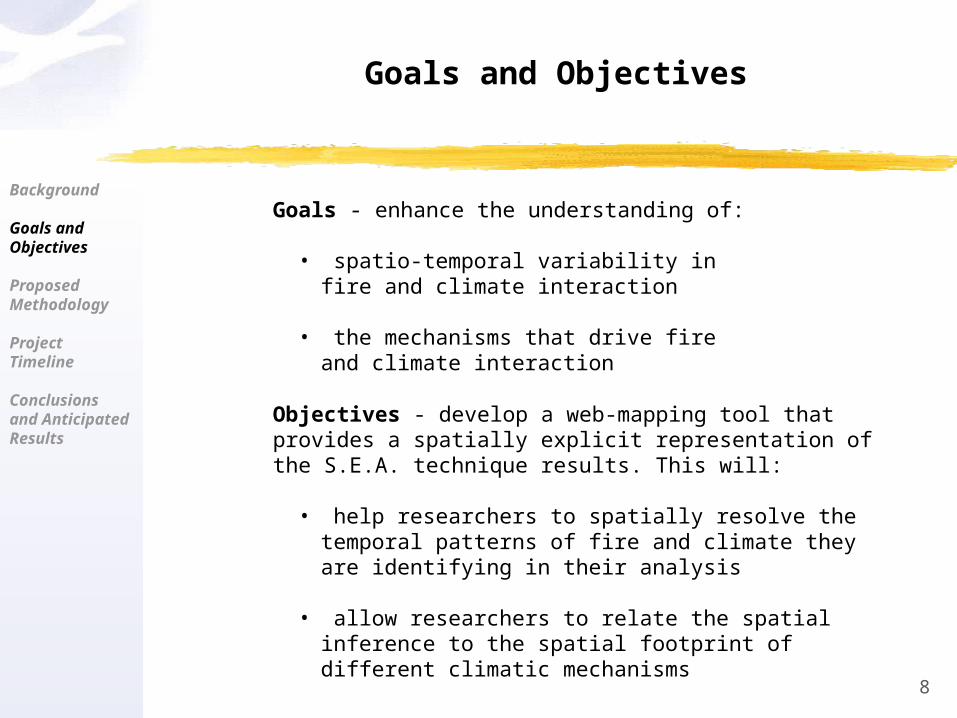
Goals - enhance the understanding of:
• spatio-temporal variability in fire and climate interaction
• the mechanisms that drive fire and climate interaction
Goals and Objectives
Objectives - develop a web-mapping tool that provides a spatially explicit representation of the S.E.A. technique results. This will:
• help researchers to spatially resolve the temporal patterns of fire and climate they are identifying in their analysis
• allow researchers to relate the spatial inference to the spatial footprint of different climatic mechanisms
Background
Goals and Objectives ProposedMethodology
Project Timeline
Conclusionsand Anticipated Results
8
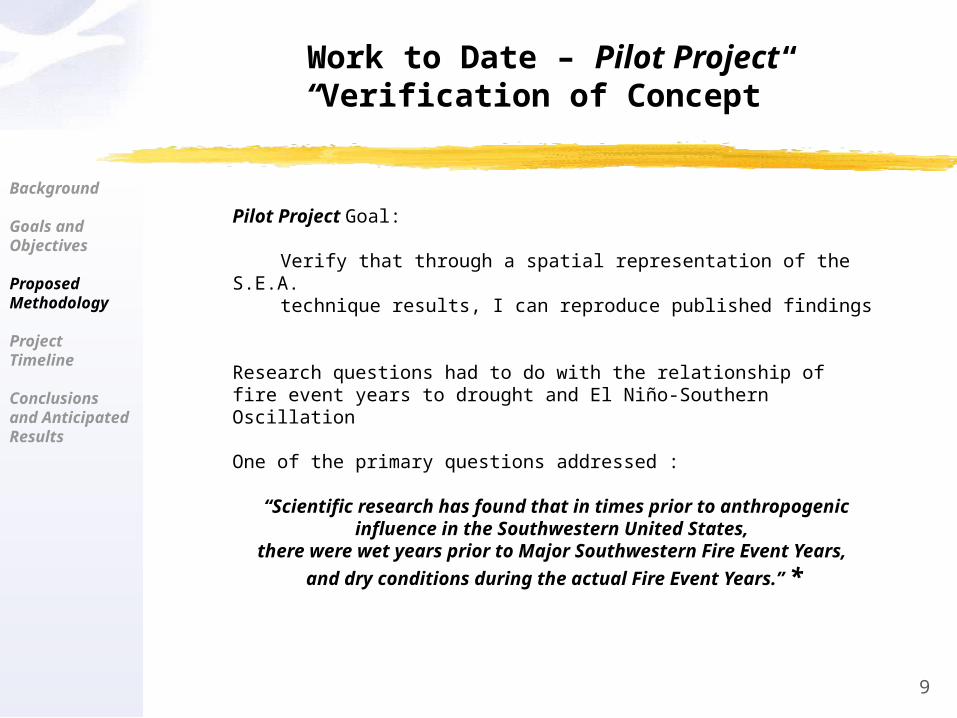
Pilot Project Goal:
Verify that through a spatial representation of the S.E.A. technique results, I can reproduce published findings
Research questions had to do with the relationship of fire event years to drought and El Niño-Southern Oscillation
One of the primary questions addressed :
“Scientific research has found that in times prior to anthropogenic influence in the Southwestern United States,
there were wet years prior to Major Southwestern Fire Event Years,
and dry conditions during the actual Fire Event Years.” *
* Barton Et al, 2001; Grissino-Mayer, 2000; Swetnam and Betancourt, 1989
Work to Date – Pilot Project“Verification of Concept”
Background
Goals and Objectives ProposedMethodology
Project Timeline
Conclusionsand Anticipated Results
9
Background
Goals and Objectives ProposedMethodology
Project Timeline
Conclusionsand Anticipated Results
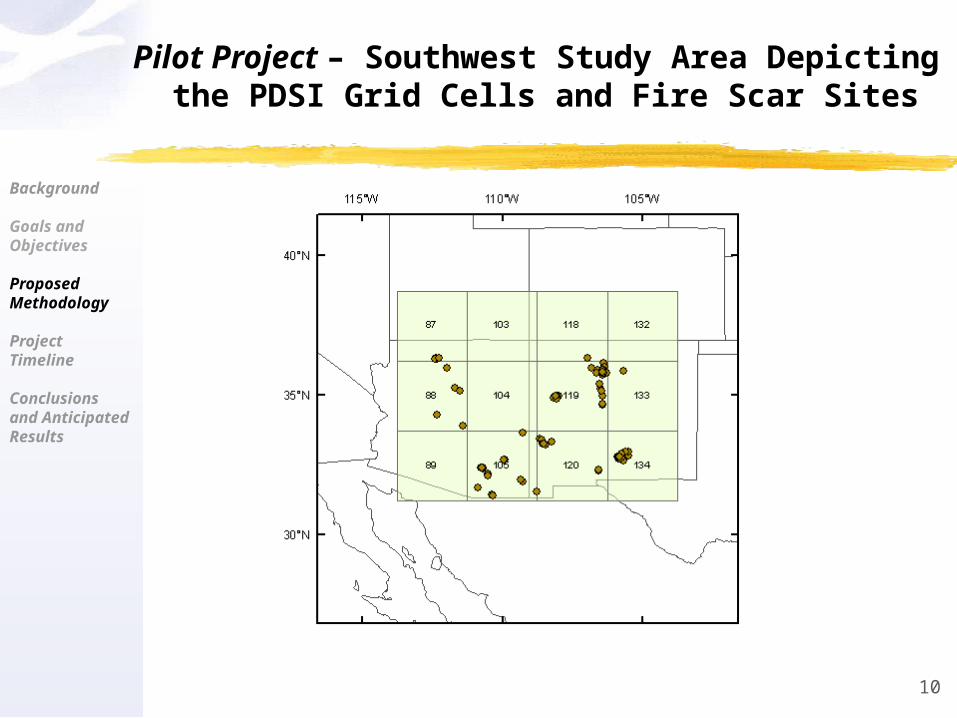
Pilot Project – Southwest Study Area Depicting the PDSI Grid Cells and Fire Scar Sites
10
Background
Goals and Objectives ProposedMethodology
Conclusionsand Anticipated Results
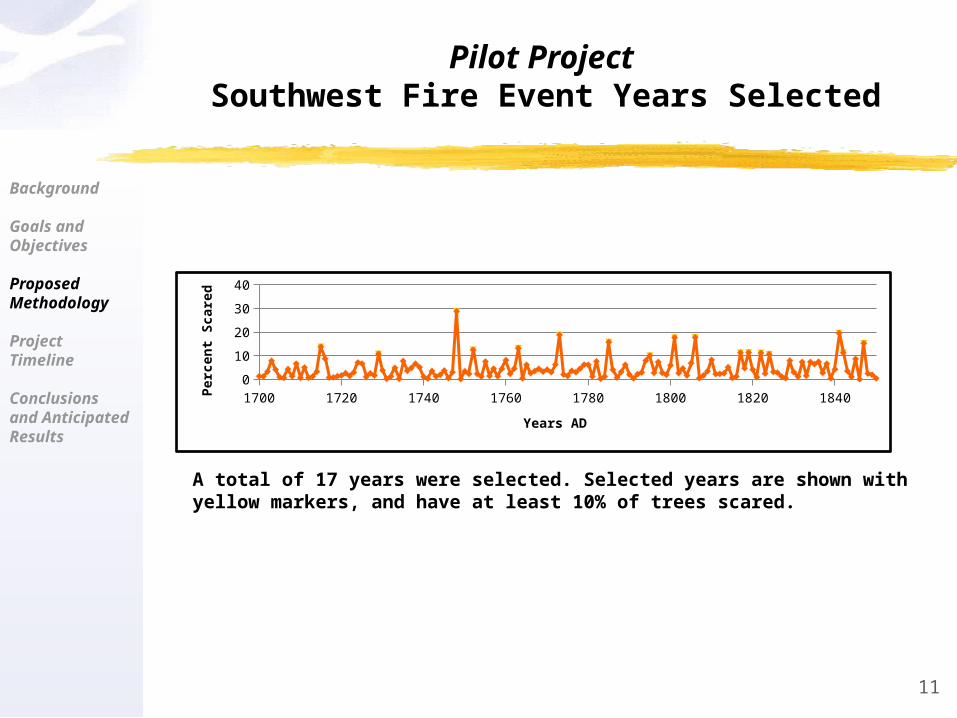
Pilot Project Southwest Fire Event Years Selected
Background
Goals and Objectives ProposedMethodology
Project Timeline
Conclusionsand Anticipated Results
11
1700 1720 1740 1760 1780 1800 1820 18400
10
20
30
40
Years AD
Perc
ent
Scare
d
A total of 17 years were selected. Selected years are shown with yellow markers, and have at least 10% of trees scared.
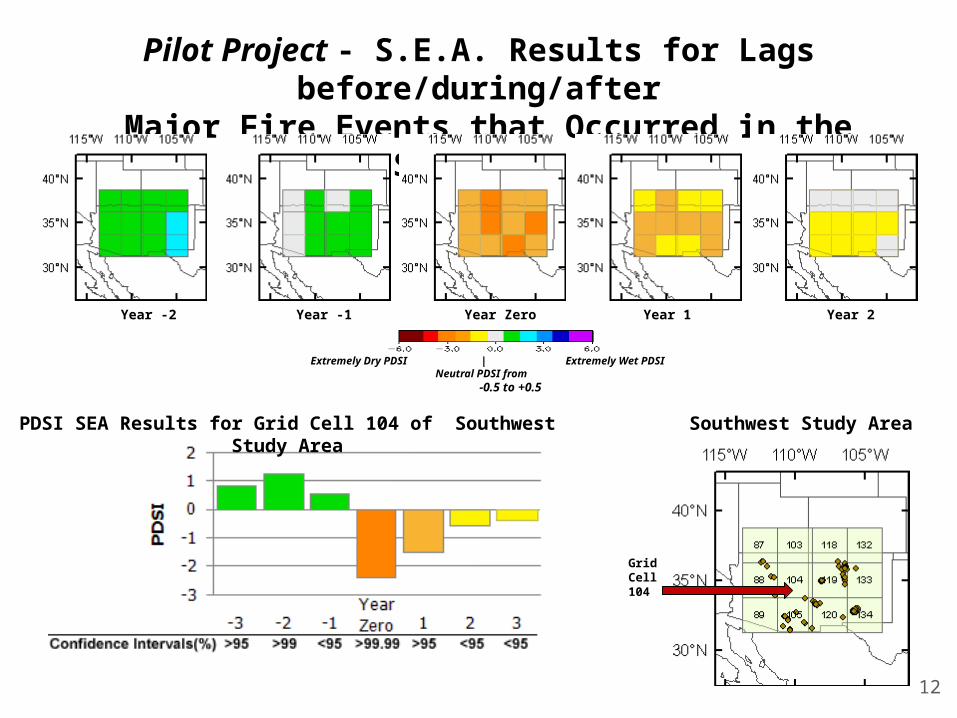
Pilot Project - S.E.A. Results for Lags before/during/after Major Fire Events that Occurred in the Southwest
Grid Cell 104
Southwest Study Area
Year -2 Year -1 Year Zero Year 1 Year 2
PDSI SEA Results for Grid Cell 104 of Southwest Study Area
Extremely Dry PDSI | Extremely Wet PDSI Neutral PDSI from -0.5 to +0.5
12
Background
Goals and Objectives ProposedMethodology
Conclusionsand Anticipated Results
Scientific discovery can be promoted by automation of computations, as well as interactive and dynamic visualization, and exploration of analysis results*
• software web-mapping software tool proposed will perform :
(1) automation of computations of the S.E.A. technique for every grid cell of the gridded dataset used as input
(2) creation of a full complement of interactive, and dynamic maps, in addition to graphs that depict the patterns realized for every lag
• significance of the results will be provided through graphical visualization of the certainty levels
Methodologies for Enhancing Scientific Discovery
Background
Goals and Objectives ProposedMethodology
Project Timeline
Conclusionsand Anticipated Results
13* Symanzik, 2007, Rubel, 2010
Background
Goals and Objectives ProposedMethodology
Conclusionsand Anticipated Results
Potential Geospatial Information Systems and Technologies (GIST)
Web-mapping:• ESRI’s ArcGIS geospatial web services (server-side) • ESRI’s ArcGIS Javascript Interface (client-side)
Automation of the S.E.A. computations and Geoprocessing:• PostreSQL/PostGIS RDBMS (server-side)• PHP programming language (server-side)
User Interface and Graphs:• ExtJS Javascript Library, Sencha.com (client-side)
Background
Goals and Objectives ProposedMethodology
Project Timeline
Conclusionsand Anticipated Results
14
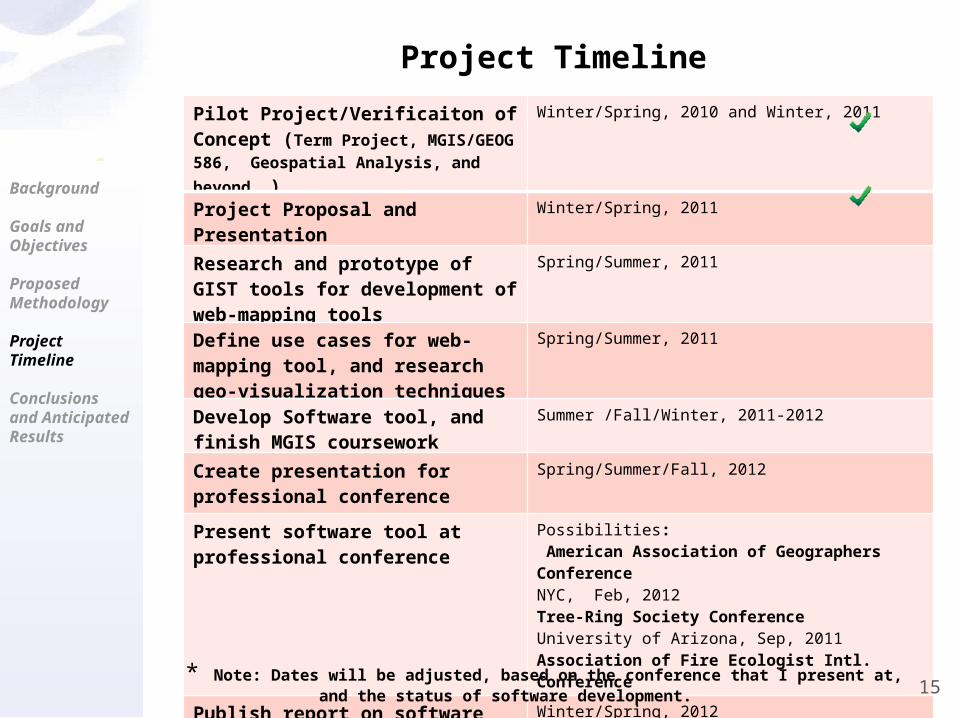
Project Timeline
Pilot Project/Verificaiton of Concept (Term Project, MGIS/GEOG 586, Geospatial Analysis, and beyond …)
Winter/Spring, 2010 and Winter, 2011
Project Proposal and Presentation Winter/Spring, 2011
Research and prototype of GIST tools for development of web-mapping tools
Spring/Summer, 2011
Define use cases for web-mapping tool, and research geo-visualization techniques
Spring/Summer, 2011
Develop Software tool, and finish MGIS coursework
Summer /Fall/Winter, 2011-2012
Create presentation for professional conference
Spring/Summer/Fall, 2012
Present software tool at professional conference
Possibilities: American Association of Geographers ConferenceNYC, Feb, 2012 Tree-Ring Society ConferenceUniversity of Arizona, Sep, 2011Association of Fire Ecologist Intl. ConferencePortland, Oregon, Dec, 2012
Publish report on software tool Winter/Spring, 2012
Background
Goals and Objectives ProposedMethodology
Project Timeline
Conclusionsand Anticipated Results
* Note: Dates will be adjusted, based on the conference that I present at, and the status of software development. 15
A spatial representation of Superposed Epoch Analysis results will help paleo fire researchers to spatially resolve the temporal patterns they are seeing. This will enhance researchers’ understanding of :
• spatial variability in fire climate interaction
• the climate mechanisms that drive fire climate interaction
The proposed web-mapping tool will facilitate this spatial representation of the S.E.A. results, as well as enhance visualization and exploration of the results through:
• the spatial representation of the S.E.A. results for all grid cells of gridded datasets via the automation of computations and creation
of interactive and dynamic maps and graphs for every lag
• interfacing with the FHEvent Software tool for assessment and visualization of confidence intervals
Summary, Conclusions and Anticipated Results
Background
Goals and Objectives ProposedMethodology
Project Timeline
Conclusionsand Anticipated Results
16

Acknowledgements
I am most grateful for the guidance and support of my Advisor:
Professor Alan Taylor, PSU
17
Questions ?
18
Spatio-temporal Exploration ofPaleo Fire Climate Patterns Using
the Superposed Epoch Analysis (S.E.A.)