spatio-temporal trends of female discrimination in south ...sex ratio variations in tamil nadu tamil...
TRANSCRIPT

HAL Id: halshs-00523589https://halshs.archives-ouvertes.fr/halshs-00523589
Submitted on 5 Oct 2010
HAL is a multi-disciplinary open accessarchive for the deposit and dissemination of sci-entific research documents, whether they are pub-lished or not. The documents may come fromteaching and research institutions in France orabroad, or from public or private research centers.
L’archive ouverte pluridisciplinaire HAL, estdestinée au dépôt et à la diffusion de documentsscientifiques de niveau recherche, publiés ou non,émanant des établissements d’enseignement et derecherche français ou étrangers, des laboratoirespublics ou privés.
Spatio-temporal Trends of Female Discrimination inSouth India: A Case Study in Tamil Nadu, 1961-1991.
Stéphanie Vella, Sébastien Oliveau
To cite this version:Stéphanie Vella, Sébastien Oliveau. Spatio-temporal Trends of Female Discrimination in South India:A Case Study in Tamil Nadu, 1961-1991.. Gender issues at the early stage of life in South and EastAsia, Institut Français de Pondichéry, pp.67-89, 2005, Collection Sciences Sociales. �halshs-00523589�

Gender discriminations at early stages of life in Asia 67
3
SPATIO-TEMPORAL TRENDS OF FEMALE DISCRIMINATION IN TAMIL NADU,
SOUTH INDIA: A CASE STUDY OF SALEM AND DHARMAPURI DISTRICTS, 1961-1991
Stéphanie Vella and Sébastien Oliveau Bordeaux III University and Paris I University
Introduction
The sex ratio1 (SR) is employed as a good expression of the status of women
in a society. It is the result of sex ratio at birth (SRB) and of differential
mortality according to sex and migrations. Yet, the juvenile sex ratio (JSR,
for 0-6 years population) is generally not influenced by migration, which is
very moderate in these age groups; it is consequently a valuable indicator of
the situation of girls. We shall therefore use the SRB as well as the JSR and
the SR in the characterization of sex discrimination.
The sex ratio of the Indian population, as well as the JSR, has been
diminishing almost regularly since 1901, particularly in some regions of the
country, because of specific discriminatory socio-cultural practices rooted in
the context of the Indian patriarchy. To the infanticide of newborn girls was
added, some thirty years ago, the sex selective abortion of female embryos.
Since the time India adopted new technologies to determine the sex of the
foetus, nothing has really been done to arrest their progression, except the
law of 1994 and its amendments.
These techniques are amniocentesis and the sexing of embryos
according to the method of Ericsson, by separation of the spermatozoids
x and y and artificial insemination (RCWS, 1994: 11-15). Moreover, a most
recent pre-implantation genetic diagnosis technology, a preconception
1 Calculated here as the number of women per 1000 men.

Spatio-temporal trends of female discrimination in South India 68
method, is used, whereas ultrasound scanning remains the most affordable
for most of the population (Mazumdar 1994). Another discriminatory
behaviour is the negligence towards girls, which can be broken down in
terms of care and alimentation. Of course, we do not develop here all the
other determinants of the sex-ratio such as maternal mortality, the
maltreatment of women, burning of wives, the malnutrition of women and so
on, which also contribute to low sex ratios.
To measure this sex discrimination, we conduct a cartographic study at
two levels in Tamil Nadu, in order to map the abnormalities of the juvenile
sex ratio and the sex ratio, which denote significant behaviour variations.
This research aims at providing some responses to the fact that gender
discrimination exists in certain regions of Tamil Nadu. We first describe the
trends in sex ratio differentials in South India. Then, we look more closely at
the variations and micro-spatio-temporal trends in Tamil Nadu2. We then
investigate the sex ratios in the districts of Salem and Dharmapuri from 1961
to 1991 (Figure 1: map of India). In conclusion, we provide some
explanations concerning this phenomenon, as statistically and spatially
recorded, notably by introducing of the concept of diffusion.
Sex ratio differentials in South India
This research was conducted in South India for different reasons: sex
discrimination is less studied there than in the North, where the sex ratio has
been widely analysed (Visaria 1999: 81-88, for instance) and is well
documented (Das Gupta, Chen and Krishnan 1995). Furthermore, the
relative homogeneity among the southern states has given place to the
traditional North-South dichotomy, but we wish now to show that, on
smaller scales, heterogeneities exist among the four states of Kerala, Tamil
Nadu, Karnataka and Andhra Pradesh, and that Tamil Nadu presents
specificities in the matter of sex discrimination. An additional reason is the
availability of the spatialized database from the South India Fertility Project
of the French Institute, which allowed us to obtain spatial data on sex ratios.
The sex ratio at birth from the 1981 and 1991 censuses, calculated
with indirect statistical methods (Sudha and Rajan 1999), reflects the
behaviour during pregnancy, and notably concerning sex-selective abortions.
In South India, we observe a generalized sinking of the SRB from 1981 to
2 This part, as the first part, is inspired by an article to be published in 2005 in Sage.

Gender discriminations at early stages of life in Asia 69
1991 (the SRB for 2001 has not been yet estimated). This decline exists in
rural and also in urban areas for the four South Indian states, except for
urban Kerala, where the SRB does not decline. As for the sex ratio at birth in
Tamil Nadu, it was 931 in 1999, as compared with 952 in 1991. It underwent
many fluctuations from one year to the next, but it has a declining tendency
(Directorate of Public Health, 1999).
Otherwise, the general trend during the last five decades has been a
deterioration in the juvenile sex ratio, overall and nearly regular in South
India (Figure 2). Andhra Pradesh and Karnataka, where the JSR is higher,
have decreased in parallel, except in 1981 when the JSR in Andhra Pradesh
underwent a slight increase. Kerala follows an opposite trend and displays in
2001 the highest level in South India, along with Andhra Pradesh. On the
other hand, Tamil Nadu records the most rapid decline, from 985 in 1961 to
939 in 2001, and its JSR is only slightly higher than the national average.
Moreover, an interesting characteristic of Tamil Nadu is that, other than its
very low total JSR, the JSR is lower in the rural zones. Elsewhere in India,
Figure 2: Juvenile sex ratio (girls per 1000 boys below 7) in
South India and India, 1961-2001
Source: Census of India, various years, Vella, 2005.
920
930
940
950
960
970
980
990
1000
1010
1961 1971 1981 1991 2001
Se
x r
ati
o b
elo
w 7
(p
er
10
00
)
A ndhra P radesh
K arnataka
K era la
Tam il Nadu
Ind ia

Spatio-temporal trends of female discrimination in South India 70
it is rather in the urban zones that girls are less numerous, a phenomenon
which can be related to urban attitudes, as well as to the existing medical
infrastructure and the availability of sex selective abortion. This would not
be true in the case of Tamil Nadu (Vella 2005).
Figure 3: Sex ratio (women per 1000 men) in
South India and India, 1961-2001
850
900
950
1000
1050
1100
1961 1971 1981 1991 2001
Se
x r
ati
o
Andhra PradeshKarnatakaKeralaTam il N aduIndia
Source: Census of India, various years.
Concerning the sex ratio, there is no big difference at the state level,
but the trend is not so clear as in the case of the juvenile sex ratio. We
observe a better result for 2001 than for 1991, especially in the case of
Kerala, where the sex ratio is regularly increasing (Figure 3). The role of
migrations has to be considered in this state, as well as the better status of
women. The social development is actually more advanced in Kerala, which
stands out significantly from the trend in South India. In contrast, the three
other states are much less “developed” and more agricultural. Andhra
Pradesh paradoxically distinguishes itself by an unfavourable level of
development but the most balanced juvenile sex ratio. It emerges from this
analysis that the statistics for Tamil Nadu are highly unfavourable to girls.

Gender discriminations at early stages of life in Asia 71
Sex ratio variations in Tamil Nadu
Tamil Nadu has a low fertility that declined rapidly (2.1 in 1991), being the
second lowest in India after Kerala (Sudha and Rajan 1999). Among the
large states, Tamil Nadu is known as being quite advanced respective of a
number of social indicators (literacy of girls, total sex ratio, participation
of women in work and infant mortality rate), although behind Kerala
(Vella 2005).
TABLE 1: Sex ratio of children below 7 years and sex ratio,
1991 and 2001, selected districts of Tamil Nadu
Districts
year
SR06 SR06 SR SR
1991 2001 1991 2001 Salem 849 826 925 929
Dharmapuri 905 878 942 938
Theni * 893 964 979
Vellore 970 937 978 997
Madurai 918 927 964 978
Namakkal * 895 960 967
Perambalur * 944 975 1007
Dindigul 934 929 976 986
Nilgiris 968 990 983 1015
Pudukkottai 976 965 1005 1015
Tamil Nadu 948 939 974 986
SR06: Sex ratio below 7 years
*: Districts that did not exist in 1991.
Source: Indian Censuses 1991 and 2001.
In Tamil Nadu in 2001, ten out of thirty districts had juvenile sex
ratios below the state average of 986, such as Dharmapuri (918 in 1991 to
878) and Salem (849 to 826) (Table 1). In 2001, the latter has the lowest JSR
of all districts in India. The 54 Indian districts that had a JSR below 900
were in the North in 1991, Salem excepted. But in 2001, more districts in
Tamil Nadu were under 900, such as Dharmapuri, which appears from that
moment as a highly discriminatory place. A decrease is observed in the
districts of Tamil Nadu. In 2001, the ratio increased in some districts, for
instance Madurai or the Nilgiris (Table 1).

Spatio-temporal trends of female discrimination in South India 72
In some parts of northern Tamil Nadu, the sex ratio at birth in 1999
also appears to be lower than the state average of 931, with the exceptionally
low figure of 858 in Salem. In the case of the SRB, the figures prove that the
districts with a low SRB can be linked to districts for which the figures are
abnormal for the other variables and to districts where infanticide is
recorded. The sex ratio is increasing in all the selected districts of Tamil
Nadu (Table 1) from 1991 to 2001, except in Dharmapuri; this trend
confirms that this district reacts later than the other discriminatory places.
Concerning the two districts of Salem and Dharmapuri, they have the highest
decline of sex ratio for 40 years, from 1961 to 1991. The sex ratio is around
930 – 940, whereas it is between 960 and 1015 in other districts.
Thus, the major cause of this female excess mortality is female
infanticide and more recently sex selective abortion. In 1999, this infanticide
amounted to 16 per cent of the female infant mortality in Tamil Nadu
(DANIDA Tamil Nadu Area Health Care Project – Phase III, 1999). At least
3 500 to 4 000 girls died in this way each year. The imprecision of the figure
results mainly from the registration of this type of death by the health
personnel (higher risk of under-registration). In 1999, infanticide would have
represented 64 per cent of the female infant deaths in Salem, 48 per cent in
Dharmapuri and 22 per cent in Madurai (DANIDA Tamil Nadu Area Health
Care Project – Phase III, 1999).
The figure below displays data from the region of Salem (which
included Dharmapuri until 1961), on the basis of populations classified
according to quinquennial age3. Figure 4 provides a comparison between
Salem and Dharmapuri with Tamil Nadu as a whole. It takes up the
aggregate data, relating them to the average date of birth of the generation
concerned. Thus, for the census of 1991, the SR of the 0-4 year age group is
placed in 1988-89, that of the 5-9 year age group is in 1983-84, and so on.
This juxtaposition of values enables one to date the assigned generations
affected by the changes in the differential mortality and sex selective
abortion. This graph makes it possible to distinguish the particular situation
in Salem, where the decline in the proportion of girls has been extremely rapid
and early. A polynomial smoothing of the data pertaining to Salem shows the
3 We have confined ourselves to populations of less than fifteen years, for which the effect of
migrations on the sex ratio is negligible. However, the inaccurate declarations of age can
affect girls and boys in a differential manner.

Gender discriminations at early stages of life in Asia 73
Figure 4: Child sex ratio estimated using census age distribution, Salem,
Dharmapuri and Tamil Nadu, 1950-2000
Note: Sex ratio of 0-5, 0-7, 5-10 and 10-15 age groups are plotted against their average year of birth.
Polynomial trend lines added.
Source: computed from the Census of India, various years. Vella 2005.
historical trend of the SR, which departs from a historical level of 980 and
begins to decline noticeably from the 1960s onward. The deterioration in sex
ratio accelerated during the years 1970-1990 and during this period the SR
declined even more, sinking below the value of 900 in 1991. However, the
JSR may reach a plateau during the next ten years since the extent of the
decrease seems to have somewhat slowed down. On the contrary, the
decrease has been growing during the 1990s in several low-JSR areas of
India (Premi 2001). The profile of Dharmapuri follows that of Salem,
however with a lag of more than ten years. The decrease recorded during the
1990s is also slightly under that of the previous decade. In the rest of Tamil
Nadu, the declining tendency of the infant SR is still later, and above all less
prominent (Vella 2005).
Micro-spatial trends in Tamil Nadu
Spatial analysis appears to be more appropriate and pertinent for presenting
the results, making possible a detailed study of the variations in the SR
800
850
900
950
1000
1950 1955 1960 1965 1970 1975 1980 1985 1990 1995 2000
sex
ratio
(pe
r 1
000
)
Dharmapuri
Salem
Tamil Nadu
Salem
Dharmapuri
Tamil Nadu

Spatio-temporal trends of female discrimination in South India 74
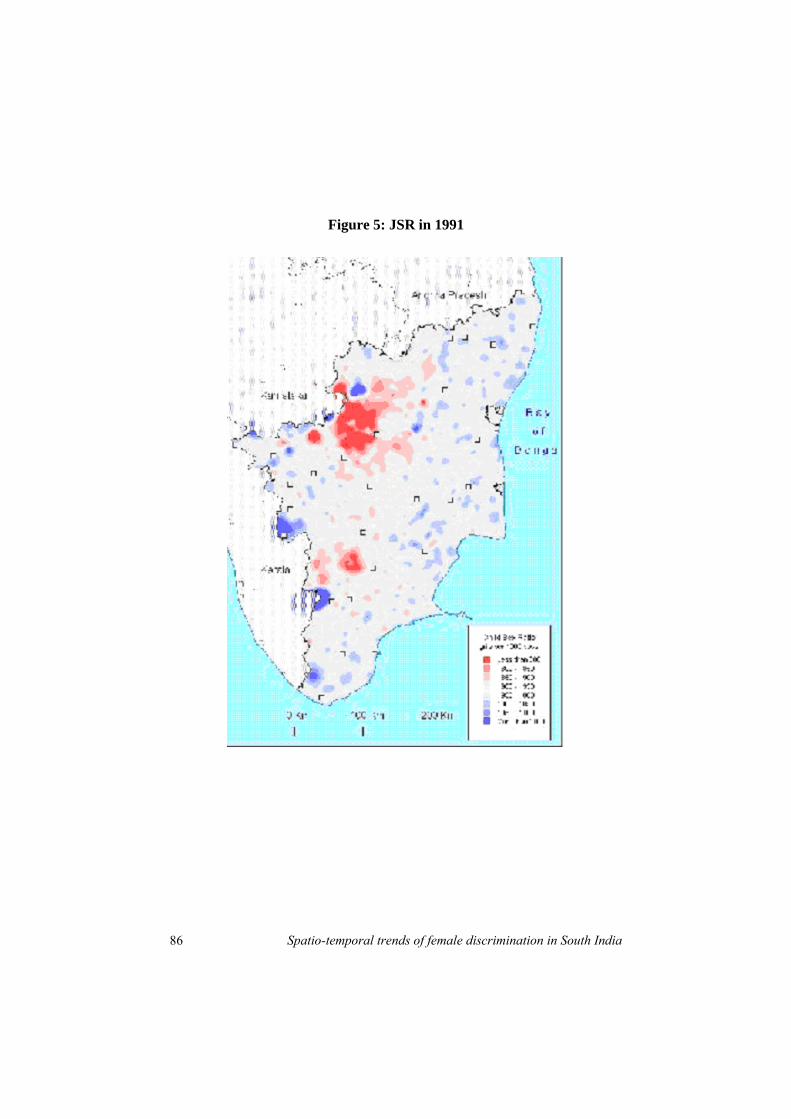
within the state. The map of Figure 5 represents the geographic
characteristics of the juvenile sex ratio in Tamil Nadu in 19914. This is a new
representation in the context of Indian research into questions of sex
discrimination. The point of departure for the spatial modelling was a
digitized map of South India. It represents all the villages of Tamil Nadu,
which were available for the first time as computerized data with the help of
the 1991 census (Guilmoto et al. 2002). The data, available in numerical
form, were systematically subjected to a series of tests relating to both
internal logic and external controls. The outliers and other erroneous data
were thus detected and corrected, using the printed publications of the
census when they were available. This leads to an improvement in the
statistics, which in turn makes the SIFP database a source of very good
quality. There are, however, villages for which the census estimates give rise
to doubt, as well as some that could not be precisely located. As there is but
one available source, and because some publications of the 1991 census
were belated, the spatialization of data has been made more complex. It was
at times necessary to use older maps and to combine all the available
cartographic sources to identify and locate the census villages. Various tests
have shown that local errors in localization do not exceed 500 metres, which
on the scale of South India is negligible.
In view of the very large number of village units in South India, an
aggregation of villages has been carried out calculating the spatial averages
and grouping them in a radius of 10 kilometres using the Thiessen-Voronoï
method (see annexe). This grouping limits both the number of statistical
units to be treated and the number of villages with populations that are too
low. In addition, units with less than 50 children were excluded. A spatial
interpolation was carried out with the amalgamated data of the JSR by the
ordinary kriging method, which is a standard geo-statistical technique of
estimation (Chou 1997). Then, the contouring of the homogeneous statistical
regions was carried out. The value of 900 was retained as the threshold of
abnormality of the JSR to facilitate the clarity of the map.
The map makes it possible to disaggregate large regional units and to
show with greater precision the micro-regional contours. It measures here
the intensity of sexual discrimination in Tamil Nadu. This cartography of the
JSR in 1991, (Figure 5) reveals the heterogeneity existing within the state. In
most areas, the SR of 0-6 years is over 950. But the situation shows itself to
be different in some apparently isolated pockets where the JSR is lower than
4 Similar village-level data from the 2001 census may not be available for several years.

Gender discriminations at early stages of life in Asia 75
average values, for example west of Madurai and in the Salem-Dharmapuri
pocket. One will again note the strong spatial compactness of the
phenomenon, which does not result of the geo-statistical smoothing carried
out on the basis of more detailed spatial data (Vella 2005). The proportion of
girls is the lowest in the north-west, and the highest in the south-east of
Tamil Nadu. Three taluks5 have particularly aberrant values: Sankari,
Mettur and Omalur (Salem district, map of Figure 7). The magnitude of
the girl-boy imbalance is considerable when the values below 660 are
observed in this area. These are regions where one out of three girls was
lacking, in 1991. At a more micro-level in this zone, numerous villages
with more than 2 000 inhabitants are to be counted where the JSR is
two boys for each girl. We have here without doubt the absolute peak of
discrimination against small girls in Tamil Nadu and even in India
(Vella 2005).
But, apart from that, it is advisable to consider the temporal evolution
since the census of 1991. The phenomenon has advanced and extended to
new taluks, and some authors mentioned, in 1996, a “contiguous belt” to
spatialize the female discrimination (Athreya and Chunkath 2000). This
zoning of discrimination begins in the western half of the district of Madurai
and extends across the districts of Salem and Dharmapuri as far as the
western part of North Arcot district (Vellore). In fact, infanticide was first
identified through the media in Madurai. Some believed the phenomenon
began there and then spread in an unknown manner to other, adjacent
districts 6. However, Salem appears clearly as another specific core area of
low juvenile sex ratios in Tamil Nadu. The districts in the south, the east and
the delta of the Kaveri River seem unaffected by infanticide. No anomaly
has been located in these zones, if not, in 1999, in some districts that are
located somewhat outside the Madurai-Salem axis. Another exception
concerns the two districts of Coimbatore and the Nilgiris, which, in the west
on the border of the corridor, do not seem affected by discrimination,
according to the presently available data (Vella 2005).
5 A taluk is an administrative division of the district. 6 The NGO Alternative for India Development challenged the revelations of the government
on infanticide (AID, 1999). In the beginning of the 1990s, infanticide was confined to
Madurai, according to the government, as no other data was published. The Community
Service Guild Salem and AID Dharmapuri thus disclosed infanticide to the media in these
zones, for they have worked for several years in these districts, but the results were not
accepted by the government until 1992. Then, the latter initiated, in 1997, a programme of
street theatre in Dharmapuri under the aegis of the Danish Agency for Development
Association, DANIDA (Athreya and Chunkath 2000).
Spatio-temporal trends of female discrimination in South India 76
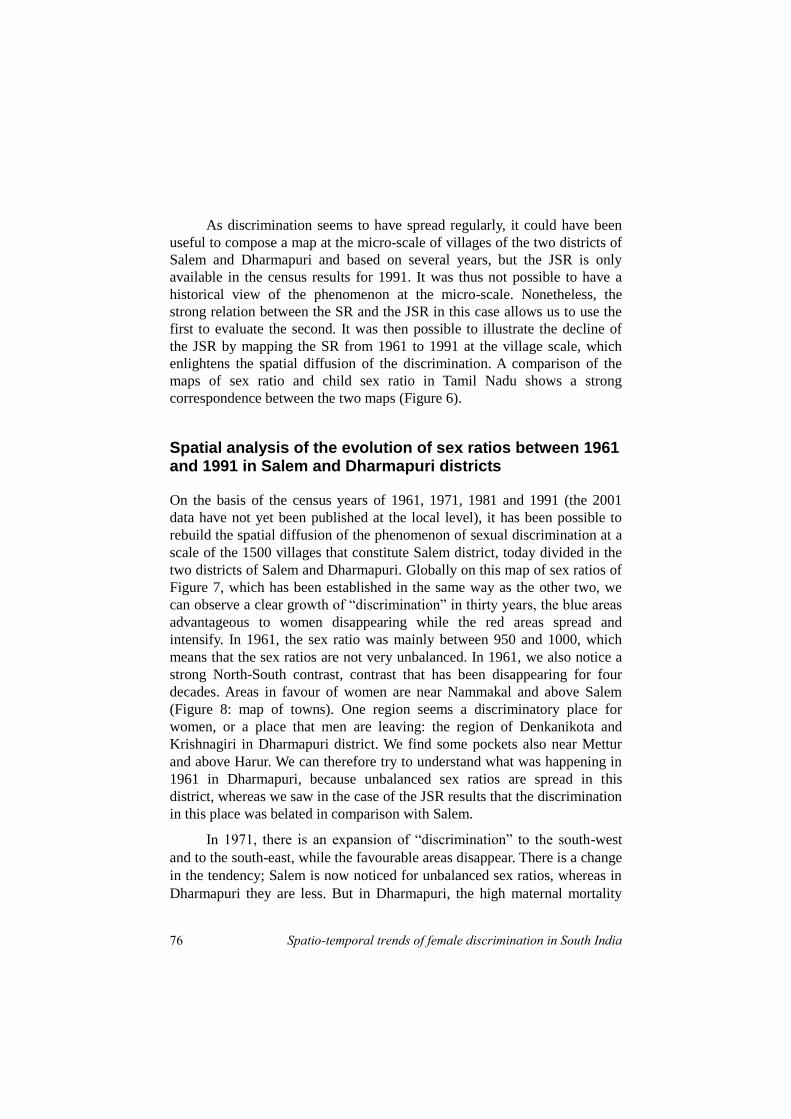
As discrimination seems to have spread regularly, it could have been
useful to compose a map at the micro-scale of villages of the two districts of
Salem and Dharmapuri and based on several years, but the JSR is only
available in the census results for 1991. It was thus not possible to have a
historical view of the phenomenon at the micro-scale. Nonetheless, the
strong relation between the SR and the JSR in this case allows us to use the
first to evaluate the second. It was then possible to illustrate the decline of
the JSR by mapping the SR from 1961 to 1991 at the village scale, which
enlightens the spatial diffusion of the discrimination. A comparison of the
maps of sex ratio and child sex ratio in Tamil Nadu shows a strong
correspondence between the two maps (Figure 6).
Spatial analysis of the evolution of sex ratios between 1961 and 1991 in Salem and Dharmapuri districts
On the basis of the census years of 1961, 1971, 1981 and 1991 (the 2001
data have not yet been published at the local level), it has been possible to
rebuild the spatial diffusion of the phenomenon of sexual discrimination at a
scale of the 1500 villages that constitute Salem district, today divided in the
two districts of Salem and Dharmapuri. Globally on this map of sex ratios of
Figure 7, which has been established in the same way as the other two, we
can observe a clear growth of “discrimination” in thirty years, the blue areas
advantageous to women disappearing while the red areas spread and
intensify. In 1961, the sex ratio was mainly between 950 and 1000, which
means that the sex ratios are not very unbalanced. In 1961, we also notice a
strong North-South contrast, contrast that has been disappearing for four
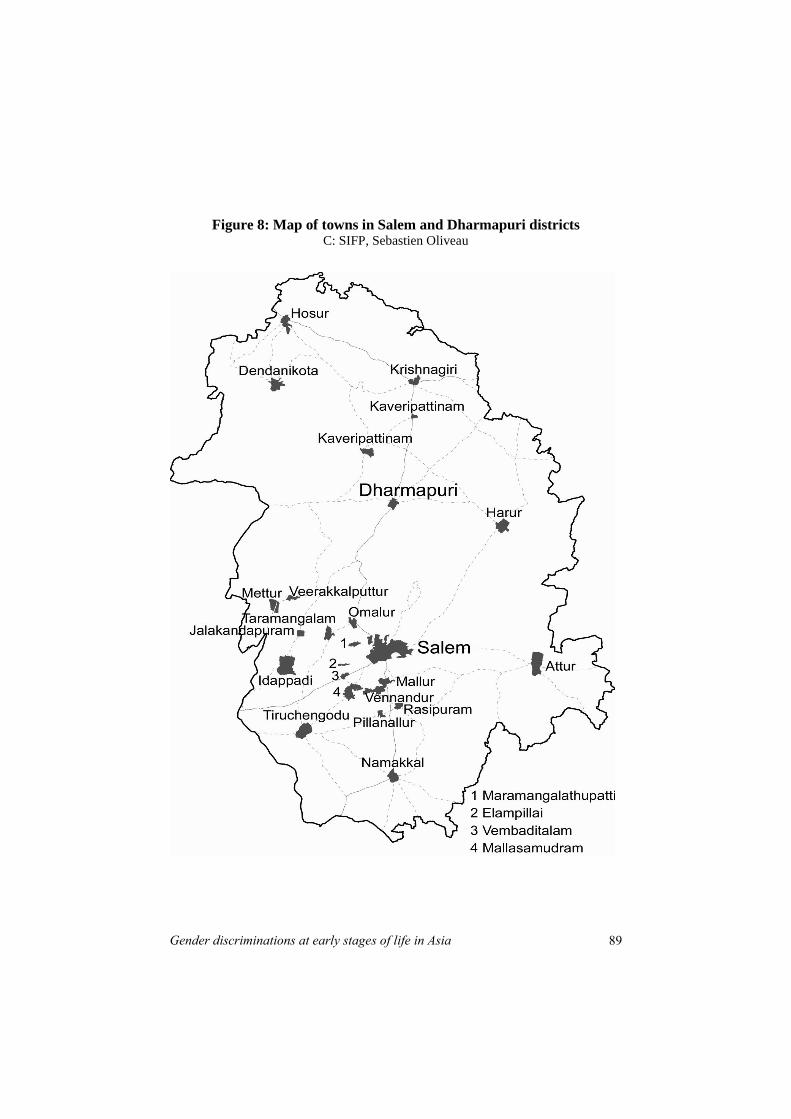
decades. Areas in favour of women are near Nammakal and above Salem
(Figure 8: map of towns). One region seems a discriminatory place for
women, or a place that men are leaving: the region of Denkanikota and
Krishnagiri in Dharmapuri district. We find some pockets also near Mettur
and above Harur. We can therefore try to understand what was happening in
1961 in Dharmapuri, because unbalanced sex ratios are spread in this
district, whereas we saw in the case of the JSR results that the discrimination
in this place was belated in comparison with Salem.
In 1971, there is an expansion of “discrimination” to the south-west
and to the south-east, while the favourable areas disappear. There is a change
in the tendency; Salem is now noticed for unbalanced sex ratios, whereas in
Dharmapuri they are less. But in Dharmapuri, the high maternal mortality

Gender discriminations at early stages of life in Asia 77
could have explained the places of discrimination, as this district is late in
development. After that, in 1981, it is in Salem that there is an accentuation
of “discrimination”. In 1981, we observe an extension of unbalanced sex
ratios to the west, north and south, with an accentuation of discrimination.
Observing the juncture of north and south on the west side of the districts,
there are no more favourable areas. We find the same pattern in 1981 as on
the map of Figure 5, the heart of discrimination near Idappadi and Omalur.
In 1991, there is a large diffusion, with a meeting of discrimination places;
discrimination is accentuated with increasingly lower sex ratios, less than
850. In 1991, there is a meeting of places in west and east. Of course, it is
difficult to understand all the factors that might explain this diffusion;
migratory mechanisms could be involved in the Dharmapuri villages, for we
are near Bangalore and there are significant migrations from this district to
Karnataka and Andhra Pradesh. But in Salem, this diffusion is no doubt
linked to the diffusion of discriminatory practices such as infanticide or sex
selective abortions. Areas advantageous to women are much less in 1991,
except for one small area near Namakkal and a bigger one in Krishnagiri;
this place could be a resistance pocket to “discrimination”.
Discrimination and diffusion
These sections establish the existence of pronounced sexual discrimination,
which is also dynamic in that it continues to progress and spread to new
regions and to new social groups.
This evolution reveals the typical mechanisms of diffusion. It would
be useful to understand at present how a social practice such as infanticide
emerged, in a particular period of time and in a precise socio-spatial field, to
then be propagated in a directional manner. This propagation seems, in fact,
to take place in a specific manner in space and in Tamil society. We have
clearly seen, on the basis of a new cartography, the spatial organization of
the phenomenon. The notion of diffusion helps one to envisage, from a
dynamic point of view, how this organization was put in place. The
definition of diffusion is the phenomenon of propagation, in time and space,
of a specific thing, such as an idea or a sociological or cultural practice,
among individuals or groups (Rogers 1995). The schema is perfectly
applicable to infanticide, the existence of which was probably very reduced
and localized more than fifty years ago. It could therefore be a recent

Spatio-temporal trends of female discrimination in South India 78
practice, and the 1971 map of Figure 8 could give us a good idea of the
beginning in the Salem area. The diffusion of a precise technique, such as
ultrasound scan, connected with that of selective abortion, is also at the heart
of our problematic (Vella 2005).
Once infanticide has appeared in a given region and in given
communities, a potential diffusion exists that is all the greater the higher the
group which adopts the practice stands in the social hierarchy and provides a
reference for the rest of the local society. One therefore expects to observe a
progressive spreading of new practices around a seat of original
dissemination, and this is the overall image of the geography of sexual
discrimination in Tamil Nadu, centred on Salem and Madurai and now
Dharmapuri. The practice of infanticide and selective abortions seems to
have been mainly promoted by the Kongu Vellalar Gounders (KVG), an
agricultural caste. They would have historically adopted infanticide for
different reasons, from change of economic status because of adoption of a
new activity of transport in the years 1960-1970 to the adoption of dowry
and a modification in their marriage pattern (from consanguineous to
hypergamic marriages). Thus, by way of social propagation, on the basis of
their dominant caste position, they would have transmitted the practice to
other communities in a favourable socio-economic context, especially in
Omalur and Edappady, where the literacy rate is very low compared with
other places in Salem and where the rate of scheduled castes with low
economic status is very high. We should point out that socio-economic
conditions are not very good in Dharmapuri and Salem districts. These are
dry districts, especially Dharmapuri; irrigation is very low there, agriculture
is more widespread, industry is belated, the urbanization and literacy rates,
especially for women, are also low in comparison with other districts.
Moreover, Dharmapuri is the most recent district in Tamil Nadu: here the
health results are also bad, maternal mortality and child mortality are the
highest in Tamil Nadu and the rate of working children, especially girls, is
very high. The Kongu Vellala Gounders would have played, therefore, the
role of a “pioneer” group that propagates an “innovation”, on the basis of
factors of social, cultural and geographic proximity. Furthermore, the KVG
settled in Dharmapuri district around 30 years ago after having bought land,
and they could have brought the practice with them, propagating it to lower
castes such as the Vanniars. In this caste of KVG, there was traditional
family planning to avoid the division of landed property. We observe the

Gender discriminations at early stages of life in Asia 79
same phenomenon in North India, where landed people discriminated
against their girls before the practice was adopted by the lower castes. The
diffusion will be here in the first place vertical on the social scale (top-down
model), from the elite to the whole of the local society.
The diffusion involved infanticide, but no doubt also other practices
such as dowry and the renunciation of marriage by preference. Even though
the effects vary according to social class, community and religion, spatial
proximity facilitates the propagation. It then combines with mechanisms of
horizontal diffusion, that is, across space, beyond highly homogeneous
communities existing in the small region of origin. This diffusion occurs
through the expedient of privileged channels which are socially structured:
the exchange cannot take place other than through individuals and social
groups which maintain contacts, and only has an effect in terms of the
quality and volume of the latter. In addition, strictly geographical distance
has a crucial bearing on the intensity of these exchanges. Interpersonal
exchanges remain, in fact, the favoured support of the communication of
information and the formation of systems of norms and representations.
The spatio-temporal evolution of the phenomenon remains also
closely linked to the medical, penal and political evolution in Tamil Nadu. In
effect, sex-selective abortion is today available throughout the state, owing
to the multiplication of private clinics and ultrasound scan equipment. The
reproductive practices of women have been subject to the strong impact of
the transfer of technology they have encountered by going to hospitals,
dispensaries and clinics for family planning, the monitoring of pregnancies,
or for childbirth.
While the diffusion of infanticide and selective abortion seemed, in
1991, limited to a few zones, it is without doubt, as we saw, much more
extensive today, extending beyond the historical region of its appearance.
Detailed data from the census of 2001 will make it possible to confirm these
hypotheses of diffusion. It remains that the declining tendencies of the
juvenile sex ratio, indicated by the available statistics, and considering that
the discrimination of girls in all forms has become stronger, foretell that the
new century will be characterized by a singular deficit of women in certain
parts of Tamil Nadu. Moreover, there is a clear transition from infanticide to
selective abortion, but NGOs working in the field say that infanticide is not
disappearing at all (being an additional effect more than a substitution). This

Spatio-temporal trends of female discrimination in South India 80
paper has clearly shown, through an examination of the social and spatial
contours of the phenomenon, that the dynamics of sexual discrimination is a
complex phenomenon that has its roots in the specificity of a regional
cultural area, in the consequences of structural economic changes that mark
rural India, and in the mechanisms of the diffusion of social change.

Gender discriminations at early stages of life in Asia 81
Annexe : How to process the data
Cartography is not a minor operation and, as it is a question of dealing with
70 000 units of South India, it is best to reflect upon the methods employed.
The first thing one notices when observing the size of the database is the
number of units that can be presented on one page. The representation of all
the villages of Tamil Nadu alone in a simplified area form (like the polygons
of Thiessen, for example) on an A4 (21cm x 29.7cm) page is already no
longer possible. Among other solutions, we chose the use of a continuous
range of values, rather than of points and polygons. This makes it possible to
leave these representational problems by forming a continuous grid of pixels
that eliminates direct references to villages.
The solution, which consists in aggregating the data according to a
defined spatial procedure, corresponds to the creation of a new point situated
at the centre of gravity of the concerned points, defined according to a
spatial rule. For example, all the original villages less than 5 kilometres will
be aggregated and their data combined to form a new statistical unit. The
spatialization of phenomena will be given greater consideration if the data
are aggregated under application of a spatial constraint than if a pre-defined
grid is employed. Underlying this operation is the geographic rule that the
objects closest to each other have the greatest resemblance; this is the
principle of spatial autocorrelation.
Although this procedure is not always expedient, it has two reasons for
being so in our case. On the one hand, the aggregation of data is legitimate;
there is no risk of eliminating a strong heterogeneity of demographic
characteristics. On the other hand, and this is an important point, the
aggregation allows of the reduction of the statistical noise produced by the
small units. It is, in fact, hazardous to use villages with populations that are
too low to allow of a calculation of the indices.
The other solution tends to eliminate references to the administrative
framework of the existing habitat. The grid obtained represents the variations
of the studied phenomenon in a continuous manner in space; one moves, in
fact, from a territorial approach to a spatial approach that is much richer in
information. To this purpose, the map must be transformed into an
orthogonal grid formed of elementary cells (pixels). The smaller the pixel,
the finer will be the grid and the database will be correspondingly large. In
each pixel, the corresponding value will be calculated by weighting the

Spatio-temporal trends of female discrimination in South India 82
values of the villages that are present within the pixel, or by interpolating the
value of the surrounding villages. A spatial smoothing is thus carried out,
eliminating the punctual representation of each value to give the regional
tendencies of the phenomenon. The resulting map is much easier to read
because it erases the micro-variations that would not be legible.
Our procedure combines these solutions. One first carries out a spatial
aggregation, which significantly reduces the number of demographic units.
The aggregation makes it possible to remove the majority of units the sizes
of which are too low. Second, a spatial smoothing makes it possible to
reconstitute regional tendencies.
The level of aggregation retained is 5 kilometres, as it allows us to
compare all the southern states and satisfactorily increases the soundness of
the variables. Fewer than one hundred clusters have then a population of less
than 1 000 inhabitants. Another not insignificant advantage is that the
number of units to be analysed is considerably decreased, becoming
somewhat less than 7 000.
This reduction makes it possible to carry out the method of smoothing
in a reasonable period of time, as the volume of calculations naturally
corresponds to the number of geographic units considered. For the
smoothing of data we shall use the kriging method. This method is based on
a model of spatial autocorrelation and, as such, rests upon quite weighty
calculations.
A contouring can be applied so as to bring certain zones to the fore.
However, although the contouring appreciably improves the reading, it sets a
trap for the reader: by doing away with the continuous aspect of the
variation, it gives the impression of a division between each zone and of
creating classes of values that may be arbitrary.
It is, therefore, necessary to keep in mind that the data obtained appear
in a distinctive and continuous manner, whereas the choice of values for the
contouring is arbitrary. In the same way, one cannot “look for one‟s village”
on the map. The variations expressed are local tendencies, based on
averages, and sometimes conceal more complex local situations.
The aggregation was devised by C.Z. Guilmoto.

Gender discriminations at early stages of life in Asia 83
Number
of
villages
Village
size Inhabitants Men Women Sex
Ratio
Distance
between
villages
1991 2047 2417 4948381 2556633 2391748 935 3,8 Km
1981 2040 2085 4253059 2174904 2078155 956 3,8 Km
1971 2001 1862 3726338 1893142 1833206 968 3,8 Km
1961 1462 2106 3078782 1554768 1524014 980 4,4 Km
Of the 2 200 villages of the database : 677 villages (1/3) did not exist
in 1961, 170 villages (8%) existing in 1961 were grouped, 1 353 (61.5%)
underwent no geographical change.
The cluster size depends on the middle distance between villages
(from 4,4 km in 1961 to 3,8 km in 1991). 529 clusters remain. Villages with
less than 200 inhabitants in 1991 have been suppressed.
References
AGNIHOTRI, S.B. (2000), Sex Ratios Patterns in the Indian Population, Delhi: Sage,
379 p.
ATHREYA, V. and CHUNKATH, S.R. (2000), „Tackling Female Infanticide, Social
Mobilisation in Dharmapuri, 1997-1999‟, Economic and Political Weekly,
Vol. 35, No. 49, pp. 4345-4348.
CHOU, Y.H. (1997), Exploring Spatial Analysis in Geographic Information Systems,
Santa Fe: Onword Press, 474 p.
DAS GUPTA, M., CHEN, L.C. and KRISHNAN, T.N. (eds.), 1995, Women's Health in
India. Risk and Vulnerability, Delhi: Oxford University Press, 320 p.
DANIDA (1999), Tamil Nadu Area Health Care Project – Phase III.
DEEPS (2000), Status of Children in Dharmapuri District, DEEPS, Pennagaram,
55 p.
Government of India (1991), Socio-Cultural Tables, Vol. 1, Census of India,
Series 1, Part IV A-C Series, Delhi: 359 p.
Government of India (1999), Compendium of India’s Fertility and Mortality
Indicators, 1971-1997, Based on the Sample Registration System, Delhi:
Registrar General of India, 415 p.

Spatio-temporal trends of female discrimination in South India 84
Government of Tamil Nadu (1999), Gender and Health, Chennai: Directorate of
Public Health and Preventive Medicine, 39 p.
GUILMOTO, C.Z., OLIVEAU, S. and VINGADASSAMY, S. (2002), „Un système
d'information géographique en Inde du Sud: Théorie, mise en œuvre et
applications thématiques‟, Espace, Populations et sociétés, pp.147-163.
International Institute for Population Sciences (2000), National Family Health
Survey (NFHS 2, 1998-1999), Mumbay, IIPS, 443 p.
MAYER, P. (1999), „India‟s Falling Sex Ratios‟, Population and Development
Review, Vol. 25, No. 2, New York: pp. 323-343.
MAZUMDAR, V. (1994), „Amniocentesis and Sex Selection‟ in Occasional Paper,
No. 21, Delhi: Centre for Women's Development Studies, 22 p.
MILLER, B. (1997), The Endangered Sex: Neglect of Female Children in Rural
North India, Oxford: Oxford University Press, 223 p.
PANIGRAHI, L. (1972), British Social Policy and Female Infanticide in India, Delhi:
South Asia Books, 204 p.
PREMI, M.K. (2001),„The Missing Girl Child‟, Economic and Political Weekly,
Vol. 36, May 26, pp. 1875-80.
Research Center for Women's Studies (1994), A Lesser Child: Girl Child in India,
Mumbay: RCWS, pp. 11-15, 65-66.
RIVERS, W.H.R. (1986), The Todas, Delhi: Rawat Pub., 416 p.
ROGERS, E.M. (1995), Diffusion of Innovations, New York: The Free Press, 518 p.
SUDHA, S. and RAJAN, I.S. (1999), „Female Demographic Disadvantage in India
1981-1991: Sew Selective Abortions and Female Infanticide‟, Development and
Change, Vol. 30, No. 3, pp. 585-618.
SUNANDA, K.S. (1995), Girl Child Born to Die in Killing Fields, Chennai:
Alternative for India Development, 108 p.
THURSTON, E. (1975), Castes and Tribes of Southern India. The Native Races of
India, Vols. III and VII, Delhi: Cosmo Publications, pp. 52-91, 360-389,
416-421.
VELLA, S. (2005), „Trends and Differentials of Female Discrimination in South
India: A Case Study of Salem District, Tamil Nadu‟ in GUILMOTO and RAJAN
(eds.), Fertility transition in South India, SAGE.
VISARIA, L. (1999), „Deficit of Women in India. Magnitude, Trends, Regional
Variations and Determinants‟ in Bharathi R. and Basu A. (eds.), From
Independence Towards Freedom, Delhi: Oxford University Press, 248 p.

Gender discriminations at early stages of life in Asia 85
Figure 1: Map of India
Spatio-temporal trends of female discrimination in South India 86
Figure 5: JSR in 1991

Gender discriminations at early stages of life in Asia 87
Figure 6: Map of Juvenile Sex Ratios and
Sex Ratios in Tamil Nadu, 1991 C: SIFP, Sebastien Oliveau

Spatio-temporal trends of female discrimination in South India 88
Figure 7: Maps of sex ratio in Salem and Dharmapuri districts,
Tamil Nadu, 1961-1991 C: SIFP, Sebastien Oliveau
Gender discriminations at early stages of life in Asia 89
Figure 8: Map of towns in Salem and Dharmapuri districts C: SIFP, Sebastien Oliveau
