spatiotemporal changes and drivers of trophic status over
TRANSCRIPT

Preprint of Ecological Engineering 151 (2020) 105861. https://doi.org/10.1016/j.ecoleng.2020.105861
0
Spatiotemporal changes and drivers of trophic status over three decades in the 1
largest shallow lake in Central Europe, Lake Balaton 2
3
István Gábor Hatvani a*, Vinicius Deganutti de Barrosb, Péter Tanosc, József Kovácsd, 4
Ilona Székely Kovács e, Adrienne Clement f 5
6
a Institute for Geological and Geochemical Research, Research Centre for Astronomy and 7
Earth Sciences, Budaörsi út 45, H-1112 Budapest, Hungary; [email protected] 8
b Szent István University, Institute of Environmental Science, department of Water 9
Management; H-2100 Gödöllő, Páter Károly utca 1. Hungary; [email protected] 10
c Szent István University, Faculty of Mechanical Engineering; H-2100 Gödöllő, Páter Károly 11
utca 1. Hungary; [email protected] 12
d Eötvös Loránd University, Department of Geology, H-1117 Budapest, Pázmány P. stny 1/C., 13
Hungary; [email protected]; 14
e Budapest Business School University of Applied Sciences Faculty of Commerce, Catering 15
and Tourism, Department of Methodology, H-1054 Budapest, Alkotmány utca 9-1; 16
f Budapest University of Technology and Economics, Department of Sanitary and 18
Environmental Engineering, H-1111 Budapest, Műegyetem rakpart 3., Hungary; 19
21
*Corresponding author. Address: Institute for Geological and Geochemical Research, Research 22
Centre for Astronomy and Earth Sciences, Budaörsi út 45, H-1112 Budapest, Hungary 23
Tel.: +36 70317 97 58; fax: +36 1 31 91738. E-mail: [email protected] 24
25

Preprint of Ecological Engineering Volume 98, 804-811 https://doi.org/10.1016/j.ecoleng.2020.105861
1
Abstract: The over-enrichment of shallow lakes in nutrients has emerged as one of the 26
main causes of water quality deterioration, and is today a major focus of water quality studies 27
worldwide. In the present work, changes in trophic conditions over three decades (1985-2017) 28
in the largest shallow freshwater lake in Central Europe, Lake Balaton, are assessed using the 29
time series of 10 water quality variables measured at 4 sites, one in each basin of the lake. Using 30
combined cluster and discriminant analyses, and assessing each of the four basins of the lake 31
separately, it was possible to divide the history of the lake into three time intervals. Principal 32
component and Sen’s slope analyses highlight the fact that the oligotrophization of the lake took 33
place at a different pace in each of these three major time intervals (1985-1994; 1995-2003; 34
2004-2017) along the lake’s major axis. A significant decrease in the concentration of 35
parameters indicating trophic conditions (e.g. chlorophyll-a and soluble reactive phosphorus) 36
was first observed in the western basins, in the proximity of the main water input to the lake, 37
followed by the eastward spread of this phenomenon. At the same time, the importance of 38
external total phosphorus input to the lake was found to decrease easttwards, thereby 39
diminishing its capacity to explain the variance of the water quality parameters in the lake. Over 40
the time period covered by this study, various measures were taken to reduce the nutrient loads 41
to the lake. These were, in the main, successful, as may be seen in the decade-by-decade 42
overview of the lake’s trophic state presented here. A brief review of similar cases from around 43
the world only serves to reinforce the conclusion that a drastic reduction in external phosphorus 44
loads arriving in similar shallow lakes will result in their oligotrophization, albeit with a time-45
lag of at least ten years. 46
47
Keywords: CCDA; trophic status; oligotrophization; Sen’s trend analysis; principal component 48
analysis, Lake Balaton 49
50

Preprint of Ecological Engineering Volume 98, 804-811 https://doi.org/10.1016/j.ecoleng.2020.105861
2
1. Introduction 51
Nutrient over-enrichment deriving from intensive anthropogenic activity in the 52
watersheds of lakes has emerged as one of the main causes of deterioration in water quality 53
(e.g. (Scheffer 2013, Schindler 1974, Schindler et al. 2016, Wetzel 2001)), leading eventually 54
to the degradation of macrophyte vegetation, increased turbidity and, in extreme cases, anoxic 55
conditions (Lau & Lane 2002). The harmful effects of toxic cyanobacterial blooms endanger 56
aquatic food production and supplies of water for recreation and drinking, leading, in turn, to 57
economic losses, too. 58
In order to prevent the eutrophication of surface waters, inorganic nutrient inputs must be 59
retained. Evidence shows that, of the inorganic nutrients, it is phosphorus (P) whose retention 60
has the most beneficial effect on the trophic and ecological status of formerly eutrophic lakes 61
(e.g. Sas 1990, Schindler 1974, Schindler et al. 2016, Vitousek et al. 2010). Neither can the role 62
of N be neglected, since in estuaries or coastal environments it is a key factor (Carpenter 2008), 63
and excess reduction of trophic conditions has been achieved by managing not only P but N 64
inputs as well (EPA 2015). Nevertheless, interventions exclusively aimed at N loads will not 65
lead to the desired oligotrophic states; this can only be achieved by reducing P as well (e.g. 66
Carpenter 2008, Schindler et al. 2016, Welch 2009). In spite of the fact that freshwater 67
eutrophication has become a widespread problem over the past half-century and there have been 68
many studies on how to prevent its harmful effects, globally, the number of toxic phytoplankton 69
blooms has continued to increase (Ho et al. 2019, Hudnell 2008). 70
A trophic classification of surface waters was first developed in the late 1960s in Europe 71
(Rodhe 1969), and further developed over succeeding decades. One of the most commonly used 72
indices for the definition of the trophic state of lakes is the trophic state index (Carlson 1977) 73
relying primarily on the concentration of surface water chlorophyll-a, surface water total 74
phosphorus concentration (TP) and the Secchi depth of a given lake (Wen et al. 2019). Another 75
Preprint of Ecological Engineering Volume 98, 804-811 https://doi.org/10.1016/j.ecoleng.2020.105861
3
widespread classification was formulated in the early 80s by the Organization for Economic 76
Co-operation and Development (OECD), defining the classification of trophic status for 77
freshwater lakes primarily on the basis of the concentration of TP and Chl-a in the water 78
(Vollenweider & Kerekes 1982). It is these parameters which still constitute the focus of more 79
recently developed models for eutrophication (e.g. (Markad et al. 2019, Wen et al. 2019)). 80
Therefore, the combined decadal assessment of these parameters is capable of yielding excess 81
information on the effect of external measures aimed at shifting the trophic condition of lakes 82
towards oligotrophization. 83
One of the most endangered ecosystems in this respect is shallow lakes, which are defined 84
by being well mixed (that is, when subjected to an average wind velocity of 20 km h-1 for > 6 85
h they will mix through their water column (Chapman 1996)), therefore besides their relatively 86
large surface-to-depth ratio, they are characterized by intense lake-land, air-water and water-87
sediment interactions (Wetzel 2001). These interactions render the eutrophication process and 88
formation mechanisms of algal blooms particularly complicated (Qin et al. 2007); they also 89
differ greatly between individual shallow lakes (Janssen et al. 2014). Examples of the adverse 90
effects of algae blooms on shallow lakes have been reported all over the world, e.g. Asia (Qin 91
et al. 2007); North America (López-López et al. 2016, Oberholster et al. 2006); Europe (Hatvani 92
et al. 2014, Sebestyén et al. 2019); South America (Oliveira & Machado 2013) and Africa (Muli 93
1996). 94
When focusing on the eutrophication of shallow lakes, besides external nutrient loads, the 95
resuspension-desorption of phosphorus from the sediment should also be taken into account, 96
since it plays an important role in the overall nutrient dynamics of shallow lakes (Bloesch 1995). 97
Indeed, even in the case of reduced external nutrient loads, internal phosphorus load may 98
prevent improvements in lake water quality. At high internal loading, TP concentrations may 99
Preprint of Ecological Engineering Volume 98, 804-811 https://doi.org/10.1016/j.ecoleng.2020.105861
4
rise and phosphorus retention can be negative especially in summer (Hatvani et al. 2014, 100
Søndergaard et al. 2003). 101
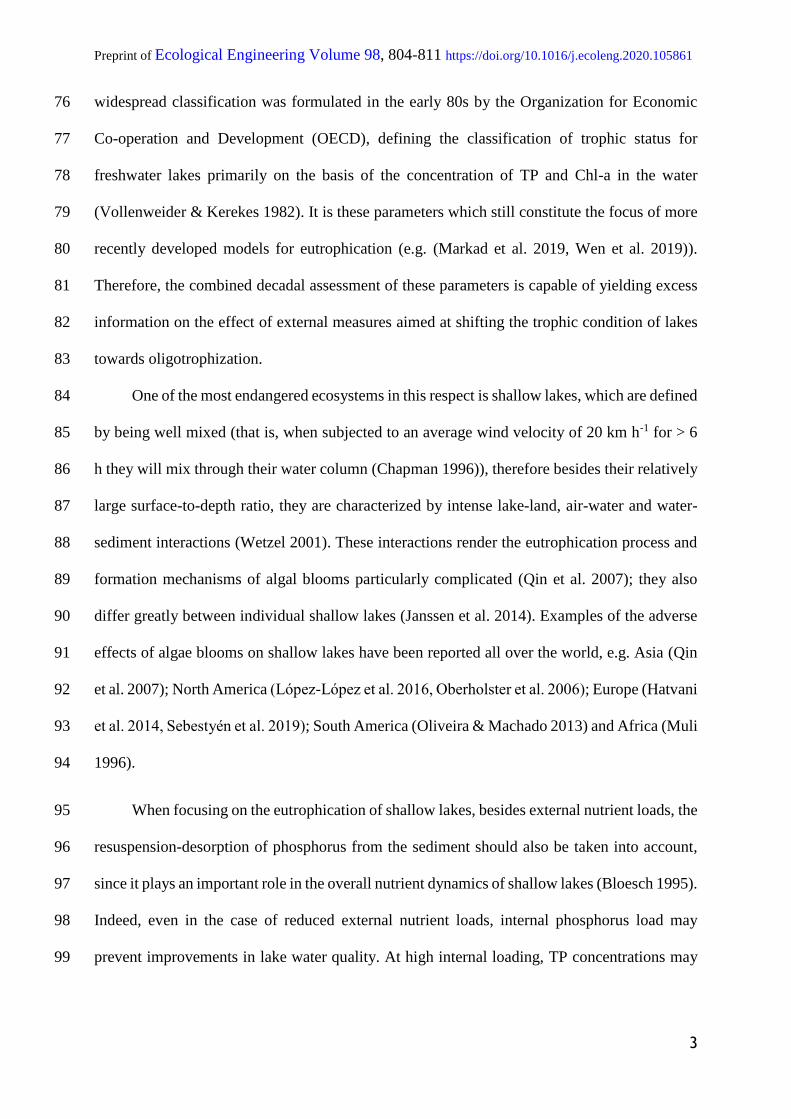
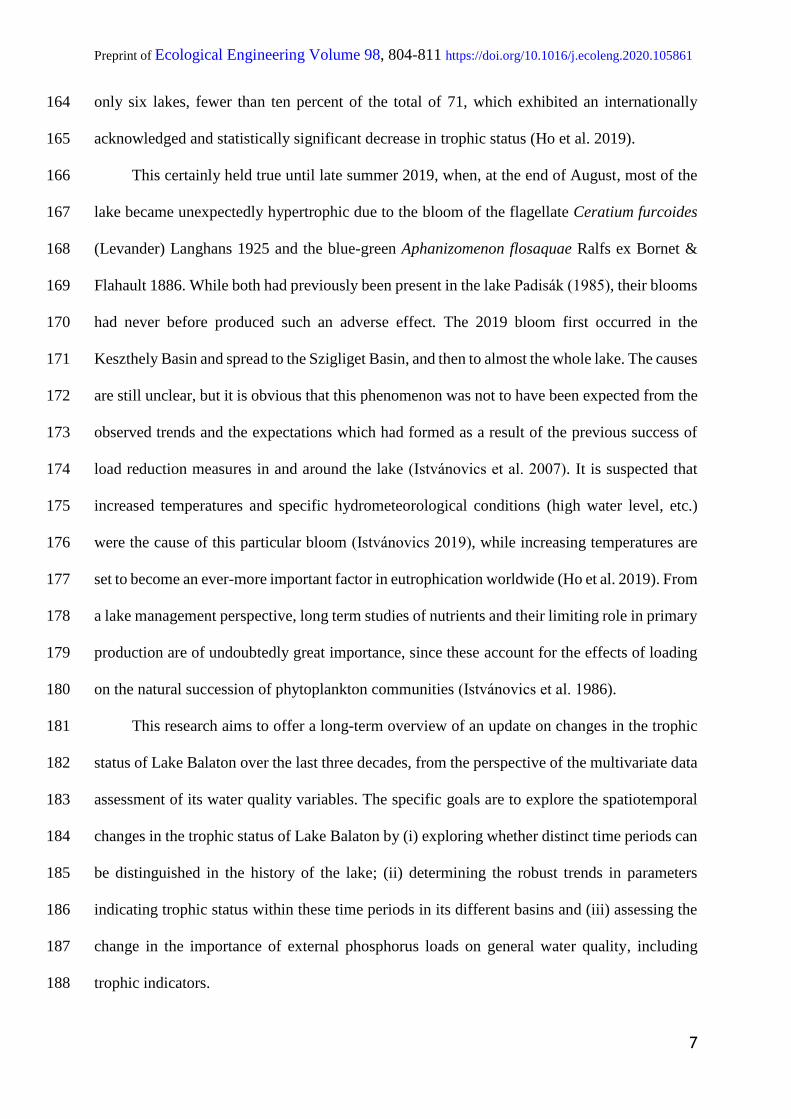
Lake Balaton, the largest (surface area 596 km2) shallow (average water depth 3.2 m) 102
freshwater lake in Central Europe (Fig. 1), has suffered from adverse anthropogenic effects over 103
the last half century (see later; e.g. Hatvani et al. 2014, Padisák & Reynolds 2003). The lake’s 104
watershed area is approximately 5180 km2 (Pomogyi 1996), and it may be characterized as 105
polymitic. The mean depth and surface area of the lake’s geographical basins increases 106
eastwards from 38 km2 to 228 km2, while their corresponding sub-watersheds decreases from 107
2750 km2 to 249 km2 (Istvánovics et al. 2007). The largest tributary, the River Zala, which 108
enters the lake at its westernmost and smallest basin, Keszthely Basin (I. in Fig. 1), supplies 109
~50% of the lake’s total water input and accounts for 35-40% of the lake’s nutrient input 110
(Istvánovics et al. 2007). The lake’s only outflow is the Sió Canal, located at its easternmost 111
end, and this was constructed in the nineteenth century to regulate the water level of the lake. 112
113
114
Preprint of Ecological Engineering Volume 98, 804-811 https://doi.org/10.1016/j.ecoleng.2020.105861
5
Fig. 1. Lake Balaton, its geographical basins and the 10 sampling sites operated by the 115
responsible water authority up to 2005. In addition, the Kis-Balaton Water Protection 116
System (KBWPS) and Lake Balaton’s watershed is marked on the outline map of 117
Hungary. The sampling sites marked with a red circle (those used in the present work) 118
and site 10 were operating after 2005. The figure is based on that in (Kovács et al. 119
2012b). 120
121
The accelerated anthropogenic activity (population growth, increasing waste water 122
production, intensified use of fertilizers) in the catchment of Lake Balaton in the second half of 123
the twentieth century resulted in a significant increase in external nutrient load (Hatvani et al. 124
2015) and a deterioration in the lake’s water quality (Sebestyén et al. 2017), and by the end of 125
the 1980s the P load carried by river Zala had doubled (Fig. 2a) compared to the beginning of 126
the 1970s (Herodek et al. 1982, Istvánovics et al. 2007, Sagehashi et al. 2001). For this reason, 127
a regional nutrient load control strategy was worked out for Lake Balaton (Somlyódy & van 128
Straten 1986), with the most important management measures being: (i) sewage diversion from 129
the eastern and southern shoreline settlements; (ii) the construction of WWTPs in the western 130
part of watershed; (iii) the downsizing of several large livestock farms (Hatvani et al. 2015); 131
and (iv) the construction of the Kis-Balaton Water Protection System (KBWPS) (Hatvani et al. 132
2011, Kovács et al. 2010, Kovács et al. 2012a), the aim of which was the retention of nutrient 133
loads from the Zala River which would have otherwise ended up in Lake Balaton; for further 134
details see e.g. (Clement et al. 1998, Hatvani 2014, Hatvani et al. 2014, Hatvani et al. 2015) 135
The combination of these measures and the ten-fold drop in fertilizer usage in the late 1980s 136
(Hatvani et al. 2015) resulted in a TP load reduction of more than 50% compared to the 1980s 137
(Hatvani 2014). Nevertheless, the oligotrophization of Lake Balaton – and especially its 138
Preprint of Ecological Engineering Volume 98, 804-811 https://doi.org/10.1016/j.ecoleng.2020.105861
6
easternmost basin – occurred, albeit with a delay, due to the presence of internal P loads from 139
its sediment (Istvánovics et al. 2004). 140
As is the case with many temperate shallow lakes, primary production in Lake Balaton 141
was considered to be P limited (Herodek 1984), while, studies in past decades had focused on 142
the importance of external vs. internal N loads (Présing et al. 2001, Présing et al. 2008). The 143
role of P and N in algal biomass growth was investigated in a way similar to that employed by 144
Schindler (1974) in the Experimental Lakes Area, and it was found that with an increased 145
external P load, algal biomass grew, while N inputs increased the abundance of N-fixing 146
cyanobacteria (Istvánovics et al. 1986). Thus, the more severe limitation of phytoplankton 147
production by P, as compared to that caused by N is also acknowledged in the case of Lake 148
Balaton (Istvánovics & Herodek 1995, Istvánovics et al. 1986), though it should be recognized 149
that N is found to limit primary production under extreme circumstances, e.g. an abrupt increase 150
in algal biomass (Présing et al. 2008). 151
With regard to the internal P loads of Lake Balaton, it was found that their maxima are 152
determined by the long-term behavior of the highly calcareous sediment. In the years when the 153
internal P load approaches its maximum, a strong correlation can be observed between the 154
biomass of phytoplankton and the estimated concentration of mobile P, under the influence of 155
the carbonate content of the sediment (Istvánovics 1988). Otherwise, the biomass of 156
phytoplankton is kept below the highest possible level by physical constraints which depend on 157
hydrometeorological conditions (Hatvani et al. 2014). Consequently, because of this delayed 158
response in lakes (Sas 1990) it is sometimes hard to find a direct correlation between external 159
load reduction and water quality improvement, particularly over short time periods. In the case 160
of Lake Balaton, thanks to the conscious efforts of the authorities, eutrophication has been 161
successfully managed (Istvánovics et al. 2007). In spite of the global increase in intense lake 162
phytoplankton blooming since the 1980s, in a worldwide study, Lake Balaton remains one of 163
Preprint of Ecological Engineering Volume 98, 804-811 https://doi.org/10.1016/j.ecoleng.2020.105861
7
only six lakes, fewer than ten percent of the total of 71, which exhibited an internationally 164
acknowledged and statistically significant decrease in trophic status (Ho et al. 2019). 165
This certainly held true until late summer 2019, when, at the end of August, most of the 166
lake became unexpectedly hypertrophic due to the bloom of the flagellate Ceratium furcoides 167
(Levander) Langhans 1925 and the blue-green Aphanizomenon flosaquae Ralfs ex Bornet & 168
Flahault 1886. While both had previously been present in the lake Padisák (1985), their blooms 169
had never before produced such an adverse effect. The 2019 bloom first occurred in the 170
Keszthely Basin and spread to the Szigliget Basin, and then to almost the whole lake. The causes 171
are still unclear, but it is obvious that this phenomenon was not to have been expected from the 172
observed trends and the expectations which had formed as a result of the previous success of 173
load reduction measures in and around the lake (Istvánovics et al. 2007). It is suspected that 174
increased temperatures and specific hydrometeorological conditions (high water level, etc.) 175
were the cause of this particular bloom (Istvánovics 2019), while increasing temperatures are 176
set to become an ever-more important factor in eutrophication worldwide (Ho et al. 2019). From 177
a lake management perspective, long term studies of nutrients and their limiting role in primary 178
production are of undoubtedly great importance, since these account for the effects of loading 179
on the natural succession of phytoplankton communities (Istvánovics et al. 1986). 180
This research aims to offer a long-term overview of an update on changes in the trophic 181
status of Lake Balaton over the last three decades, from the perspective of the multivariate data 182
assessment of its water quality variables. The specific goals are to explore the spatiotemporal 183
changes in the trophic status of Lake Balaton by (i) exploring whether distinct time periods can 184
be distinguished in the history of the lake; (ii) determining the robust trends in parameters 185
indicating trophic status within these time periods in its different basins and (iii) assessing the 186
change in the importance of external phosphorus loads on general water quality, including 187
trophic indicators. 188

Preprint of Ecological Engineering Volume 98, 804-811 https://doi.org/10.1016/j.ecoleng.2020.105861
8
189
2. Materials and methods 190
2.1. Sampling sites and acquired dataset 191
In the course of the research 10 water quality parameters were selected for analysis. These were 192
measured bi-weekly/monthly at four sampling sites between 1985 and 2017 (that is, the last 193
year for which overall data for the Lake were available), one from each geographical basin of 194
the lake (Fig. 1), a total of approximately 5,600 data. The data were acquired from the Central 195
Transdanubian Water and Environmental Inspectorate, and had been collected as a part of the 196
National Water Quality Monitoring System. 197
Due to the occasionally insufficient number of samples and/or their values being below 198
the level of detection (LOD), the set of parameters analyzed was restricted to the following: 199
soluble reactive phosphorus (SRP), total phosphorous (TP), chlorophyll-a (Chl-a; mg l-1), 200
electrical conductivity (EC; µS cm-1), ammonium – N (NH4 – N), dissolved oxygen (DO; 201
biological oxygen demand (BOD), chemical oxygen demand (COD), Water temperature (TW; 202
°C) and pH. These parameters were chosen so as to provide continuous temporal coverage over 203
the whole of the investigated time interval as they were consistently measured using the same 204
methods and at the same locations. It should be noted that in 2005 the monitoring was spatially 205
recalibrated (Kovács et al. 2012b). In relation to this point, because of these changes, most 206
forms of N had to be omitted from the evaluation. Total nitrogen was not recorded up to 2004, 207
while in 80% of cases, the values of nitrate-N after the recalibration of the monitoring network 208
in 2005 were below the LOD. Thus, neither could have been incorporated into the study. 209
However, data concerning ammonium-nitrogen were available for the complete period, and it 210
is this form which is in any case the preferred N form for algal N uptake in Lake Balaton 211
(Présing et al. 2001), as indeed in other lakes, also (Mitamura et al. 1995). 212
213
Preprint of Ecological Engineering Volume 98, 804-811 https://doi.org/10.1016/j.ecoleng.2020.105861
9
2.2. Methodology 214
After preprocessing the data (outlier detection and filtering of typos), its descriptive 215
statistics (mean, median, coefficient of variation etc. following Kovács et al. (2012c)) were 216
calculated basin by basin to obtain an overview of the dataset. The next step was to use the 217
available indicator variables to shed light on decadal change in the trophic status of the various 218
basins of the lake following the standard OECD classification (Vollenweider & Kerekes 1982), 219
which is the most widely accepted worldwide (Istvánovics 2009). This classification estimates 220
the trophic status of a water body primarily using information on the concentration of the 221
limiting nutrients (TP) and a proxy for phytoplankton biomass (Chl-a). It had been previously 222
used in the case of Lake Balaton (e.g. Crossetti et al. 2013, Istvánovics et al. 2007) and in 223
numerous studies worldwide (e.g. Cloutier & Sanchez 2007, Marsden 1989), thereby ensuring 224
the comparability of the results of the present study on a global scale. The question of whether 225
time intervals with common patterns exist in the water quality parameters (WQP) time series 226
was investigated by using combined cluster and discriminant analysis (CCDA (Kovács et al. 227
2014; Section 2.2.1) on the annual averages of the WQPs. Next, exploratory principal 228
component analysis (PCA; Section 2.2.2) was conducted on the annual averages of the variables 229
in the different basins to explore whether gradually changing common trends might be found 230
as the distance from the lake’s main input, the River Zala, increased. 231
Lastly, the magnitude of change in the concentrations of Chl-a and the P forms was 232
explored for the whole lake basin by basin, using the nonparametric Mann– Kendall test 233
(Kendall 1975, Mann 1945) and Sen's slope estimates (Sen 1968) for the previously obtained 234
differing time intervals using the monthly averaged concentrations of the parameters as the 235
input. In each time interval the annual change in the parameters’ values – obtained from the 236
estimated Sen’s slope - was given as a percentage of the average concentration of the given 237
parameter in the investigated time interval and basin. 238
Preprint of Ecological Engineering Volume 98, 804-811 https://doi.org/10.1016/j.ecoleng.2020.105861
10
239
2.2.1. Combined cluster and discriminant analysis 240
Combined cluster and discriminant analysis (CCDA) is a multivariate data analysis 241
method (Kovács et al. 2014) which aims to find not only similar, but even homogeneous groups 242
in measurement data of known origin (so, in this work, to identify groups of water quality 243
sampling sites). CCDA consists of three main steps: (I) a basic grouping procedure, in this case 244
using hierarchical cluster analysis (HCA), to determine possible groupings; (II) a core cycle in 245
which the goodness of the groupings from Step I and the goodness of random classifications 246
are determined using linear discriminant analysis; and (III) a final evaluation step in which a 247
decision concerning the further iterative investigation of sub-groups is taken. If the ratio of 248
correctly classified cases for a grouping (“ratio”) is higher than at least 95 % of the ratios for 249
the random classifications (“q95”), i.e. the difference d=ratio–q95 is positive, then at a 5% level 250
of significance, the given classification is not homogeneous in CCDA. Therefore, the division 251
into sub-groups (Step III) and the iterative investigation of these sub-groups for homogeneity 252
is required. 253
254
2.2.2. Exploratory principal component analysis 255
Exploratory principal component analysis (PCA; Tabachnick & Fidell 2014) was used to 256
find the variables with the greatest influence on the water quality status of the lake over the 257
investigated time period. PCA decomposes the original dependent variables into principal 258
components that explain the original total variance of the dataset component-wise in a 259
monotonically decreasing order. The correlation coefficients between the original parameters 260
and the principal components (PCs) are the factor loadings, and these explain the weights of 261
Preprint of Ecological Engineering Volume 98, 804-811 https://doi.org/10.1016/j.ecoleng.2020.105861
11
the PCs in the original parameters, while the PC time series are referred to as PC scores (Olsen 262
et al. 2012, Tabachnick & Fidell 2014). 263
In the present case, the input variables for PCA were the annual averages of complete 264
cases (1985-2017) for the WQPs (Sect. 2.1). The Kaiser-Meyer-Olkin (KMO) test (Cerny & 265
Kaiser 1977) was employed to determine the measure of sampling adequacy (MSA), providing 266
information which allows the decision of whether PCA can be applied to the dataset. The 267
variables with factor loadings outside the ±0.7 interval were taken as important, while the PCs 268
were taken into account based on their scree plots as suggested by (Cattell 1966) and their 269
eigenvalues, which had to be above 1 according to (Kaiser 1960). 270
Principal component time series are commonly related to possible explanatory parameters 271
in space (e.g. Magyar et al. 2013, Olsen et al. 2012) and time (e.g. Çamdevýren et al. 2005, 272
Hatvani et al. 2018, Page et al. 2012). In the case of the latter, when correlating the explanatory 273
parameters with the PC scores, the serial correlation of the data should to be considered, since 274
it limits the number of independent observations, not satisfying the assumptions of conventional 275
statistical methods (Macias-Fauria et al. 2012). Thus, in the present study one thousand Monte-276
Carlo simulations were performed with frequency (Ebisuzaki) domain time series modelling to 277
obtain the correct significance levels of the correlation coefficients (r). 278
The analysis described in Sects. 2.2.1 and 2.2.2 was conducted on the annual averages of 279
the complete cases of data considering the lake as a single water body, as well as the four basins 280
of the lake separately. The former approach was justified by the water body designation criteria 281
of the Water Framework Directive (EC 2000) given that Lake Balaton is one single water body, 282
while latter was justified by the study of Kovács et al. (2012b) highlighting the separate 283
behavior of the four basins of the lake. 284
R statistical environment was used (R Core Team, 2019) to calculate the descriptive statistics, 285
the Sen's slope estimates with Mann-Kendall tests using the mannKen () function of the wql 286

Preprint of Ecological Engineering Volume 98, 804-811 https://doi.org/10.1016/j.ecoleng.2020.105861
12
package (Jassby and Cloern, 2017), and CCDA was performed using the CCDA package 287
(Kovács et al., 2014). PCA was computed using IBM SPSS 26, the statistical significance of 288
the correlation coefficients under serial correlations were calculated using the Windows 289
version of the software provided in (Macias-Fauria et al. 2012), and additional tasks were 290
performed in MS Excel 360. 291
292
293
3. Results 294
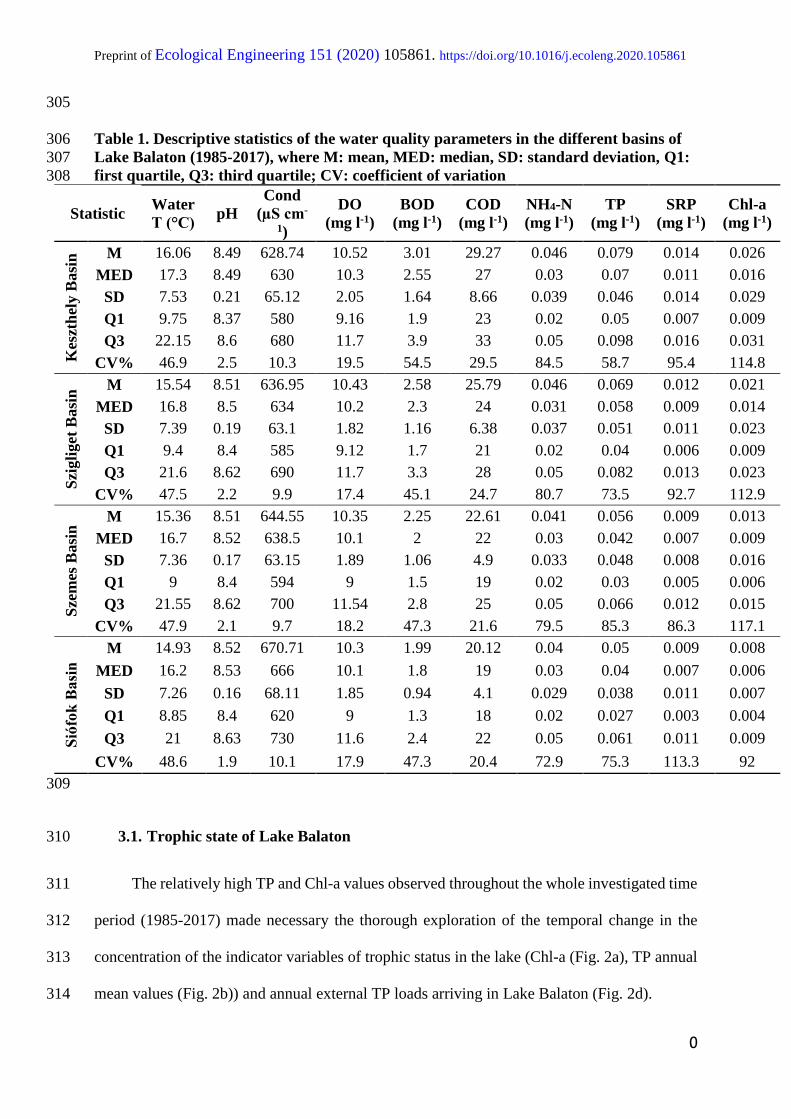
To provide an overall picture of the dataset, its descriptive statistics were produced (Table 295
1). The first quartile and median of the phosphorous forms, Chl-a, BOD and COD were highest 296
in the Keszthely Basin, decreasing continuously with distance from the inlet of the River Zala, 297
located there (Table 1). Conductivity, on the other hand, showed a continuous increase along 298
the main transect of the lake from W to E with respect to medians (from 630 to 666 µS cm-1); 299
this was also true of its first quartile, too (from 680 to 730 µS cm-1). With respect to pH and 300
water temperature, no noteworthy pattern was observed. In general, the highest degree of 301
variability relative to the average in water quality was observed in the Keszthely Basin. 302
However, TP (CV=85.3 mg l-1) and chl-a (CV=117.1 mg l-1) were most variable in the Szemes 303
Basin, and orthophosphate in the Siófok Basin. 304
Preprint of Ecological Engineering 151 (2020) 105861. https://doi.org/10.1016/j.ecoleng.2020.105861
0
305
Table 1. Descriptive statistics of the water quality parameters in the different basins of 306
Lake Balaton (1985-2017), where M: mean, MED: median, SD: standard deviation, Q1: 307
first quartile, Q3: third quartile; CV: coefficient of variation 308
Statistic Water
T (°C) pH
Cond
(µS cm-
1)
DO
(mg l-1)
BOD
(mg l-1)
COD
(mg l-1)
NH4-N
(mg l-1)
TP
(mg l-1)
SRP
(mg l-1)
Chl-a
(mg l-1)
Kes
zth
ely B
asi
n M 16.06 8.49 628.74 10.52 3.01 29.27 0.046 0.079 0.014 0.026
MED 17.3 8.49 630 10.3 2.55 27 0.03 0.07 0.011 0.016
SD 7.53 0.21 65.12 2.05 1.64 8.66 0.039 0.046 0.014 0.029
Q1 9.75 8.37 580 9.16 1.9 23 0.02 0.05 0.007 0.009
Q3 22.15 8.6 680 11.7 3.9 33 0.05 0.098 0.016 0.031
CV% 46.9 2.5 10.3 19.5 54.5 29.5 84.5 58.7 95.4 114.8
Szi
gli
get
Basi
n M 15.54 8.51 636.95 10.43 2.58 25.79 0.046 0.069 0.012 0.021
MED 16.8 8.5 634 10.2 2.3 24 0.031 0.058 0.009 0.014
SD 7.39 0.19 63.1 1.82 1.16 6.38 0.037 0.051 0.011 0.023
Q1 9.4 8.4 585 9.12 1.7 21 0.02 0.04 0.006 0.009
Q3 21.6 8.62 690 11.7 3.3 28 0.05 0.082 0.013 0.023
CV% 47.5 2.2 9.9 17.4 45.1 24.7 80.7 73.5 92.7 112.9
Sze
mes
Basi
n M 15.36 8.51 644.55 10.35 2.25 22.61 0.041 0.056 0.009 0.013
MED 16.7 8.52 638.5 10.1 2 22 0.03 0.042 0.007 0.009
SD 7.36 0.17 63.15 1.89 1.06 4.9 0.033 0.048 0.008 0.016
Q1 9 8.4 594 9 1.5 19 0.02 0.03 0.005 0.006
Q3 21.55 8.62 700 11.54 2.8 25 0.05 0.066 0.012 0.015
CV% 47.9 2.1 9.7 18.2 47.3 21.6 79.5 85.3 86.3 117.1
Sió
fok
Basi
n
M 14.93 8.52 670.71 10.3 1.99 20.12 0.04 0.05 0.009 0.008
MED 16.2 8.53 666 10.1 1.8 19 0.03 0.04 0.007 0.006
SD 7.26 0.16 68.11 1.85 0.94 4.1 0.029 0.038 0.011 0.007
Q1 8.85 8.4 620 9 1.3 18 0.02 0.027 0.003 0.004
Q3 21 8.63 730 11.6 2.4 22 0.05 0.061 0.011 0.009
CV% 48.6 1.9 10.1 17.9 47.3 20.4 72.9 75.3 113.3 92
309
3.1. Trophic state of Lake Balaton 310
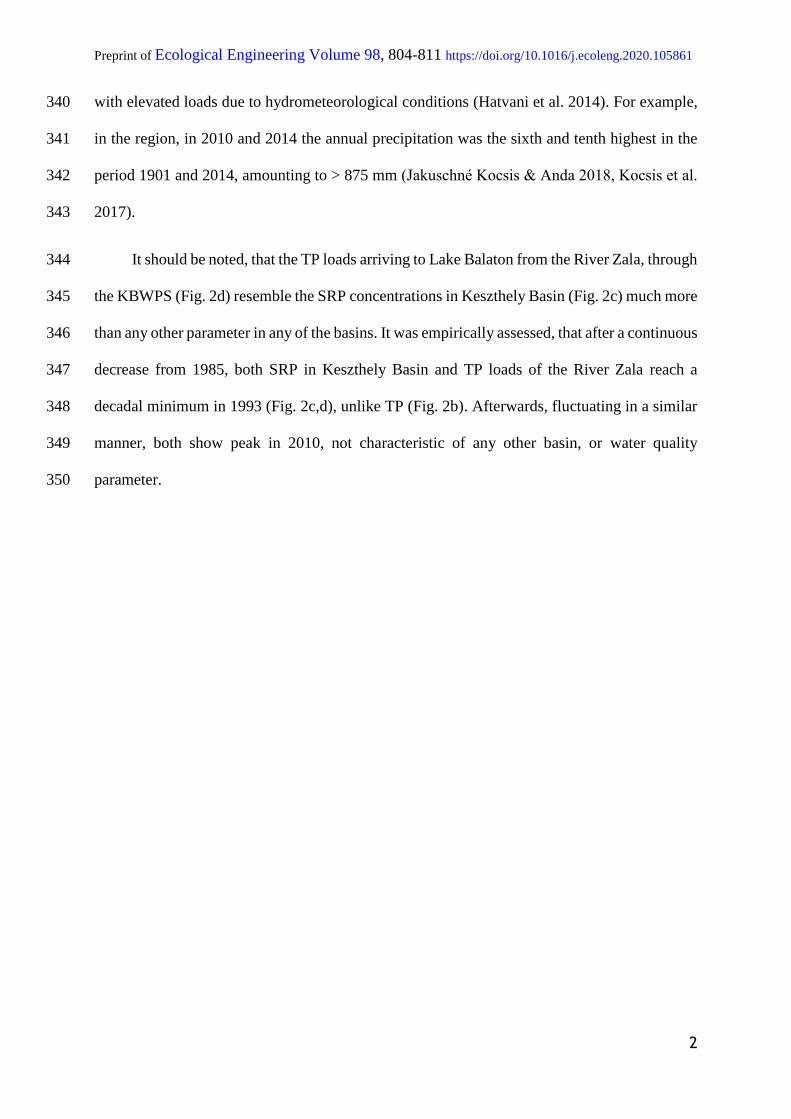
The relatively high TP and Chl-a values observed throughout the whole investigated time 311
period (1985-2017) made necessary the thorough exploration of the temporal change in the 312
concentration of the indicator variables of trophic status in the lake (Chl-a (Fig. 2a), TP annual 313
mean values (Fig. 2b)) and annual external TP loads arriving in Lake Balaton (Fig. 2d). 314

Preprint of Ecological Engineering Volume 98, 804-811 https://doi.org/10.1016/j.ecoleng.2020.105861
1
It became clear that with regard to the average Chl-a concentration of the whole lake and 315
the Keszthely Basin, 1994 was a turning-point. The average figures for the concentration of 316
Chl-a prior to 1994 were 0.0264 mg l-1 and 0.0426 mg l-1, for the lake and the basin, 317
respectively; these figures then dropped by ~60 and ~65% in the lake and in the Keszthely 318
Basin, as well as falling below hypertrophic levels in all the basins (Fig. 2a). Interestingly, in 319
the Szigliget Basin (Fig. 1), phytoplankton biomass in certain years of the early 2000s (e.g. 320
2002, 2003 and 2005, 2006) and afterwards in 2011 and 2012, was slightly higher and/or 321
comparable to those in the Keszthely Basin. The lowest values for Chl-a were always 322
characteristic of the Siófok Basin (0.008 mg l-1), the furthest from the main external source of 323
TP (Fig. 2d), the mouth of the River Zala. 324
In almost all cases, TP and SRP values were highest in Keszthely Basin, with the 325
exception of six of the 33 years investigated in the case of the former (Fig. 2b), and four in the 326
latter (Fig. 2c), in which slightly higher values were observed in the neighboring Szigliget 327
Basin. Up to 1994 an increase in TP concentrations characterizes the system, with a parallel 328
decrease in SRP (Fig. 2b,c). Afterwards, TP peaks in 1997 (~0.13 mg l-1) and SRP in 2000 329
(~0.03 mg l-1). In the meanwhile, in the Keszthely Basin after 1997 TP concentrations decreased 330
overall by ~50%, to 0.0670 mg l-1, a drop which was even larger in the other basins (Fig. 2b). 331
A classification based on annual averages in the main qualifies the lake’s water as eutrophic, 332
and only in the mid-1990s did this become hypertrophic, as observable from the data of 333
individual basins as well (Fig. 2). 334
The annual external TP loads arriving in Lake Balaton via the waters of the River Zala 335
for the most part display a continuous decrease, due to the combination of measures taken to 336
reduce nutrient loads in the region (see Sect. 1). However, in the mid-1990s a sudden increase 337
was observed in TP loads reaching Keszthely Bay, while after 2000 the average loads were 338
about 50% of those in the 1990s, with only a couple of years, the first being 2004 (Fig. 2d), 339
Preprint of Ecological Engineering Volume 98, 804-811 https://doi.org/10.1016/j.ecoleng.2020.105861
2
with elevated loads due to hydrometeorological conditions (Hatvani et al. 2014). For example, 340
in the region, in 2010 and 2014 the annual precipitation was the sixth and tenth highest in the 341
period 1901 and 2014, amounting to > 875 mm (Jakuschné Kocsis & Anda 2018, Kocsis et al. 342
2017). 343
It should be noted, that the TP loads arriving to Lake Balaton from the River Zala, through 344
the KBWPS (Fig. 2d) resemble the SRP concentrations in Keszthely Basin (Fig. 2c) much more 345
than any other parameter in any of the basins. It was empirically assessed, that after a continuous 346
decrease from 1985, both SRP in Keszthely Basin and TP loads of the River Zala reach a 347
decadal minimum in 1993 (Fig. 2c,d), unlike TP (Fig. 2b). Afterwards, fluctuating in a similar 348
manner, both show peak in 2010, not characteristic of any other basin, or water quality 349
parameter. 350
Preprint of Ecological Engineering Volume 98, 804-811 https://doi.org/10.1016/j.ecoleng.2020.105861
3
Fig. 2. Annual average concentration of Chl-a A) TP B) and SRP C) for the four
investigated basins of Lake Balaton along with the inflow of annual TP loads from the
River Zala through the KBWPS to Lake Balaton (sampling location 10 on Fig. 1) D)
(redrawn and extended from (Hatvani et al. 2014) C) (1985-2017). In panels A) and B),
above the continuous horizontal black line hypertrophic conditions prevail. The

Preprint of Ecological Engineering Volume 98, 804-811 https://doi.org/10.1016/j.ecoleng.2020.105861
4
dashed line is the threshold for eutrophic conditions, and the dotted for mesotrophic.
Below the dotted line oligotrophic conditions prevail, as determined by using the
scheme of (Vollenweider & Kerekes 1982).
351
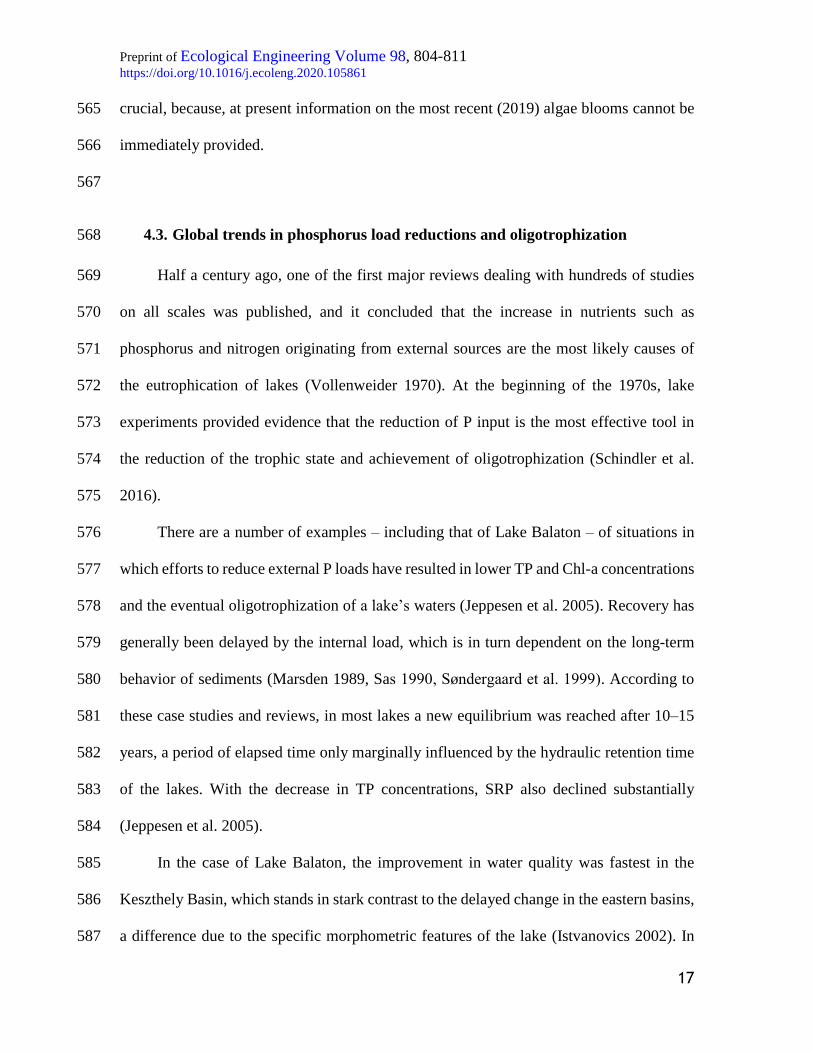
Primary indicator variables of trophic status were used to determine the trophic state of 352
the lake annually (Table A1). Regarding Chl-a, up to 1994 the Keszthely and Szigliget basins 353
were mostly hypertrophic, while the westernmost basins were in most cases eutrophic and in 354
the mid-1980s mesotrophic (Fig. 2a; Table A1) with the exception of 1994, when all the basins 355
were eutrophic/hypertrophic in terms of Chl-a. After 1994 - which would appear to be a tipping 356
point for Chl-a - all the basins except Siófok were mostly eutrophic. In the Siófok Basin, after 357
1994 a mesotrophic state obtained, which turned exclusive after 2003 in terms of Chl-a mean 358
values (Fig. 2a; Table A1). 359
With regard to TP, the Keszthely and Szigliget basins were mostly eutrophic through the 360
years analyzed, while the Siófok and Szemes basins were in the beginning mesotrophic, later 361
turning eutrophic. The only exception involving all the basins is 1997, in which all of them 362
were hypertrophic in terms of TP (Fig. 2b; Table A1). 363
Overall, a clear pattern is visible, with a spatial divide between the western and eastern 364
basins. The western basins (Keszthely and Szigliget) are mostly hypertrophic at the beginning 365
of the investigated time period (from 1985 to 1994), while the eastern ones (Szemes and Siófok) 366
are eutrophic/mesotrophic. Moving forward in time, this pattern changes to eutrophic for the 367
western basins and dominantly mesotrophic for the eastern basins, with oligotrophic 368
characteristics (in Chl-a maxima) occurring in the mid-2010s in the westernmost, the Siófok 369
Basin (Fig. 2a; Table A1). 370
371

Preprint of Ecological Engineering Volume 98, 804-811 https://doi.org/10.1016/j.ecoleng.2020.105861
5
3.2. Similarly behaving time intervals and temporal trends of primary trophic 372
indicators 373
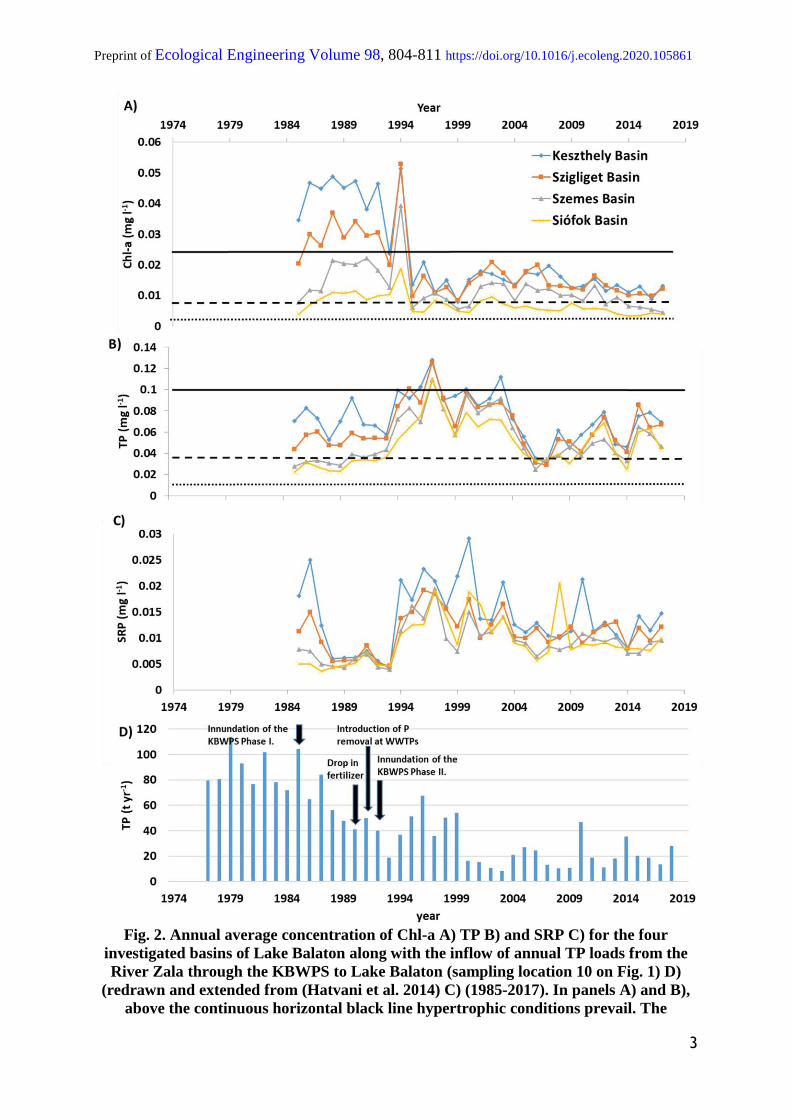
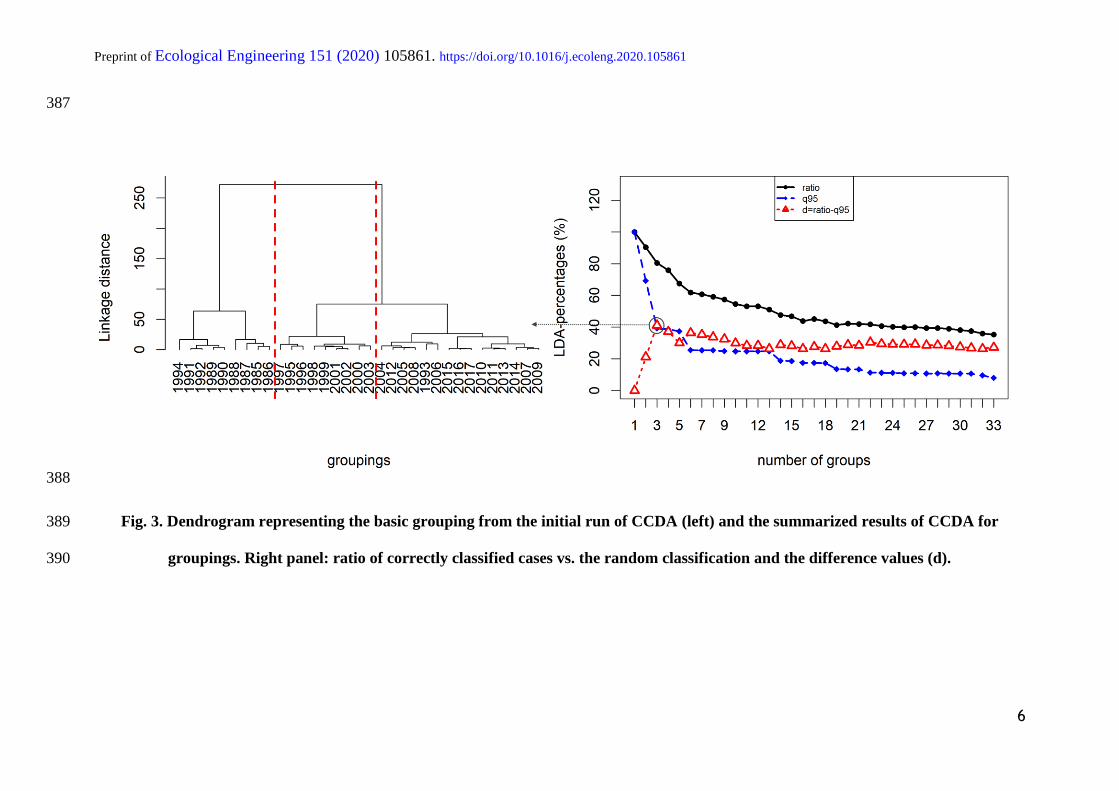
With the use of CCDA on the tagged annual averages of the water quality variables, three 374
similarly behaving (“optimal”) time intervals were determined as the basic grouping (Fig. 3). 375
At the q=95 level the biggest difference was 41.2% (Fig. 3), and this split the data into three 376
time intervals: 1985-1994, 1995-2003 and 2004-2017, with the year 1993 not being part of any 377
continuous time interval. 378
The greatest difference between the basic grouping and a random grouping (Fig. 3: curve 379
d) was observed at the division of the data into three groups (Fig. 3), indicating that this is 380
therefore the optimal grouping. These groups were further divided for the sake of verification, 381
to the point at which all the years become separate, thus demonstrating that homogeneity can 382
only be reached if the separate years form temporal groups alone. However, the three time 383
intervals determined (with similarly behaving years) were objectively determined, and a metric 384
assigned to their existence. 385
386
Preprint of Ecological Engineering 151 (2020) 105861. https://doi.org/10.1016/j.ecoleng.2020.105861
6
387
388
Fig. 3. Dendrogram representing the basic grouping from the initial run of CCDA (left) and the summarized results of CCDA for 389
groupings. Right panel: ratio of correctly classified cases vs. the random classification and the difference values (d). 390
Preprint of Ecological Engineering 151 (2020) 105861. https://doi.org/10.1016/j.ecoleng.2020.105861
7
391
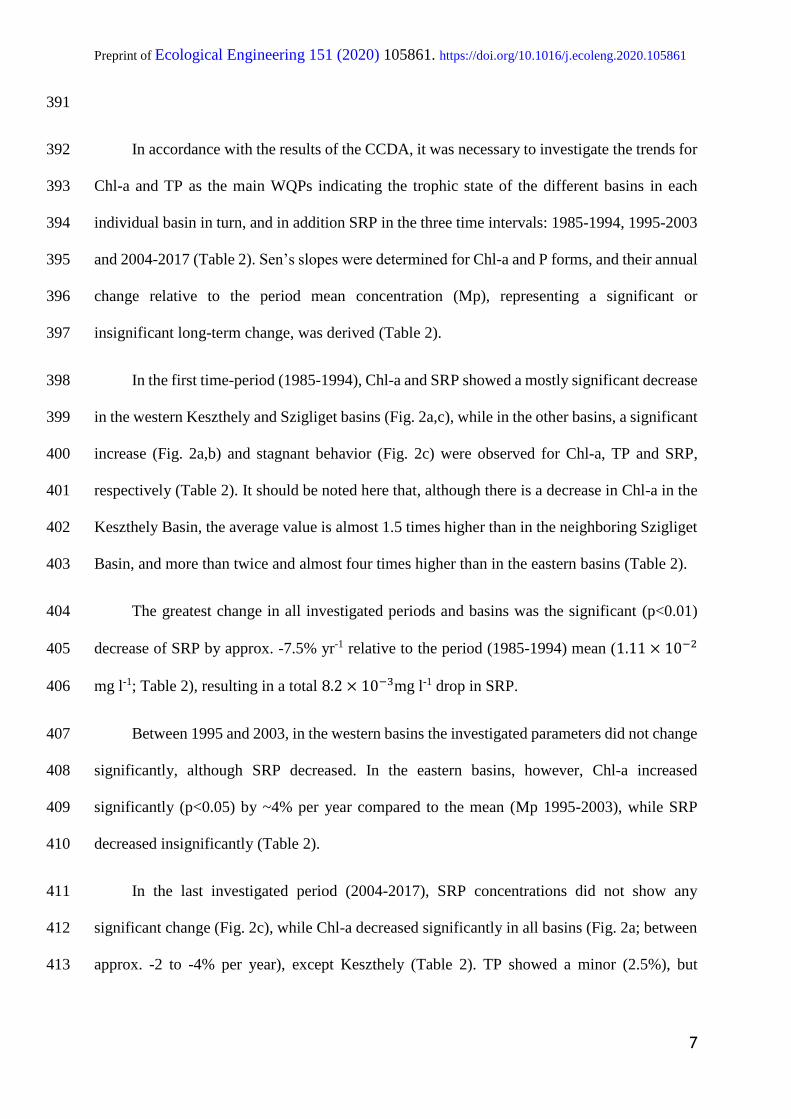
In accordance with the results of the CCDA, it was necessary to investigate the trends for 392
Chl-a and TP as the main WQPs indicating the trophic state of the different basins in each 393
individual basin in turn, and in addition SRP in the three time intervals: 1985-1994, 1995-2003 394
and 2004-2017 (Table 2). Sen’s slopes were determined for Chl-a and P forms, and their annual 395
change relative to the period mean concentration (Mp), representing a significant or 396
insignificant long-term change, was derived (Table 2). 397
In the first time-period (1985-1994), Chl-a and SRP showed a mostly significant decrease 398
in the western Keszthely and Szigliget basins (Fig. 2a,c), while in the other basins, a significant 399
increase (Fig. 2a,b) and stagnant behavior (Fig. 2c) were observed for Chl-a, TP and SRP, 400
respectively (Table 2). It should be noted here that, although there is a decrease in Chl-a in the 401
Keszthely Basin, the average value is almost 1.5 times higher than in the neighboring Szigliget 402
Basin, and more than twice and almost four times higher than in the eastern basins (Table 2). 403
The greatest change in all investigated periods and basins was the significant (p<0.01) 404
decrease of SRP by approx. -7.5% yr-1 relative to the period (1985-1994) mean (1.11 × 10⁻² 405
mg l-1; Table 2), resulting in a total 8.2 × 10⁻³mg l-1 drop in SRP. 406
Between 1995 and 2003, in the western basins the investigated parameters did not change 407
significantly, although SRP decreased. In the eastern basins, however, Chl-a increased 408
significantly (p<0.05) by ~4% per year compared to the mean (Mp 1995-2003), while SRP 409
decreased insignificantly (Table 2). 410
In the last investigated period (2004-2017), SRP concentrations did not show any 411
significant change (Fig. 2c), while Chl-a decreased significantly in all basins (Fig. 2a; between 412
approx. -2 to -4% per year), except Keszthely (Table 2). TP showed a minor (2.5%), but 413
Preprint of Ecological Engineering Volume 98, 804-811 https://doi.org/10.1016/j.ecoleng.2020.105861
8
significant (p<0.05) increase in the Keszthely and Siófok basins (Table 2). The observed trends 414
are all in accordance with the data presented in Fig. 2a-c. 415
Overall, there is a significant (p<0.01) decrease in SRP in the western basins in the first 416
of the years investigated, and as this trend weakens over the decades, by the 2010s a decrease 417
in biologically available P and Chl-a presents itself in the eastern basins, although to a degree 418
as yet insignificant (Table 2). It should be noted here that in the Szemes Basin, the -2% annual 419
SRP decrease is significant at α=0.1. It should be further noted that while the trends indicate 420
the change in concentrations within the three distinct water quality time periods, the 421
concentrations of Chl-a should also be considered in the light of the overall change as well (Fig. 422
2a). This shows a large drop in concentrations, for example, in the Keszthely Basin Chl-a mean 423
concentrations decreased by ~65% between the period averages of 1985-1994 and 2004-2017 424
(Table 2). 425
Preprint of Ecological Engineering 151 (2020) 105861. https://doi.org/10.1016/j.ecoleng.2020.105861
9
426
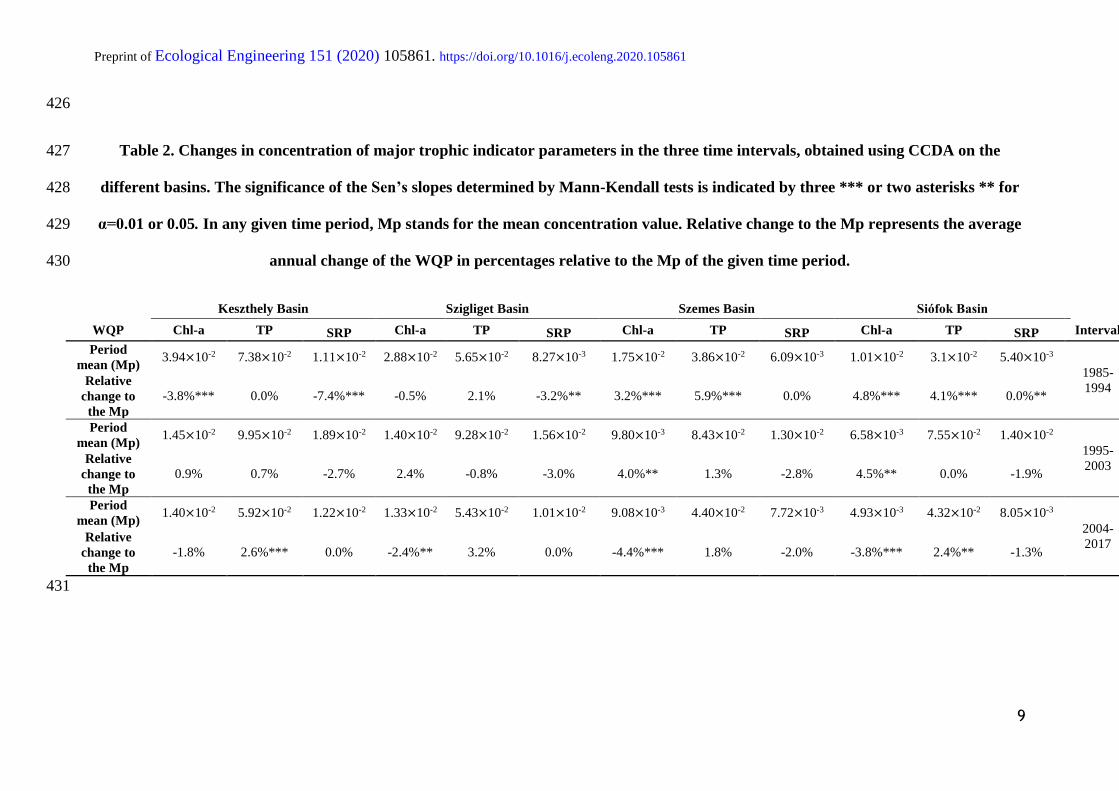
Table 2. Changes in concentration of major trophic indicator parameters in the three time intervals, obtained using CCDA on the 427
different basins. The significance of the Sen’s slopes determined by Mann-Kendall tests is indicated by three *** or two asterisks ** for 428
α=0.01 or 0.05. In any given time period, Mp stands for the mean concentration value. Relative change to the Mp represents the average 429
annual change of the WQP in percentages relative to the Mp of the given time period. 430
Keszthely Basin Szigliget Basin Szemes Basin Siófok Basin
WQP Chl-a TP SRP Chl-a TP SRP Chl-a TP SRP Chl-a TP SRP Interval
Period
mean (Mp) 3.94×10⁻² 7.38×10⁻² 1.11×10⁻² 2.88×10⁻² 5.65×10⁻² 8.27×10⁻³ 1.75×10⁻² 3.86×10⁻² 6.09×10⁻³ 1.01×10⁻² 3.1×10⁻² 5.40×10⁻³
1985-
1994 Relative
change to
the Mp
-3.8%*** 0.0% -7.4%*** -0.5% 2.1% -3.2%** 3.2%*** 5.9%*** 0.0% 4.8%*** 4.1%*** 0.0%**
Period
mean (Mp) 1.45×10⁻² 9.95×10⁻² 1.89×10⁻² 1.40×10⁻² 9.28×10⁻² 1.56×10⁻² 9.80×10⁻³ 8.43×10⁻² 1.30×10⁻² 6.58×10⁻³ 7.55×10⁻² 1.40×10⁻²
1995-
2003 Relative
change to
the Mp
0.9% 0.7% -2.7% 2.4% -0.8% -3.0% 4.0%** 1.3% -2.8% 4.5%** 0.0% -1.9%
Period
mean (Mp) 1.40×10⁻² 5.92×10⁻² 1.22×10⁻² 1.33×10⁻² 5.43×10⁻² 1.01×10⁻² 9.08×10⁻³ 4.40×10⁻² 7.72×10⁻³ 4.93×10⁻³ 4.32×10⁻² 8.05×10⁻³
2004-
2017 Relative
change to
the Mp
-1.8% 2.6%*** 0.0% -2.4%** 3.2% 0.0% -4.4%*** 1.8% -2.0% -3.8%*** 2.4%** -1.3%
431
Preprint of Ecological Engineering 151 (2020) 105861. https://doi.org/10.1016/j.ecoleng.2020.105861
10
432
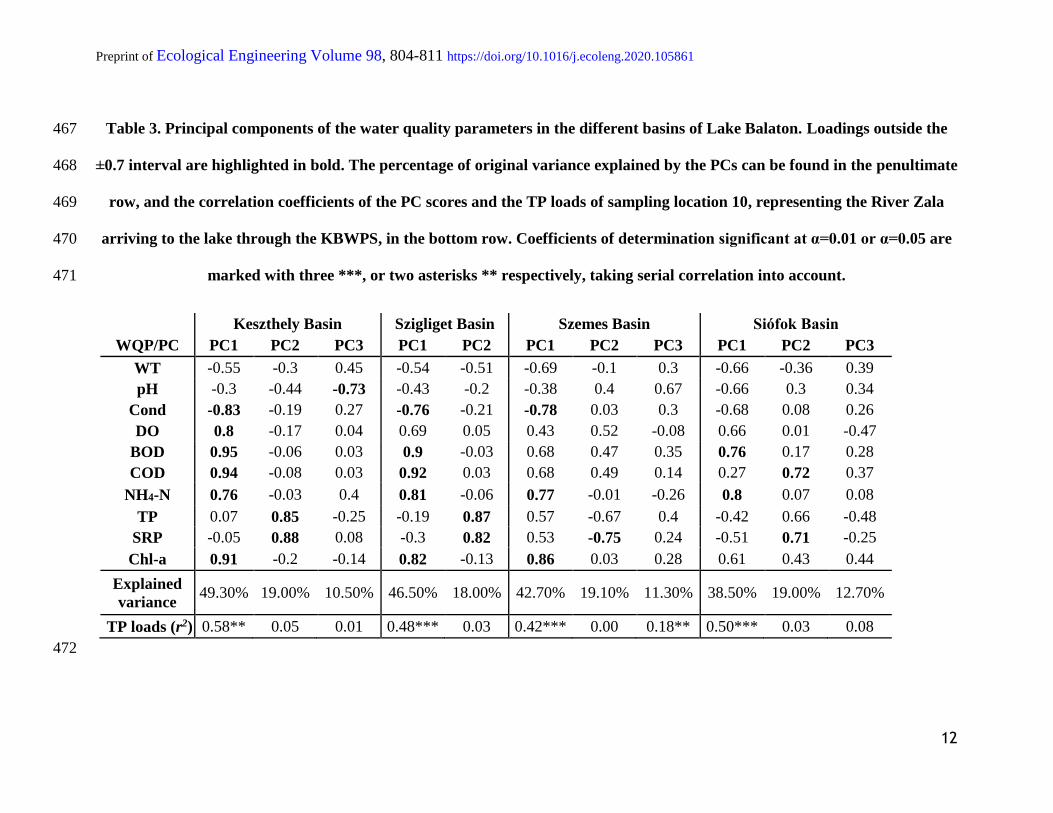
3.3. Common patterns in the general water quality of Lake Balaton (1985-2017) 433
Except for the Szigliget Basin, the eigenvalues of the first 3 PCs reached a value of 1, and 434
their cumulative explanatory power fell between ~70 and ~80% (Table 3). In the Szigliget 435
Basin, the cumulative variance explained by the first 2 PCs was ~65%. Nevertheless, the 436
explanatory power of the first PC in all the basins was between ~40 and ~50%. It is clear that 437
if just the first two PCs are considered for the sake of comparison, their cumulative explanatory 438
power decreases from 68.3% to 57.5% as we move in an easterly direction. According to the 439
KMO test, the MSA yielded values which fell between what may be considered acceptable 440
(>0.7) and mediocre (>0.6) in the different basins, thus demonstrating that PCA can provide 441
reliable results. 442
While the parameters related to biological activity indicating primary production (Chl-a) 443
and its impact on the indices of saprobity (DO, BOD, COD, NH4-N) had the highest loadings 444
in the first PCs, while the phosphorus forms (TP and SRP), were most important in the second. 445
The latter continuously lost its importance as one moves eastwards, with their average loading 446
decreasing continuously from 0.88 to 0.71, while in terms of the loadings of TP in the Szemes 447
and Siófok basins, these fell beneath the 0.7 threshold (Table 3). As for Chl-a, the other main 448
indicator of trophic conditions, its highest loading was observed in the westernmost basin, in 449
the Keszthely Basin (loading of 0.91 in PC1), while in the easternmost basin, at Siófok, it does 450
not even reach the 0.7 threshold in either PCs (Table 3). 451
The PC scores and the time series of external TP loads (Fig. 2c) for 1985-2017 arriving 452
to Lake Balaton in the waters of the _River Zala (sampling location 10 in Fig. 1) were 453
correlated. It was found that the TP loads – as an external driving parameter – correlated 454
significantly with the first PCs (r > 0.65), which were recognized as indicating primary 455

Preprint of Ecological Engineering Volume 98, 804-811 https://doi.org/10.1016/j.ecoleng.2020.105861
11
production, rather than with the PCs mainly driven by inorganic nutrients (e.g. P forms; Table 456
3). The TP loads explain ~60% of the variance of PC1, and this decreases eastwards to ~40% 457
in the Szemes Basin. In the Siófok Basin, the significant linear relationship between the TP 458
loads of the River Zala reaching the lake through the KBWPS and the first PC strengthens. 459
However, in this particular basin the representativity of parameters related to primary 460
production decreased in the first PC (Table 3). 461
In theory, another viable approach would have been to explore the common 462
patterns/trends in the different basins for the three time periods separately; unfortunately, the 463
matrices serving as the input for PCA were singular, and the KMO test indicated that this 464
particular sub-setting of the dataset would therefore be unsuitable for PCA, with an MSA of 465
<0.5. 466
Preprint of Ecological Engineering Volume 98, 804-811 https://doi.org/10.1016/j.ecoleng.2020.105861
12
Table 3. Principal components of the water quality parameters in the different basins of Lake Balaton. Loadings outside the 467
±0.7 interval are highlighted in bold. The percentage of original variance explained by the PCs can be found in the penultimate 468
row, and the correlation coefficients of the PC scores and the TP loads of sampling location 10, representing the River Zala 469
arriving to the lake through the KBWPS, in the bottom row. Coefficients of determination significant at α=0.01 or α=0.05 are 470
marked with three ***, or two asterisks ** respectively, taking serial correlation into account. 471
Keszthely Basin Szigliget Basin Szemes Basin Siófok Basin
WQP/PC PC1 PC2 PC3 PC1 PC2 PC1 PC2 PC3 PC1 PC2 PC3
WT -0.55 -0.3 0.45 -0.54 -0.51 -0.69 -0.1 0.3 -0.66 -0.36 0.39
pH -0.3 -0.44 -0.73 -0.43 -0.2 -0.38 0.4 0.67 -0.66 0.3 0.34
Cond -0.83 -0.19 0.27 -0.76 -0.21 -0.78 0.03 0.3 -0.68 0.08 0.26
DO 0.8 -0.17 0.04 0.69 0.05 0.43 0.52 -0.08 0.66 0.01 -0.47
BOD 0.95 -0.06 0.03 0.9 -0.03 0.68 0.47 0.35 0.76 0.17 0.28
COD 0.94 -0.08 0.03 0.92 0.03 0.68 0.49 0.14 0.27 0.72 0.37
NH4-N 0.76 -0.03 0.4 0.81 -0.06 0.77 -0.01 -0.26 0.8 0.07 0.08
TP 0.07 0.85 -0.25 -0.19 0.87 0.57 -0.67 0.4 -0.42 0.66 -0.48
SRP -0.05 0.88 0.08 -0.3 0.82 0.53 -0.75 0.24 -0.51 0.71 -0.25
Chl-a 0.91 -0.2 -0.14 0.82 -0.13 0.86 0.03 0.28 0.61 0.43 0.44
Explained
variance 49.30% 19.00% 10.50% 46.50% 18.00% 42.70% 19.10% 11.30% 38.50% 19.00% 12.70%
TP loads (r2) 0.58** 0.05 0.01 0.48*** 0.03 0.42*** 0.00 0.18** 0.50*** 0.03 0.08
472
Preprint of Ecological Engineering Volume 98, 804-811 https://doi.org/10.1016/j.ecoleng.2020.105861
13
473
4. Discussion 474
The spatiotemporal development of the trophic status of Lake Balaton over three 475
recent decades was primarily determined by the complex interplay of its natural internal 476
(discussed in Sect. 4.1) and external nutrient loads, as well as the measures taken to reduce 477
these (Sect. 4.2.). These together make the case of Lake Balaton a unique international 478
example of the result of drastic external load reduction measures in order to ameliorate 479
oligotrophization, and have the potential for application worldwide (Sect. 4.3). 480
481
4.1. Factors behind observed changes and trends 482
From a spatial perspective, it has been demonstrated that the nutrient content of the 483
water decreases from west to east, resulting in a lower trophic status in the eastern basins 484
(Fig. 2; Table A1). This is due tomorphological reasons: the (i) increasing size of the 485
watershed of the basins, the increasing residence time of the water (Istvanovics 2002) (ii) 486
the decreasing area-specific nutrient loads eastwards (Istvánovics et al. 2007), and (iti) 487
increasing distance from the mouth of the River Zala, which brings ~50% of the lake’s total 488
water and 35-40% of its total nutrient input (Istvánovics et al. 2007) and 90-95% of the 489
nutrient input of the Keszthely Basin (Istvánovics et al. 2004). In the case of the latter, the 490
various interventions intended to reduce its nutrient loads were also a significant factor (see 491
Sect. 4.2). Taken together, these factors resulted in the decreasing gradient of P and Chl-a 492
content (Tables 1 and A1), influenced to an ever-decreasing extent by the TP input of the 493
River Zala as one heads east on the lake, away from Keszthely, dropping to ~40% (Table 494
3). Sediment resuspension in Lake Balaton is much higher than in other shallow lakes, 495
Preprint of Ecological Engineering Volume 98, 804-811 https://doi.org/10.1016/j.ecoleng.2020.105861
14
moreover, since its carrying capacity is P-determined, its internal loads are of major 496
importance, i.e. the internal P loads can reach the magnitude of external SRP loads in dry 497
years, e.g. early 2000s (Istvánovics et al. 2004), when external loads are smaller than the 498
multidecadal average (Fig. 2d). With the increase in the water’s residence time and the 499
previously-discussed eastward gradual decrease in internal and external nutrient loads, the 500
importance of algal biomass in explaining the water quality variability of the lake decreased 501
(Table 3). 502
From a temporal perspective, although the measures taken (see Sect. 1) may be 503
considered as the primary factor in the oligotrophization of the lake (Hatvani et al. 2015, 504
Istvánovics et al. 2007), the local hydrometeorological conditions (e.g. precipitation, 505
runoff, temperature, wind) had a measurable effect on its water quality (Hatvani et al. 2014, 506
Istvánovics et al. 2004), as well as, in the form of such phenomena as local temperature, 507
cloud cover, etc, on the water quality of the Kis-Balaton Water Protection System (Hatvani 508
et al. 2017), which serves as a pre-treatment wetland for the loads arriving with the waters 509
of the River Zala (Tátrai et al. 2000). The separation of the three time periods in the history 510
of the lake coincides with major interventions to reduce its loads, as well as larger-scale 511
economic changes (Sect. 1). However, in certain cases, e.g. the dividing line of 1994/95, 512
the lake responded to the drop in nutrient loads (Hatvani et al. 2015) with a time-lag; for 513
details, see Sect. 4.2. 514
In addition, the reason for the unprecedented behavior of the year 1993 seems likely 515
to be the dry conditions then prevailing (Hatvani et al. 2014), since this was the fifth driest 516
spring of the region in the twentieth century (the spring precipitation amount was only 78.6 517
mm (Kocsis et al. 2020)). This resulted in decreased external loads, and thus a significant 518

Preprint of Ecological Engineering Volume 98, 804-811 https://doi.org/10.1016/j.ecoleng.2020.105861
15
drop in P and Chl-a concentrations throughout the lake (Fig. 2a-c; Table 2). This was also 519
the time of the lowest average SRP concentration (1993 annual avg. 0.0043 mg l-1) in the 520
lake between 1985 and 2017; additionally, this was also the point at which the smallest 521
difference between the basins (max-min SRP in 1993: 0.0007 mg l-1; Fig. 2c) was 522
observable. These conditions were accompanied by a lack of large algae blooms, such as 523
that which occurred in the following year 1994 (Istvánovics et al. 2007). 524
525
4.2. The results of the interventions taken to reduce trophic conditions 526
The significant decreasing trend (Sen’s slope on annual averages; p=6.83×10⁻⁵) in 527
external TP loads from the watershed of the River Zala (1985-2017; Fig. 2d) was not 528
followed by a direct monotonic decrease in P concentration in the lake as a whole, nor its 529
continuous oligotrophization (Fig. 2b, Table A1, respectively). By way of contrast, SRP 530
mirrored the decrease in external loads to a much greater extent (Fig. 2c,d; Table 2). This 531
may be explained by the following facts: 532
(i) the lake responds to external load reduction measures (e.g. the inundation of the 533
KBWPS, sewage diversion, P precipitation at WWTPs from the area, see Sect. 1) 534
with a time-lag (Istvanovics 2002), as in the case of other shallow lakes (Sas 1990). 535
(ii) the KBWPS is capable of removing a higher ratio of nutrients from an already 536
elevated input load, while contrariwise, if the loads are reduced, its efficiency also 537
decreases (Clement et al. 1998), leading to a concomitant increase in the importance 538
of internal loads from resuspension-desorption. 539
The interventions made at the mouth of the River Zala had primarily a local effect, 540
while investments in the development of the waste water infrastructure (Hajnal & Padisák 541
Preprint of Ecological Engineering Volume 98, 804-811 https://doi.org/10.1016/j.ecoleng.2020.105861
16
2008, Istvanovics 2002, Istvánovics et al. 2007), and the significant decrease in the use of 542
fertilizers (Sisák 1993) in the Balaton watershed played an essential role in the decrease of 543
the external nutrient loads in the 30 years covered by this study. The loads dropped by 544
~75% between 1977-1984 and 2004-2018 to ~21t yr-1 in the Keszthely Basin (Fig. 2d), 545
while in the other basins in this figure was already around 50% less as of 2002 (Istvánovics 546
et al. 2007). 547
The lagged response to the drop in external loads was not only visible in time, but in 548
each basin taken individually, as seen from the Sen’s trend estimates (Table 2). While in 549
the Keszthely Basin, the reduction in external loads had an almost immediate effect, in the 550
eastern basins the decreasing trends in P and Chl-a occurred ~10 years later (Table A1). 551
For example, in the Szigliget, Szemes and Siófok basins, only after 2004 did Chl-a start to 552
decrease significantly (p<0.01), and while reactive phosphorus concentrations stop 553
decreasing in the western basins by the 2000s, at this point these start to show a decreasing 554
trend in the east (Table 2). Findings from the Keszthely Basin indicated a change its trophic 555
conditions from an initial steadily hypertrophic period (1981-1984), to a transient state of 556
hysteresis (1985-1992) (Scheffer 2013), which concluded in an alternative, less eutrophic 557
state from the mid-1990s (Hatvani 2014), where most of the eutrophication processes 558
moved upstream to the KBWPS (Hatvani et al., 2014). However, it was from the Keszthely 559
Basin that the unexpected algae bloom of late summer 2019 spread (Istvánovics 2019), and 560
this demands the further investigation of the specific triggers of this event. The present 561
update on the trophic changes of the lake extends the previous coverage of the thorough 562
analyses on the trophic status of the lake (Istvánovics et al. 2007, Tátrai et al. 2000) by 14 563
years. It underlines that its trophic state has indeed decreased. Moreover, such updates are 564
Preprint of Ecological Engineering Volume 98, 804-811 https://doi.org/10.1016/j.ecoleng.2020.105861
17
crucial, because, at present information on the most recent (2019) algae blooms cannot be 565
immediately provided. 566
567
4.3. Global trends in phosphorus load reductions and oligotrophization 568
Half a century ago, one of the first major reviews dealing with hundreds of studies 569
on all scales was published, and it concluded that the increase in nutrients such as 570
phosphorus and nitrogen originating from external sources are the most likely causes of 571
the eutrophication of lakes (Vollenweider 1970). At the beginning of the 1970s, lake 572
experiments provided evidence that the reduction of P input is the most effective tool in 573
the reduction of the trophic state and achievement of oligotrophization (Schindler et al. 574
2016). 575
There are a number of examples – including that of Lake Balaton – of situations in 576
which efforts to reduce external P loads have resulted in lower TP and Chl-a concentrations 577
and the eventual oligotrophization of a lake’s waters (Jeppesen et al. 2005). Recovery has 578
generally been delayed by the internal load, which is in turn dependent on the long-term 579
behavior of sediments (Marsden 1989, Sas 1990, Søndergaard et al. 1999). According to 580
these case studies and reviews, in most lakes a new equilibrium was reached after 10–15 581
years, a period of elapsed time only marginally influenced by the hydraulic retention time 582
of the lakes. With the decrease in TP concentrations, SRP also declined substantially 583
(Jeppesen et al. 2005). 584
In the case of Lake Balaton, the improvement in water quality was fastest in the 585
Keszthely Basin, which stands in stark contrast to the delayed change in the eastern basins, 586
a difference due to the specific morphometric features of the lake (Istvanovics 2002). In 587

Preprint of Ecological Engineering Volume 98, 804-811 https://doi.org/10.1016/j.ecoleng.2020.105861
18
accordance with the general experience that very large changes in external TP loading were 588
necessary to change the trophic status of a lake (Marsden 1989), this delayed, but still 589
surprisingly fast recovery was achieved by an external load reduction of around 75% 590
compared to the input when the lake was hypertrophic. As has been observed, “the OECD 591
supports the suggestion that a large reduction in external P loading is necessary to change 592
the trophic status of a lake: a reduction in the annual mean Chl-a concentration across a 593
trophic category requires an approximately 80% reduction in external TP loading” 594
(Vollenweider & Kerekes 1982). But it is obvious that there is a substantial variation in the 595
load - response relationships of various lakes (Marsden 1989), and their recovery after 596
nutrient load reduction may be significantly modified by environmental changes such as 597
global warming (Ho et al. 2019), since the effects of global change are likely to run counter 598
to reductions in nutrient loading rather than reinforcing re-oligotrophization (Jeppesen et 599
al. 2005). Also, it is expected that recovery from eutrophication will be more difficult in 600
shallow lakes (Rolighed et al. 2016), and therefore further efforts are needed to arrive at an 601
estimate of the degree of nutrient reduction likely to be required in a future, warmer climate 602
to mitigate eutrophication. 603
604
5. Conclusions 605
The present study provides a 14-year overall update compared to the landmark study 606
of Istvánovics et al. (2007) on the changes and drivers of the trophic status of the largest 607
shallow freshwater lake in Central Europe, Lake Balaton. It highlights the fact that the 608
oligotrophization of the lake took place at a different pace – as indicated by Sen’s trend 609
analysis – in the three major time intervals (1985-1994; 1995-2003; 2004-2017) identified 610

Preprint of Ecological Engineering Volume 98, 804-811 https://doi.org/10.1016/j.ecoleng.2020.105861
19
in the history of the lake, and what is more, in space along its major axis. At first around 611
the turn of the 1990s, the significant decrease in both algal biomass and biologically 612
available phosphorus was observed in the western basins, those in closest proximity to the 613
main water input to the lake, and afterwards spreading east. The stochastic analyses of the 614
linear interrelations of the water quality parameters and the main external P input to the 615
lake, further nuanced this picture. Those showed a continuous decrease in importance of 616
inorganic nutrients (e.g. P forms) driving the general variance of water quality in the lake 617
toward the eastern basins. The overall results indicated that the extent of oligotrophization 618
depended on (i) hydromorphological conditions (ii) the external load reduction measures 619
(e.g. inundation of the lake’s pre-reservoir the KBWPS, reduction in fertilizer usage in the 620
watershed, sewage treatment, etc.) of the late 1980s and the 1990s and (iii) local 621
meteorological/basin conditions (e.g. temperature, resuspension of P from the sediment 622
and desorption of SRP). 623
The findings, in comparison to international case studies highlight the fact that only 624
with the severe reduction of external nutrient loads, and especially in the case of 625
phosphorus, can the oligotrophization of such shallow lakes be achieved. However, due to 626
sediment resuspension, this will occur only with at least a 5-10-year lag in response to the 627
measures taken. 628
629
Acknowledgements 630
Authors would like to thank Paul Thatcher for his work on our English versions. The 631
work of IGH was funded by the János Bolyai Research Scholarship of the Hungarian 632
Academy of Sciences. JK was supported by the ELTE Institutional Excellence Program 633

Preprint of Ecological Engineering Volume 98, 804-811 https://doi.org/10.1016/j.ecoleng.2020.105861
20
(1783-3/2018/FEKUTSRAT), PT was supported by the ‘Felsooktatasi Kivalosagi 634
Program’ (NKFIH-1159-6/2019), and AC was supported by the the Water sciences & 635
Disaster Prevention research area of BME FIKP-VIZ, all given by the Hungarian Ministry 636
of Human Capacities. 637
638
Author Contributions 639
Conceived and designed the study: IGH, JK. Performed the analysis: IGH, VDB, PT, 640
ISzK. Produced the figures: IGH, VDB, PT. Assessed the results: IGH, VDB, AC, JK. 641
Wrote the paper with contributions from all authors: IGH, AC, VDB. Revised the paper 642
with contributions from all co-authors: IGH and AC. We applied the FLAE approach for 643
the sequence of authors; see https://doi.org/10.1371/journal.pbio.0050018. 644
645
Appendix 646
Table A1. Annual means and maxima of Chl-a and TP for the four basins of Lake 647
Balaton (1985-2017) with their corresponding trophic states marked according to 648
the OECD classification (Vollenweider & Kerekes 1982). Red: hypertrophic; orange: 649
eutrophic; blue: mesotrophic; green: oligotrophic. 650
Preprint of Ecological Engineering Volume 98, 804-811 https://doi.org/10.1016/j.ecoleng.2020.105861
21
651
652
6. References 653 654
Bloesch J (1995): Mechanisms, measurement and importance of sediment resuspension in 655
lakes. Marine & Freshwater Research 46, 295-304 656
Çamdevýren H, Demýr N, Kanik A, Keskýn S (2005): Use of principal component scores 657
in multiple linear regression models for prediction of Chlorophyll-a in reservoirs. 658
Ecological Modelling 181, 581-589 659
Carlson RE (1977): A trophic state index for lakes 1. Limnology and oceanography 22, 660
361-369 661
Carpenter SR (2008): Phosphorus control is critical to mitigating eutrophication. Proc Natl 662
Acad Sci U S A 105, 11039-11040 663
YearChl-a
mean
Chl-a
maxTP
Chl-a
mean
Chl-a
maxTP
Chl-a
mean
Chl-a
maxTP
Chl-a
mean
Chl-a
maxTP
1985 0.035 0.099 0.071 0.020 0.052 0.044 0.008 0.018 0.028 0.004 0.009 0.022
1986 0.047 0.202 0.083 0.030 0.120 0.057 0.012 0.034 0.032 0.007 0.013 0.031
1987 0.045 0.085 0.073 0.026 0.064 0.060 0.012 0.020 0.033 0.009 0.014 0.027
1988 0.049 0.160 0.053 0.037 0.137 0.048 0.021 0.064 0.031 0.011 0.025 0.023
1989 0.045 0.160 0.070 0.029 0.085 0.048 0.020 0.064 0.029 0.011 0.020 0.023
1990 0.047 0.147 0.092 0.034 0.098 0.059 0.020 0.079 0.039 0.012 0.032 0.033
1991 0.038 0.099 0.067 0.029 0.074 0.054 0.022 0.062 0.036 0.009 0.016 0.034
1992 0.046 0.262 0.066 0.030 0.174 0.054 0.018 0.083 0.039 0.010 0.030 0.033
1993 0.024 0.043 0.058 0.020 0.039 0.054 0.013 0.021 0.043 0.010 0.016 0.036
1994 0.051 0.203 0.099 0.053 0.193 0.084 0.039 0.137 0.072 0.019 0.087 0.053
1995 0.014 0.041 0.092 0.010 0.024 0.101 0.006 0.015 0.083 0.005 0.013 0.064
1996 0.021 0.055 0.103 0.016 0.061 0.088 0.009 0.032 0.070 0.005 0.010 0.075
1997 0.011 0.036 0.128 0.011 0.027 0.126 0.011 0.025 0.109 0.008 0.017 0.110
1998 0.015 0.030 0.091 0.013 0.032 0.092 0.009 0.017 0.082 0.007 0.016 0.082
1999 0.008 0.021 0.094 0.008 0.014 0.066 0.006 0.012 0.057 0.005 0.010 0.056
2000 0.015 0.066 0.100 0.014 0.046 0.098 0.006 0.011 0.095 0.004 0.009 0.078
2001 0.018 0.056 0.085 0.017 0.044 0.084 0.013 0.039 0.078 0.008 0.020 0.065
2002 0.017 0.050 0.091 0.021 0.078 0.086 0.014 0.049 0.086 0.010 0.025 0.072
2003 0.015 0.053 0.112 0.017 0.063 0.088 0.014 0.044 0.092 0.007 0.017 0.071
2004 0.014 0.037 0.073 0.013 0.024 0.076 0.008 0.020 0.064 0.006 0.018 0.054
2005 0.018 0.048 0.056 0.018 0.040 0.049 0.014 0.038 0.045 0.007 0.015 0.040
2006 0.017 0.052 0.035 0.020 0.053 0.031 0.012 0.027 0.025 0.006 0.009 0.033
2007 0.020 0.057 0.031 0.013 0.024 0.029 0.012 0.034 0.034 0.005 0.008 0.034
2008 0.016 0.039 0.062 0.013 0.033 0.053 0.010 0.022 0.038 0.005 0.010 0.039
2009 0.013 0.028 0.045 0.012 0.023 0.051 0.010 0.036 0.046 0.008 0.021 0.030
2010 0.013 0.039 0.057 0.012 0.025 0.042 0.008 0.015 0.038 0.006 0.017 0.043
2011 0.016 0.041 0.067 0.016 0.044 0.057 0.013 0.040 0.049 0.006 0.009 0.058
2012 0.011 0.026 0.079 0.013 0.026 0.074 0.007 0.019 0.053 0.006 0.010 0.069
2013 0.013 0.026 0.048 0.012 0.021 0.052 0.009 0.018 0.040 0.004 0.008 0.041
2014 0.011 0.021 0.046 0.010 0.022 0.041 0.007 0.018 0.033 0.003 0.006 0.025
2015 0.013 0.029 0.075 0.011 0.036 0.086 0.006 0.016 0.065 0.004 0.006 0.060
2016 0.009 0.017 0.079 0.010 0.027 0.065 0.006 0.008 0.059 0.004 0.006 0.063
2017 0.013 0.041 0.069 0.012 0.022 0.067 0.005 0.011 0.047 0.004 0.009 0.044
Keszthely Basin Szigliget Basin Szemes Basin Siofók Basin
Preprint of Ecological Engineering Volume 98, 804-811 https://doi.org/10.1016/j.ecoleng.2020.105861
22
Cattell RB (1966): The Scree Test For The Number Of Factors. Multivariate Behavioral 664
Research 1, 245-276 665
Cerny BA, Kaiser HF (1977): A Study Of A Measure Of Sampling Adequacy For Factor-666
Analytic Correlation Matrices. Multivariate Behavioral Research 12, 43-47 667
Chapman DV (1996): Water quality assessments: a guide to the use of biota, sediments, 668
and water in environmental monitoring. 669
Clement A, Somlyody L, Koncsos L (1998): Modeling the phosphorus retention of the Kis-670
Balaton upper reservoir. Water science and technology 37, 113-120 671
Cloutier RG, Sanchez M (2007): Trophic Status Evaluation for 154 Lakes in Quebec, 672
Canada: Monitoring and Recommendations. Water Quality Research Journal 42, 673
252-268 674
Crossetti LO, Stenger-Kovács C, Padisák J (2013): Coherence of phytoplankton and 675
attached diatom-based ecological status assessment in Lake Balaton. 676
Hydrobiologia 716, 87-101 677
EC (2000): Directive 2000/60/European Commission of the European Parliament and of 678
the Council of 23 October 2000 establishing a framework for community action in 679
the field of water policy. Official Journal of the European Communities L 327, 1-680
72 681
EPA UEPA 2015: Preventing Eutrophication: Scientific Support for Dual Nutrient Criteria 682
- Information on Preventing Eutrophication: Scientific Support for Dual Nutrient 683
Criteria. EPA 820-S-15-001 684
Hajnal É, Padisák J (2008): Analysis of long-term ecological status of Lake Balaton based 685
on the ALMOBAL phytoplankton database. In: Nõges T et al. (Editors), European 686
Large Lakes Ecosystem changes and their ecological and socioeconomic impacts. 687
Springer Netherlands, Dordrecht, pp. 227-237 688
Hatvani IG, Kovács J, Kovács IS, Jakusch P, Korponai J (2011): Analysis of long-term 689
water quality changes in the Kis-Balaton Water Protection System with time series-690
, cluster analysis and Wilks’ lambda distribution. Ecological Engineering 37, 629-691
635 692
Hatvani IG 2014: Application of state-of-the-art geomathematical methods in water 693
protection: - on the example of the data series of the Kis-Balaton Water Protection 694
System. Ph.D. Thesis, Eötvös Loránd University, 110 pp 695
Hatvani IG, Clement A, Kovács J, Kovács IS, Korponai J (2014): Assessing water-quality 696
data: The relationship between the water quality amelioration of Lake Balaton and 697
the construction of its mitigation wetland. Journal of Great Lakes Research 40, 115-698
125 699
Hatvani IG, Kovács J, Márkus L, Clement A, Hoffmann R, Korponai J (2015): Assessing 700
the relationship of background factors governing the water quality of an agricultural 701
watershed with changes in catchment property (W-Hungary). Journal of Hydrology 702
521, 460-469 703
Hatvani IG, Clement A, Korponai J, Kern Z, Kovács J (2017): Periodic signals of climatic 704
variables and water quality in a river – eutrophic pond – wetland cascade ecosystem 705
tracked by wavelet coherence analysis. Ecological Indicators 83, 21-31 706
Hatvani IG, Kirschner AKT, Farnleitner AH, Tanos P, Herzig A (2018): Hotspots and main 707
drivers of fecal pollution in Neusiedler See, a large shallow lake in Central Europe. 708
Environ Sci Pollut Res 25, 28884-28898 709

Preprint of Ecological Engineering Volume 98, 804-811 https://doi.org/10.1016/j.ecoleng.2020.105861
23
Herodek S, Vörös L, Tóth F (1982): The mass and production of phytoplankton and the 710
eutrophication of Lake Balaton. Hidrológiai Közlöny 62, 220-229 711
Herodek S (1984): The eutrophication of Lake Balaton: Measurements, modeling and 712
management: With 4 figures in the text. Internationale Vereinigung für theoretische 713
und angewandte Limnologie: Verhandlungen 22, 1087-1091 714
Ho JC, Michalak AM, Pahlevan N (2019): Widespread global increase in intense lake 715
phytoplankton blooms since the 1980s. Nature 574, 667-670 716
Hudnell HK (2008): Cyanobacterial harmful algal blooms: state of the science and research 717
needs, 619. Springer Science & Business Media 718
Istvanovics V (2002): P retention as a function of environmental conditions in a large, reed-719
dominated wetland. Internationale Vereinigung fur Theoretische und Angewandte 720
Limnologie Verhandlungen 27, 4005-4008 721
Istvánovics V, Vörös L, Herodek S, Tóth, László G., Tátrai I (1986): Changes of 722
phosphorus and nitrogen concentration and of phytoplankton in enriched lake 723
enclosures1. Limnology and Oceanography 31, 798-811 724
Istvánovics V (1988): Seasonal variation of phosphorus release from the sediments of 725
Shallow Lake Balaton (Hungary). Water Research 22, 1473-1481 726
Istvánovics V, Herodek S (1995): Estimation of net uptake and leakage rates of 727
orthophosphate from 32P-uptake kinetics by a linear force-flow model. Limnology 728
and Oceanography 40, 17-32 729
Istvánovics V, Osztoics A, Honti M (2004): Dynamics and ecological significance of daily 730
internal load of phosphorus in shallow Lake Balaton, Hungary. Freshwater Biology 731
49, 232-252 732
Istvánovics V, Clement A, Somlyódy L, Specziár A, G.-Tóth L, Padisák J (2007): Updating 733
water quality targets for shallow Lake Balaton (Hungary), recovering from 734
eutrophication. In: Qin B, Liu Z , Havens K (Editors), Eutrophication of Shallow 735
Lakes with Special Reference to Lake Taihu, China. Springer Netherlands, 736
Dordrecht, pp. 305-318 737
Istvánovics V (2009): Eutrophication of Lakes and Reservoirs. In: Likens GE (Editor), 738
Encyclopedia of Inland Waters. Academic Press, Oxford, pp. 157-165 739
Istvánovics V (2019): Discussions on the summer algae blooms of Lake Balaton. In: public 740
(Hrsg.). http://www.hirbalaton.hu/, http://www.hirbalaton.hu/ 741
Jakuschné Kocsis T, Anda A (2018): Parametric or non-parametric: analysis of rainfall 742
time series at a Hungarian meteorological station. IDŐJÁRÁS/QUARTERLY 743
JOURNAL OF THE HUNGARIAN METEOROLOGICAL SERVICE 122, 203-744
216 745
Janssen ABG, Teurlincx S, An S, Janse JH, Paerl HW, Mooij WM (2014): Alternative 746
stable states in large shallow lakes? Journal of Great Lakes Research 40, 813-826 747
Jeppesen E et al. (2005): Lake responses to reduced nutrient loading – an analysis of 748
contemporary long-term data from 35 case studies. Freshwater Biology 50, 1747-749
1771 750
Kaiser HF (1960): The Application of Electronic Computers to Factor Analysis. 751
Educational and Psychological Measurement 20, 141-151 752
Kendall MG (1975): Rank correlation methods, 4. Charles Griffin London, UK 753
Preprint of Ecological Engineering Volume 98, 804-811 https://doi.org/10.1016/j.ecoleng.2020.105861
24
Kocsis T, Kovacs-Szekely I, Anda A (2017): Comparison of parametric and non-754
parametric time-series analysis methods on a long-term meteorological data set. 755
Central European Geology 60, 316-333 756
Kocsis T, Kovács-Székely I, Anda A (2020): Homogeneity tests and non-parametric 757
analyses of tendencies in precipitation time series in Keszthely, Western Hungary. 758
Theor Appl Climatol 139, 849-859 759
Kovács J, Hatvani IG, Korponai J, Kovács IS (2010): Morlet wavelet and autocorrelation 760
analysis of long-term data series of the Kis-Balaton water protection system 761
(KBWPS). Ecological Engineering 36, 1469-1477 762
Kovács J, Korponai J, Székely Kovács I, Hatvani IG (2012a): Introducing sampling 763
frequency estimation using variograms in water research with the example of 764
nutrient loads in the Kis-Balaton Water Protection System (W Hungary). 765
Ecological Engineering 42, 237-243 766
Kovács J, Nagy M, Czauner B, Kovács IS, Borsodi AK, Hatvani IG (2012b): Delimiting 767
sub-areas in water bodies using multivariate data analysis on the example of Lake 768
Balaton (W Hungary). Journal of Environmental Management 110, 151-158 769
Kovács J, Tanos P, Korponai J, Székely IK, Gondár K, Gondár-Sőregi K, Hatvani IG 770
(2012c): Analysis of Water Quality Data for Scientists. In: Kostas Voudouris , 771
Voutsa D (Editors), Water Quality Monitoring and Assessment. InTech, pp. 65-94 772
Kovács J, Kovács S, Magyar N, Tanos P, Hatvani IG, Anda A (2014): Classification into 773
homogeneous groups using combined cluster and discriminant analysis. 774
Environmental Modelling & Software 57, 52-59 775
Lau SSS, Lane SN (2002): Biological and chemical factors influencing shallow lake 776
eutrophication: a long-term study. Science of The Total Environment 288, 167-181 777
López-López E, Sedeño-Díaz JE, Ruiz-Picos RA (2016): Shallow lakes of the Mexican 778
Central Plateau: assessing their health condition with oxidative stress biomarkers 779
in sentinel organisms. Lake sciences and climate change. InTech, 63-79 780
Macias-Fauria M, Grinsted A, Helama S, Holopainen J (2012): Persistence matters: 781
Estimation of the statistical significance of paleoclimatic reconstruction statistics 782
from autocorrelated time series. Dendrochronologia 30, 179-187 783
Magyar N, Hatvani IG, Székely IK, Herzig A, Dinka M, Kovács J (2013): Application of 784
multivariate statistical methods in determining spatial changes in water quality in 785
the Austrian part of Neusiedler See. Ecological Engineering 55, 82-92 786
Mann HB (1945): Nonparametric Tests Against Trend. Econometrica 13, 245-259 787
Markad AT, Landge AT, Nayak BB, Inamdar AB, Mishra AK (2019): Trophic state 788
modeling for shallow freshwater reservoir: a new approach. Environ Monit Assess 789
191, 586 790
Marsden MW (1989): Lake restoration by reducing external phosphorus loading: the 791
influence of sediment phosphorus release. Freshwater Biology 21, 139-162 792
Mitamura O, Saijo Y, Hino K, Barbosa FAR (1995): The significance of regenerated 793
nitrogen for phytoplankton productivity in the Rio Doce Valley Lakes, Brazil. 794
Arch. Hydrobiol 134, 179-194 795
Muli JR (1996): Environmental problems of Lake Victoria (East Africa): What the 796
international community can do. Lakes & Reservoirs: Science, Policy and 797
Management for Sustainable Use 2, 47-53 798

Preprint of Ecological Engineering Volume 98, 804-811 https://doi.org/10.1016/j.ecoleng.2020.105861
25
Oberholster PJ, Botha A-M, Cloete TE (2006): Toxic cyanobacterial blooms in a shallow, 799
artificially mixed urban lake in Colorado, USA. Lakes & Reservoirs: Science, 800
Policy and Management for Sustainable Use 11, 111-123 801
Oliveira M, Machado AV (2013): The role of phosphorus on eutrophication: a historical 802
review and future perspectives. Environmental Technology Reviews 2, 117-127 803
Olsen RL, Chappell RW, Loftis JC (2012): Water quality sample collection, data treatment 804
and results presentation for principal components analysis – literature review and 805
Illinois River watershed case study. Water Research 46, 3110-3122 806
Padisák J, Reynolds CS (2003): Shallow lakes: the absolute, the relative, the functional and 807
the pragmatic. Hydrobiologia 506, 1-11 808
Padisák, J, 1985. Population dynamics of the freshwater dinoflagellate Ceratium 809
hirundinella in the largest shallow lake of Central Europe, Lake Balaton, Hungary. 810
Freshwater Biology 15, 43–52. doi:10.1111/j.1365-2427.1985.tb00695.x. 811
Page RM, Lischeid G, Epting J, Huggenberger P (2012): Principal component analysis of 812
time series for identifying indicator variables for riverine groundwater extraction 813
management. Journal of Hydrology 432-433, 137-144 814
Pomogyi P (1996): Second Kis-Balaton conference: Summary of the research result on the 815
KBWPS from between 1991-1995. University of Pannonia Georgikon Faculty of 816
Agriculture, Keszthely 817
Présing M, Herodek S, Preston T, Vörös L (2001): Nitrogen uptake and the importance of 818
internal nitrogen loading in Lake Balaton. Freshwater Biology 46, 125-139 819
Présing M, Sprőber P, Kovács AW, Vörös L, Kenesi G, Preston T, Takátsy A, Kóbor I 820
(2008): Phytoplankton nitrogen demand and the significance of internal and 821
external nitrogen sources in a large shallow lake (Lake Balaton, Hungary). In: 822
Nõges T et al. (Editors), European Large Lakes Ecosystem changes and their 823
ecological and socioeconomic impacts. Springer Netherlands, Dordrecht, pp. 87-95 824
Qin B, Liu Z, Havens K (2007): Eutrophication of shallow lakes with special reference to 825
Lake Taihu, China, 194. Springer Science & Business Media 826
Rodhe W (1969): Crystallization of eutrophication concepts in northern Europe. 827
Rolighed J, Jeppesen E, Søndergaard M, Bjerring R, Janse JH, Mooij WM, Trolle D 828
(2016): Climate Change Will Make Recovery from Eutrophication More Difficult 829
in Shallow Danish Lake Søbygaard. Water 8, 459 830
Sagehashi M, Sakoda A, Suzuki M (2001): A mathematical model of a shallow and 831
Eutrophic Lake (The Keszthely Basin, Lake Balaton) and simulation of restorative 832
manipulations. Water Research 35, 1675-1686 833
Sas H (1990): Lake restoration by reduction of nutrient loading: Expectations, experiences, 834
extrapolations. SIL Proceedings, 1922-2010 24, 247-251 835
Scheffer M (2013): Ecology of Shallow Lakes. Springer Netherlands 836
Schindler DW (1974): Eutrophication and Recovery in Experimental Lakes: Implications 837
for Lake Management. Science 184, 897 838
Schindler DW, Carpenter SR, Chapra SC, Hecky RE, Orihel DM (2016): Reducing 839
Phosphorus to Curb Lake Eutrophication is a Success. Environmental Science & 840
Technology 50, 8923-8929 841
Sebestyén V, Németh J, Juzsakova T, Domokos E, Kovács Z, Rédey Á (2017): Aquatic 842
environmental assessment of Lake Balaton in the light of physical-chemical water 843
parameters. Environ Sci Pollut Res 24, 25355-25371 844
Preprint of Ecological Engineering Volume 98, 804-811 https://doi.org/10.1016/j.ecoleng.2020.105861
26
Sebestyén V, Németh J, Juzsakova T, Domokos E, Rédey Á (2019): Lake Balaton: Water 845
Quality of the Largest Shallow Lake in Central Europe, Encyclopedia of Water. 846
John Wiley & Sons, pp. 1-15 847
Sen PK (1968): Estimates of the Regression Coefficient Based on Kendall's Tau. Journal 848
of the American Statistical Association 63, 1379-1389 849
Sisák I (1993): Analysis of diffuse loads on the western watershed of Lake Balaton using 850
nutrient load estimation method, Candidate thesis. Pannon Agrártudományi 851
Egyetem, Georgikon Mezőgazdaságtudományi Kar, Keszthely 852
Somlyódy L, van Straten G (1986): Background to the Lake Balaton Eutrophication 853
Problem, Modeling and Managing Shallow Lake Eutrophication. Springer, pp. 3-854
18 855
Søndergaard M, Jensen JP, Jeppesen E (1999): Internal phosphorus loading in shallow 856
Danish lakes. Hydrobiologia 408, 145-152 857
Søndergaard M, Jensen JP, Jeppesen E (2003): Role of sediment and internal loading of 858
phosphorus in shallow lakes. Hydrobiologia 506, 135-145 859
Tabachnick BG, Fidell LS (2014): Using multivariate statistics. Pearson Education 860
Limited, Boston, MA, USA 861
Tátrai I, Mátyás K, Korponai J, Paulovits G, Pomogyi P (2000): The role of the Kis-Balaton 862
Water Protection System in the control of water quality of Lake Balaton. Ecological 863
Engineering 16, 73-78 864
Vitousek PM, Porder S, Houlton BZ, Chadwick OA (2010): Terrestrial phosphorus 865
limitation: mechanisms, implications, and nitrogen–phosphorus interactions. 866
Ecological Applications 20, 5-15 867
Vollenweider RA (1970): Scientific fundamentals of the eutrophication of lakes and 868
flowing waters, with particular reference to nitrogen and phosphorus as factors in 869
eutrophication. OECD Paris 870
Vollenweider RA, Kerekes J (1982): Eutrophication of waters. Monitoring, assessment and 871
control. OECD Cooperative programme on monitoring of inland waters 872
(Eutrophication control). Environment Directorate, OECD, 154 pp 873
Welch EB (2009): Should nitrogen be reduced to manage eutrophication if it is growth 874
limiting? Evidence from Moses Lake. Lake and Reservoir Management 25, 401-875
409 876
Wen Z, Song K, Liu G, Shang Y, Fang C, Du J, Lyu L (2019): Quantifying the trophic 877
status of lakes using total light absorption of optically active components. 878
Environmental Pollution 245, 684-693 879
Wetzel RG (2001): Limnology. Limnology (Third Edition). Academic Press, San Diego, 880
1006 pp 881
882