spe-189564-ms application of polyelectrolyte complex
TRANSCRIPT
SPE-189564-MS 1
SPE-189564-MS
Application of Polyelectrolyte Complex Nanoparticles to Increase the Lifetime of Poly(Vinyl Sulfonate) Scale Inhibitor Masoumeh Veisi, Stephen Johnson, Department of Chemical and Petroleum Engineering, The University of Kansas, Karen Peltier, Tertiary Oil Recovery Program, The University of Kansas; Cory Berkland, School of Pharmacy - Pharmaceutical Chemistry, Chemical & Petroleum Engineering, The University of Kansas, Jenn-Tai Liang, Harold Vance Department of Petroleum Engineering, Texas A&M, College Station, Reza Barati, Department of Chemical and Petroleum Engineering, The University of Kansas
Copyright 2018, Society of Petroleum Engineers This paper was prepared for presentation at the SPE International Conference and Exhibition on Formation Damage Control held in Lafayette, Louisiana, USA, 7-9 February 2018. This paper was selected for presentation by an SPE program committee following review of information contained in an abstract submitted by the author(s). Contents of the paper have not been reviewed by the Society of Petroleum Engineers and are subject to correction by the author(s). The material does not necessarily reflect any position of the Society of Petroleum Engineers, its officers, or members. Electronic reproduction, distribution, or storage of any part of this paper without the written consent of the Society of Petroleum Engineers is prohibited. Permission to reproduce in print is restricted to an abstract of not more than 300 words; illustrations may not be copied. The abstract must contain conspicuous acknowledgment of SPE copyright.
Abstract Poly(vinyl sulfonate) (PVS) is an effective scale inhibitor in preventing the formation of barium sulfate. However, the low adsorption of PVS onto the rock results in a short squeeze treatment lifetime in reservoir. The application of nano-sized polyelectrolyte complexes (PECs) to increase the treatment lifetime of PVS is examined in this work. Positively charged nanoparticles consisting of poly(ethyleneimine) and PVS were prepared. Sand pack studies were performed to quantify the adsorption and release of PEC-entrapped PVS, and the effect of ionic shock on the release of PEC-entrapped PVS was studied. It was found that an increase in the ionic strength of the displacing fluid released the PVS from the nanoparticle structure. Dynamic tube blocking tests showed that PEC-entrapped PVS increases the squeeze treatment lifetime by 22% compared to unentrapped PVS. The results also suggest that ionic shocks improve the release of PVS, prolonging the treatment by 40% compared to unentrapped PVS. Keywords: nanoparticles, polyelectrolyte complex, scale inhibitor, core flooding, dynamic tube blocking test Introduction The use of seawater to maintain the reservoir pressure in water flooding is a well-established and mature operation in enhanced oil recovery (Frenier and Ziauddin 2008; Hughes and Pfister 1947). However, the presence of sulfate ion in seawater increases the potential for scale formation because of breakthrough of seawater along with formation water containing high concentrations of multivalent cations such as barium and strontium. Formation of scales such as insoluble barium sulfate (barite) can pose costly operational problems by plugging the injection and production wells, production tubing and surface equipment (Crabtree et al. 1999; Frenier and Ziauddin 2008;

SPE-189564-MS 2
Kelland 2014). The very low water solubility of the barite (log Ksp = -9.96 at 20°C) and its insensitivity to pH has made it one of the hardest scales to remove (Becker 1998). The most common approach to this problem is to prevent the barite from forming in the first place, using scale-inhibiting chemicals (Gill 1996; Sarig 1974; Sarig and Tartakovsky 1974; van der 1990; Weijnen and Van Rosmalen 1985; Zhang et al. 2016). Polymers such as poly(vinyl sulfonate) (PVS) have been known for their scale inhibition properties for many years. It is reported that polymers with vinyl sulfonic backbone such as PVS prevent barite scale through nucleation inhibition (Emmons 1987; Falk et al. 1992; Kelland 2014). PVS is a negatively charged polyelectrolyte with strongly acidic functional groups and low pKa values which confer good scale inhibition properties (Kelland 2014).
Despite PVS’s scale inhibition properties, performance of the polymer in the field suffers from weak adsorption onto the rock (Carlberg 1987; Falk et al. 1992; Hann et al. 1997; Jordan 2004) and hence a decrease of concentration in the solution over time as the formation water is produced (Rosa et al. 2016). This results in very short squeeze lifetime that renders the treatment uneconomical. Scale Inhibitor Squeeze Treatment Squeeze treatment is a common method which is used to apply the scale inhibitor in production wells to prevent scale formation. In this process, a small volume of concentrated scale inhibitor solution is injected into the production well above the formation pressure to allow the scale inhibitor to penetrate some distance from the wellbore. Scale inhibitor is retained in the reservoir by absorption onto the rock and/or by precipitation in the pore space. When the well is put back in production, the concentration of scale inhibitor gradually decreases as the retained inhibitor is washed off by the produced water. Once inhibitor concentration decreases to its minimum effective concentration (MEC), the process is repeated. It is desirable to maximize the squeeze lifetime of these chemicals to prevent significant oil production loss during the scale inhibitor injection periods and reduce the chemical costs by avoiding the need for overtreatment with active components that are not effective (Kelland 2014).
The squeeze treatment lifetime of polymeric scale inhibitors including PVS is shorter than for phosphoric scale inhibitors due to their low adsorption in the reservoir. These limitations make it necessary to develop new methods that can enhance the adsorption of PVS onto reservoir rocks. New Treatment System: Polyelectrolyte Complexes The mixing of negatively charged polyanion and positively charged polycation solutions leads to spontaneous aggregation of the two polyelectrolytes to form sub-micrometer sized polyelectrolyte complexes (PECs). PECs were first used in drug delivery systems to entrap and deliver specific chemicals like DNA to a targeted part of the body (Tiyaboonchai et al. 2003). PECs can entrap chemicals through electrostatic interactions, or the PEC components themselves may be the active species. They also can allow a delayed or gradual release of these chemicals if a parameter such as pH, temperature, ionic strength changes in the environment (Berkland et al. 2008; Cordova et al. 2008; Tiyaboonchai 2002; Tiyaboonchai et al. 2003). The small size of the aggregates (nanoparticles) provides good colloidal stability and penetration into the small rock pores. The nanoparticle charge can be manipulated to control the nanoparticle retention on the rock and therefore improve the squeeze treatment lifetime.
This study is a continuation of our previous work on the application of PEC nanoparticles (NP) to entrap and release the poly(vinyl sulfonate) scale inhibitor. In the previous work, positively charged nanoparticles consisting of a polycation, poly(ethyleneimine) (PEI) and the polyanionic poly(vinyl sulfonate) (PVS) was developed to entrap the PVS scale inhibitor within the structure.

SPE-189564-MS 3
The NP formulation was optimized by mixing different mass ratios of PEI and PVS solutions at different pHs of PEI stock solutions. It was shown that PECs could improve the PVS adsorption on the rock through charge alteration. (Veisi 2017) The objective of the present work was to study the adsorption and release of PEC-entrapped PVS in sand-packs and core flooding and to compare the treatment lifetime of PEC-entrapped PVS with that of free PVS. The effect of ionic strength shock on the release of PVS from the nanoparticles was also studied. Sand-pack and core flooding in combination with a dynamic tube blocking test was used to study the nanoparticles’ scale inhibition performance and squeeze treatment lifetime. The PECs entrapped the PVS in their structure and released the scale-inhibiting polymer gradually when ionic strength of the surrounding brine was increased. This enhanced PVS adsorption, followed by a slow release of the polymer, extended the squeeze treatment lifetime.
Description and Application of Equipment and Processes Materials Branched poly(ethyleneimine) (PEI, cat # 408727) with molecular weight ~25 kDa was purchased from Sigma-Aldrich (St. Louis, MO) and was used without further purification. Poly(vinyl sulfonic acid, sodium salt) solution (25% wt in H2O, cat# 278424) was purchased from Sigma-Aldrich and was used as received.
Inorganic salts used to prepare different brine recipes were sodium chloride (NaCl, cat# S640), potassium chloride (KCl, cat# BP366), sodium bicarbonate (NaHCO3, cat # S233), sodium acetate (CH3COONa. 3H2O, cat # S607), calcium chloride (CaCl2. 2H2O, cat # C69), magnesium chloride (MgCl2.2H2O, cat # BP214), barium chloride (BaCl2, cat #B31), sodium sulfate (Na2SO4, cat# S429), and magnesium sulfate (MgSO4, cat # 893303). All were used as received from Fisher Scientific (Hampton, NH). Strontium chloride (SrCl2. 6H2O, cat # 255521) was purchased from Sigma-Aldrich. Hydrochloric acid (HCl, 6 N, cat#3750-32) was purchased from RICCA chemical (Arlington, TX) and was used to modify the pH of the PEI solutions. Nitric acid (HNO3, 70%, cat# A483-212) was used for the ICP measurements and was purchased from Fisher Scientific. Ethylenediaminetetraacetic acid (EDTA, cat# E9884) was purchased from Sigma-Aldrich and and was used to remove the precipitated scale from the tubing in the dynamic tube blocking test. Preparation of PEC Nanoparticles Stock solutions of, respectively, 1.8% (w/w) PVS and 1% (w/w) PEI were prepared by dissolving the required mass in reverse osmosis (RO) water. The PEI solution was first diluted with RO water to slightly higher than 0.1% w/w and its pH was adjusted from 10.6 to 4 using 6N HCl. The final concentration of the PEI solution was adjusted to 0.1% (w/w) after the pH adjustment. To assemble the PEC nanoparticles, RO water (40.5 g) was added to 270 g of PEI stock solution and was mixed using a magnetic stirrer in a glass beaker. After a few seconds, 20.25 g of PVS solution was added rapidly to the PEI solution from a syringe fitted with a 16-gauge needle while stirring at 800 rpm at room temperature. After the addition, stirring was continued for about 15 minutes. The nanoparticle suspension was used as prepared. Table 1 shows a typical NP formulation.
Table 1 NP formulation prepared with PEI solution of pH=4
PEI Stock Solution
Concentration, ppm
PVS Stock Solution
Concentration, ppm
PEI Solution in NPs, g
PVS Solution in NPs, g
Water in
NPs, g
PEI Concentration in NPs, ppm
PVS Concentration in NPs, ppm
PVS/PEI Mass Ratio
1000 18000 270 20.25 40.5 816 1100 1.3
SPE-189564-MS 4
Characterization of PPE Nanoparticles In this study, a NanoBrook Omni particle size and zeta potential analyzer (Brookhaven Instruments Corporation, Holtsville, NY, USA) was used to measure the average size of nanoparticles. To prepare the sample, 3 drops of NPs were added to a disposable polystyrene cuvette and RO water was added, to a final volume of 3 ml. Samples were allowed 5 minutes to reach thermal equilibrium within the chamber. NP size was measured by detecting the light scattering at a 90° angle and the average of three consecutive 1-min measurements was recorded. The same instrument was used to measure the zeta potential: five drops of NPs were added to the cuvette and diluted with 1.0 mM KCl solution, to reach a final volume of 1.5 ml. A pair of platinum electrodes was inserted, ensuring that there were no air bubbles trapped between them. To minimize diffusion broadening, zeta potential measurements are performed using the 15° detection angle. The electrophoretic mobility of the nanoparticle was measured from three measurements and zeta potential was automatically estimated by the instrument using the Smoluchowski equation.
Determination of the PVS and PEI Concentrations PVS concentration was determined by measuring the sulfur in PVS using Inductively Coupled Plasma-Optical Emission Spectrometry (ICP-OES) at 181.975 nm. PVS and NP calibration curves were used to relate the measured sulfur concentration to the PVS concentration. Sulfur concentrations were quantified by ICP-OES in an Optima 2000 DV instrument (PerkinElmer, Waltham, MA USA) fitted with an AS 90 plus auto sampler. A cross-flow nebulizer and a Scott spray chamber were used. The RF Power was 1300 W and the nebulizer and auxiliary flows were adjusted to 0.8 and 0.2 L/min, respectively. The plasma flow rate was adjusted to 15 L/min while sample flow was set at 1.5 mL/min. ICP-OES data was processed using Winlab 32 (Ver. 3.0, PerkinElmer, USA).
In addition to ICP, in selected experiments, a Torch Combustion TOC-TN analyzer (Teledyne Tekmar, Mason, OH, USA) was used to calculate the concentration of PVS using an indirect method.
To determine the PEI concentration, nitrogen concentration was measured using the Torch TOC-TN analyzer nitrogen module. The nitrogen results were related to the PEI concentration using a calibration curve (PEI concentration versus total nitrogen concentration in PEI).
Entrapment Efficiency The entrapment efficiency of polymers in nanoparticles was calculated by determining the concentration of polymer in the supernatant after centrifugation of a NP sample and subtracting from the initial amount of polymer added to the nanoparticle suspension. NP samples were centrifuged for 99 min at 14000 g to separate the NPs from free polymer. The supernatant was collected and diluted with RO water to bring the concentration into a range used for ICP measurement. To quantify the concentration of PVS, sulfur concentration was found from the intensity of light emitted at 181.975 nm. To calculate the PEI concentration, nitrogen concentration was measured using Torch TOC-TN instrument. Equation 1 was used to calculate the entrapment efficiency (EE):
𝐸𝐸 =𝐶𝑁𝑃 − 𝐶𝑠𝑢𝑝𝑒𝑟𝑛𝑎𝑡𝑎𝑛𝑡
𝐶𝑁𝑃 (1)
𝐶𝑁𝑃: Initial polymer concentration in NPs 𝐶𝑠𝑢𝑝𝑒𝑟𝑛𝑎𝑛𝑡𝑎𝑛𝑡: Polymer concentration in supernatant after centrifuge
Sand-Pack Studies

SPE-189564-MS 5
Sand pack studies were performed to quantify the adsorption of PEC-entrapped PVS onto the matrix and subsequent release of PVS into solution. The apparatus consisted of a glass sand-pack holder (ACE Glass Incorporated, Vineland, NJ, USA) a preheating column (Kontes Chromaflex water-jacketed chromatography columns, Kimble Chase, Rockwood, TN, USA), a Honeywell linear differential pressure transducers (model: STD930, Honeywell, Morris Plains, NJ, USA), an Isco 1000D syringe pump with controller (Teledyne Isco, Lincoln, NE, USA), two acrylic transfer cylinders (~1500 cm3, fabricated in-house), recirculating water bath and associated 1/8 inch O.D. tubing and Swagelok valves. The apparatus was assembled inside a temperature-controlled cabinet. Figure 1 shows a schematic diagram of the set-up. Table 2 shows the physical characteristics of the sand-pack holder. The sand-pack holder incorporates a water jacket which allowed us to connect the sand-pack to a water bath and control its temperature.
Table 2 Physical characteristics of the sand-pack holder
Type Glass, water-jacketed Length, cm 30.0 Internal diameter, cm 1.62 Radius, cm 0.81 X-sectional area, cm2 2.06 Volume, cm3 61.84
SAMPLE COLLECTOR
SOLTROL
KCL OR MODIFIED
BRINE
ISCO PUMP
SOLTROL SOLTROL
NP
NANOPARTICLE
KCL OR MODIFIED
BRINE
PREHEATING COLUMN
3-WAY SWAGELOK VALVE
2-WAY SWAGELOK VALVE
COMPUTER
PRESSURE TRANSDUCER
40 °C
WATER BATH
SAND PACK
Figure 1 Schematic of the set-up used for the nanoparticles adsorption and release studies in the sand-pack
Sand-Pack Preparation
SPE-189564-MS 6
Berea sandstone crop was crushed and sieved. The fraction that passed through a 50-mesh screen, but was retained on a 200-mesh screen (-50/+200 mesh) was used for the sand-pack study. The sieved sand was washed with RO water and dried in the oven at 60 °C to constant weight. Two nylon mesh discs with a pore size of 35 and 325 µm were placed on the caps on both sides of sand-pack to prevent the sand from leaving the sand-pack. The sand-pack holder was filled with the sand gradually, using a vibrating motor attached to the sand-pack holder to form a compact and homogenous sand-pack before the upper end cap was installed. Next, water was injected into the sand-pack from the bottom to the top to remove all the air from the sand-pack. Finally, the sand-pack was washed with 5 pore volume (PV) of RO water from the top.
A tracer test was performed to test the sand-pack homogeneity and calculate the sand-pack pore volume and porosity. A solution of a synthetic brine (Table 3) with 1% KNO3 (w/w) added was used as the tracer solution and the sand-pack outlet was connected to an in-line UV-vis spectrometer. Pressure drop was measured across the sand-pack. The tracer concentration was determined from UV absorption data at 302 nm wavelength recorded using an in-line UV-visible spectrophotometer (ProStar 340 UV-Vis Detector , varian, Palo Alto, CA) at the outlet. The UV and pressure transducer were connected to a computer and data was collected by LabVIEW software (National Instrument Corporation). Equal area method was used to calculate the pore volume from the tracer test. Permeability was determined by measuring the pressure drop across the core while pumping brine at different flow rates through the core. Darcy’s law was used to calculate the permeability using the pressure drop data (Equation 2):
𝑘 = 𝜇 ∆𝑥(𝑄
𝐴)∆𝑃 (2)
where, Q is the fluid flow rate in cm³/s, A is the cross-sectional area of the core in cm2, k is the permeability in Da, µ is the injected fluid dynamic viscosity in cP, ΔP is pressure gradient in atm and ∆x is the core length in cm. The experiment was run at room temperature and atmospheric pressure. The tracer test showed that all sand packs had pore volume of 31.5±0.7 ml, porosity of 50±2% and permeability of 10±0.5 Da.
Table 3 Synthetic brine formulation used for the sand-pack tracer test
Chemical Concentration, mg/L NaCl 26,220 KCl 166 CaCl2.2 H2O 444 MgCl2.6 H2O 1,414 Na2SO4 370
Unentrapped PVS and NP’s Adsorption and Release Study in the Sand-Pack
During this experiment, the sand-pack was positioned vertically and a recirculating water bath was used to heat the sand-pack to 40 °C. The NP suspension/PVS solution was also heated to 40 °C before injection using a preheating column. All the solutions were injected from the top of sand-pack. An Isco Retriever IV Fraction Collector was used to collect the effluent. Samples were collected in 20 ml vials (61 mm H x 28 mm OD) and time was the basis to control the effluent volume of each vial. The sampling collection time step was adjusted for the injection rate to match the sampling volume of 0.3-0.6 PV (18.7 ml). A fresh sand-pack was prepared for each experiment.
a) PVS Adsorption and Release Test To study the adsorption of PVS on the Berea sandstone, a PVS solution was prepared which had the same concentration as that in the PEC-entrapped PVS (1100 ppm). Using a syringe pump, 5.76 PV of PVS solution was injected into the sand-pack at the rate of 0.45 ml/min (20 feet/day) and
SPE-189564-MS 7
the effluent was collected in the intervals of 0.3 PV. Sand-pack was shut down for ~12 h overnight and PVS was displaced with ~9.5 PV of RO water after shut-in using the same rate, temperature and direction of injection. Effluent samples were collected and diluted with RO water as needed to reach the range of ICP calibration curve for sulfur.
b) NP Adsorption and Release Test Different scenarios were investigated for the adsorption and release of the nanoparticles: CASE SP1: NP-RO-2%KCl-4%KCl. First, 15.7 PV of NPs were injected into the sand-pack at a rate of 2.5 ml/min using a syringe pump. NP breakthrough was observed after the injection of ~3.3 PV of the nanoparticles. Next, the sand-pack was shut-in overnight and the NPs were displaced with RO water after ~12 h in the same direction that they were injected. RO water was injected into the sand-pack for 24 h (22.5 PV) at a rate of 0.425 ml/min and at the same temperature (40 °C). After water injection, the sand-pack was washed with 2% KCl for 24 h (23.3 PV) to determine if a brine solution could increase the NP release from the sand. The previous process was repeated with 4% KCl for 24 h (23.24 PV).
All the effluents were collected and the sulfur concentration in the samples was analyzed by ICP. To prepare the samples for the ICP measurement, the effluent samples collected during the nanoparticle injection phase were diluted as needed to fit in the range of the calibration curve used for the ICP measurements (typically 1-15 ppm). The effluent samples collected during the RO water displacement were used without any dilution. Effluent samples collected during 2% KCl injection were diluted 10 times with RO water while the effluent samples containing 4% KCl were diluted 20 times. To cancel out the effect of the sample matrix on the ICP analysis, solutions were prepared in which the chemical compositions of the blank, standards, calibration curves, and samples were identical. Therefore, blank and sulfur standard solutions (used during the ICP measurements) were prepared in a similar brine composition to the unknown samples. It was assumed that the composition of the injected brine did not change after injection into the sand-pack and therefore the effluent samples had a similar composition as the brine before injection. For example, when analyzing samples containing 0.2% KCl (2% KCl samples after dilution), the same concentration of KCl was added to the blank, sulfur and PVS standard solutions. Therefore, multiple PVS calibration curves were prepared which had the same matrix as the unknown samples. Depending on the samples, a NP or a PVS calibration curve was used to relate the measured sulfur concentration to the PVS concentration. If the displaced (collected) samples contained NPs, the NP calibration curve was used; otherwise a PVS calibration curve with the same matrix as the sample was used to measure the PVS concentration. Light scattering was used to confirm the presence of NPs in the collected samples. If the NP count rate was higher than 100 kcps (counts per second), the NP calibration curve was used.
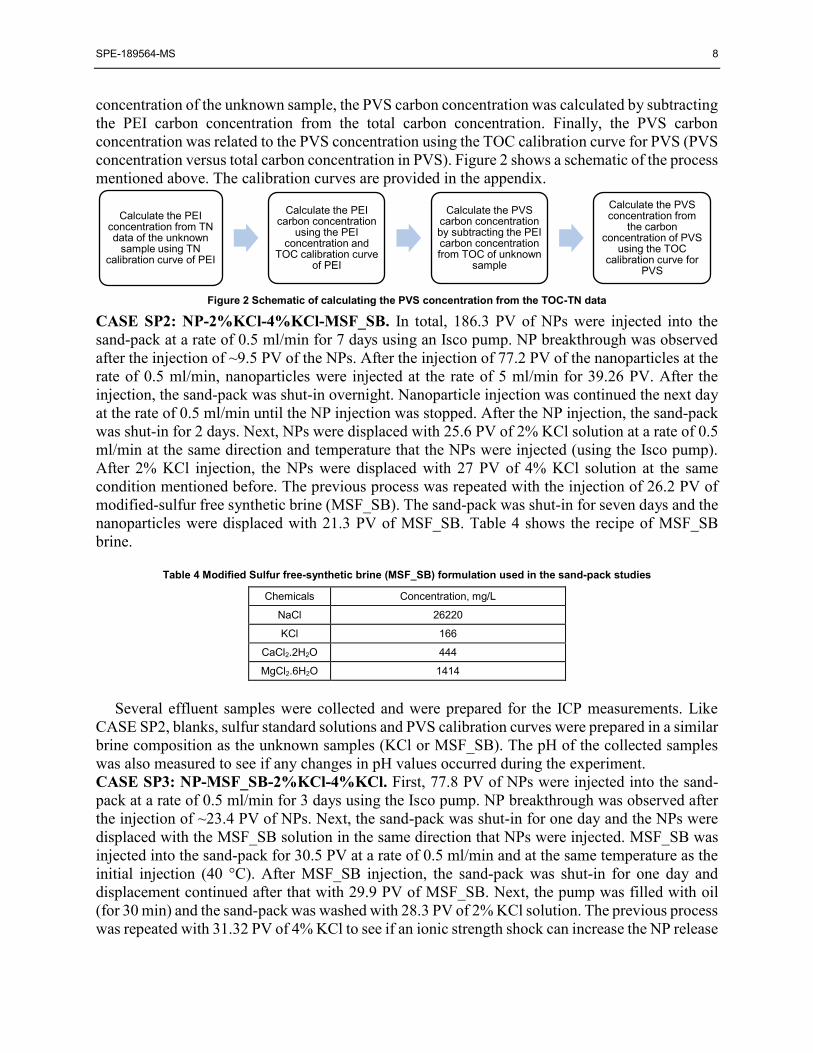
Some samples were also selected and the PVS and PEI concentrations were calculated with the Torch TOC-TN instrument. To prepare the samples, they were diluted with RO water as needed to reach the desired concentrations in the range of the carbon and nitrogen calibration curves. A PVS and PEI calibration curve were also prepared to relate the PEI concentration to the carbon and nitrogen concentration in the PEI and to relate the PVS concentration to the carbon in the PVS. To calculate the PVS concentration from the TOC-TN measurements, an indirect method was used. First, the nitrogen concentration was measured in the unknown samples and the results were related to the PEI concentration using the TN calibration curve (PEI concentration versus total nitrogen concentration in PEI). Once the PEI concentration was determined, the carbon concentration for PEI was back-calculated from the TOC calibration curve for PEI (PEI concentration versus total carbon concentration in PEI). Next, having the total carbon
SPE-189564-MS 8
concentration of the unknown sample, the PVS carbon concentration was calculated by subtracting the PEI carbon concentration from the total carbon concentration. Finally, the PVS carbon concentration was related to the PVS concentration using the TOC calibration curve for PVS (PVS concentration versus total carbon concentration in PVS). Figure 2 shows a schematic of the process mentioned above. The calibration curves are provided in the appendix.
Figure 2 Schematic of calculating the PVS concentration from the TOC-TN data
CASE SP2: NP-2%KCl-4%KCl-MSF_SB. In total, 186.3 PV of NPs were injected into the sand-pack at a rate of 0.5 ml/min for 7 days using an Isco pump. NP breakthrough was observed after the injection of ~9.5 PV of the NPs. After the injection of 77.2 PV of the nanoparticles at the rate of 0.5 ml/min, nanoparticles were injected at the rate of 5 ml/min for 39.26 PV. After the injection, the sand-pack was shut-in overnight. Nanoparticle injection was continued the next day at the rate of 0.5 ml/min until the NP injection was stopped. After the NP injection, the sand-pack was shut-in for 2 days. Next, NPs were displaced with 25.6 PV of 2% KCl solution at a rate of 0.5 ml/min at the same direction and temperature that the NPs were injected (using the Isco pump). After 2% KCl injection, the NPs were displaced with 27 PV of 4% KCl solution at the same condition mentioned before. The previous process was repeated with the injection of 26.2 PV of modified-sulfur free synthetic brine (MSF_SB). The sand-pack was shut-in for seven days and the nanoparticles were displaced with 21.3 PV of MSF_SB. Table 4 shows the recipe of MSF_SB brine.
Table 4 Modified Sulfur free-synthetic brine (MSF_SB) formulation used in the sand-pack studies
Chemicals Concentration, mg/L
NaCl 26220
KCl 166
CaCl2.2H2O 444
MgCl2.6H2O 1414
Several effluent samples were collected and were prepared for the ICP measurements. Like
CASE SP2, blanks, sulfur standard solutions and PVS calibration curves were prepared in a similar brine composition as the unknown samples (KCl or MSF_SB). The pH of the collected samples was also measured to see if any changes in pH values occurred during the experiment. CASE SP3: NP-MSF_SB-2%KCl-4%KCl. First, 77.8 PV of NPs were injected into the sand-pack at a rate of 0.5 ml/min for 3 days using the Isco pump. NP breakthrough was observed after the injection of ~23.4 PV of NPs. Next, the sand-pack was shut-in for one day and the NPs were displaced with the MSF_SB solution in the same direction that NPs were injected. MSF_SB was injected into the sand-pack for 30.5 PV at a rate of 0.5 ml/min and at the same temperature as the initial injection (40 °C). After MSF_SB injection, the sand-pack was shut-in for one day and displacement continued after that with 29.9 PV of MSF_SB. Next, the pump was filled with oil (for 30 min) and the sand-pack was washed with 28.3 PV of 2% KCl solution. The previous process was repeated with 31.32 PV of 4% KCl to see if an ionic strength shock can increase the NP release
Calculate the PEI concentration from TN data of the unknown
sample using TN calibration curve of PEI
Calculate the PEI carbon concentration
using the PEI concentration and
TOC calibration curve of PEI
Calculate the PVS carbon concentration by subtracting the PEI carbon concentration from TOC of unknown
sample
Calculate the PVS concentration from
the carbon concentration of PVS
using the TOC calibration curve for
PVS

SPE-189564-MS 9
from the sand. After the injections, the effluents were prepared for the ICP measurements following the method mentioned in CASE SP1. Table 5 shows the summary of different cases.
Table 5 Different cases studied for the adsorption of NPs and their release in the sand pack
Cases Injected NPs, PV
First Displacing Fluid
Second Displacing Fluid
Third Displacing Fluid
Fourth Displacing Fluid
CASE SP1 15.7 RO water (22.5 PV) 2% KCl (23.3 PV) 4% KCl (23.2 PV) -
CASE SP2 186.3 2% KCl (25.6 PV) 4 % KCl (27.0 PV) MSF_SB (26.2 PV) -
CASE SP3 77.8 MSF_SB (30.5 PV) MSF_SB (29.9 PV) 2% KCl (28.3 PV) 4 % KCl (31.3 PV)
Core Flooding in Combination with Dynamic Tube Blocking Test Dynamic tube blocking tests have been used extensively to assess scale inhibitor performance (Bazin et al. 2005; NACE standard 2005; Schalge and Dormish 1989). In this method, the time taken for brine injected at a constant rate to block a capillary tubing with and without inhibitors is measured. If scale forms at the tubing surface, the precipitates adhere to the wall of tubing and decrease the inner diameter of tubing. This will result in an increase in the pressure drop across the tubing. The method allows us to compare the efficiency of different scale inhibitors under the same conditions. The tube blocking rig usually works as follows: two incompatible brines are heated to a desired temperature in an oven or constant-temperature liquid bath. Usually one of the brines contains the scaling anions and the other carries the scaling cations. The two brines are injected with two separate pumps through different lines until a mixing point. The brine/inhibitor mixture flows through the capillary tubing and the pressure drop across the tubing is measured.
To establish a base case, cationic and anionic brines pass through the tubing and the blocking time is measured. In the next step, usually one of the brines is treated with the scale inhibitor and the blocking time is measured again. The blocking time should increase with the presence of the scale inhibitor in the brine (NACE standard 2005).
Compared to other methods, the dynamic tube blocking test is a good representative of the oilfield production (Graham et al. 2002). The dynamic nature of the test, its capability for the adjustment of pH, temperature, pressure and brine chemistry are some of the advantages of this method. However, one of the main disadvantages of this test is that it does not compare the adsorption of scale inhibitors which is one of the main factors in performance assessment of scale inhibitors.
Core flooding has been used extensively in designing scale inhibition treatments in sandstone cores. This method provides the information needed to study the adsorption and potential formation damage of scale inhibitors in reservoir (Jordan 2004). In the core flooding test, a scale inhibitor is injected into the core at reservoir conditions and its concentration in the effluent is monitored as it is back-produced (Kelland 2014).
In this research, a combination of core flooding and dynamic tube blocking test was used. The addition of core flooding to dynamic tube blocking test can provide a set-up which can compare the performance of PEC-entrapped PVS and unentrapped PVS by including the effect of scale inhibitor adsorption and release. In other words, the test can compare the efficiency of two systems as scale inhibitors. When the concentration of the scale inhibitor drops below the MEC, the scale will start to form and eventually will block the tubing. Therefore, the time to block the tubing under constant injection rate can be used to compare the lifetime of the treatments under different scenarios.
Core Flooding Core Material

SPE-189564-MS 10
Berea sandstone cores (1-inch diameter and 2.75-inch length) within the permeability ranges of 150-200 mD and porosity of 0.2 were cut from larger plugs available at Tertiary Oil Recovery Program (TORP), The University of Kansas. The cores were dried in an oven at 80 °C until their weights were constant.
Core Holder A Hassler-type core holder was used that could hold cores up to 3 inches in length. A confining pressure of 1000 psi was applied to the core using a hydraulic pump. The core inlet was connected to the transfer cylinders and the core output was connected to the UV-vis or capillary tubing.
Saturation Test Saturation method was performed to calculate the pore volume of the cores. To do the saturation test, the cores were weighed and placed in a vacuum desiccator. A vacuum was applied to the desiccator and then the cationic brine (Table ) was introduced into the vessel. After 3-4 h, the core was taken out and weighed again. Each core was weighed five times and the average weight was used as the saturated weight. The difference in weight before and after saturation was divided by the brine density to calculate the pore volume. Cores were stored in the cationic brine until being put in the core holder.
The saturation test for a typical core showed a pore volume of 8.20 ml and 21.7% porosity. From the pressure drop data, the permeability of this core was measured to be 120 mD. The results of the saturation test were confirmed using a tracer test.
Brines Used in Core Flooding Anionic and cationic scale-forming brine was prepared based on the recipe in Table . In these brine solutions, cationic ions in the form of cation chloride (MgCl2, CaCl2, etc.) were added to a water and called cationic brine, and anionic ions in the form of sodium anion (Na2SO4, NaHCO3 etc.) were added to water and called the anionic brine. Cationic brine contained twice the desired final concentration of cationic ions such as K+, Ca2+ and Ba2+ while the anionic brine contained twice the desired concentrations of SO4
2- in the form of Na2SO4. The second solution also contained an equal amount of NaCl as the cationic brine to bring the total NaCl concentration after combining the two solutions to the chosen amount (18383 mg/L, Table ).
Table 6 Synthetic cationic and anionic brine recipe
Anion Concentration, mg/L Cation Concentration, mg/L
Na2SO4 931 MgCl2.6H2O 4315
NaCl 18383 SrCl2.6H2O 589
NaHCO3 690 BaCl2 1369 NaAc.3H2O 597 CaCl2.2H2O 7189
KCl 509 NaCl 18383
Core Flooding and Dynamic Tube Blocking Test Experimental Design
The apparatus consisted of a Hassler-type core holder, two Honeywell linear differential pressure transducers, two Isco 1000D and one Isco 500D syringe pumps with one controller, three acrylic transfer cylinders (~1500 cm3, fabricated in-house), a type T thermocouple and associated T-connectors, 1/8 inch O.D. tubing and Swagelok valves. Stainless steel 316 capillary tubing with outside diameter of 1/16” OD (1.6 mm), inside diameter of 0.034” ID (0.86 mm) and length of 20” (0.5 m) was used for the tube blocking. The time to block the tubing was used to compare the efficiency of the different compositions.

SPE-189564-MS 11
Figure 3 Schematic of dynamic tube blocking test shows the schematic of the core flooding-dynamic block tubing set-up.
SOLTROL
ISCO PUMP 1000d
CATIONIC BRINE
PVS-CATIONIC BRINE OR KCL
PRESSURE TRANSDUCERS
WINLAB
CORE HOLDER
SOLTROL
CATIONIC BRINE
SOLTROL
ANIONIC BRINE
SOLTROL
PVS-CATIONIC BRINE OR
KCL
SOLTROL
ISCO PUMP 500D
WASTE
CAPILLARY TUBE
WASTE
THERMOCOUPLE
TEMPRATRE CONTOLLED CABINET
HEATER
FANFANTHERMOCOUPLE
FLOW DIRECTION
2-WAY SWAGELOK VALVE
3-WAY SWAGELOK VALVE
Figure 3 Schematic of dynamic tube blocking test
The first transfer cylinder was filled with Soltrol oil on the top and anionic brine (Table ) on
the bottom and was controlled by Isco 500D pump. The second transfer cylinder contained Soltrol on the top and cationic brine on the bottom. The last cylinder was filled with Soltrol on the top and either cationic brine-PVS solution or 7% KCl solution on the bottom. The first two cylinders were connected to Isco 1000D pump from the top and the flow was selected between them as needed using a three-way valve. A syringe pump was used to inject the NPs when needed. The system was constructed in such a way that cationic brine or PVS-cationic brine or NPs passed through the core and then met the anionic brine after leaving the core and before entering the capillary tubing. One differential pressure transducer was connected to the inlet and outlet of the core while another pressure transducer recorded the pressure drop across the tubing. The whole setup was inside a temperature controlled cabinet kept at 40 °C. A type T thermocouple was positioned after the tubing to monitor the temperature of fluid as it left the tubing. Pressure drop, temperature of cabinet, viscosity of fluid, flow rate, calculated permeability (using Darcy’s law) were recorded during each test using LabVIEW software (National Instruments Corporation). A log file including the mentioned data was generated by the software for each test.
After each use, the system was taken apart and the tubing and all the connections were cleaned for the next experiment. To clean the tubing and connections, first, a solution of 50% EDTA (pH~11.5) was prepared. Using a pipette, 1 ml of sodium hydroxide solution (0.2 N) was added to 50 ml of EDTA solution to make sure EDTA was fully protonated. This step increased the pH of
SPE-189564-MS 12
the solution to 12.5. Next, air was blown through the tubing to remove the scale as much as possible. This step helps the EDTA solution to pass through the tubing. Next, EDTA solution was injected with a syringe pump at a rate of 0.1 ml/min for 10 h (total of 60 ml). This procedure was enough to obtain the same pressure drop baseline in the tubing as the pressure drop before the scale formation. The same tubing was used throughout the research. Five scenarios were investigated here:
In each procedure, all the solutions were injected at a constant rate of 1 ml/min. In general, cationic brine (or a mixture of cationic-PVS/KCl solution) was injected through the core and was mixed with anionic brine after leaving the core and before entering the capillary tubing. The pressure drop was measured across the core and across the tubing. Data was recorded by LabVIEW software at 10 second intervals. An increase in pressure drop across the tubing was considered an indicator of the scale formation in the tubing. The experiment was ended when the pressure drop across the tubing reached 1 psi. The time to reach a pressure drop across the tubing of 1 psi (0.05 psi/inch) was calculated and was used to compare the treatment lifetime. All the scenarios were repeated three times.
Base Case: Anionic and Cationic Brine Mixing (CASE CT1) In this procedure, cationic brine was injected through the core and was mixed with anionic brine after leaving the core and before entering the tubing.
Continuous Injection of PVS (CASE CT2) In this experiment, a solution of PVS with the same concentration of PVS in NP suspension was prepared in cationic brine. The mixture was injected through the core and was mixed with anionic brine after leaving the core and before entering the tubing. The pressure drop was measured across the core and across the tubing. The experiment was ended after 4 hours.
PVS Adsorption and Release (CASE CT3) This experiment was designed to study the treatment lifetime of PVS after the adsorption onto the core (if any). As in CASE CT2, PVS with the same concentration of PVS in the NP suspension was prepared in the cationic brine. Five pore volumes of the mixture (based on the core pore volume) was injected through the core at 1 ml/min. Next, the PVS-cationic brine was switched with the cationic brine. After leaving the core and before entering the tubing, cationic brine was mixed with anionic brine and pressure drop was measured across the tubing. A one-tailed t-test was used to compare the blocking time of CASE CT3 and CASE CT1 (base case) to see if PVS injection increased the blocking time of tubing significantly.
NP Adsorption and Release (CASE CT4) This experiment was designed to study the adsorption of NPs in the core and their release after the adsorption. Like CASE CT3, 5 pore volumes (based on the core pore volume) of NPs suspension were injected through the core at the constant rate of 1 ml/min. Pressure drop was measured across the core to see if the NP adsorption would damage the core permeability. Next, cationic brine was injected through the core and was mixed with the anionic brine after leaving the core and before entering the tubing. Pressure drop was measured across the core and tubing through the whole experiment. The experiment was ended when the pressure drop across the tubing reached 1 psi. The blocking times were compared with the PVS scenario (CASE CT3) by applying a one-tailed t-test to see if NPs increased the treatment lifetime significantly.
NP Adsorption and Release Combined with Ionic Shock (CASE CT5) As in CASE CT4, nanoparticles were prepared and injected through the core at 1 ml/min (5 PV). Next, cationic brine was injected through the core and was mixed with the anionic brine after leaving the core and before entering the tubing. After ~15 PV injection of the cationic brine, the

SPE-189564-MS 13
cationic brine was switched to 7% KCl solution. KCl solution was injected for 1 PV and the injection was switched back to the cationic brine. Pressure drop was measured across the core and tubing through the whole experiment and the experiment was ended when the pressure drop across the tubing reached 1 psi. The results were compared with CASE CT4 by applying a one-tailed t-test to see if the ionic shock significantly increased the treatment lifetime.
Results and Discussion NP Characterization Table 7 shows typical characteristics of the nanoparticles in this research. Positively charged nanoparticles had a mean hydrodynamic diameter of ~160 nm and pH value of 5.8. The entrapment efficiency of PVS was ~59% for these nanoparticles.
Table 7 NP characterization for a typical recipe (±SE)
Sample Size, nm Polydispersity pH Zeta Potential, mV
Entrapment Efficiency of
PVS
Entrapment Efficiency of
PEI NP(+) 163.56±1.14 0.094±0.007 5.8 28.54±2.48 59% 68%
Sand-pack Studies PVS Adsorption and Release
Figure 4 shows the results of this experiment. The graph shows the concentration of PVS at the effluent divided by the PVS concentration before injection versus the number of pore volumes of solution injected. PVS concentration at the effluent reached its maximum amount (C/Cmax=1) after the injection of approximately 1.5 pore volumes of PVS solution. The PVS injection profile is similar to the tracer test which demonstrates the low adsorption of the PVS on the rock. After the injection of 5.75 PV of PVS, polymer was displaced with RO water. The PVS concentration dropped to almost zero after the injection of 1 PV of RO water. The sharp decrease in PVS concentration in the displacement profile is consistent with weak or no adsorption of the scale inhibitor onto the rock.
Figure 4 PVS adsorption and release profile in sand pack. The results are presented in terms of PVS concentration at the
effluent divided by the PVS concentration before injection plotted versus the number of pore volumes of the injected solution (40 °C).
SPE-189564-MS 14
NP Adsorption and Release Test CASE SP1: NP-RO-2%KCl-4%KCl.
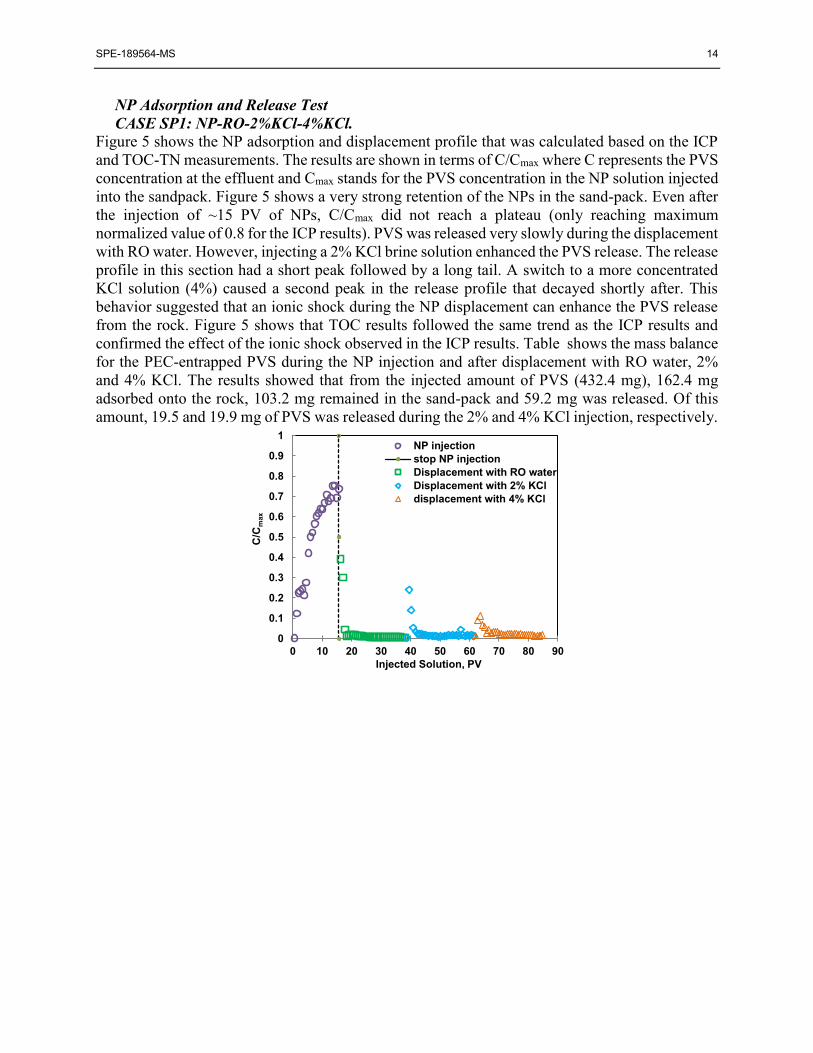
Figure 5 shows the NP adsorption and displacement profile that was calculated based on the ICP and TOC-TN measurements. The results are shown in terms of C/Cmax where C represents the PVS concentration at the effluent and Cmax stands for the PVS concentration in the NP solution injected into the sandpack. Figure 5 shows a very strong retention of the NPs in the sand-pack. Even after the injection of ~15 PV of NPs, C/Cmax did not reach a plateau (only reaching maximum normalized value of 0.8 for the ICP results). PVS was released very slowly during the displacement with RO water. However, injecting a 2% KCl brine solution enhanced the PVS release. The release profile in this section had a short peak followed by a long tail. A switch to a more concentrated KCl solution (4%) caused a second peak in the release profile that decayed shortly after. This behavior suggested that an ionic shock during the NP displacement can enhance the PVS release from the rock. Figure 5 shows that TOC results followed the same trend as the ICP results and confirmed the effect of the ionic shock observed in the ICP results. Table shows the mass balance for the PEC-entrapped PVS during the NP injection and after displacement with RO water, 2% and 4% KCl. The results showed that from the injected amount of PVS (432.4 mg), 162.4 mg adsorbed onto the rock, 103.2 mg remained in the sand-pack and 59.2 mg was released. Of this amount, 19.5 and 19.9 mg of PVS was released during the 2% and 4% KCl injection, respectively.
0
0.1
0.2
0.3
0.4
0.5
0.6
0.7
0.8
0.9
1
0 10 20 30 40 50 60 70 80 90
C/C
max
Injected Solution, PV
NP injectionstop NP injectionDisplacement with RO waterDisplacement with 2% KCldisplacement with 4% KCl
SPE-189564-MS 15
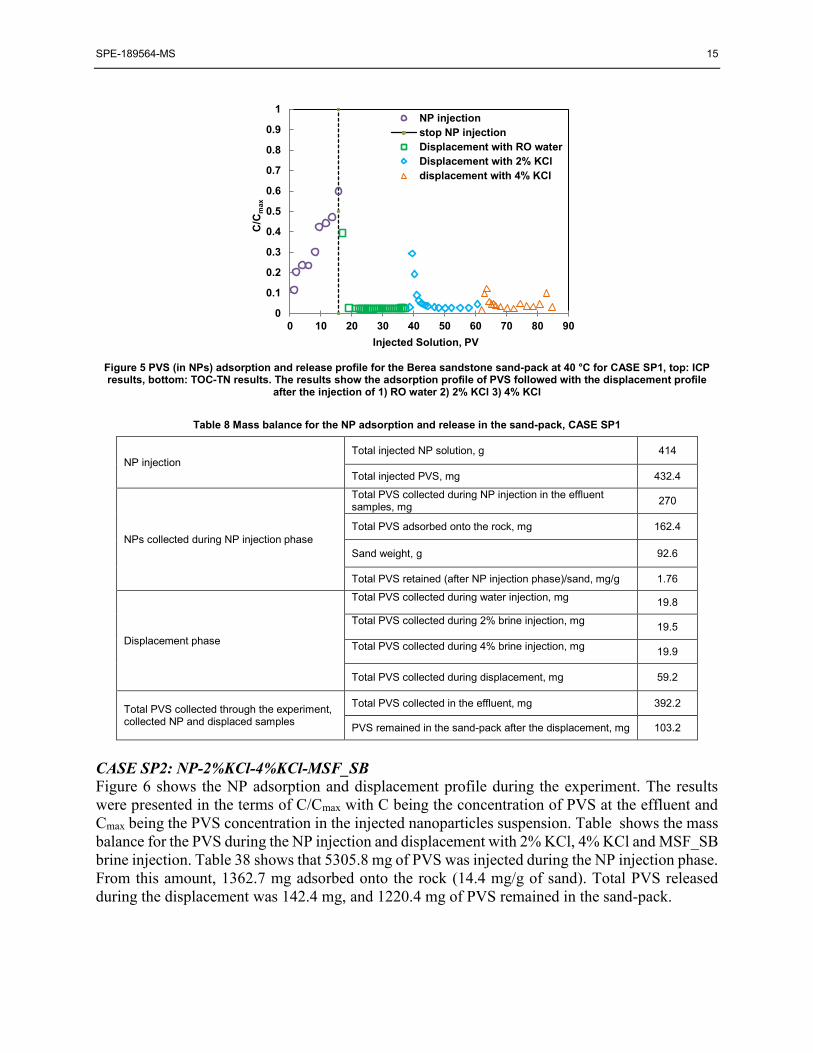
Figure 5 PVS (in NPs) adsorption and release profile for the Berea sandstone sand-pack at 40 °C for CASE SP1, top: ICP results, bottom: TOC-TN results. The results show the adsorption profile of PVS followed with the displacement profile
after the injection of 1) RO water 2) 2% KCl 3) 4% KCl
Table 8 Mass balance for the NP adsorption and release in the sand-pack, CASE SP1
NP injection Total injected NP solution, g 414
Total injected PVS, mg 432.4
NPs collected during NP injection phase
Total PVS collected during NP injection in the effluent samples, mg 270
Total PVS adsorbed onto the rock, mg 162.4
Sand weight, g 92.6
Total PVS retained (after NP injection phase)/sand, mg/g 1.76
Displacement phase
Total PVS collected during water injection, mg 19.8
Total PVS collected during 2% brine injection, mg 19.5
Total PVS collected during 4% brine injection, mg 19.9
Total PVS collected during displacement, mg 59.2
Total PVS collected through the experiment, collected NP and displaced samples
Total PVS collected in the effluent, mg 392.2
PVS remained in the sand-pack after the displacement, mg 103.2
CASE SP2: NP-2%KCl-4%KCl-MSF_SB Figure 6 shows the NP adsorption and displacement profile during the experiment. The results were presented in the terms of C/Cmax with C being the concentration of PVS at the effluent and Cmax being the PVS concentration in the injected nanoparticles suspension. Table shows the mass balance for the PVS during the NP injection and displacement with 2% KCl, 4% KCl and MSF_SB brine injection. Table 38 shows that 5305.8 mg of PVS was injected during the NP injection phase. From this amount, 1362.7 mg adsorbed onto the rock (14.4 mg/g of sand). Total PVS released during the displacement was 142.4 mg, and 1220.4 mg of PVS remained in the sand-pack.
0
0.1
0.2
0.3
0.4
0.5
0.6
0.7
0.8
0.9
1
0 10 20 30 40 50 60 70 80 90
C/C
max
Injected Solution, PV
NP injectionstop NP injectionDisplacement with RO waterDisplacement with 2% KCldisplacement with 4% KCl

SPE-189564-MS 16
Figure 6 PEC-entrapped PVS adsorption and release profile for the Berea sandstone sand-pack at 40 °C for CASE SP2. The
results show the release profile after the injection of 1) 2% KCl 2) 4% KCl 3) MSF_SB 4) MSF_SB injection after 7 days shut-in. The secondary Y axis (right) shows the pH of the effluent samples during the experiment.
Table 9 Mass balance for the NP adsorption and release in the sand-pack, CASE SP2
NP injection Total injected NP solution, g 4731.3
Total injected PVS, mg 5305.8
NPs collected during NP injection phase
Total PVS collected during NP injection in the effluent samples, mg 3943.1
Total PVS adsorbed on the rock, mg 1362.7
Sand weight, g 94.6
Total PVS retained (after NP injection phase)/sand, mg/g 14.4
Displacement phase
Total PVS collected during 2% KCl displacement, mg 81.9
Total PVS collected during 4% KCl displacement, mg 56.2
Total PVS collected during MSF_SB displacement, mg 0.5
Total PVS collected during MSF_SB after 7 days shut in, mg 3.8
Total PVS collected during displacement, mg 142.4
Total PVS collected through the experiment, collected NP and
displaced samples
Total PVS collected in the effluent, mg 4085.4
PVS still retained in the sand-pack, mg 1220.4
NP Adsorption In our previous experiments (CASE SP1), even after the injection of 15.67 PV of nanoparticles, the concentration of PVS in the effluent samples did not reach the injected concentration. In other words, the value of C/Cmax did not reach unity. To elaborate more on this subject, 186.3 PV of NPs was injected in this experiment. Even after the injection of 77.2 PV of nanoparticles, C/Cmax
0
1
2
3
4
5
6
7
8
9
10
11
0
0.1
0.2
0.3
0.4
0.5
0.6
0.7
0.8
0.9
1
0 20 40 60 80 100 120 140 160 180 200 220 240 260 280
pHC/C
max
Injected Solution, PV
NP injectionStop NP InjectionNP displacement with 2% KClNP displacement with 4% KClNP displacement with MSF-SBNP displacement with MSF-SB after sand pack shutdown for 7 dayspH

SPE-189564-MS 17
only reached a value of 0.78. However, when the rate of nanoparticles injection increased to 5 ml/min, C/Cmax reached 0.94. At this flow rate, nanoparticles did not have a long enough residence time to adsorb on the rock in the sand-pack. When the sand-pack was shut in overnight, the value of C/Cmax dropped to 0.4. C/Cmax increased to 0.7-0.75 again when the NP injection was restarted at 0.5 ml/min. These results indicated that nanoparticles absorbed on the rock continuously (probably in the forms of multilayers).
pH of the Effluent Samples Before the injection, the pH of the NPs was ~5.9. After the injection of NPs, the pH of collected samples increased to ~8.5 which was very close to the pH of resident brine (pH=8.8). Therefore, it was hypothesized that the cations released from the sands (Ca2+, Mg2+, etc.) had modified the pH of the effluents. The pH of the effluent decreased when the injection of NPs was continued. At nanoparticle breakthrough, the effluent had a pH of 6.9. The pH of the effluent continued to drop until it reached the pH value of the NPs after the injection of ~60 PV NPs. After the injection of 2% KCl, pH increased to 6.9-7 and stayed constant during the 4% KCl and MSF_SB injections. The initial pH of 2% and 4% KCl and MSF_SB was 6, 5.8 and 6.3, respectively before the injection.
Ionic Shock The results of this experiment confirmed that the ionic shock during the NP displacement enhanced the PVS release from the NP composition. After the injection of 2% KCl, the PVS concentration in the effluent samples showed a peak followed by a decaying tail. A switch to a 4% KCl solution caused a second peak in the release profile that decayed shortly after. However, using the MSF_SB did not cause the PVS release. Table 10 compares the ionic strength of the brine solutions used in this research. The results indicated that MSF_SB had slightly lower ionic strength than the 4% KCl (I0.4%KCl = 0.56, IMSF_SB = 0.49). This again, confirmed that an increase in the ionic strength was required for the release of PVS when the release profile decayed. The results also showed that even after shut-in the sand-pack for a week, a very small amount of PVS was released during the MSF_SB injection. This confirmed that NPs adsorbed on the rock strongly and adsorption did not change over time. The results also indicated the need for a change in the environmental conditions to further release the PVS from the NPs.
Table 10 Ionic Strength of the brines used in this research
Brine Ionic strength, mol/kg (H2O)
2% KCl 0.27
MSF_SB 0.49
4% KCl 0.53
Cationic brine 0.56
6% KCl 0.80
7% KCl 0.94
CASE SP3: NP-MSF_SB-2%KCl-4%KCl
Using the Isco pump, 77.9 PV of NPs was injected into the sand-pack and NP breakthrough was observed after ~23.4 PV. shows the NP adsorption and displacement profile during the whole experiment. Table shows the mass balance for the PVS during the NP injection and displacement with MSF_SB, 2% KCl, and 4% KCl brine injection. As expected, after injection of MSF_SB, PVS release showed a peak

SPE-189564-MS 18
followed by a decaying tail. Like the previous example (CASE SP2), the injection of MSF_SB followed by sand-pack shut-in did not cause any release of the PVS. Even the injection of the 2% KCl did not enhance the PVS release. From Table , 2% KCl solution has a lower ionic strength than the MSF_SB (I 0.2% KC l = 0.27, IMSF_SB = 0.49). Therefore, it was expected that there would be no release of the PVS. When the 2% KCl solution was replaced with 4% KCl solution, a peak in PVS release was observed as predicted.
Table shows that 1576.8 mg of PVS was injected during the NP injection phase and 725.6 mg of injected PVS adsorbed onto the rock (7.7 mg/g of sand). Total PVS released during the displacement was 162.3 mg and 563.4 mg of PVS remained in the sand-pack.
Figure 7 PEC-entrapped PVS adsorption and release profile for the Berea sandstone sand-pack at 40 °C for CASE SP3. The
results show the release profile after injection of 1) MSF_SB 2) MSF_SB after 1 day shut-in 3) 2% KCl 4) 4% KCl.
Table 11 Mass balance for the NP adsorption and release in the sand-pack, CASE SP3
NP injection Total injected NP solution, ml 1829.6
Total injected PVS, mg 1576.8
NPs collected during NP injection phase
Total PVS collected in NPs, mg 851.2
Total PVS retained, mg 725.6
Sand weight, g 94.2
Total PVS retained (after NP injection phase)/sand, mg/g 7.7
Displacement phase
Total PVS collected during MSF_SB displacement, mg 111.7
Total PVS collected during MSF_SB displacement after 1 day shut in, mg 5.92
Total PVS collected during 2% KCl displacement, mg 0.27
Total PVS collected during 4% KCl, mg 44.4
Total PVS collected during displacement, mg 162.3
Total PVS collected through the experiment (from
collected NP and displaced samples)
Total PVS collected, mg 1013.4
PVS retained in the sand-pack, mg 563.4
0
0.1
0.2
0.3
0.4
0.5
0.6
0.7
0.8
0.9
1
0 20 40 60 80 100 120 140 160 180 200
C/C
max
Injected Solution, PV
Injected NPNP displaced with 2% KClNP displaced with 4% KClNP injection stoppedNP displaced with MSF-KUNP displaced with MSF-KU after 24 h shut in

SPE-189564-MS 19
Mechanism of Ionic Shock on PVS Release This experiment was designed to investigate the possible mechanisms which boosted the release of PVS when an ionic shock was applied to the system. To do this, positively charged nanoparticles were prepared and were mixed with different concentrations of KCl. All the resulting samples were centrifuged (99 min, rate of 14000 g, 9 °C) and the concentration of sulfur in the supernatant was measured to calculate the entrapment efficiency of PVS.
Figure 8 shows the entrapment efficiency of samples in the presence of the different concentrations of KCl. When the KCl concentration increased, the entrapment efficiency of the PVS in the NPs increased until some point (~1% KCl) (phase I) and then started to drop (phase II). This suggested that at low KCl concentration, the presence of the salts favored the formation of the nanoparticles while at higher concentration of KCl, the formation of the nanoparticles was inhibited.
Figure 8 Entrapment efficiency of PVS in presence of different concentration of KCl, the average of three independent
samples is shown here and the error bar represents the standard deviation of 3 replicate samples
Similar results have been reported for the effect of salt concentration on the formation of
nanoparticles). De Vasconcelos et al. (2006) studied the formation of poly(methacrylic acid) and chitosan PEC systems in the presence of different concentrations of NaCl. They observed that at low concentrations of NaCl, the presence of salt supported the formation of the PECs while the formation of the complexes was disrupted at higher salt concentrations. They suggested that the presence of salt at a low ionic strength can decrease the repulsion within the polyelectrolyte chains and therefore decrease the dimension of the polyelectrolyte molecules. A decrease in the dimension of the polyelectrolytes causes an increase in the surface charge density on the polyelectrolyte which enhances the formation of PECs. At higher NaCl concentration, NaCl may screen the electrostatic interactions between the opposite charges of polyelectrolytes and inhibit the formation of PECs.
This can explain the effect of the ionic shock observed during the sand-pack studies. When nanoparticles were displaced with a brine with high ionic strength, the presence of the salt would cause some of the nanoparticles to dissociate. This would result in some of the PVS leaving the nanoparticles and becoming available in the solution. When a brine with higher ionic strength was applied, it caused a further decomposition of the nanoparticle structure. This would also explain why no PVS was released when a brine solution with lower ionic strength was injected after the
SPE-189564-MS 20
injection of a higher ionic strength solution. Since the presence of a lower ionic solution would not produce further decomposition of the nanoparticles structure, no more PVS would leave the nanoparticles. Dynamic Tube Blocking Test Five scenarios of dynamic blocking test were investigated in this study.
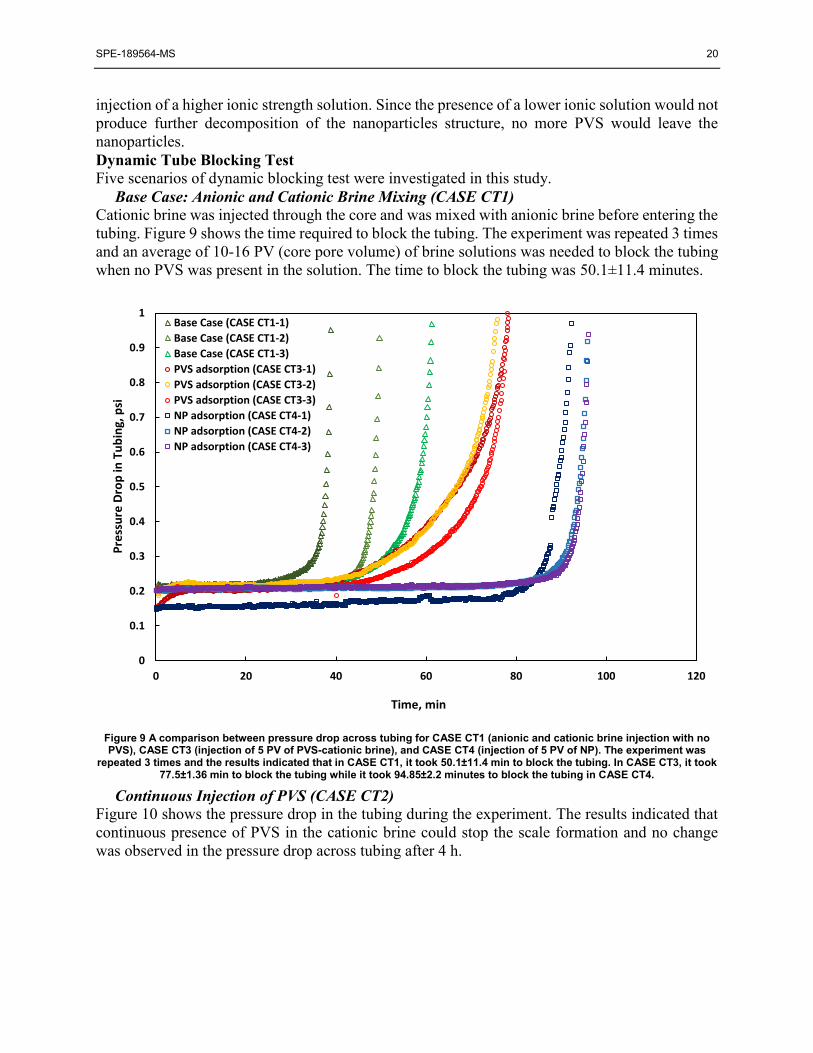
Base Case: Anionic and Cationic Brine Mixing (CASE CT1) Cationic brine was injected through the core and was mixed with anionic brine before entering the tubing. Figure 9 shows the time required to block the tubing. The experiment was repeated 3 times and an average of 10-16 PV (core pore volume) of brine solutions was needed to block the tubing when no PVS was present in the solution. The time to block the tubing was 50.1±11.4 minutes.
Figure 9 A comparison between pressure drop across tubing for CASE CT1 (anionic and cationic brine injection with no PVS), CASE CT3 (injection of 5 PV of PVS-cationic brine), and CASE CT4 (injection of 5 PV of NP). The experiment was
repeated 3 times and the results indicated that in CASE CT1, it took 50.1±11.4 min to block the tubing. In CASE CT3, it took 77.5±1.36 min to block the tubing while it took 94.85±2.2 minutes to block the tubing in CASE CT4.
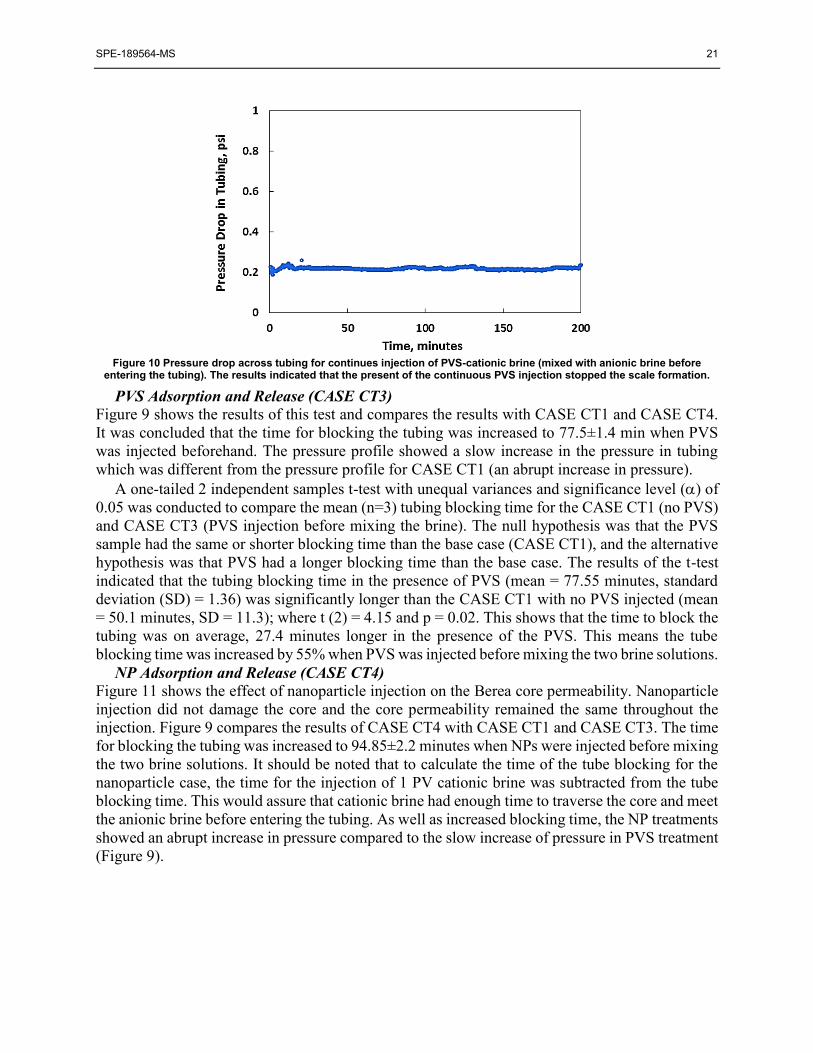
Continuous Injection of PVS (CASE CT2) Figure 10 shows the pressure drop in the tubing during the experiment. The results indicated that continuous presence of PVS in the cationic brine could stop the scale formation and no change was observed in the pressure drop across tubing after 4 h.
0
0.1
0.2
0.3
0.4
0.5
0.6
0.7
0.8
0.9
1
0 20 40 60 80 100 120
Pre
ssu
re D
rop
in T
ub
ing,
psi
Time, min
Base Case (CASE CT1-1)
Base Case (CASE CT1-2)
Base Case (CASE CT1-3)
PVS adsorption (CASE CT3-1)
PVS adsorption (CASE CT3-2)
PVS adsorption (CASE CT3-3)
NP adsorption (CASE CT4-1)
NP adsorption (CASE CT4-2)
NP adsorption (CASE CT4-3)
SPE-189564-MS 21
Figure 10 Pressure drop across tubing for continues injection of PVS-cationic brine (mixed with anionic brine before
entering the tubing). The results indicated that the present of the continuous PVS injection stopped the scale formation.
PVS Adsorption and Release (CASE CT3) Figure 9 shows the results of this test and compares the results with CASE CT1 and CASE CT4. It was concluded that the time for blocking the tubing was increased to 77.5±1.4 min when PVS was injected beforehand. The pressure profile showed a slow increase in the pressure in tubing which was different from the pressure profile for CASE CT1 (an abrupt increase in pressure).
A one-tailed 2 independent samples t-test with unequal variances and significance level () of 0.05 was conducted to compare the mean (n=3) tubing blocking time for the CASE CT1 (no PVS) and CASE CT3 (PVS injection before mixing the brine). The null hypothesis was that the PVS sample had the same or shorter blocking time than the base case (CASE CT1), and the alternative hypothesis was that PVS had a longer blocking time than the base case. The results of the t-test indicated that the tubing blocking time in the presence of PVS (mean = 77.55 minutes, standard deviation (SD) = 1.36) was significantly longer than the CASE CT1 with no PVS injected (mean = 50.1 minutes, SD = 11.3); where t (2) = 4.15 and p = 0.02. This shows that the time to block the tubing was on average, 27.4 minutes longer in the presence of the PVS. This means the tube blocking time was increased by 55% when PVS was injected before mixing the two brine solutions.
NP Adsorption and Release (CASE CT4) Figure 11 shows the effect of nanoparticle injection on the Berea core permeability. Nanoparticle injection did not damage the core and the core permeability remained the same throughout the injection. Figure 9 compares the results of CASE CT4 with CASE CT1 and CASE CT3. The time for blocking the tubing was increased to 94.85±2.2 minutes when NPs were injected before mixing the two brine solutions. It should be noted that to calculate the time of the tube blocking for the nanoparticle case, the time for the injection of 1 PV cationic brine was subtracted from the tube blocking time. This would assure that cationic brine had enough time to traverse the core and meet the anionic brine before entering the tubing. As well as increased blocking time, the NP treatments showed an abrupt increase in pressure compared to the slow increase of pressure in PVS treatment (Figure 9).

SPE-189564-MS 22
Figure 11 Effect of nanoparticles injection on the core permeability and the tubing pressure drop. The results indicated
that the nanoparticles injection did not damage the core permeability
A one-tailed 2 independent samples t-test was performed to compare the efficiency of the NPs and PVS. The null hypothesis was that the NP sample had the same or shorter blocking time than the PVS (CASE CT3) and therefore the tubing would block at the same time or shorter. The alternative hypothesis was that NPs had a longer treatment lifetime than the PVS and therefore, it would take longer for the tubing to block when NPs were injected into the core. The t-test showed that the time to block the tubing (mean = 94.85 minutes, SD = 2.22) was significantly longer in the presence of the NPs than the time to block the tubing in the presence of PVS (mean = 77.55 minutes, standard deviation (SD) = 1.36); where t (3) = 11.50 and p = 0.0007. The time to block the tubing was, on average, 17.3 min longer in the presence of the NPs than the unentrapped PVS. Therefore, entrapping the PVS in NPs increased the treatment lifetime by 22 % compared to unentrapped PVS.
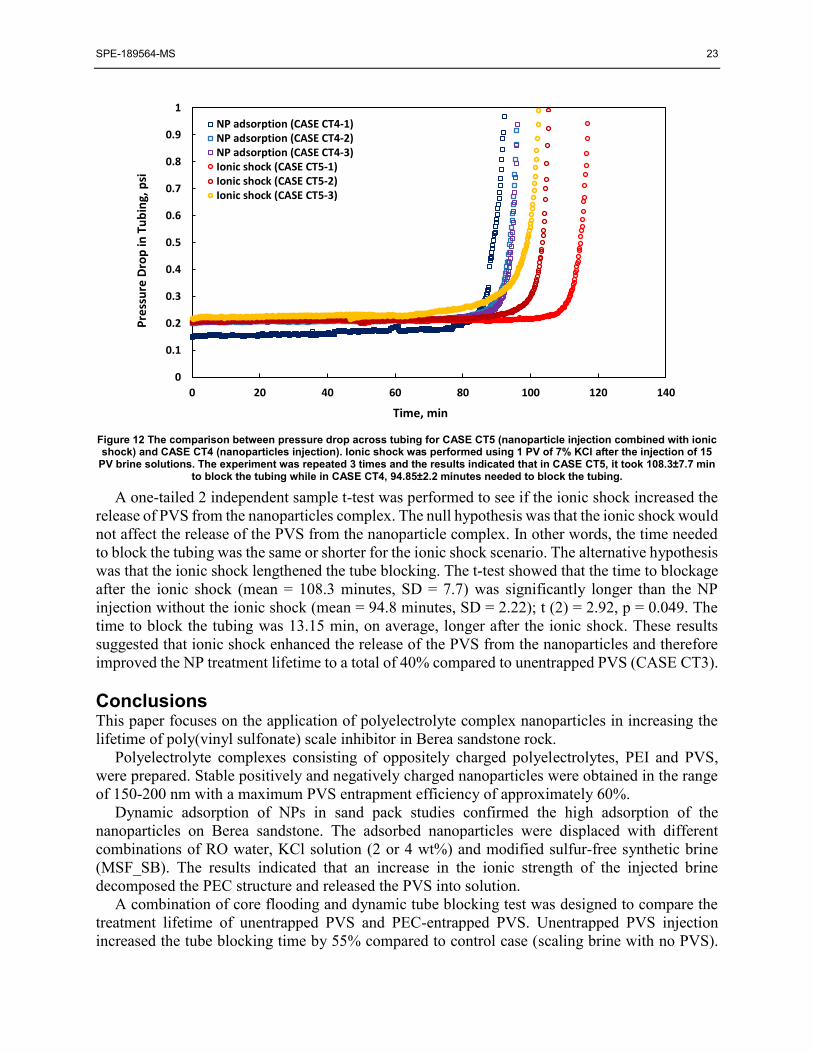
NP Adsorption and Release Combined with Ionic Shock (CASE CT5) Figure 12 compares the efficiency of the nanoparticles with and without the ionic shock. The time taken to block the tubing increased to 108.3±7.7 minutes when ionic shock was applied to the NPs. To compensate for the time needed for the cationic brine to traverse the core and reach the point of mixing with anionic brine, after the nanoparticles and KCl injection, the time needed to inject 2 PV of brine was subtracted from the tube blocking time. To do this, time was adjusted once after the injection of the nanoparticles and later after the injection of KCl solution.
0
50
100
150
200
250
300
0
0.05
0.1
0.15
0.2
0.25
0.3
0 1 2 3 4 5
Co
re P
erm
eab
ility
, m
D
Pre
ssu
re D
rop
in T
ub
ing,
psi
Injected NPs, PV
Pressure Drop in Tubing During NPs Injection
Core Permeability During NPs Injection
SPE-189564-MS 23
Figure 12 The comparison between pressure drop across tubing for CASE CT5 (nanoparticle injection combined with ionic shock) and CASE CT4 (nanoparticles injection). Ionic shock was performed using 1 PV of 7% KCl after the injection of 15
PV brine solutions. The experiment was repeated 3 times and the results indicated that in CASE CT5, it took 108.3±7.7 min to block the tubing while in CASE CT4, 94.85±2.2 minutes needed to block the tubing.
A one-tailed 2 independent sample t-test was performed to see if the ionic shock increased the release of PVS from the nanoparticles complex. The null hypothesis was that the ionic shock would not affect the release of the PVS from the nanoparticle complex. In other words, the time needed to block the tubing was the same or shorter for the ionic shock scenario. The alternative hypothesis was that the ionic shock lengthened the tube blocking. The t-test showed that the time to blockage after the ionic shock (mean = 108.3 minutes, SD = 7.7) was significantly longer than the NP injection without the ionic shock (mean = 94.8 minutes, SD = 2.22); t (2) = 2.92, p = 0.049. The time to block the tubing was 13.15 min, on average, longer after the ionic shock. These results suggested that ionic shock enhanced the release of the PVS from the nanoparticles and therefore improved the NP treatment lifetime to a total of 40% compared to unentrapped PVS (CASE CT3).
Conclusions This paper focuses on the application of polyelectrolyte complex nanoparticles in increasing the lifetime of poly(vinyl sulfonate) scale inhibitor in Berea sandstone rock.
Polyelectrolyte complexes consisting of oppositely charged polyelectrolytes, PEI and PVS, were prepared. Stable positively and negatively charged nanoparticles were obtained in the range of 150-200 nm with a maximum PVS entrapment efficiency of approximately 60%.
Dynamic adsorption of NPs in sand pack studies confirmed the high adsorption of the nanoparticles on Berea sandstone. The adsorbed nanoparticles were displaced with different combinations of RO water, KCl solution (2 or 4 wt%) and modified sulfur-free synthetic brine (MSF_SB). The results indicated that an increase in the ionic strength of the injected brine decomposed the PEC structure and released the PVS into solution.
A combination of core flooding and dynamic tube blocking test was designed to compare the treatment lifetime of unentrapped PVS and PEC-entrapped PVS. Unentrapped PVS injection increased the tube blocking time by 55% compared to control case (scaling brine with no PVS).
0
0.1
0.2
0.3
0.4
0.5
0.6
0.7
0.8
0.9
1
0 20 40 60 80 100 120 140
Pre
ssu
re D
rop
in T
ub
ing,
psi
Time, min
NP adsorption (CASE CT4-1)NP adsorption (CASE CT4-2)NP adsorption (CASE CT4-3)Ionic shock (CASE CT5-1)Ionic shock (CASE CT5-2)Ionic shock (CASE CT5-3)
SPE-189564-MS 24
PVS entrapment in NPs increased the treatment lifetime by 22% compared to the unentrapped PVS, for an overall increase of 77% compared to the control case. The results also showed that nanoparticle injection did not damage the core and permeability remained the same after the NP injection.
It was confirmed that the application of a pulse of increased ionic strength brine caused the release of more PVS from the NPs. The ionic shock increased the treatment lifetime further to a total of 40% compared to unentrapped PVS, or 95% compared to the control case.
The extended treatment lifetime provided by this research can be applied to reduce the frequency of squeeze treatments required and therefore reduce the associated operational costs and amount of deferred oil during treatment. Acknowledgements This work was partially funded by the National Science Foundation EPSCoR Track Research Infrastructure Improvement Program: Track-2 Focused EPSCoR Collaboration award (OIA-1632892).
The authors would like to thank Prof. Belinda Sturm from Environmental Engineering department and Prof. Susan Williams from the Chemical and Petroleum Engineering department at the University of Kansas for their constructive comments and providing us with their lab equipment. We would also like to thank Mr. Scott Ramskill from the Tertiary Oil Recovery Program (TORP) at the University of Kansas for all his assistance with construction and operating laboratory equipment and procedures. References Bazin, B., Kohler, N., and Zaitoun, A. 2005. Some Insights Into the Tube-Blocking-Test Method To Evaluate the Efficiency of Mineral Scale Inhibitors. Presented at the SPE Annual Technical Conference and Exhibition, Dallas, Texas, 9-12 October. SPE-96560-MS. https://doi.org/10.2118/96560-MS. Becker, J. R. 1998. Corrosion and scale handbook, first edition. Tulsa, Oklahama: PennWell. Berkland, C., Cordova, M., Liang, J.-T. et al. 2008. Polyelectrolyte complexes for oil and gas applications. US Patent No. US20080058229 A1. Carlberg, B. 1987. Scale inhibitor precipitation squeeze for non-carbonate reservoirs. Presented at the SPE Production Technology Symposium, Lubbock, Texas, 16-17 November. SPE-17008-MS. https://doi.org/10.2118/17008-MS. Cordova, M., Cheng, M., Trejo, J. et al. 2008. Delayed HPAM gelation via transient sequestration of chromium in polyelectrolyte complex nanoparticles. Macromolecules 41(12): 4398-4404. https://doi.org/10.1021/ma800211d. Crabtree, M., Eslinger, D., Fletcher, P. et al. 1999. Fighting scale—removal and prevention. Oilfield Review 11(3): 30-45. Emmons, D. H. 1987. Low molecular weight polyvinyl sulfonate for low pH barium sulfate scale control. US patent No. US4710303 A. Falk, D. O., Dormish, F. L., Beazley, P. M. et al. 1992. Polyvinyl sulfonate scale inhibitor U.S. Patent No. US5092404 A. Frenier, W. W., and Ziauddin, M. 2008. Formation, removal, and inhibition of inorganic scale in the oilfield environment, first edition. Richardson, Texas: Society of Petroleum Engineers. Gill, J. S. 1996. Development of scale inhibitors. Presented at the NACE conference on CORROSION, Denver, Colorado, 24-29 March. NACE-96229. Graham, G., Collins, I., Stalker, R. et al. 2002. The Importance of Appropriate Laboratory Procedures for the Determination of Scale Inhibitor Performance. Presented at the International Symposium on Oilfield Scale, Aberdeen, United Kingdom, 30-31 January. SPE-74679-MS. https://doi.org/10.2118/74679-MS. Hann, W. M., Robertson, S. T., and Weinstein, B. 1997. Method for metal sulfate scale control in harsh oilfield conditions. U.S. Patent No. US5755972 A. Hughes, R. V., and Pfister, R. J. 1947. Advantages of brines in secondary recovery of petroleum by water-flooding. Transactions of the AIME 170(01): 187-201. SPE-947187-G. https://doi.org/10.2118/947187-G.

SPE-189564-MS 25
Jordan, M. 2004. Scale Control within North Sea Chalk/Limestone Reservoirs: The Challenge of Understanding and Optimizing Chemical Placement Methods and Retention Mechanism: Laboratory to Field. Presented at the NACE conference on CORROSION, New Orleans, Louisiana, 28 March-1 April. NACE-04389. Kelland, M. A. 2014. Production chemicals for the oil and gas industry, first edition. Boca Raton: Florida: CRC press. NACE Standard test method. 2005. Dynamic Scale Inhibitor Evaluation Apparatus and Procedures in Oil and Gas Production. Publication 31105, NACE International, Houston, Texas. Rosa, K. R. S. A. d., Bezerra, M. C. M., Fontes, R. A. et al. 2016. Study of Thermal Stability of Scale Inhibitors and its Impact on Processing Plants. Presented at the SPE International Oilfield Scale Conference and Exhibition. Aberdeen, Scotland, UK, 11-12 May. SPE-179907-MS. https://doi.org/10.2118/179907-MS. Sarig, S. 1974. Crystal habit modification by water soluble polymers. Journal of crystal growth 24-25: 338-341. https://doi.org/10.1016/0022-0248(74)90331-5. Sarig, S., and Tartakovsky, F. 1974. Inhibition of Strontium Sulfate Precipitation by Soluble Polymers. Israel Journal of Chemistry 12(5): 905-910. https://doi.org/10.1002/ijch.197400082. Schalge, A., and Dormish, F. 1989. The Evaluation of Scale Inhibitors for High BaSO4 Scaling Potential Using a New Tube/Filter Blocking Apparatus. Presented at the SPE International Symposium on Oilfield Chemistry, Houston, Texas, 8-10 February. SPE-18490-MS. https://doi.org/10.2118/18490-MS. Tiyaboonchai, W. 2002. Development of a New Nanoparticle Delivery Vehicle Based on an Aqueous Polymer System: Polyethylenimine and Dextran Sulfate. PhD dissertation, University of Kansas, Lawrence, Kansas. Tiyaboonchai, W., Woiszwillo, J., and Middaugh, C. R. 2003. Formulation and characterization of DNA–polyethylenimine–dextran sulfate nanoparticles. European journal of pharmaceutical sciences 19(4): 191-202. https://doi.org/10.1016/S0928-0987(03)00102-7. Tiyaboonchai, W., Woiszwillo, J., Sims, R. C. et al. 2003. Insulin containing polyethylenimine–dextran sulfate nanoparticles. International journal of pharmaceutics 255(1): 139-151. https://doi.org/10.1016/S0378-5173(03)00055-3. van der Leeden, M. C., van Rosmalen, G. M. 1990. Inhibition of barium sulfate deposition by polycarboxylates of various molecular structures. SPE production engineering 5(1): 70-76. SPE-17914-PA. https://doi.org/10.2118/17914-PA. Veisi, M. 2017. Application of Polyelectrolyte Complex Nanoparticles in Increasing the Lifetime of Poly (Vinyl Sulfonate) Scale Inhibitor in Berea Sandstone Rock. PhD dissertation, University of Kansas, Lawrence, Kansas (January 2017). Weijnen, M., and Van Rosmalen, G. 1985. The influence of various polyelectrolytes on the precipitation of gypsum. Desalination 54: 239-261. https://doi.org/10.1016/0011-9164(85)80021-7. Zhang, P., Shen, D., Kan, A. T. et al. 2016. Phosphino-polycarboxylic acid modified inhibitor nanomaterial for oilfield scale control: transport and inhibitor return in formation media. RSC Advances 6(64): 59195-59205. https://doi.org/10.1039/C6RA09973D.

SPE-189564-MS 26
Appendices
a Figure A--1. Calibration curves used in the nanoparticles adsorption and release studies (top left) PVS calibration curve with ICP (top right) Entrapped PVS in NP calibration curve with ICP (middle left) PVS calibration curve with TOC (middle
right) PEI calibration curve with TOC (bottom left) PEI calibration curve with TN.